Ageing effects of Lithium-ion batteries7 Ageing effects at the anode Intercalation of solvent/...
20
Towards competitive European batteries GC.NMP.2013-1 Grant. 608936 2020 1 Alexander Warnecke Workshop EPE Conference – Geneva (Switzerland) 9 th of September 2015 Ageing effects of Lithium-ion batteries
Transcript of Ageing effects of Lithium-ion batteries7 Ageing effects at the anode Intercalation of solvent/...

Towards competitive European batteries
GC.NMP.2013-1 Grant. 608936 2020
1
Alexander Warnecke Workshop EPE Conference – Geneva (Switzerland) 9th of September 2015
Ageing effects of Lithium-ion batteries

Lithium-ion batteries are used in many mobile applications but will be used in electric vehicles
Consumer articles and portable electronics - Service life is short < 3 years - Value of battery small compared to other components
(< 5% of total value) Electric vehicles
- Service life more than 8 years - Battery is most expensive component in the car
Is our operation strategy influencing the lifetime
- Operation limits too high - Does the power electronic influences the lifetime
2
Motivation
Source: batteries2020.eu
Source: Fotolia

INDEX
1. Ageing effects
2. How to predict ageing?
3. Ageing tests
4. Ageing examples
5. Influence of ripples
4
Ageing effects
Ageing takes place at all components of a battery
Housing - Corrosion of aluminium in pouch foil by
demages in the PE layer - Leaking plasitc seals by loss of softener over
time Separator
- Blocking of pores by active material
Negaive electrode, positive electrode and electrolyte
Source: Darcy, NASA-JSC, AABC 2012
Source: Darcy, NASA-JSC, AABC 2012

Peeling of graphite, cracking (gas creation, co-intercalation of solvent)
Corrosion of electrolyte
Growth of SEI layer Conversion of SEI/stabilisation/growth
SEI dissolution/accumulation Positive/negative interaction
Accumulation of metallic lithium (plating) Growth of dendrites
5
Ageing effects at the anode
After: Vetter, JPS, 147, 269 (2005)

Stability window of organic elctrolytes responsible for ageing effects at anode
Standard anode is far out of stability window
- Formation of SEI on the surface
When high voltage cathodes
(above 4.5 V) are used, electrolyte is also not stable
6
Ageing effects of the elctrolyte
5 4 3 2 1 0
LiCoO2
LiNiO2
LiMn2O4
MnO2
V2O5
V6O13
TiS2
MoO2
Li Metal
Graphite Coke Li6Fe2O3
+
-

7
Ageing effects at the anode
Intercalation of solvent/ peeling of graphite/cracking results in loss of capacity (loss of active material, loss of lithium)
accelerated if: Overcharging („very high SoC“)
Dissolution of electrolyte (cathodic oxidation / anodic reduction) / dissolution of binder results in: loss of capacity, loss of power capability
accelerated by: high temperature, high state of charge (SOC)
Growth of SEI/ Change of surface porosity results in: growth of impedance, loss of power capability
accelerated by: high current, high cycle depths (DOD)
Decrease of active surface (continuous growth of SEI) results in: growth of impedance, loss of power capability
accelerate by: high temperature, high state of charge (SOC)
After: Vetter, JPS, 147, 269 (2005)
8
Ageing effects at the anode
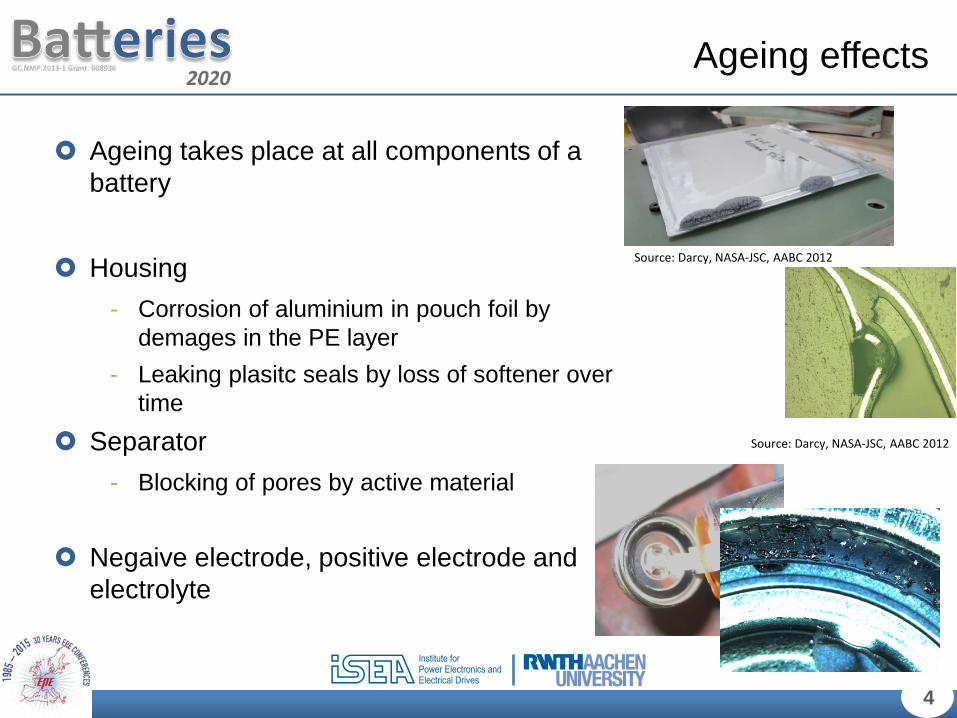
Deposition of metallic lithium/ formation of SEI results in: Loss of capacity, loss of power capability (loss of lithium)
accelerated by: low temperature, high current, bad design of cells
Loss of contact active mass particles because of volume change results in: Loss of capacity
accelerated by: high current, high depth of cycling (DOD)
Corrosion of conductor results in: Loss of power capability (overvoltage),growth of
impedance
accelerated by: low SOC, deep discharge

9
Ageing effects at the cathode
Source: J. Vetter et al. / Journal of Power Sources 147 (2005) 269–281

10
Ageing effects at the cathode
Source: J. Vetter et al. / Journal of Power Sources 147 (2005) 269–281
Structural disordering Results in loss of storage places for lithium
accelerated if: stored (research in progress)
Migration of soluble species results in: loss of capacity by firm formation on anode
accelerated by: high temperature, high state of charge (SOC)
Electrolyte decomposition Results in loss of power capability
accelerated by: high temperature, high state of charge (SOC)
Corrosion of conductor results in: Loss of power capability (overvoltage),
growth of impedance
accelerated by: low SOC, deep discharge

11
How to predict ageing?
Prediction of ageing can be done by detailed understanding of all components and their reactions
- At the moment impossible much more research
- Approximation by physico chemical models
Accelerated ageing of the cell at critical points and see the capacity and resistance changes
- Storing cells for long time - Cycling cells with syntetic load profiles - Mayor disadvantage: Costs and testing time
Solution
Active material
SEI
12
Accelerated ageing tests
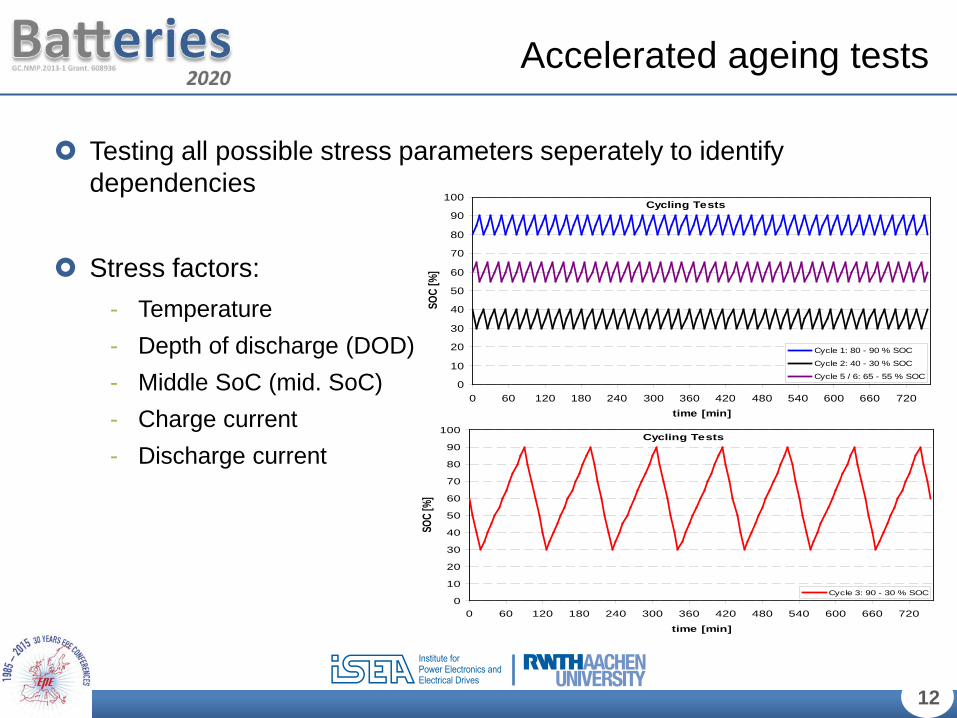
Testing all possible stress parameters seperately to identify dependencies
Stress factors: - Temperature - Depth of discharge (DOD) - Middle SoC (mid. SoC) - Charge current - Discharge current
Cycling Tests
0
10
20
30
40
50
60
70
80
90
100
0 60 120 180 240 300 360 420 480 540 600 660 720
time [min]
SOC
[%]
Cycle 3: 90 - 30 % SOC
Cycling Tests
0
10
20
30
40
50
60
70
80
90
100
0 60 120 180 240 300 360 420 480 540 600 660 720time [min]
SOC
[%]
Cycle 1: 80 - 90 % SOC
Cycle 2: 40 - 30 % SOC
Cycle 5 / 6: 65 - 55 % SOC
13
Accelerated ageing tests
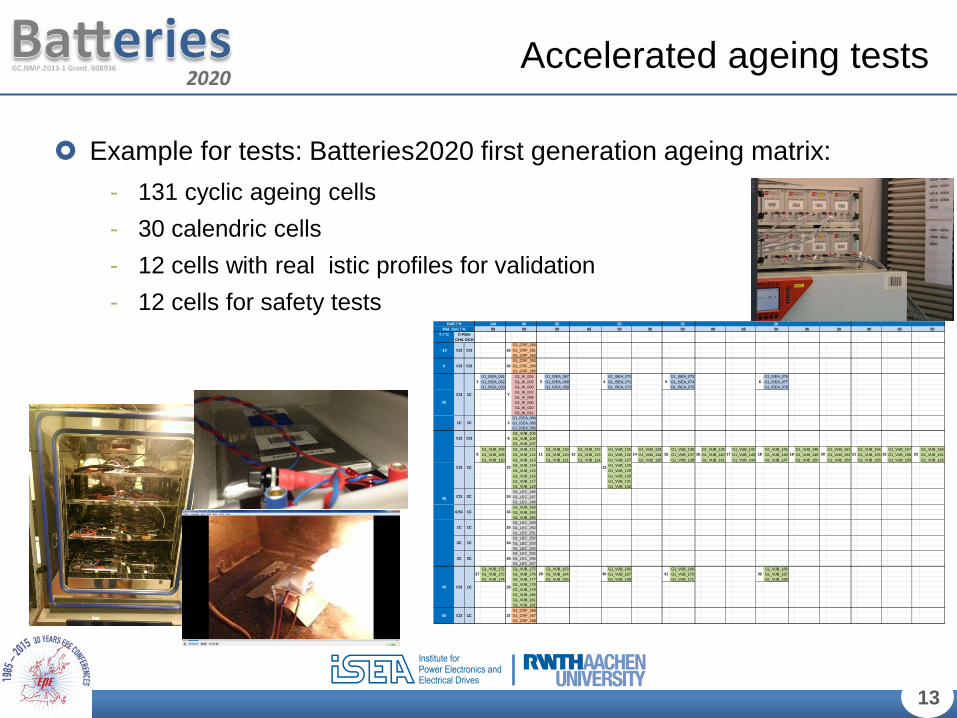
Example for tests: Batteries2020 first generation ageing matrix: - 131 cyclic ageing cells - 30 calendric cells - 12 cells with real istic profiles for validation - 12 cells for safety tests
100 80 65 3550 50 50 65 50 35 50 80 65 50 35 20 80 65 50
T / °CCHA DCH
G1_CRF_260G1_CRF_261G1_CRF_262G1_CRF_263G1_CRF_264G1_CRF_265
G1_ISEA_061 G1_IK_004 G1_ISEA_067 G1_ISEA_070 G1_ISEA_073 G1_ISEA_076G1_ISEA_062 G1_IK_005 G1_ISEA_068 G1_ISEA_071 G1_ISEA_074 G1_ISEA_077G1_ISEA_063 G1_IK_006 G1_ISEA_069 G1_ISEA_072 G1_ISEA_075 G1_ISEA_078
G1_IK_007G1_IK_008G1_IK_009G1_IK_010G1_IK_011
G1_ISEA_064G1_ISEA_065G1_ISEA_066G1_VUB_105G1_VUB_106G1_VUB_107
G1_VUB_108 G1_VUB_111 G1_VUB_119 G1_VUB_122 G1_VUB_125 G1_VUB_133 G1_VUB_136 G1_VUB_139 G1_VUB_142 G1_VUB_145 G1_VUB_148 G1_VUB_151 G1_VUB_154 G1_VUB_157 G1_VUB_160G1_VUB_109 G1_VUB_112 G1_VUB_120 G1_VUB_123 G1_VUB_126 G1_VUB_134 G1_VUB_137 G1_VUB_140 G1_VUB_143 G1_VUB_146 G1_VUB_149 G1_VUB_152 G1_VUB_155 G1_VUB_158 G1_VUB_161G1_VUB_110 G1_VUB_113 G1_VUB_121 G1_VUB_124 G1_VUB_127 G1_VUB_135 G1_VUB_138 G1_VUB_141 G1_VUB_144 G1_VUB_147 G1_VUB_150 G1_VUB_153 G1_VUB_156 G1_VUB_159 G1_VUB_162
G1_VUB_114 G1_VUB_128G1_VUB_115 G1_VUB_129G1_VUB_116 G1_VUB_130G1_VUB_117 G1_VUB_131G1_VUB_118 G1_VUB_132G1_LEC_246G1_LEC_247G1_LEC_248G1_VUB_183G1_VUB_184G1_VUB_185G1_LEC_249G1_LEC_250G1_LEC_251G1_LEC_252G1_LEC_253G1_LEC_254G1_LEC_255G1_LEC_256G1_LEC_257
G1_VUB_172 G1_VUB_175 G1_VUB_163 G1_VUB_166 G1_VUB_169 G1_VUB_186G1_VUB_173 G1_VUB_176 G1_VUB_164 G1_VUB_167 G1_VUB_170 G1_VUB_187G1_VUB_174 G1_VUB_177 G1_VUB_165 G1_VUB_168 G1_VUB_171 G1_VUB_188
G1_VUB_178G1_VUB_179G1_VUB_180G1_VUB_181G1_VUB_182G1_CRF_266G1_CRF_267G1_CRF_268
27
37
24
33
25
34
26
32313029
28
13
14 15 16 232221201918179
8
10
11 12
1
35
36
7
4 65
45 C/3 1C
1C 1C
35
2C 2C
0.5C 1C
C/3 2C
20Mid. SoC / %
DoD / % 50
3
C/3 C/3
C/3 1C
25
2
50
C-Rate
1C 1C
C/3 C/3
C/3 1C
2C 1C
C/3 1C
0 C/3 C/3
-10
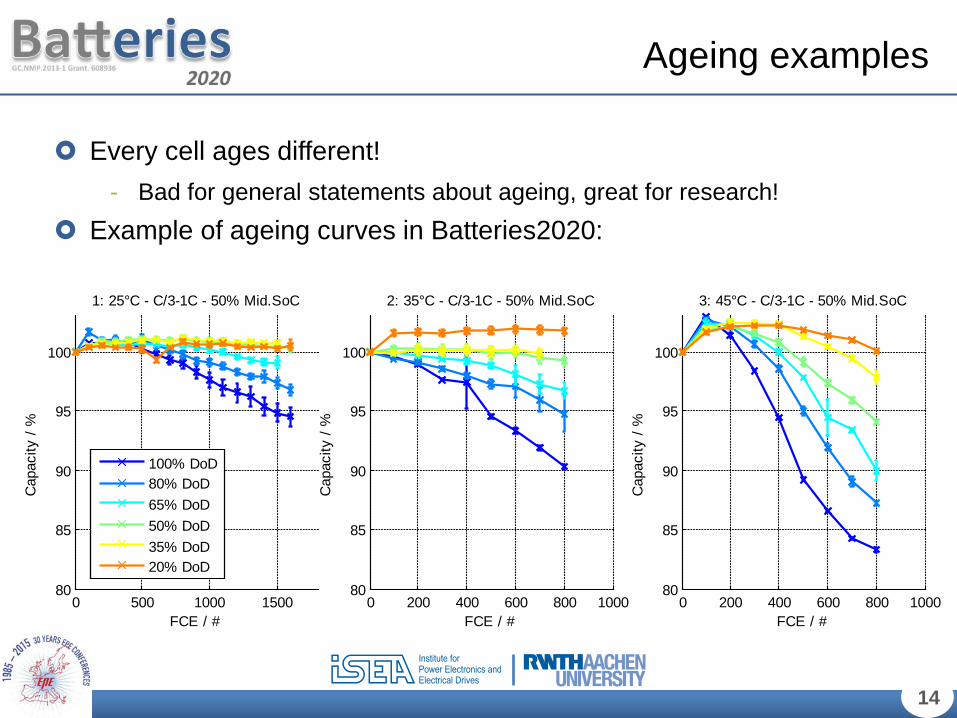
Every cell ages different! - Bad for general statements about ageing, great for research!
Example of ageing curves in Batteries2020:
14
Ageing examples
0 200 400 600 800 100080
85
90
95
100
FCE / #C
apac
ity /
%
3: 45°C - C/3-1C - 50% Mid.SoC
0 500 1000 150080
85
90
95
100
FCE / #
Cap
acity
/ %
1: 25°C - C/3-1C - 50% Mid.SoC
100% DoD80% DoD65% DoD50% DoD35% DoD20% DoD
0 200 400 600 800 100080
85
90
95
100
FCE / #
Cap
acity
/ %
2: 35°C - C/3-1C - 50% Mid.SoC
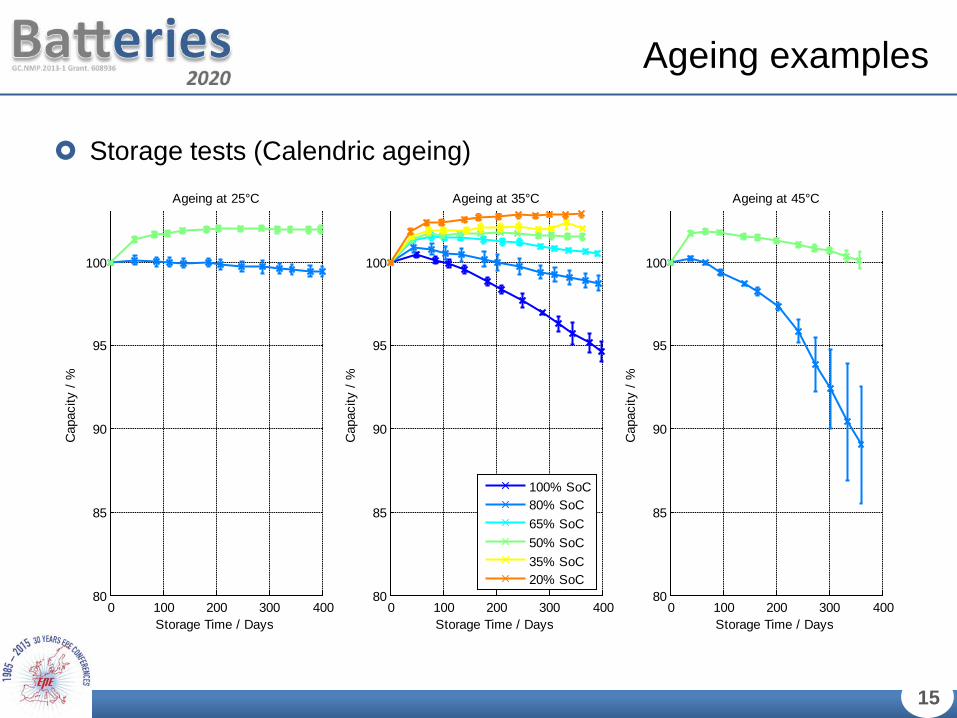
Storage tests (Calendric ageing)
15
Ageing examples
0 100 200 300 40080
85
90
95
100
Storage Time / Days
Cap
acity
/ %
Ageing at 25°C
0 100 200 300 40080
85
90
95
100
Storage Time / Days
Cap
acity
/ %
Ageing at 35°C
100% SoC80% SoC65% SoC50% SoC35% SoC20% SoC
0 100 200 300 40080
85
90
95
100
Storage Time / DaysC
apac
ity /
%
Ageing at 45°C

Drift among cells
Same condition for all cells
Variance is getting bigger while ageing
Weakest cell limits the battery pack performance!
16
Ageing examples
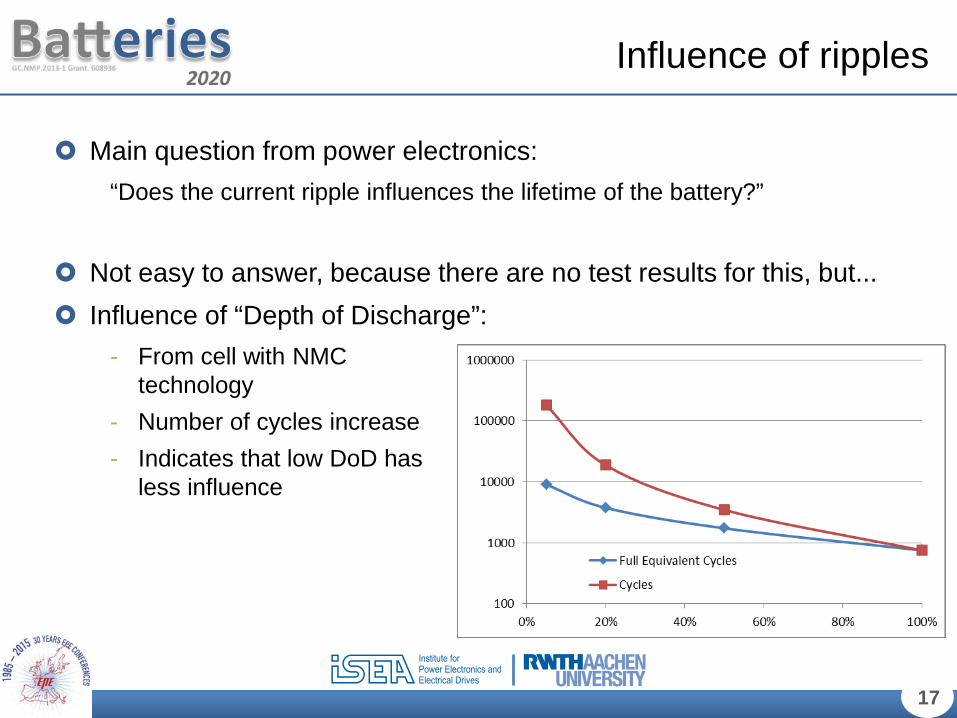
Main question from power electronics: “Does the current ripple influences the lifetime of the battery?”
Not easy to answer, because there are no test results for this, but... Influence of “Depth of Discharge”:
- From cell with NMC technology
- Number of cycles increase - Indicates that low DoD has
less influence
17
Influence of ripples
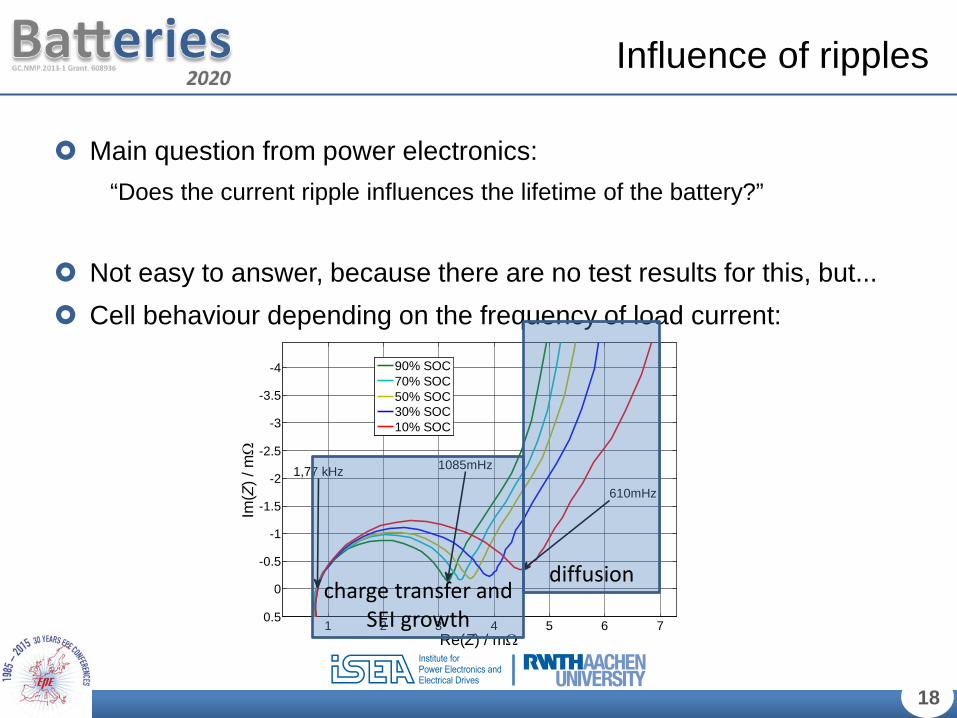
Main question from power electronics: “Does the current ripple influences the lifetime of the battery?”
Not easy to answer, because there are no test results for this, but... Cell behaviour depending on the frequency of load current:
18
Influence of ripples
1 2 3 4 5 6 7
-4
-3.5
-3
-2.5
-2
-1.5
-1
-0.5
0
0.5
Re(Z) / mΩ
Im(Z
) / m
Ω
90% SOC70% SOC50% SOC30% SOC10% SOC
1,77 kHz 1085mHz
610mHz
charge transfer and SEI growth
diffusion

Basic ageing effects in lithium-ion batteries are known Todays models and testing methods give good results Batteries are behaving profoundly non-linear
Lifetime of batteries are sufficient for electric vehicle applications
- Energy density and price are the critical properties
Does current ripples influence the ageing? - Actual results indicate that there are no influences, but no detailed
studies. - One objective of the Project “HV-Modal” is testing this issue (Results will
be published in the next time)
19
Conclusion