AGEING ASSESSMENT OF INSULATION PAPER WITH …
213
AGEING ASSESSMENT OF INSULATION PAPER WITH CONSIDERATION OF IN-SERVICE AGEING AND NATURAL ESTER APPLICATION A thesis submitted to The University of Manchester for the degree of PhD in the Faculty of Engineering and Physical Sciences 2012 NORHAFIZ AZIS School of Electrical and Electronic Engineering
Transcript of AGEING ASSESSMENT OF INSULATION PAPER WITH …

AGEING ASSESSMENT OF INSULATION PAPER WITH CONSIDERATION
OF IN-SERVICE AGEING AND NATURAL ESTER APPLICATION
A thesis submitted to The University of Manchester for the degree of
PhD
in the Faculty of Engineering and Physical Sciences
2012
NORHAFIZ AZIS
School of Electrical and Electronic Engineering

____________________________________________________________________________

List of contents
3
LIST OF CONTENTS
LIST OF CONTENTS .......................................................................................................... 3
LIST OF FIGURES ............................................................................................................... 6
LIST OF TABLES .............................................................................................................. 12
ABSTRACT .............................................................................................................. 15
DECLARATION .............................................................................................................. 16
COPYRIGHT STATEMENT ........................................................................................... 17
ACKNOWLEDGEMENT .................................................................................................. 18
CHAPTER 1. INTRODUCTION ............................................................................ 19
1.1. Background ..................................................................................................... 19
1.2. Research objectives ........................................................................................ 20
1.3. Insulating oil used in transformers ................................................................. 21
1.3.1. Background .................................................................................. 22
1.3.2. Mineral oil .................................................................................... 22
1.3.3. Natural ester ................................................................................. 24
1.3.4. Effect of oil ageing to the paper degradation ............................... 26
1.4. Thesis outlines ................................................................................................ 26
CHAPTER 2. LITERATURE REVIEW .............................................................. 28
2.1. Introduction .................................................................................................... 28
2.2. Ageing of cellulose ......................................................................................... 29
2.2.1. Background .................................................................................. 29
2.2.2. Cellulose insulation used in transformers .................................... 30
2.2.3. Paper ageing mechanisms ............................................................ 35
2.2.4. Paper ageing accelerators ............................................................. 46
2.2.5. Paper ageing products .................................................................. 48
2.2.6. Paper ageing assessment techniques ............................................ 53
2.3. Summary ......................................................................................................... 61
CHAPTER 3. METHODOLOGY .......................................................................... 62
3.1. Introduction .................................................................................................... 62
3.2. Paper sampling procedure from scrapped transformers ................................. 62
3.2.1. Phase and winding profile ............................................................ 62
3.2.2. Layer profile ................................................................................. 64
3.3. TS measurements ............................................................................................ 65
3.3.1. TS or TI measurements ................................................................ 65
3.3.2. Factors affecting TI measurements .............................................. 66
3.4. TAN, LMA and HMA measurements ............................................................ 73

List of contents
4
3.4.1. TAN measurements ..................................................................... 73
3.4.2. LMA and HMA measurements .................................................... 74
3.5. Pre-processing of materials for ageing experiment ........................................ 79
3.5.1. Pre-processing of oil .................................................................... 79
3.5.2. Pre-processing of paper ................................................................ 80
3.6. Summary ........................................................................................................ 80
CHAPTER 4. AGEING ASSESSMENT OF PAPER THROUGH TENSILE
STRENGTH MEASUREMENTS ................................................. 81
4.1. Introduction .................................................................................................... 81
4.2. Case study....................................................................................................... 81
4.3. TI measurements of scrapped transformers.................................................... 83
4.3.1. TI profiles of scrapped transformers ............................................ 83
4.3.2. Relationship between TI and age ................................................. 89
4.4. Modelling relationship between TI and transformer age ............................... 93
4.4.1. Modelling procedure for transformer population ........................ 93
4.4.2. Life assessment of transformer population through TI
measurements ............................................................................... 97
4.5. Effect of ageing on dielectric strength of paper ........................................... 104
4.5.1. Experiment description .............................................................. 104
4.5.2. Dielectric strength of paper ........................................................ 106
4.5.3. Oil influence on breakdown voltage of paper ............................ 107
4.5.4. Statistical analysis on breakdown voltage of paper ................... 110
4.5.5. Breakdown mechanism of insulation paper ............................... 113
4.6. Summary ...................................................................................................... 115
CHAPTER 5. AGEING ASSESSMENT OF PAPER THROUGH LOW
MOLECULAR WEIGHT ACID MEASUREMENTS .......... 116
5.1. Introduction .................................................................................................. 116
5.2. Effect of LMA and HMA on breakdown voltage of oil and ageing of paper
116
5.2.1. Effect of LMA and HMA on breakdown voltage of oil ............ 117
5.2.2. Effect of LMA and HMA on ageing of paper ............................ 120
5.3. LMA measurements of scrapped transformers paper................................... 124
5.3.1. LMA profile of scrapped transformers ...................................... 124
5.3.2. Relationship between LMA in paper, TI and transformer age .. 129
5.4. LMA and HMA ratio between paper and oil ............................................... 135
5.4.1. LMA ratio between paper and oil .............................................. 135
5.4.2. LMA and HMA ratio of oil ........................................................ 137
5.5. Life assessment of transformers through LMA measurement ..................... 146

List of contents
5
5.5.1. Calculation procedure ................................................................ 146
5.5.2. Prediction of TI based on LMA in oil ........................................ 148
5.5.3. Prediction of transformers life consumption based on LMA ..... 154
5.6. Summary ....................................................................................................... 155
CHAPTER 6. AGEING ASSESSMENT OF NATURAL ESTER ................ 156
6.1. Introduction .................................................................................................. 156
6.2. Oxidation of natural ester ............................................................................. 156
6.2.1. Ageing of natural ester only ....................................................... 157
6.2.2. Ageing of natural ester with presence of paper, copper and steel
.................................................................................................... 158
6.3. Application of natural ester to sealed transformers ...................................... 164
6.3.1. Ageing of natural ester only ....................................................... 164
6.3.2. Ageing of natural ester with presence of paper, copper and steel
.................................................................................................... 165
6.3.3. LMA and HMA of natural ester ................................................. 169
6.4. Effect of LMA and HMA on breakdown voltage of natural ester and ageing
of paper................................................................................................................. 174
6.4.1. Effect of LMA and HMA on breakdown voltage of natural ester
.................................................................................................... 174
6.4.2. Effect of LMA and HMA on ageing of paper ............................ 176
6.5. Summary ....................................................................................................... 179
CHAPTER 7. CONCLUSIONS AND FUTURE WORK ................................ 180
7.1. Conclusions .................................................................................................. 180
7.1.1. General ....................................................................................... 180
7.1.2. Summary of main findings ......................................................... 181
7.2. Future work .................................................................................................. 182
APPENDIX I: Tensile Index (TI) of New and Service Aged Paper ............... 184
APPENDIX II: Low Molecular Weight Acid (LMA) of Service Aged Paper .....
............................................................................................................ 192
APPENDIX III: Effect of Ageing on Breakdown Voltage of Paper .................. 196
APPENDIX IV: Effect of Low Molecular Weight Acid (LMA) and High
Molecular Weight Acid (HMA) on Breakdown Voltage of Oil
and Ageing of Paper ...................................................................... 199
APPENDIX V: List of Publications ........................................................................ 206
REFERENCES ............................................................................................................ 207
Word Count: 50 788

List of figures
6
LIST OF FIGURES
Figure 1.1 Hydrocarbons structure of mineral oil [10]. .......................................... 23
Figure 1.2 Oxidation of mineral oil [9]. .................................................................. 24
Figure 1.3 Structure of trglyceride [12]. ................................................................. 24
Figure 1.4 Oxidation of natural ester [13]. ............................................................. 25
Figure 1.5 Hydrolysis of natural ester [15]. ............................................................ 26
Figure 2.1 Anhydro β-D-glucopyranose monomer units [29]. ............................... 29
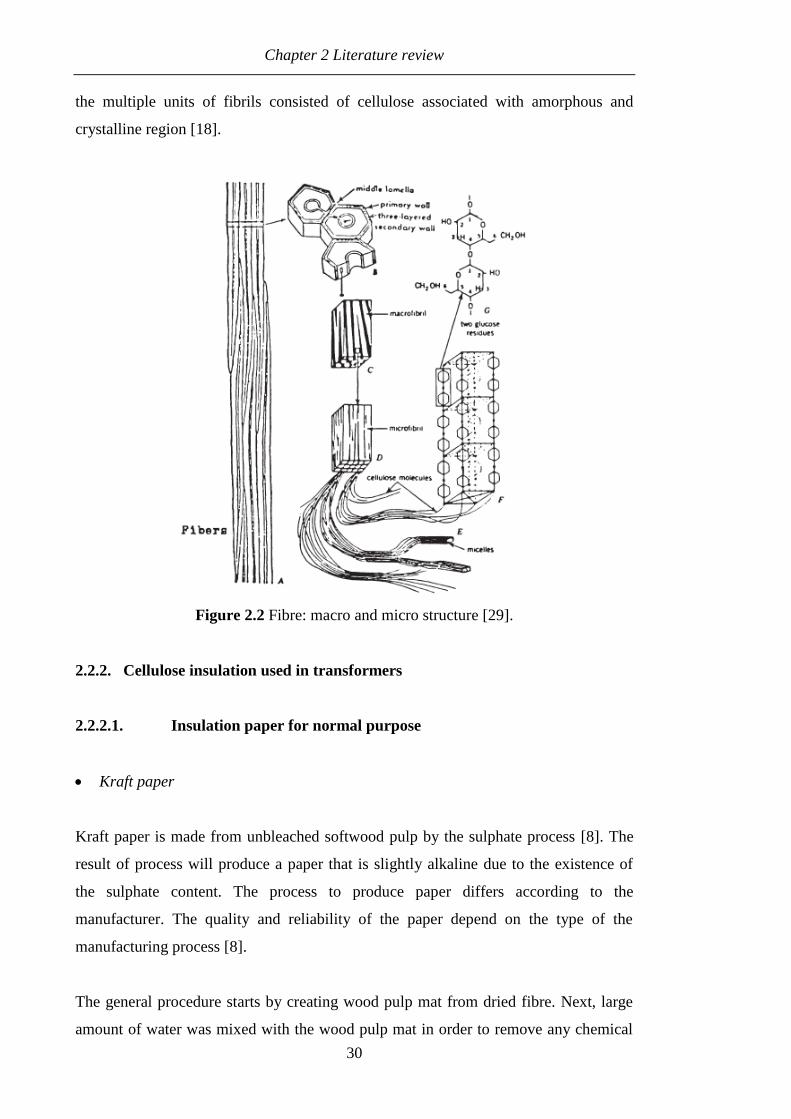
Figure 2.2 Fibre: macro and micro structure [29]. .................................................. 30
Figure 2.3 Cyanoethylation of cellulose [32]. ........................................................ 32
Figure 2.4 Manufacturing process of pressboard [30]. ........................................... 34
Figure 2.5 Factors that could influence oil and paper ageing in the transformer
[26]. ....................................................................................................... 36
Figure 2.6 Procedures to obtain a) ageing rate, k and b) activation energy, E and
pre exponential factor, A. Calculation made based on Lundgaard’s data,
Kraft paper with 3 % in weight water content (Thermo 70) and mineral
oil (Nynas Nytro 10X) are sealed without air and aged at 70 °C, 90 °C,
110 °C and 130 °C. ................................................................................ 41
Figure 2.7 Arrhenius plot under different ageing mechanisms [54]. ...................... 42
Figure 2.8 Oxidation mechanism on cellulose [51]. ............................................... 43
Figure 2.9 Carboxyl and carbonyl groups [55]. ...................................................... 43
Figure 2.10 Hydrolysis mechanism on cellulose [51]. ............................................. 43
Figure 2.11 Mechanism of furanic compounds formation through hydrolysis [56]. 44
Figure 2.12 Pyrolysis mechanism on cellulose [51]. ................................................ 44
Figure 2.13 Ageing mechanism of paper in transformers. ....................................... 45
Figure 2.14 Effect of water on paper ageing. Kraft paper (Clupak HD75) and
mineral oil (Nynas Nytro 10CX) are sealed under air and aged from 60
°C to 120 °C [60]. .................................................................................. 46
Figure 2.15 Effect of oxygen on paper ageing. Kraft paper (Thermo 70), mineral oil
(Nynas Nytro 10XN) and copper are sealed with different oxygen
pressures and aged at 90 °C, 110 °C and 130 °C [53]. .......................... 47
Figure 2.16 Effect of LMA on paper ageing under wet condition. Kraft paper
(Thermo 70) and mineral oil (Nynas Nytro 10X) containing LMA and
HMA are sealed without air and aged at 70 °C, 90 °C, 110 °C and 130
°C [17]. .................................................................................................. 48
Figure 2.17 Relationship between water generation and chain scission of paper [22,
61, 62]. ................................................................................................... 49
Figure 2.18 Type of furanic compounds [64]. ......................................................... 49
Figure 2.19 Formation of 2FAL through hydrolysis/oxidation mechanisms. .......... 50
Figure 2.20 Generation of CO and CO2 at different temperatures. Paper, mineral oil,
steel, and aluminium are sealed without air and aged at 100 °C, 110 °C,
120 °C and 140 °C [36]. ........................................................................ 51
Figure 2.21 Relationship between tensile strength/degree of polymerization and
CO/CO2. Paper, mineral oil, steel, and aluminium are sealed without air
and aged at 100 °C, 110 °C, 120 °C and 140 °C [36]. .......................... 51
Figure 2.22 Acids generation for Kraft and thermally upgraded paper. Kraft paper,
thermally upgraded paper, mineral oil and copper are sealed without air
and aged at 90 °C, 110 °C and 130 °C [2]. ............................................ 52

List of figures
7
Figure 2.23 Relationship between a) methanol (CH3OH) and b) furanic compounds
(2FAL) and chain scission (NS). Kraft paper (Clupak HD75) and
mineral oil (Nynas Nytro 10CX) are sealed under air and aged from 60
°C to 120 °C [68]. .................................................................................. 53
Figure 2.24 Ubbelohde viscometer tube. .................................................................. 54
Figure 2.25 Stress and strain behaviour in two directions: MD (Machine Direction)
and CD (Cross Machine Direction) [71]. .............................................. 55
Figure 2.26 Long span TS setup. .............................................................................. 56
Figure 2.27 Zero span tensile tester. ......................................................................... 57
Figure 2.28 Basic HPLC system. .............................................................................. 58
Figure 2.29 Basic GC system. ................................................................................... 60
Figure 3.1 Sampling procedure for a) Phase and b) Winding profiles. .................. 63
Figure 3.2 Sampling procedure for layer profile..................................................... 64
Figure 3.3 Paired t-test calculation procedure. ....................................................... 67
Figure 3.4 TI of new conductor paper versus length. Data are mean of 10 samples
and error bars represent the standard deviation. .................................... 68
Figure 3.5 Paper samples arrangement for the effect of folding stress. .................. 69
Figure 3.6 TI of new conductor paper with and without folding stress. Data are
mean of 10 samples and error bars represent the standard deviation. ... 70
Figure 3.7 Preparations of paper samples for the effect of oil impregnation. ......... 71
Figure 3.8 Influence of oil on TI. Data are mean of 10 samples and error bars
represent the standard deviation. ........................................................... 71
Figure 3.9 Paper samples arrangement for the effect reducing paper length in the
clamp. .................................................................................................... 72
Figure 3.10 Effect of reducing paper length in the clamp area of TI. Data are mean
of 10 samples and error bars represent the standard deviation. ............. 73
Figure 3.11 Procedure to measure TAN. .................................................................. 74
Figure 3.12 Procedure to measure LMA and HMA in oil. ....................................... 75
Figure 3.13 Procedure to measure LMA in paper. .................................................... 76
Figure 3.14 Low molecular weight acid extraction efficiency using water. Data are
mean of 2 measurements. ...................................................................... 78
Figure 4.1 TI profiles among different phases a) Transformer 4 (SW) and b)
Transformer 6 (CW). Data are mean of 5 to 10 samples and error bars
represent the standard deviation. ........................................................... 85
Figure 4.2 TI profiles among different windings of Transformer 8. Paper samples
were taken from B phase. Data are mean of 4 to 6 samples and error
bars represent the standard deviation. .................................................... 85
Figure 4.3 TI profiles among different layers of Transformer 10. Paper samples
were taken from B phase, HV bottom. Data are mean of 9 to 10 samples
and error bars represent the standard deviation. .................................... 87
Figure 4.4 TI profiles among different layers of Transformer 6. Paper samples
were taken from B phase, CW top. Data are mean of 9 to 10 samples
and error bars represent the standard deviation. .................................... 87
Figure 4.5 Example of paper taken from Transformer 10 a) 1st layer b) 2
nd layer c)
3rd
layer d) 4th
layer e) 5th
layer f) 6th
layer g) 7th layer h) 8th
layer.
Paper samples were taken from B phase, HV bottom of Transformer 10.
............................................................................................................... 88
Figure 4.6 TI versus age of 9 transformers. Paper samples were taken from
different locations. Data are mean of 4 to 10 samples. .......................... 90
Figure 4.7 Daily loading of typical summer (19/06/2009). .................................... 91
Figure 4.8 Daily loading of typical winter (04/12/2009). ....................................... 91

List of figures
8
Figure 4.9 Average TI and average daily loading of typical summer. ................... 92
Figure 4.10 Average TI and average daily loading of typical winter. ...................... 92
Figure 4.11 Definition of initial and measured TI. ................................................... 94
Figure 4.12 Fitting for the average of the measured TI according to Weidmann
model. The initial TI was not set as fitting parameter. .......................... 95
Figure 4.13 Fitting for the average of the measured TI according to Weidmann
model. .................................................................................................... 96
Figure 4.14 Fitting for the average of the measured TI according to Ding and Wang
model. .................................................................................................... 97
Figure 4.15 Fitting for the average of the measured TI at the top winding. Each point
represents the average of the measured TI at the top winding of each
transformer. ........................................................................................... 98
Figure 4.16 Fitting for the average of the measured TI at the bottom winding. Each
point represents the average of the measured TI at the bottom winding
of each transformer. ............................................................................... 99
Figure 4.17 Fitting for the average of the measured TI. The square point represents
the average of the measured TI from different locations of each
transformer. ......................................................................................... 101
Figure 4.18 Fitting for the lowest of the measured TI. The round point represents the
lowest of the measured TI from different locations of each transformer.
............................................................................................................. 102
Figure 4.19 Breakdown voltages of different types of paper impregnated in new oil.
............................................................................................................. 106
Figure 4.20 Relationship between breakdown voltages of paper impregnated in new
oil a) Density and b) Grammage. ........................................................ 107
Figure 4.21 Breakdown voltages of new and aged oils. ......................................... 108
Figure 4.22 Breakdown voltages of layer type paper impregnated in new and aged
oils. ...................................................................................................... 108
Figure 4.23 Breakdown voltages of conductor type paper impregnated in new and
aged oils. .............................................................................................. 109
Figure 4.24 Breakdown voltages of service aged paper impregnated in new and aged
oils. ...................................................................................................... 109
Figure 4.25 Average breakdown strengths of new and aged paper. Data are mean of
50 tests and error bars represent the standard deviation. ..................... 110
Figure 4.26 Weibull probability plots of new and aged paper impregnated in new
oil. ........................................................................................................ 110
Figure 4.27 Weibull probability plots of new and aged paper impregnated in aged
oil. ........................................................................................................ 111
Figure 4.28 Normal probability plots of new and aged paper impregnated in new oil.
............................................................................................................. 111
Figure 4.29 Normal probability plots of new and aged paper impregnated in aged
oil. ........................................................................................................ 112
Figure 4.30 Multiple breakdowns at single point of paper impregnated in new oil.
............................................................................................................. 114
Figure 4.31 Multiple breakdowns at single point of paper impregnated in aged oil.
............................................................................................................. 114
Figure 4.32 Paper condition after breakdown tests a) New paper and b) Aged paper.
............................................................................................................. 114
Figure 5.1 Influence of LMA on the breakdown voltage of mineral oil. Breakdown
voltage data are mean of 50 tests and error bars represent the standard
deviation. LMA in oil data is 1 measurement. .................................... 118

List of figures
9
Figure 5.2 Influence of HMA on breakdown voltage of mineral oil. Breakdown
voltage data are mean of 50 tests and error bars represent the standard
deviation. HMA in oil data is 1 measurement. .................................... 119
Figure 5.3 Influence of TAN on the breakdown voltage of in-service oil.
Breakdown voltage data are mean of 50 tests. TAN data is 1
measurement. ....................................................................................... 120
Figure 5.4 Influence of LMA and HMA on the paper aged under dry condition.
Data are mean of 8 samples and error bars represent the standard
deviation. ............................................................................................. 121
Figure 5.5 Influence of LMA and HMA on the paper aged under wet condition.
Data are mean of 8 samples and error bars represent the standard
deviation. ............................................................................................. 122
Figure 5.6 LMA in paper profiles among different phases a) Transformer 4 (SW)
and b) Transformer 6 (CW). Data are mean of 2 measurements. ........ 125
Figure 5.7 LMA in paper profiles among different windings of Transformer 8.
Paper samples were taken from B phase. Data are mean of 2
measurements. ..................................................................................... 125
Figure 5.8 LMA in paper profiles among different layers of Transformer 10. Paper
samples were taken from B phase, HV bottom. Data is 1 measurement.
............................................................................................................. 127
Figure 5.9 LMA in paper profiles among different layers of Transformer 6. Paper
samples were taken from B phase, CW top. Data are mean of 2
measurements. ..................................................................................... 127
Figure 5.10 TI and LMA in paper profiles among different layers of Transformer 10.
Paper samples were taken from B phase, HV bottom. LMA in paper
data is 1 measurement. TI data are mean of 9 to 10 samples. ............. 128
Figure 5.11 TI and LMA in paper profiles among different layers of Transformer 6.
Paper samples were taken from B phase, CW top. LMA in paper data
are mean of 2 measurements. TI data are mean of 9 to 10 samples. ... 129
Figure 5.12 LMA in paper versus TI of 9 transformers. Paper samples were taken
from different locations. LMA in paper data are mean of 2
measurements. TI data are mean of 4 to 10 samples. .......................... 130
Figure 5.13 LN (LMA in paper) versus TI of 9 transformers. Paper samples were
taken from different locations. LMA in paper data are mean of 2
measurements. TI data are mean of 4 to 10 samples. .......................... 131
Figure 5.14 LMA in paper versus transformer age of 9 transformers. Data are mean
of 2 measurements. .............................................................................. 132
Figure 5.15 Average LMA in paper and average daily loading of typical summer.
............................................................................................................. 133
Figure 5.16 Average LMA in paper and average daily loading of typical winter. . 133
Figure 5.17 Fitting of LMA in paper versus transformer age of 9 transformers. Data
are mean of 2 LMA in paper measurements. ....................................... 134
Figure 5.18 LMA ratio of paper and oil versus weight ratio of paper and oil. LMA in
paper data are mean of 2 measurements. LMA in oil data is 1
measurement. ....................................................................................... 137
Figure 5.19 Daily loading of typical summer (19/06/2009). .................................. 138
Figure 5.20 Daily loading of typical winter (04/12/2009). ..................................... 138
Figure 5.21 TAN, LMA and HMA of in-service oil. LMA, HMA and TAN of oil
data is 1 measurement. ......................................................................... 139
Figure 5.22 LMA and HMA ratio of mineral oil aged under sealed condition without
copper. LMA, HMA and TAN of oil data is 1 measurement. ............. 141
List of figures
10
Figure 5.23 LMA and HMA ratio for mineral oil aged under open condition without
copper. LMA, HMA and TAN of oil data is 1 measurement. ............. 142
Figure 5.24 LMA and HMA ratio for mineral oil aged under sealed condition with
copper. LMA, HMA and TAN of oil data is 1 measurement. ............. 144
Figure 5.25 LMA and HMA ratio for mineral oil aged under open condition with
copper. LMA, HMA and TAN of oil data is 1 measurement. ............. 145
Figure 5.26 Calculation procedure for predicting TI and transformer life
consumption. ....................................................................................... 147
Figure 5.27 Procedure of modelling the relationship between LMA in oil and
transformer age. ................................................................................... 148
Figure 5.28 TAN versus transformer age. Data is 1 measurement. ........................ 150
Figure 5.29 LMA in in-service oil versus transformer age. .................................... 151
Figure 5.30 Modelling procedure for the relationship between LMA in paper and
LMA in oil ........................................................................................... 152
Figure 5.31 Ratio of LMA in paper and oil versus transformer age ....................... 154
Figure 6.1 TAN of natural ester and mineral oil aged at 115 °C under open
condition without any presence of paper, copper and steel. Data is 1
measurement. ....................................................................................... 157
Figure 6.2 TAN of natural ester aged at 170 °C under open condition with presence
of paper, copper and steel. Data is 1 measurement. ............................ 159
Figure 6.3 Viscosity of natural ester aged under open condition with presence of
paper, copper and steel. Data are mean of 5 measurements. Mineral oil
was aged under open condition with paper, copper, zinc, iron and
aluminium [107]. ................................................................................. 161
Figure 6.4 Viscosity versus TAN of natural ester aged under open condition with
presence of paper, copper and steel. Viscosity data are mean of 5
measurements. TAN data is 1 measurement. ...................................... 162
Figure 6.5 Natural ester aged under open condition with presence of paper, copper,
and steel for single ratio samples. a) Natural ester condition after 50
days of ageing and b) Mixture of aged natural ester and water. ......... 164
Figure 6.6 TAN of natural ester and mineral oil aged under sealed condition
without any presence of paper, copper and steel. Data is 1 measurement.
............................................................................................................. 165
Figure 6.7 TAN of natural ester and mineral oil aged under sealed condition with
presence of paper, copper and steel. Data is 1 measurement. For S.
Tenbohlen, mineral oil was aged under sealed condition with paper,
copper, zinc, iron and aluminium [107]. For R. Liao, mineral oil was
aged under sealed condition with paper and copper [2]. ..................... 166
Figure 6.8 Viscosity of natural ester and mineral oil aged under sealed condition
with presence of paper, copper and steel. Data are mean of 5
measurements. For S. Tenbohlen, mineral oil was aged under sealed
condition with paper, copper, zinc, iron and aluminium [107]. .......... 167
Figure 6.9 Viscosity versus TAN of natural ester aged under sealed condition with
presence of paper, copper and steel. Viscosity data are mean of 5
measurements. TAN data is 1 measurement. ...................................... 169
Figure 6.10 LMA and HMA of natural ester and mineral oil aged under sealed
condition without any presence of paper, copper and steel. LMA and
HMA of natural ester data is 1 measurement. ..................................... 170
Figure 6.11 LMA and HMA of natural ester and mineral oil aged under sealed
condition with presence of paper, copper and steel. LMA and HMA of
natural ester data is 1 measurement. .................................................... 172

List of figures
11
Figure 6.12 LMA in paper of natural ester and mineral oil aged under sealed
condition with presence of paper, copper and steel. Data are mean of 2
measurements. ..................................................................................... 174
Figure 6.13 Influence of LMA on the breakdown voltage of natural ester. Data are
mean of 50 tests and error bars represent the standard deviation. LMA
in natural ester data is 1 measurement. ................................................ 175
Figure 6.14 Influence of HMA on the breakdown voltage of natural ester. Data are
mean of 50 tests and error bars represent the standard deviation. HMA
in natural ester data is 1 measurement. ................................................ 176
Figure 6.15 Influence of LMA and HMA on the paper aged under dry condition.
Data are mean of 8 samples and error bars represent the standard
deviation. ............................................................................................. 177
Figure 6.16 Influence of LMA and HMA on the paper aged under wet condition.
Data are mean of 8 samples and error bars represent the standard
deviation. ............................................................................................. 178

List of tables
12
LIST OF TABLES
Table 2.1 Previous ageing experiments. ................................................................ 36
Table 2.2 Activation energy for oxidation and hydrolysis [27, 53]. ..................... 42
Table 2.3 Causes for specific furanic compounds [80]. ........................................ 59
Table 3.1 Properties of new conductor and layer types paper. .............................. 66
Table 3.2 TI and TS comparison between conductor and layer types paper. ........ 66
Table 3.3 Means comparison between each length ............................................... 69
Table 3.4 Percentage difference of TI between baseline and samples. ................ 72
Table 3.5 Means comparison between baseline and samples. ............................... 72
Table 3.6 Age and paper properties of each transformer. ..................................... 77
Table 3.7 LMA measurement on service aged paper. ........................................... 78
Table 3.8 Basic properties of Gemini X and FR3. ................................................ 79
Table 4.1 Case study of transformers. ................................................................... 82
Table 4.2 Paper properties and TAN of each transformer for phase and winding
profiles. .................................................................................................. 83
Table 4.3 Age, paper properties and TAN of each transformer for layer profile. . 86
Table 4.4 Classification of initial TI. ..................................................................... 95
Table 4.5 End of life criterion based on TI. .......................................................... 97
Table 4.6 Ageing rate for the average of the measured TI at the top winding. ..... 99
Table 4.7 Ageing rate for the average of the measured TI at the bottom winding.
............................................................................................................... 99
Table 4.8 Estimated life for the average of the measured TI at the top winding. 100
Table 4.9 Estimated life for the average of the measured TI at the bottom winding.
............................................................................................................. 100
Table 4.10 Ageing rate for the average of the measured TI. ................................. 102
Table 4.11 Ageing rate for the lowest of the measured TI. ................................... 102
Table 4.12 Estimated life for the average of the measured TI. ............................. 103
Table 4.13 Estimated life for the lowest of the measured TI. ............................... 103
Table 4.14 Average estimated life for the transformer population. ...................... 104
Table 4.15 Properties of paper used for breakdown test. ...................................... 105
Table 4.16 Number of paper layers used in breakdown tests. ............................... 105
Table 4.17 Average breakdown voltage of new and aged paper impregnated in new
and aged oil based on Weibull fitting. ................................................. 112
Table 4.18 Average breakdown voltage of new and aged paper impregnated in new
and aged oil based on normal fitting. .................................................. 112
Table 5.1 Properties of LMA and HMA. ............................................................ 117
Table 5.2 Ageing rate of dry condition. .............................................................. 122
Table 5.3 Ageing rate of wet condition. .............................................................. 123
Table 5.4 Increment factors of dry and wet ageing conditions. .......................... 123
Table 5.5 Increment rate of LMA in paper and constant of the fitting. .............. 135
Table 5.6 LMA ratio of paper and mineral oil. Data is 1 measurement. ............. 135
Table 5.7 LMA and HMA ratio of paper and mineral oil. LMA in paper data are
mean of 2 measurements and LMA in oil data is 1 measurement. ..... 136
Table 5.8 Case study of transformers. ................................................................. 137
Table 5.9 LMA and HMA percentages of in-service oil. .................................... 140
Table 5.10 LMA and HMA percentages of mineral oil aged under sealed condition
without copper. .................................................................................... 141
Table 5.11 LMA and HMA percentage of mineral oil aged under open condition
without copper. .................................................................................... 143

List of tables
13
Table 5.12 LMA and HMA percentage of mineral oil aged under sealed condition
with copper. ......................................................................................... 144
Table 5.13 LMA and HMA percentage of mineral oil aged under open condition
with copper. ......................................................................................... 145
Table 5.14 Increment rate of TAN and constant of the fitting. ............................. 151
Table 5.15 Increment rate of LMA in oil and constant of the fitting. ................... 151
Table 5.16 Life consumptions based on average initial TI of 107 Nm/g. ............. 155
Table 6.1 Amount of oil, paper, copper and steel ratio for single ratio. .............. 158
Table 6.2 Amount of oil, paper, copper and steel ratio for double ratio. ............ 158
Table 6.3 LMA and HMA percentages in natural ester and mineral oil aged under
sealed condition without any presence of paper, copper and steel. ..... 170
Table 6.4 LMA and HMA percentages in natural ester and mineral oil aged under
sealed condition with presence of paper, copper and steel. ................. 173
Table 6.5 Ageing rate of dry condition. ............................................................... 177
Table 6.6 Ageing rate of wet condition. .............................................................. 178
Table 6.7 Comparison of increment factors between natural ester and mineral oil
under dry ageing conditions. ............................................................... 179
Table I.1 TI of new conductor type paper without oil impregnation at different
lengths. ................................................................................................. 184
Table I.2 TI of new layer type paper without oil impregnation. ......................... 184
Table I.3 TI of new conductor type paper with oil impregnation. ...................... 184
Table I.4 TI of new conductor type paper under folding stress. ......................... 185
Table I.5 TI of new conductor type paper under less paper length in the clamp
area. ...................................................................................................... 185
Table I.6 TI of Transformer 1. ............................................................................ 185
Table I.7 TI of Transformer 2. ............................................................................ 186
Table I.8 TI of Transformer 3. ............................................................................ 186
Table I.9 TI of Transformer 4. ............................................................................ 187
Table I.10 TI of Transformer 5. ............................................................................ 188
Table I.11 TI of Transformer 6. ............................................................................ 189
Table I.12 TI of Transformer 7. ............................................................................ 189
Table I.13 TI of Transformer 8. ............................................................................ 189
Table I.14 TI of Transformer 9. ............................................................................ 190
Table I.15 TI of different layers for Transformer 10. Paper samples were taken
from B phase, HV bottom.................................................................... 190
Table I.16 TI of different layers for Transformer 6. Paper samples were taken from
B phase, CW top. ................................................................................. 191
Table II.1 LMA in paper of Transformer 1. ......................................................... 192
Table II.2 LMA in paper of Transformer 2. ......................................................... 192
Table II.3 LMA in paper of Transformer 3. ......................................................... 192
Table II.4 LMA in paper of Transformer 4. ........................................................ 192
Table II.5 LMA in paper of Transformer 5. ......................................................... 193
Table II.6 LMA in paper of Transformer 6. ......................................................... 193
Table II.7 LMA in paper of Transformer 7. ......................................................... 194
Table II.8 LMA in paper of Transformer 8. ......................................................... 194
Table II.9 LMA in paper of Transformer 9. ......................................................... 194
Table II.10 LMA in paper of different layers for Transformer 10. Paper samples
were taken from B phase, HV bottom. ................................................ 194
Table II.11 LMA in paper of different layers for Transformer 6. Paper samples were
taken from B phase, CW top. .............................................................. 195

List of tables
14
Table III.1 AC breakdown voltages of different types of paper impregnated in new
oil. The gap distance between two sphere electrodes was set at 0.258
mm. ...................................................................................................... 196
Table III.2 AC breakdown voltages of different types of paper impregnated in aged
oil. The gap distance between two sphere electrodes was set at 0.258
mm. ...................................................................................................... 197
Table IV.1 AC breakdown voltages of new mineral oil with different amount of
LMA. The gap distance between two VDE electrodes was set at 1 mm.
............................................................................................................. 199
Table IV.2 AC breakdown voltages of new mineral oil with different amount of
HMA. The gap distance between two VDE electrodes was set at 1 mm.
............................................................................................................. 200
Table IV.3 AC breakdown voltages of new natural ester with different amount of
LMA. The gap distance between two VDE electrodes was set at 1 mm.
............................................................................................................. 201
Table IV.4 AC breakdown voltages of new natural ester with different amount of
HMA. The gap distance between two VDE electrodes was set at 1 mm.
............................................................................................................. 203
Table IV.5 TI of conductor type paper ageing in mineral oil under dry condition.
Data are mean of 8 samples. ................................................................ 204
Table IV.6 TI of conductor type paper ageing in mineral oil under wet condition.
Data are mean of 8 samples. ................................................................ 204
Table IV.7 TI of conductor type paper ageing in natural ester under dry condition.
Data are mean of 8 samples. ................................................................ 205
Table IV.8 TI of conductor type paper ageing in natural ester under wet condition.
Data are mean of 8 samples. ................................................................ 205

Abstract
15
ABSTRACT
One of the cellulose insulation in high voltage power transformers is paper, and it is
widely used in transformers due to low cost and excellent physical/electrical
properties. However, the performance of paper could be affected by ageing. Ageing of
paper is a complex phenomenon and can be influenced by many factors. This PhD
thesis aimed to examine the ageing of paper in transformers based on Tensile Index
(TI), dielectric strength and Low Molecular Weight Acid (LMA) measurements.
The effect of ageing on the dielectric strength of paper was examined, through
studying the influence of paper and oil ageing by-products such as LMA and HMA on
the AC breakdown voltage. Meanwhile, the end of life for transmission transformer
population in the UK was examined by studying the profile of LMA and TI of paper in
scrapped transformers, with phase, winding, and layer locations taken into
consideration. The relationship between TI, LMA and transformer age was modelled
using previously published formulae in literature. The partitioning of LMA and HMA
between mineral oil and paper was also investigated. Since TI is not directly
measureable when a transformer is in-service, a TI prediction model was developed
based on LMA measured in oil.
The results indicated that there is no reduction effect of ageing (moderate towards
severe) on the dielectric strength of paper, whereas the dielectric strength of paper is
mainly influenced by the oil condition. LMA significantly reduces the breakdown
voltage and accelerates the ageing of paper in mineral oil. The end of life based on TI
is best represented by the 20 % retention of TI. Based on the case studies, the
estimated end of life of transmission transformer population in the UK is around 43
years. The vertical distribution profile of LMA in paper and TI of paper along a
winding is mainly influenced by vertical temperature profile. As paper ages, the
amount of LMA in paper tends to increase as TI reduces. The percentage of LMA in
service aged oil is about one fourth of Total Acid Number (TAN). The partition of
LMA in mineral oil and paper favours its stay in paper and is heavily influenced by the
weight ratio of paper and oil.
The performance of the natural ester under high temperature ageing in open or sealed
condition was evaluated based on TAN and viscosity measurements. The ratio of LMA
and HMA in aged natural ester was examined. The effect of LMA and HMA on the
AC breakdown voltage of natural ester and ageing of paper was also investigated. It
was suggested that natural ester is suitable for application in hermetically sealed
transformers. High temperature oxidation has significant effect on the physical and
chemical properties of natural ester. Due to the polar nature of natural ester, the stay of
LMA in natural ester is favoured over in paper which could be the reason why the
breakdown voltage of natural ester and the ageing of paper are not significantly
affected by LMA as in mineral oil.

Declaration
16
DECLARATION
I declare that no portion of the work referred to in the thesis has been submitted in
support of an application for another degree or qualification of this or any other
university or other institute of learning.

Copyright Statement
17
COPYRIGHT STATEMENT
(i). The author of this thesis (including any appendices and/or schedules to this thesis)
owns certain copyright or related rights in it (the “Copyright”) and s/he has given The
University of Manchester certain rights to use such Copyright, including for
administrative purposes.
(ii). Copies of this thesis, either in full or in extracts and whether in hard or electronic
copy, may be made only in accordance with the Copyright, Designs and Patents Act
1988 (as amended) and regulations issued under it or, where appropriate, in accordance
with licensing agreements which the University has from time to time. This page must
form part of any such copies made.
(iii). The ownership of certain Copyright, patents, designs, trade marks and other
intellectual property (the “Intellectual Property”) and any reproductions of copyright
works in the thesis, for example graphs and tables (“Reproductions”), which may be
described in this thesis, may not be owned by the author and may be owned by third
parties. Such Intellectual Property and Reproductions cannot and must not be made
available for use without the prior written permission of the owner(s) of the relevant
Intellectual Property and/or Reproductions.
(iv). Further information on the conditions under which disclosure, publication and
commercialisation of this thesis, the Copyright and any Intellectual Property and/or
Reproductions described in it may take place is available in the University IP Policy
(see http://www.campus.manchester.ac.uk/medialibrary/policies/intellectual-
property.pdf), in any relevant Thesis restriction declarations deposited in the
University Library, The University Library’s regulations (see
http://www.manchester.ac.uk/library/aboutus/regulations) and in The University’s
policy on presentation of Theses.

Acknowledgement
18
ACKNOWLEDGEMENT
I would like to express my sincere gratitude to my supervisor Professor Zhongdong
Wang for her constant guidance to my research and her great effort for the research. I
thank her for her trust in my ability to conduct research. Many thanks are also given to
my advisor Dr William Sampson for his technical support for the research.
I am greatly indebted to Malaysian Ministry of Higher Education for the financial
sponsorship which covered my tuition fees and living maintenance for three years. I
would also like to thank Dr. Hongzhi Ding, Mr. Simon Ryder and Dr. Richard
Heywood of Doble Engineering, Mr. Paul Jarman and Dr. Gordon Wilson of National
Grid for their technical support throughout the project. Great thanks are also given to
Mr. Adrian Handley and Mr. Frank Hogan for their laboratory support and Dr. Keith
Cornick for some advices during talks with him.
To all my colleagues in the transformer research group and others in Ferranti building,
School of Electrical and Electronic, I appreciate your company and thank you for
providing an enjoyable working environment.
Last but not least, I wish to give my thanks to my parents, my wife Mrs. Siti Nur Sarah
and my daughters Aimi Balqis and Auni Balqis for their patience and selfless support
during my research.

Chapter 1 Introduction
19
CHAPTER 1. INTRODUCTION
1.1. Background
The majority of power transformers in the power system network are oil-filled and
contain cellulose as an insulator. Apart from cooling transformers, oil also provides
electrical insulation together with cellulose. One of the major cellulose based materials
used in transformers is paper.
As transformers get older, both oil and paper will experience ageing and generate by-
products. These products could affect the performance of transformers and lead to the
risk of failure. Thus, it is important to determine the ageing status of transformers by
monitoring the condition of oil and paper. Oil condition can be determined by different
types of test such as acidity, interfacial tension and oxidation stability. On the other
hand, paper condition is best represented by mechanical strength which can only be
measured directly after transformers are scrapped. There are two types of the test that
can be used to determine the mechanical strength of paper which are Degree of
Polymerization (DP) and Tensile Strength (TS). DP is known as representative
strength measurement of paper while TS is regarded as the true strength measurement
of paper. Both methods can be used as a criterion to determine the end of life of
transformer.
According to [1], it was suggested that the definition of end of life of a transformer
should be made based on measureable mechanical, dielectric and chemical
characteristics. TS or DP is not directly measureable when a transformer is in
operation. Dielectric strength is the characteristic that would relates closely to the
functionality of a transformer, however, it deteriorates extremely slowly as the ageing
progresses, thus, the other alternative to describe the end of life of a transformer is the
chemical characteristic. Through latest knowledge on the paper ageing, the chemical
characteristic could be determined by means of Low Molecular Weight Acid (LMA).
Moreover, LMA could also acts as an ageing indicator provided the partitioning
between LMA in oil and paper could be obtained.
Chapter 1 Introduction
20
Natural ester is considered as the alternative for conventional mineral oil due to the
high fire safety and environmental friendliness. There are several aspects such as
dielectric properties and ageing performance that requires further investigation at
laboratory level before natural ester could be applied in transformers since failure in
the field could be costly. Whilst the ageing performance of natural ester is well
investigated by previous researchers [2-7], the performance of high temperature
oxidation on the natural ester still remains unclear. Moreover, there is less information
regarding the impact of oxidation toward its physical and chemical properties. Apart
from oxidation, there has been no study carried out on the LMA and High Molecular
Weight Acid (HMA) partitioning in natural ester and the effect of these acids on paper
ageing and the dielectric strength.
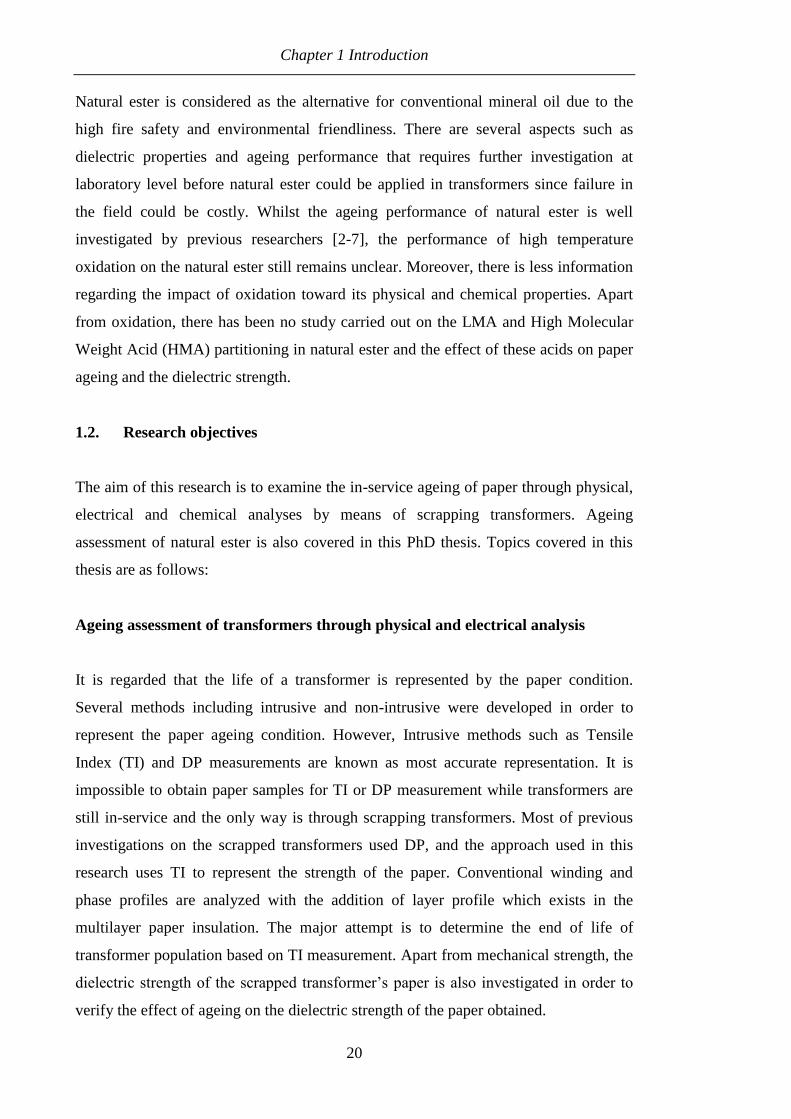
1.2. Research objectives
The aim of this research is to examine the in-service ageing of paper through physical,
electrical and chemical analyses by means of scrapping transformers. Ageing
assessment of natural ester is also covered in this PhD thesis. Topics covered in this
thesis are as follows:
Ageing assessment of transformers through physical and electrical analysis
It is regarded that the life of a transformer is represented by the paper condition.
Several methods including intrusive and non-intrusive were developed in order to
represent the paper ageing condition. However, Intrusive methods such as Tensile
Index (TI) and DP measurements are known as most accurate representation. It is
impossible to obtain paper samples for TI or DP measurement while transformers are
still in-service and the only way is through scrapping transformers. Most of previous
investigations on the scrapped transformers used DP, and the approach used in this
research uses TI to represent the strength of the paper. Conventional winding and
phase profiles are analyzed with the addition of layer profile which exists in the
multilayer paper insulation. The major attempt is to determine the end of life of
transformer population based on TI measurement. Apart from mechanical strength, the
dielectric strength of the scrapped transformer’s paper is also investigated in order to
verify the effect of ageing on the dielectric strength of the paper obtained.

Chapter 1 Introduction
21
Ageing assessment of transformers through chemical analysis
Ageing of paper generates different by-products such as water, furanic compounds,
gases and acids. It was found that acids generated by oil and paper ageing can be
differentiated as either LMA or HMA. It is necessary to study the effect of these acids
on the dielectric strength of mineral oil, since this property is most closely related to
transformer functionality. These acids could also act as paper ageing accelerator.
Further investigation is required to verify the effect of LMA and HMA on the paper
ageing in mineral oil. The knowledge on the tendency of LMA to stay in paper
provides an opportunity to measure the chemical property of the scrapped
transformer’s paper. The partitioning of LMA at different phase and winding can be
determined based on this knowledge. By combining TI information, an additional
criterion of the paper end of life based on LMA can be made. Most importantly, it is
proposed that the TI could be predicted through LMA measurement.
Ageing assessment of natural ester
The research on the application of natural ester as the insulation liquid for transformers
is still currently on-going. One of the crucial areas is the oxidation of natural ester
under high temperature. There is not much knowledge of the effect of severe oxidation
on physical and chemical properties of natural ester. Viscosity and Total Acid Number
(TAN) measurements are carried out on the natural ester subjected to high temperature
ageing under either open or sealed condition. It is necessary to examine the ratio of
LMA and HMA in natural ester. Further investigation is also required to determine the
effect of LMA and HMA on the dielectric strength and paper ageing in natural ester.
Based on this study, it is proposed that the reason for the good ageing performance of
paper ageing in natural ester is due to the fact that less LMA stays in the paper whereas
most of them are absorbed by the natural ester.
1.3. Insulating oil used in transformers
This thesis focuses on the ageing of paper in transformers. However, knowledge on the
ageing of oil is required since it co-exists together with paper in transformers. An
Chapter 1 Introduction
22
overview on the oil ageing mechanisms and how its by-products affect the paper
ageing is given in this section.
1.3.1. Background
Oil is known as an integral part of insulation in a transformer apart from cellulose. The
reliability of a transformer is mainly determined by both oil and paper. The main
function of oil is to dissipate the heat generated by the transformer winding and core,
to insulate between components at different potentials including being able to
withstand system transients due to switching or lightning surges [8].
Mineral oil is the common insulating liquid used in a transformer. It is derived from
crude petroleum formed from buried and decayed vegetable matter or by the action of
water on metal carbides. It is a complex mixture of carbon and hydrogen with a small
proportion of sulphur and nitrogen [8].
Another type of insulating liquid available on the market nowadays is natural ester. It
is derived from vegetable seed oil which is biodegradable and non toxic. Another
advantage of natural ester is the high fire and flash point. However, it has poor
oxidation stability and not suitable to be used in a free breathing transformer.
1.3.2. Mineral oil
Mineral oil is made from different types of hydrocarbons such as paraffins,
naphthenes, aromates and polyaromates as shown in Figure 1.1. Hydrocarbons of
paraffinic type display a straight chain or branched configuration, unlike the cyclic
form of the naphthenic compound, resulting in a considerable variation in chemical
properties [9]. Paraffinic structure is susceptible towards water and oxidation products
which could lead to the generation of sludge. However, it has a good viscosity index.
On the other hand, the naphthenic structure known as cycloalkanes has a good low
temperature property. The ring structure could be in 5, 6 or 7 carbons. Aromatic
molecules are ring structures with alternating double bonds. They are totally different
from paraffinic and naphthenic molecules, chemically and physically. Nearly all the
sulphur and nitrogen in oil are present in its aromatic structures. Aromates can be

Chapter 1 Introduction
23
present as both monoaromates and polyaromates. Polyaromates have several aromatic
rings directly adjacent to each other [10]. Most mineral oils are saturated hydrocarbons
where carbon atoms are connected by single C-C valence bonds. The saturated
compounds display better chemical stability than the corresponding unsaturated
compounds [9].
Figure 1.1 Hydrocarbons structure of mineral oil [10].
1.3.2.1. Mineral oil ageing mechanisms
Ageing of mineral oils are mainly subjected to oxidation. The result of oxidation could
lead to formation of different chemicals species, including aldehydes, ketones,
hydroperoxides and carboxylic acids.
Oxidation
Oxidation of mineral oil starts with the induction period where the hydrocarbon
molecule reacts with oxygen to produces the radical as shown in Figure 1.2. The
radical will react with oxygen to produce peroxide. The next stage is the propagation
period where the peroxide decomposes into hydroperoxide. The instantaneous products
of oxidation include alcohols and ketones, which are subjected to further degradation,
could form carboxylic acids, keto- and hydroxy-carboxylic acids. Other product from
the decomposition of ketones is aldehydes which eventually form resinous deposits by
complex condensation reactions. Generally, the final products of oxidation could be
classified into 2 types. The first type is soluble compounds which are acids and gases.
The second compounds include sludge and x waxes which are insoluble in mineral oil

Chapter 1 Introduction
24
[11]. The oxidation of mineral oil is influenced by fluid composition, temperature,
oxygen and catalyst metals such as copper and iron [9].
Figure 1.2 Oxidation of mineral oil [9].
1.3.3. Natural ester
Natural ester originated from glycerol and fatty acids which are known as triglycerides.
The fatty acid segments are composed of straight chains having an even number of
carbon atoms. This is the natural result of the biosynthesis of fats, where molecules are
built up to two carbons at one time. Figure 1.3 shows the typical structure of the
triglycerides molecule where the (R, R′, R″) groups consist of C8-C22 chains. Natural
ester used for transformer application is fatty acid ester triglycerides type. The fatty
acid components are linear chains 14-22 carbons long containing zero to three double
bonds [12].
Figure 1.3 Structure of trglyceride [12].

Chapter 1 Introduction
25
1.3.3.1. Natural ester ageing mechanisms
Natural ester could be subjected to either oxidation or hydrolysis due to the structure of
its molecule. In natural ester, the double C-C valence bonds could promote oxidation
while the single COOH valence bonds could introduce hydrolysis.
Oxidation
According to the previous findings [7, 13], oxidation starts with the induction period
where the carbon atom in natural ester reacts with oxygen to create free radical by the
loss of hydrogen atom [14]. The free radical reacts with oxygen and creates peroxide
radicals as shown in Figure 1.4. The propagation period starts once the peroxide
radicals decompose to create hydroperoxide. The final by-products of this reaction
include aldehydes and ketones. The reaction between radicals needs catalysts such as
iron or copper.
Figure 1.4 Oxidation of natural ester [13].
Hydrolysis
Hydrolysis of natural ester can take place in three stages where all of them are
reversible which can be seen in Figure 1.5. The first stage is the creation of diglyceride
formed by trglyceride interaction with water [15]. Once the diglyceride reacts with
water, it will create monoglyceride which will form into glycerol as final reaction
product. During all stages, fatty acid will be created as a by-product [7].

Chapter 1 Introduction
26
Figure 1.5 Hydrolysis of natural ester [15].
1.3.4. Effect of oil ageing to the paper degradation
Oxidation of mineral oil could generate water and acids such as LMA which could
accelerate the paper ageing [16-22]. The insoluble compound such as sludge could
accumulate and might block the flow of the oil which eventually could promote
hotspot and increase the rate of ageing of the paper [11].
On the other hand, it is shown that the ageing of paper in natural ester could be delayed
due to the water scavenging and hydrolytic protection [4]. However, natural ester has
low oxidation stability where, under extreme condition, the physical and chemical
properties could change and affect its performance as an insulating liquid [8].
1.4. Thesis outlines
The summary of each chapter in this PhD thesis can be seen as follows:
Chapter 1 Introduction
This chapter provides the general background of the work and the motivation of the
research. A general overview on the ageing of oil is summarized in this chapter.
Chapter 2 Literature review
This chapter gives detail overview on the ageing of paper. The latest knowledge on
paper ageing mechanisms, ageing by-products and ageing accelerators is summarized
together with techniques that can be used to assess the paper ageing condition.

Chapter 1 Introduction
27
Chapter 3 Methodology
This chapter describes the paper sampling procedure from transformers and detail
procedures for TI, LMA and HMA measurements. Several issues regarding the effect
of paper sample condition on TI measurement are also discussed in this chapter.
Chapter 4 Ageing Assessment of Paper through Tensile Strength Measurements
This chapter investigates the TI distribution profile in a transformer with phase,
winding and layer profiles taken into consideration. Analysis was carried out on a
transformer population and modelled using formulae obtained from previous literature.
Through this assessment, the end of life of transformers population is determined and
compared with the existing criterion in the standard. The relationship between
mechanical strength and dielectric strength is also determined under different condition
of oil.
Chapter 5 Ageing Assessment of Paper through Low Molecular Weight Acid
Measurements
This chapter discusses the effect of LMA and HMA on the dielectric strength of oil
and paper ageing. The LMA distribution profile among different phases, windings and
layers is described. The correlation between LMA and TI is examined based on
transformer population analysis. Through this finding, the TI prediction model based
on LMA in oil is proposed, using the knowledge obtained from the LMA/HMA in oil
and partitioning ratio of LMA in oil/paper.
Chapter 6 Ageing Assessment of Natural Ester
This chapter describes the performance of natural ester under high temperature
oxidation. The suitability of natural ester under sealed condition is also examined.
TAN, viscosity, LMA and HMA measurement are used for the ageing assessment of
natural ester. The effect of LMA and HMA on the paper ageing is examined as well as
its effect toward the breakdown voltage.
Chapter 7 Conclusions and Future Work
This chapter summarizes all the main findings in the PhD thesis and gives further
suggestions on the future work of ageing assessment of the mineral oil and natural
ester filled transformers.

Chapter 2 Literature review
28
CHAPTER 2. LITERATURE REVIEW
2.1. Introduction
Paper and pressboard are one of the basic insulation materials used in the oil filled
transformers. The good electrical and thermal properties are one of the advantages of
these materials. Paper is usually used to wrap the winding conductors. It is known that
under large oil gap, the breakdown could occur at a lower voltage due to the fact that
the probability of finding weakest spot will be high. This effect is also known as
volume effect [23]. Pressboard is used as spacer and barrier to divide the oil volumes
into smaller oil gaps in order to enhance the dielectric strength of oil gaps. The total
breakdown can be avoided if flashover occurs in an oil gap since the voltage is taken
by the rest of oil gaps [24].
Both paper and pressboard are made from cellulose. One of the drawbacks of cellulose
insulation is that the ageing is irreversible. As the paper ages, the transformer
performance could be affected. For example, local carbonising of the paper increases
the conductivity to cause overheating which leads to conductor fault and brittle paper
can break away from the winding and block the ducts [25, 26]. Furthermore, the by-
products of paper ageing such as water and acid also could accelerate the degradation
of the paper.
Another type of insulation material in the transformer is oil. Oil can provide dual
functions as cooling and electrical insulation medium within the transformers.
Conventionally, most of transformers are filled with mineral oil. Mineral oil is not
biodegradable and has low fire and flash points. Due to the increase of high fire safety
demand, alternative liquid such as natural esters are becoming available for
transformers.
It is important to monitor the condition of the paper to avoid catastrophic failure of a
transformer. Mechanical strength measurement is the best technique to determine the
ageing state of the paper since only this property is affected by ageing and not
electrical and other properties. However, it is impossible to obtain paper samples from
in-service transformers. Therefore, non-intrusive techniques are used to determine the

Chapter 2 Literature review
29
condition of the paper by measuring by-products of paper ageing from the oil such
Furanic Compound Analysis (FCA) and Dissolved Gas Analysis (DGA).
A review on the mechanisms and factors that could affect paper ageing is given in this
chapter. A study was conducted in order to examine techniques that can be used to
monitor the condition of paper ageing based on ageing by-products. The mechanisms
of oil ageing and its effect to the paper degradation are discussed in the last part of this
chapter.
2.2. Ageing of cellulose
2.2.1. Background
Cellulose consists of anhydro β-D-glucopyranose units linked to each other as shown
in Figure 2.1. The repeating unit of glucose ring in the structure is joined by the
glycosidic oxygen linkage which is one of the parameters that contributed to the
mechanical strength of the paper [27, 28]. This glucose ring is also connected together
through the hydroxyl groups to form a cellulose fibre.
Figure 2.1 Anhydro β-D-glucopyranose monomer units [29].
Insulation paper consists of 90% cellulose, 6-7% hemi-cellulose, lignin and pentosans
[26]. Alpha cellulose is normally used as the main cellulose content because it has a
high polymerization level of 2000. The strength of the paper will be affected if the
hemi-cellulose content is higher than 10 %. Lignin provides more rigid fibre bonding
for extra strength and flexibility [30].
Most of the insulation paper is made from softwood because it is more flexible and
stronger than hardwood [29]. Apart from that, softwood has much longer fibre than
hardwood. The structure of the fibre can be seen in Figure 2.2. Fibre is derived from
Chapter 2 Literature review
30
the multiple units of fibrils consisted of cellulose associated with amorphous and
crystalline region [18].
Figure 2.2 Fibre: macro and micro structure [29].
2.2.2. Cellulose insulation used in transformers
2.2.2.1. Insulation paper for normal purpose
Kraft paper
Kraft paper is made from unbleached softwood pulp by the sulphate process [8]. The
result of process will produce a paper that is slightly alkaline due to the existence of
the sulphate content. The process to produce paper differs according to the
manufacturer. The quality and reliability of the paper depend on the type of the
manufacturing process [8].
The general procedure starts by creating wood pulp mat from dried fibre. Next, large
amount of water was mixed with the wood pulp mat in order to remove any chemical

Chapter 2 Literature review
31
residuals and this procedure is known as repulping process. Refining is done by
crushing the fibre in the wet state which will result in ‘hydrogen bonding’ between
cellulose molecules [8]. In cellulose materials, hydrogen bonds usually form by
bonding of hydroxyl group (OH) bonds to an electronegative atom. In principle,
hydrogen bonds between fibers or between fibrils are not different with hydrogen
bonds between cellulose [31].Extensive cleaning of the refined fibre will remove any
chemical or physical residue that might exist during the refining process. The last step
is to direct the cellulose and water mixture to the rotating cylindrical machine to form a
paper. The density, thickness and moisture of the paper can be controlled by means of
heat and pressure as it progress to the rolls [8].
Cotton paper
Cotton paper is another alternative to Kraft paper. The manufacturing of cotton paper
for electrical purpose starts in 1930s and the source of cotton was obtained from waste
and offcuts from cotton cloths. However, this source is not used anymore since most of
cloths in recent years contain synthetic fibres and other materials. Cotton linters
obtained from cotton plant are now used as an alternative source for cotton paper
manufacturing. Cotton linters are obtained from the cotton plant fibre [8].
Cotton paper has longer fibre than Kraft paper but the intrinsic bond is not good. The
production cost of cotton paper is quite high due to the extra work for refining and
crushing processes. The performance of cotton paper could also be improved by
combining with Kraft fibre which has excellent electrical property. The result of this
process creates a paper which has good electrical and mechanical properties as well as
maximum oil absorption capability. [8].
2.2.2.2. Insulation paper for special purpose
Creped paper
One of the earliest special purpose papers is Creped paper. It is made by irregular close
crimp, which significantly increases its thickness and extensibility in machine
direction. It is usually used at the connection lead or on the electrostatic stress control

Chapter 2 Literature review
32
rings. Its extensibility enables the paper to be used on the irregular contour. The
disadvantage of the Creped paper is that it will lose its extensibility with time and may
cause some of the connection or joint wrapped by this paper becoming loose and not as
tight as when it was first applied [8].
Highly extensible paper
Highly extensible paper is one of the available alternatives for Creped paper. The
paper is made by adding elastic property during manufacturing process which gives
improved burst, stretch, and cross machines tear properties while retaining its electrical
and mechanical capability. This paper also could withstand rough condition and
wrinkling, which are perfect for winding subjected to high stress [8].
Thermally upgraded paper
Another type of special purpose paper is thermally upgraded paper. It is made by
adding stabilizers which improves its temperature stability and reduces thermal
degradation. Through this process, the OH groups in cellulose will link to the
cyanoethyl-ether groups which are shown in Figure 2.3. Another method is to add
weak organic bases such as dicyandiamide, urea, or melamine during manufacturing
processes to consume water and neutralize acids produce by oxidation of oil and paper
[18]. The main function of thermally upgraded paper is to slow down the ageing
process of the paper and increases the maximum operating temperature of
transformers [8].
Figure 2.3 Cyanoethylation of cellulose [32].

Chapter 2 Literature review
33
Diamond dotted paper
Diamond dotted paper is used for application where high mechanical strength is
needed. The paper is made by coating the normal Kraft paper with thermosetting resin
and curing the resin later in the process. The diamond dotted shape is obtained by pre-
coating the paper with two stages resin in a diamond pattern. The resin diamond dotted
creates a large bonding surface whilst ensuring that paper can be efficiently dried and
impregnated with oil [8].
2.2.2.3. Pressboard
Pressboard is another type of solid insulation, which is made by laying number of
papers together during the wet stage. The typical manufacturing process can be seen in
Figure 2.4. At the beginning, the manufacturing process is similar to paper
manufacture. The difference is at the end process where multiple layers of paper web
form are conveyed to the forming roll, instead on single layer, for manufacturing
pressboard [30]. Wet stage is a process where water is removed from cellulose/water
mixture by rotating cylindrical screen and creates paper web form. Dry stage is the
final process of pressboard manufacturing where the paper sheet is fed to a heavily
loaded steel rollers followed by drying means of heat [8]. Pressboard can be divided
into two categories:
Pressboard and presspaper without any adhesive [33].
Pressboard with adhesive and high thickness due to the number of individual
boards bonded together and known as laminated paper [34].

Chapter 2 Literature review
34
Figure 2.4 Manufacturing process of pressboard [30].
Pressboard and presspaper for electrical purpose is available in thickness up to 8 mm
and is generally used at thickness around 2 to 3 mm for inter-winding wraps and 4.5 to
6 mm for strips. On the other hand, laminated pressboard is available in thicknesses up
to 50 mm and is generally used for support. The material of both types of pressboard
are produced in three different methods [8]:
Calendered pressboard
This type of pressboard initially undergoes pressing at about 55 % water content. The
next step is the dry stage without pressure until it reaches 5 % of moisture level. The
final density of this pressboard is around 0.9 kg/dm³ to 1.0 kg/dm³ and further
compression will increase the density up to around 1.15 kg/dm³ to 1.3 kg/dm³ [8].
Mouldable pressboard
Mouldable pressboard does not undergo initial pressing such as calendered pressboard.
Instead of pressing, it goes directly for drying until the moisture reaches 5 % and gives
a soft pressboard which is good for oil impregnation and flexibility to be shaped if
necessary. The final density is much lower than calendered pressboard which is around
0.90 kg/dm³ [8].

Chapter 2 Literature review
35
Precompressed pressboard
Precompressed pressboard is made by combination of pressing and drying during the
wet stage. The process will create a pressboard that is strong and stable with a density
of 1.25 kg/dm³. This type of pressboard is preferred by most of the transformer
manufacturers nowadays because of its stability against thermal and mechanical stress
[8].
2.2.3. Paper ageing mechanisms
Ageing of oil and paper in transformers is a complex phenomenon and can be
influenced by many factors as described by Figure 2.5. It is shown that the ageing of
oil and paper could be accelerated by the presence of oxygen and water from external
surrounding. Thermal fault also could enhance the ageing of oil and paper. Other
source of ageing accelerator for paper could come from water, acids and oxygen
produced by ageing of the oil.
As the paper reaches the end of its life, fibres might break from the paper and are
dissolved in the oil. Fibres combined with metallic particles originated from the tank,
could initiate discharge in the oil which eventually led to arcing and sparking. The risk
of electromagnetic force, transient overvoltage, mechanical vibration and short circuit
force to the transformer will also be high once the paper of a transformer is degraded.
Water could reduce the resistivity and increase the dielectric loss of paper while
fibrous materials could align in the oil and provide pathways for short circuit between
conductors.
The aim of obtaining the knowledge of ageing of oil and paper is to prevent the
transformer from failing in-service by determining the current condition state. The
common approach is through analysis of ageing by-products which can be achieved
through DGA and FCA. DGA is mainly used for analyzing gases produced by faults
on oil and paper. On the other hand, FCA is a common method to analyze the ageing
state of paper since it is impossible to obtain paper while the transformer is still in-
service.

Chapter 2 Literature review
36
Figure 2.5 Factors that could influence oil and paper ageing in the transformer [26].
Laboratory ageing experiments have been conducted by previous researchers under
various conditions in order to study and understand the mechanisms of paper ageing.
The summary of the work can be seen in Table 2.1.
Table 2.1 Previous ageing experiments.
Author Temperature
and type of
oil/paper
Type
of
test
Main findings and
conclusions
Comments
Shroff
[35]
110 °C,
120 °C,
130 °C and
140 °C
(MO, KP and
TUP)
DP,
TS,
FCA,
DS
and
MC
Proposed the paper end of
life based on the criteria:
o DP equal to 250
o TS equal to 50 % of
its strength.
Demonstrated the
relationship between DP
and water/furanic
compounds.
Demonstrated that ageing
has small effect on the
paper dielectric strength.
DP is the
common
method for
determining
the ageing of
paper.
Only few used
TS and it is
commonly
used for
analyzing
laboratory

Chapter 2 Literature review
37
Yoshida
[36]
100 °C,
110 °C,
120 °C and
160 °C
(MO, KP and
PB)
DGA,
TS,
DP
and
DS
Demonstrated the
relationship between CO)/
CO2 and DP/TI.
Demonstrated that ageing
has no effect on the
breakdown voltage of
paper.
aged paper.
The approach
of this research
is to analyze
the ageing of
paper obtained
from scrapped
transformers
by TS.
In addition, the
end of life of
transformer
population is
determined
based on TS.
FCA and DGA
are the
common non-
intrusive
method used
for analyzing
the ageing of
paper.
In this
research, it is
propose to use
LMA as an
additional
paper ageing
assessment
tool.
Moreover, a TI
prediction
model based
on LMA is
proposed.
Morais
[37]
125 °C,
140 °C and
155 °C
(MO and KP)
DP,
DGA,
FCA
and
MC
Demonstrated the
relationship between DP
and CO/furanic
compounds/water
Hill [38-
40]
129 °C,
138 °C,
153 °C and
166 °C
(MO and KP)
MW,
TS,
DP
and
FCA
Demonstrated that ageing
of paper could be
represented by MW
measurement.
Introduced the paper
degradation model based
on TS where the
activation energy for TS
is almost similar to MW
(76 kJ/mole and 79
kJ/mole).
Described the relationship
between furanic
compounds and DP/ TI.
Lessard
[41]
150 °C,
200 °C and
250 °C
(MO, KP and
TUP)
Sugar
and
FCA
Suggested that sugar
(cellobiose) can be used
to monitor the ageing of
paper and is more stable
than furanic compounds.
Levchik
[42]
70 °C to
160 °C
(MO and KP)
FCA,
DGA,
MC
and
DP
Demonstrated that
significant amount of
furanic compounds,
water, CO and CO2
occurs once there is a
large reduction of DP.

Chapter 2 Literature review
38
Gasser
[43]
120 °C,
135 °C and
150 °C
(MO, KP and
TUP)
DP
and
TS
Suggested that Weidmann
paper degradation model
[22], requires required
less data for fitting of
experiment data [28, 44].
Emsley
[20, 25,
44-46]
120 °C,
140 °C,
160 °C and
180 °C
(MO, KP and
CP)
DP,
TS
and
FCA
Suggested that ageing of
paper in transformers is
mainly dominated by
hydrolysis with a
common activation
energy value of 111
kJ/mole.
Demonstrated that fast
increment of furanic
compounds occurs at DP
around 400 and the
concentration starts to
reduce at DP around 200.
Introduced the paper
degradation model based
on TS and its relationship
with DP.
McShane
[3-5, 47]
130 °C,
150 °C and
170 °C
(MO, NE, KP
and TUP)
DP,
TS
and
MC
Suggested that the ageing
rate for paper aged in
natural ester is lower than
in mineral oil.
Proposed mechanisms of
protection provided by
natural ester to the paper:
o Water scavenging –
Water removal from
paper by natural ester.
Water has significant
effect on the paper
ageing.
o Hydrolytic protection
– Water is consumed

Chapter 2 Literature review
39
by hydrolysis of
natural ester.
Thomas
[48]
85 °C,
100 °C and
115 °C
(MO and KP)
DP,
TS,
DS
and
FCA
Verify previous findings
on furanic compounds as
a non-intrusive technique
to monitor ageing of
paper.
Mirzae
[49]
140 °C,
150 °C and
160 °C
(MO and KP)
TS
and
DGA
Introduced the
degradation model based
on TI according to power
exponential law.
Verma
[50]
120 °C,
140 °C and
160 °C
(MO and KP)
TS Demonstrated that for
multilayer insulation
(several layers of paper
wrapped around same
conductor), outer layer
paper is more affected by
ageing than inner layer
paper.
Demonstrated that
thermal stress has greater
effect than electrical
stress on accelerating the
ageing of paper.
Luundgard
[16-18]
70 °C,
90 °C,
110 °C and
130 °C
(MO, KP and
TUP)
DP,
TS,
LMA
and
HMA
Demonstrated that
hydrolysis of paper is
catalyzed by dissociation
of acids.
Introduced acids
generated by oil and paper
ageing can be LMA and
HMA.
Demonstrated that LMA
has more significant
effect on paper ageing
than HMA.

Chapter 2 Literature review
40
Liao [2] 90 °C,
110 °C and
130 °C
(MO, NE, KP
and TUP)
DP,
MC
and
FCA
Demonstrated that ageing
of paper in natural ester
follows the paper
degradation model
proposed by Emsley [44].
Suggested that most of
acids produced by ageing
of natural ester are HMA.
MO= Mineral Oil, NE= Natural ester, KP= Kraft Paper, TUP= Thermally Upgraded Paper, PB=
Pressboard, CP= Cotton Paper, DP= Degree of Polymerization, TS= Tensile Strength, TI= Tensile
Index, MC= Moisture Content, MW= Molecular Weight, LMA= Low Molecular Weight Acids, HMA=
High Molecular Weight Acids, DGA= Dissolved Gas Analysis, FCA= Furanic Compound Analysis,
DS= Dielectric Strength, CO= Carbon Monoxide, CO2= Carbon Dioxide
According to several studies [18, 27, 29, 35, 51], paper degradation mechanisms can
be oxidation, hydrolysis and pyrolysis. Oxidation mechanism dominates at
temperatures less than 60 °C while hydrolysis initiates at a temperature region from 60
°C to 150 °C and pyrolysis dominates at high temperature usually over 150 °C [52].
Oxidation, hydrolysis and pyrolysis can be differentiated by looking into the activation
energies. Activation energy can be calculated by Equation (2.1) known as the
Arrhenius equation.
-E
RT
t 0
1 1- = k×t = Aexp ×t
DP DP (2.1)
Where DPt = Current Degree of Polymerization (DP)
DP0 = Initial DP
k = Ageing rate
A = Pre exponential factor
E = Activation energy (kJ/mole)
R = Molar gas constant (8.314 J/mole/K)
T = Temperature (K)
t = Ageing duration (hours)

Chapter 2 Literature review
41
The value of the pre exponential factor is dependent on the environment condition.
Activation energy is used to describe how fast the ageing rate changes with
temperatures [35]. The steps to obtain activation energy and pre exponential factor are
described below:
First, calculate the ageing rate, k for different ageing temperatures based on DP
as shown in Figure 2.6 a).
Next, plot ln k against 1/T. Through regression analysis, the activation energy
and pre exponential factor can be calculated as shown in Figure 2.6 b).
a) b)
Figure 2.6 Procedures to obtain a) ageing rate, k and b) activation energy, E and pre
exponential factor, A. Calculation made based on Lundgaard’s data, Kraft paper with 3
% in weight water content (Thermo 70) and mineral oil (Nynas Nytro 10X) are sealed
without air and aged at 70 °C, 90 °C, 110 °C and 130 °C.
The typical activation energy obtained from laboratory accelerated ageing experiments
for both oxidation and hydrolysis can be seen in Table 2.2 [27, 53], it was found that
oxidation is promoted by oxygen and copper while hydrolysis is catalyzed by acids
and water. On the other hand, pyrolysis is promoted by high temperature. Based on
Lessard’s data [41], it was found that the activation energy for pyrolysis is around 82
kJ/mole which is lower than hydrolysis. It is suggested that the ageing temperature is
not high enough to increase the activation energy. According to survey study by
Emsley [27], for cellulose aged under vacuum or air, the pyrolysis activation energies

Chapter 2 Literature review
42
range from 110 kJ/mole to 170 kJ/mole at temperature between 200 °C and 380 °C.
Above 380 °C, the activation energy could increase to 225 kJ/mole.
Table 2.2 Activation energy for oxidation and hydrolysis [27, 53].
Ageing
mechanism
Activation energy
(kJ/mole)
Oxidation 74
Hydrolysis 111
Figure 2.7 shows the sketch of ageing rates to different ageing mechanisms. It is
observed that the ageing rate is influenced by both activation energy and
environmental factor for each given temperature.
Figure 2.7 Arrhenius plot under different ageing mechanisms [54].
2.2.3.1. Oxidation
Oxidation will be started once the hydroxyl groups in cellulose structure are attacked
by oxygen which weakened the glycosidic linkage. Through oxidation, carbonyl and
carboxyl groups will be created as secondary ageing products while moisture as
primary ageing products and these groups will promote hydrolysis in paper and oil as
seen in Figure 2.8 [27, 35, 51]. Carbonyl group (CO) consists of carbon atom (C)
double bonded with oxygen atom (O) while carboxyl group composes of combination

Chapter 2 Literature review
43
of carbonyl and hydroxyl groups (OH) as shown in Figure 2.9. Carbonyl is also known
as an aldehyde group and carboxyl as a carboxylic acid group.
Figure 2.8 Oxidation mechanism on cellulose [51].
Figure 2.9 Carboxyl and carbonyl groups [55].
2.2.3.2. Hydrolysis
Hydrolysis is known as the main paper ageing mechanism in transformers. The process
will promote glycosidic scission of cellulose chains and creates free glucose rings as
shown in Figure 2.10. The several stage of hydrolysis of free glucose rings will result
in formation of furanic compounds such as 2-furaldehyde and 5-
hydroxymethylfuraldehyde as shown in Figure 2.11 [18, 51, 56].
Figure 2.10 Hydrolysis mechanism on cellulose [51].

Chapter 2 Literature review
44
Figure 2.11 Mechanism of furanic compounds formation through hydrolysis [56].
2.2.3.3. Pyrolysis
Pyrolysis is initiated if a transformer’s operating temperature is high. It is proposed
that 140 °C as the minimum temperature limit for the pyrolysis to take place for pure
cellulose [57]. According to other literature, it is suggested that pyrolysis takes place
at temperature higher than 150 °C [52]. Glycosidic scission will start to take place
through pyrolysis and at the same time opening of the glucose rings as shown in Figure
2.12 [27, 35, 51]. The result of this process will create moisture and gases such as
carbon monoxide/carbon dioxide.
Figure 2.12 Pyrolysis mechanism on cellulose [51].
2.2.3.4. Ageing mechanisms in transformers
Several studies have suggested acid catalyzed hydrolysis as a major mechanism of
paper ageing in operating transformers [18, 57, 58]. According to Figure 2.13, the
overall degradation process started with the generation of hydrogen peroxide created
from the interaction of metal cations such as Cu+/Cu
2+ or Fe
+/Fe
2+, water, oxygen and

Chapter 2 Literature review
45
heat. Decomposition of this compound will create Hydroxy (HO) radicals which will
catalyze the oxidation of oil and paper.
Figure 2.13 Ageing mechanism of paper in transformers.
Through oxidation, water, carbonyl group and carboxyl group known as carboxylic
acids known as will be generated [16, 17, 19]. There are two types of carboxylic acids
which are Higher Molecular Weight Acid (HMA) and Lower Molecular Weight Acid
(LMA). Dissociation of specific acids such as LMA will generate H+ ions and catalyze
the hydrolysis of the paper. Water does help in dissociation process of LMA by
increasing the number of H+ ions available in the system. It was found that hydrolysis
will become the main mechanism in the system once the environment becomes acidic
due to the reduction in oxidation [18]. The process will be repeated since it is an auto
catalytic process [58].
Oxidation
in oil and
paper
Oxygen
Metal
cations
(Cu+/Cu
2+
or
Fe+/Fe
2+)
Water
Acid
High molecular
weight acids
Low molecular
weight acids
Hydrolysis in paper
Dissociated carboxylic acids
H+ ions
HO
radicals
Decomposition
of hydrogen
peroxide
Water
Hydrogen
peroxide
Heat
+
Auto catalytic
process where
hydrolysis will
continue with
dissociation of
LMA
Dominant

Chapter 2 Literature review
46
2.2.4. Paper ageing accelerators
According to Figure 2.13, degradation process of paper is mainly influenced by the
presence of water, oxygen, and acids.
2.2.4.1. Water
The rate of degradation for paper with 4 % water content in weight is 20 times higher
than that of dry one [20, 21]. An example of the effect of water on ageing rate can be
seen in Figure 2.14. The ageing experiment was conducted at different temperatures
ranging from 60 °C to 130 °C and the initial paper water content was controlled to 0.47
%, 1.11 % and 1.92 % by weight [59]. It is shown that the ageing rate, k increases as
the initial paper water content increases from 0.47 % to 1.92 %.
Figure 2.14 Effect of water on paper ageing. Kraft paper (Clupak HD75) and mineral
oil (Nynas Nytro 10CX) are sealed under air and aged from 60 °C to 120 °C [60].
2.2.4.2. Oxygen
The rate of ageing will be reduced by a factor of 16 if oxygen in the system can be
reduced from 2000 ppm to 300 ppm [20]. Other studies show that the presence of
oxygen can increase the rate of ageing by a factor of 2.5 for paper having 0.3 to 5 %
water content [20, 61]. The rate of ageing will further increase with the existence of
copper which could accelerate the oxidation of the paper [20, 22]. An example of the

Chapter 2 Literature review
47
effect of oxygen on the ageing rate is shown in Figure 2.15. In order to monitor the
effect of different amount of oxygen present during ageing, different oxygen pressures
were applied above the oil surface in the bottles. The bottles were re-pressurized at
certain interval (initially once per day and later less frequent) in order to maintain the
pressure throughout the ageing experiment. It can be seen that the rate of ageing, k
increases with the increasing oxygen.
Figure 2.15 Effect of oxygen on paper ageing. Kraft paper (Thermo 70), mineral oil
(Nynas Nytro 10XN) and copper are sealed with different oxygen pressures and aged
at 90 °C, 110 °C and 130 °C [53].
2.2.4.3. Combination of water and oxygen
At low temperature, the combination of water and oxygen could actually reduce the
rate of paper ageing. It was proposed that the hydrogen bonding between water and
oxygen could create ‘shielding effect’ which reduces the reaction between water and
cellulose [20]. At the working temperatures of a transformer, the inhibiting effect of
the oxygen could be stronger and increasing the oxygen content in the oil could
actually reduce the rate of paper ageing by preventing the water in oil from migrating
to the paper [20].

Chapter 2 Literature review
48
2.2.4.4. Acids
The rate of paper degradation depends on the dissociation rate of the acids [18]. The
dissociation rate depends on the ability of specific acid such as LMA to dissociate
[17]. The dissociated acid increases the H+ concentration in the system and accelerates
the depolymerization process of the paper. An example of the effect of acids on the
ageing rate is shown in Figure 2.16. Water could help to increase the concentration of
H+ by causing the carboxylic acids to dissociate [18].
Figure 2.16 Effect of LMA on paper ageing under wet condition. Kraft paper (Thermo
70) and mineral oil (Nynas Nytro 10X) containing LMA and HMA are sealed without
air and aged at 70 °C, 90 °C, 110 °C and 130 °C [17].
2.2.5. Paper ageing products
2.2.5.1. Water
One of the main products of paper ageing is water. According to Figure 2.13, water
could be generated by oxidation and hydrolysis and the production is an auto-catalytic
process. According to the previous finding, it is shown that the main source of water
generation is originated from paper and not from oil [59]. Water is the result of chain
scission of cellulose molecule as shown in y-axis of Figure 2.17 [54]. It was found that
DP will be reduced to half each time water content in paper is increased by 0.5 % due
to the chain scission of cellulose molecule [20-22].
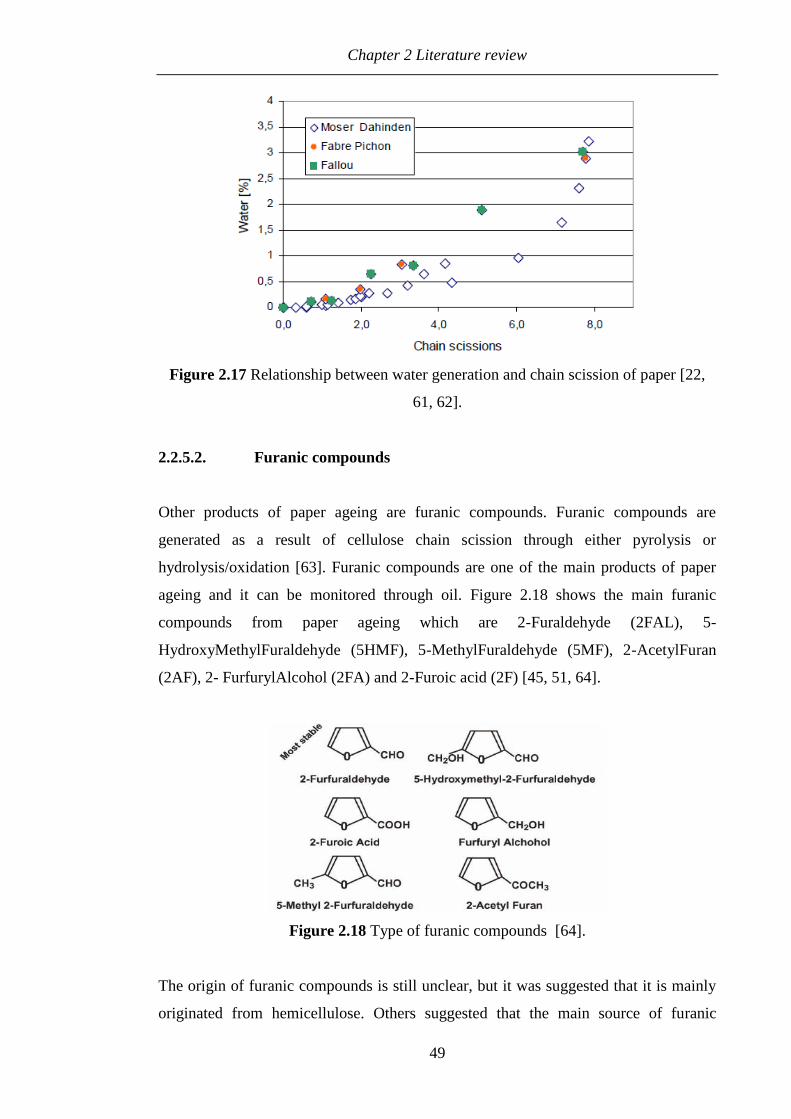
Chapter 2 Literature review
49
Figure 2.17 Relationship between water generation and chain scission of paper [22,
61, 62].
2.2.5.2. Furanic compounds
Other products of paper ageing are furanic compounds. Furanic compounds are
generated as a result of cellulose chain scission through either pyrolysis or
hydrolysis/oxidation [63]. Furanic compounds are one of the main products of paper
ageing and it can be monitored through oil. Figure 2.18 shows the main furanic
compounds from paper ageing which are 2-Furaldehyde (2FAL), 5-
HydroxyMethylFuraldehyde (5HMF), 5-MethylFuraldehyde (5MF), 2-AcetylFuran
(2AF), 2- FurfurylAlcohol (2FA) and 2-Furoic acid (2F) [45, 51, 64].
Figure 2.18 Type of furanic compounds [64].
The origin of furanic compounds is still unclear, but it was suggested that it is mainly
originated from hemicellulose. Others suggested that the main source of furanic

Chapter 2 Literature review
50
compounds is from levoglucosans and glucose [56]. Through pyrolysis, levoglucosans
will be created as a result from opening of the glucose rings and decomposed into
5HMF which give 2FAL as a final product [56]. On the other hand, the formation of
furanic compounds through hydrolysis/oxidation starts with the formation of glucose
through hydrolysis of cellulose as shown in Figure 2.19. The glucose will oxidize to
become pentose and gives 2FAL as the end product.
Figure 2.19 Formation of 2FAL through hydrolysis/oxidation mechanisms.
2.2.5.3. Gases
Oil and paper ageing could create different type of gases and two of them are Carbon
Monoxide (CO) and Carbon Dioxide (CO2) [59, 65, 66]. These gases could be formed
through oxidation and pyrolysis [51, 67]. Figure 2.20 shows an example of CO and
CO2 generations with ageing duration at different temperatures. It is shown that except
for 140°C, the amount of CO and CO2 generated from the ageing of oil and paper
increase slowly until 6 months and saturate at the later stage of ageing. Yoshida [36]
explained that at the initial stage of ageing, a part of cellulose is easily dissociated and
contributes to the increment of CO and CO2 as shown in Figure 2.21. At the later
stage of ageing, most part of the cellulose left is rigid and dissociates slowly. However
at 140 °C, the rigid part of cellulose is also consumed at the initial stage of ageing and
contributes to the high amount of CO and CO2. The less rigid part of cellulose is
known as amorphous and the rigid region is known as crystalline [18].
Cellulose Hexose
(Glucose)
Pentose
(Arabinose) 2-FAL
Hydrolysis Oxidation
-CO
-CO2

Chapter 2 Literature review
51
Figure 2.20 Generation of CO and CO2 at different temperatures. Paper, mineral oil,
steel, and aluminium are sealed without air and aged at 100 °C, 110 °C, 120 °C and
140 °C [36].
Figure 2.21 Relationship between tensile strength/degree of polymerization and
CO/CO2. Paper, mineral oil, steel, and aluminium are sealed without air and aged at
100 °C, 110 °C, 120 °C and 140 °C [36].
2.2.5.4. Acids
Acids are known as a common product for oil and paper ageing in a transformer. Acids
could be generated from both oil and paper through oxidation/hydrolysis mechanisms
[16, 17]. An example of acids generated from oil and paper ageing can be seen in
Figure 2.22. Recently it is shown that ageing of oil and paper could generate two types
of acids known as LMA and HMA [16, 17, 19]. These acids can be differentiated

Chapter 2 Literature review
52
through its molecular weight where the value ranging from 46 g/mol to 116 g/mol for
LMA and 240 g/mol to 285 g/mol for HMA. Most of LMA tends to stay in paper while
most of HMA tends to stay in the oil.
Figure 2.22 Acids generation for Kraft and thermally upgraded paper. Kraft paper,
thermally upgraded paper, mineral oil and copper are sealed without air and aged at 90
°C, 110 °C and 130 °C [2].
2.2.5.5. Methanol
Methanol is another product of paper ageing. It was proposed that methanol originated
from the glycosidic scission of cellulose chain [68]. The result of methanol production
from the cellulose chain scission can be seen in y-axis of Figure 2.23 a). The ageing
experiment was conducted at different temperatures ranging from 60 °C to 130 °C and
the initial paper water content was controlled to 0.47 %, 1.11 % and 1.92 % in weight
[68]. It was found that the relationship between methanol and chain scissions is almost
linear. The calculation of activation energy shows that the value obtained for methanol
production (106.9 kJ/mole) is in agreement with reduction of DP (103.5 kJ/mole) [60].
Methanol is more sensitive than furanic compounds. Figure 2.23 b) shows that the
furanic compounds increase slowly up to chain scissions equal to 2 (DP equals to 400)
and increases exponentially up to 100 mg/kg [68]. The result indicates that furanic
compounds are less sensitive at a DP range from 1200 to 400 while methanol does not
have this limitation.

Chapter 2 Literature review
53
The production of methanol is not affected by the initial paper water content and the
concentration is stable up to 130 °C [68]. There is a partitioning of methanol between
oil and paper where most of the portion tend to stay in paper similar to furanic
compounds [60].
a) b)
Figure 2.23 Relationship between a) methanol (CH3OH) and b) furanic compounds
(2FAL) and chain scission (NS). Kraft paper (Clupak HD75) and mineral oil (Nynas
Nytro 10CX) are sealed under air and aged from 60 °C to 120 °C [68].
2.2.6. Paper ageing assessment techniques
2.2.6.1. Degree of polymerization
DP of paper can be measured using Ubbelohde viscometer tube as shown in Figure
2.24. The first step of the measurement is to measure the viscosity of paper and
Cupriethylene-diamine (Cuen) mixture and the next step is to calculate the specific
viscosity, vs based on the measured viscosity using Equation (2.2).
s
viscosity of paper and Cuen mixture - viscosity of Cuenv =
viscosity of Cuen (2.2)

Chapter 2 Literature review
54
Figure 2.24 Ubbelohde viscometer tube.
Intrinsic viscosity, v can be obtained based on the specific viscosity and concentration
of the solution based on Equation (2.3).
s
c 0
vv = lim
c
(2.3)
where c = Concentration of paper and Cuen.
The last step is to calculate the DP based on intrinsic viscosity using Equation (2.4)
[69].
α
v[v] = KDP (2.4)
Where K and α = Mark Houwink constant ( 0075.0K and 1 ).
vDP = Average degree of polymerization.

Chapter 2 Literature review
55
The measurement of DP can be affected by several factors [25, 70].
The choice of Mark Houwink constant to convert intrinsic viscosity to DP.
Oxidation of the sample could affect the DP measurement. This can be avoided
by storing the solution under nitrogen.
Sample degradation in the viscometer tube which can be avoided by using
slower efflux time.
2.2.6.2. Tensile strength
Paper derived its strength from the fibre strength and inter-fibre bonding strength [71].
Tensile Strength (TS) can be described by stress and strain curve as shown in Figure
2.25. Machine Direction (MD) is defined as the direction in which the paper moves
during manufacture while Cross Machine Direction (CD) is the direction at right
angles to the machine direction. Paper in MD is stronger but less flexible than in CD.
Paper obtained from scrapped transformers usually is measured in MD. TS can be
measured in two ways which are known as long and zero span measurement. Long
span measurement is also known as “wide span” measurement in electrical insulation
research paper.
Figure 2.25 Stress and strain behaviour in two directions: MD (Machine Direction)
and CD (Cross Machine Direction) [71].

Chapter 2 Literature review
56
a) Long span tensile strength
The first method is called long span TS which is known as measurement of paper inter
fibre bonding strength [46]. The test setup can be seen in Figure 2.26 where paper is
placed between two clamps. The upper clamp will move to break the paper and the
force is automatically recorded by the measuring unit.
Figure 2.26 Long span TS setup.
According to standards, BS 4415 and BS 1924 [72, 73], the gap distance and width of
sample required for tests are about 180 mm ± 1 mm and 15 mm ± 0.1 mm. Tensile
strength, TS can be obtained using Equation (2.5).
F
TS = w
(2.5)
where F = Maximum load (N).
w = Width (m).
Long span Tensile Index (TI) is preferred for comparing different types of paper since
it is independent of the grammage of paper. Grammage can be calculated by dividing
the weight with the cross area of the paper. Long span tensile index, TI can be
calculated using Equation (2.6).
Gap between
two clamps
Upper clamp
(moveable)
Lower clamp
(stationary)
Paper
samples
Force

Chapter 2 Literature review
57
TSTI =
g (2.6)
Where g = Grammage (g/m²).
b) Zero span tensile strength
The second method of TS measurement is zero span TS. It is known as a measure of
paper fibre strength itself since no gap is present between the clamps [46]. The test
setup can be seen in Figure 2.27 and the width of the tested paper can be varied from
15 mm to 25 mm ± 0.1 mm [74].
Figure 2.27 Zero span tensile tester.
The calculation of zero span TI is based on failure load, FL which can be obtained
from Equation (2.7).
0
FL = K(P-P ) (2.7)
P = Observed pressure at failure (psi).
P0 = Equipment ‘Zero’ pressure (psi).
K = 0.422 (kg/psi).
No gap between
two clamps
Left clamp
(moveable)
Right clamp
(stationary)
Paper samples in the
middle of both clamps
Force

Chapter 2 Literature review
58
The observed psi can be read manually from the equipment once the paper has broken.
Once the FL has been obtained from Equation (2.7), the breaking length, BL can be
calculated using Equation (2.8).
FL
BL = w×g
(2.8)
Finally, zero span tensile index, TI can be calculated using Equation (2.9) below where
9.81 is known as the specific gravity.
TI = 9.81×BL (2.9)
2.2.6.3. Furanic compound analysis
One of the non-intrusive techniques that could be used to monitor the condition of the
paper is furanic compound analysis. According to previous finding, it is shown that
there is a relationship between furanic compounds and DP which is described by
several models [75-77]. Generally, furanic compounds in transformer oil are
determined through High Performance Liquid Chromatography (HPLC). Furanic
compounds could also be measured from paper through extraction with methanol [42,
78]. The basic operation of HPLC system can be seen in Figure 2.28.
Figure 2.28 Basic HPLC system.
Solvent
UV
detector
Waste
HPLC Column
Injector
Pump
Sample will be
injected here
Furan compound
will be detected here
Sample will be
eluted here
PC

Chapter 2 Literature review
59
The first step of the measurement is to extract the furanic compounds from the oil
sample. Solid-liquid and liquid-liquid extraction is known as the common method for
extraction [79]. After the extraction process, it will be analyzed by HPLC where it will
be eluted into specified column and detected via a UV detector.
The condition of transformers could be determined based on the information obtained
from furanic compounds. According to previous in-service transformer experience, it
was suggested that specific furanic compounds could be generated based on individual
events in the transformer as shown in Table 2.3.
Table 2.3 Causes for specific furanic compounds [80].
Compound Observed event
5HMF Oxidation
2FA High moisture
2FAL General overheating or normal ageing
2AF Rare, cause not fully defined
5MF High temperature
Monitoring furanic compounds in a transformer presents a great challenge since it
could be affected by many factors such as [65, 81-85]:
Design of transformer
Type of transformer
Type of paper
Moisture content of the paper
Type and ageing state of oil
Operating condition (overloading)
Oil change and reclamation
Instability at high temperature
The final concentration of furanic compounds is an equilibrium state from
formation to decomposition

Chapter 2 Literature review
60
2.2.6.4. Dissolved gas analysis
Dissolved Gas Analysis (DGA) is known as a common technique to identify faults in
the transformers. Based on previous research, DGA could also be used to describe the
ageing of paper based on dissolved CO and CO2 in oil. It is found that these gases
could be correlated with DP and TS of paper [36]. Conventionally, gases are detected
from oil using a technique called Gas Chromatography (GC) and the working principle
is similar to HPLC. The basic configuration of GC system can be seen in Figure 2.29.
Figure 2.29 Basic GC system.
Firstly, gases are extracted from the oil sample using methods suggested in the
standard, BS 60567 [86]. There are four methods that can be used for gases extraction
which are:
Multi-cycle vacuum extraction using Toepler pump apparatus.
Vacuum extraction by partial degassing method.
Stripping extraction method.
Head space method.
Once gases are extracted from the oil sample, it will be eluted by the GC column and
detected by Flame Ionization Detector (FID) and Thermal Conductivity Detector
(TCD). FID is used to detect compounds with high carbon concentration while TCD is
used for all other compounds. There are some difficulties on interpreting the CO and
Carrier gas
FID and TCD
detector
Waste
GC Column
Injector
Sample will be
injected here
Gases compound
will be detected here
Sample will be
eluted here
PC

Chapter 2 Literature review
61
CO2 from in-service transformers since it can be produced from oil, layer of paint,
varnish and phenolic resins [54]. CO2 also could be introduced from atmosphere
especially for a free breathing transformer. CO2/CO ratio is proposed as a method to
identify the ageing of paper. According to standard, BS 60599 [87], it was proposed
that ratio higher than 3 is defined as normal ageing and less than 3 as fault involving
excessive paper degradation.
2.3. Summary
Ageing of cellulose insulation such as paper is mainly influenced by water, acids and
oxygen. In transformers, these products are originally formed from oxidation of
mineral oil and will be produced even further from paper ageing through autocatalytic
process. It is found that the main ageing mechanism of paper in a transformer is
dominated by acid hydrolysis. Through dissociation of specific acid such as LMA, H+
ions are generated and accelerate the hydrolysis of the paper. The rate of LMA
dissociation could be controlled by water.
As paper ages, the risk of transformer failure will increase. Thus, it is important to
monitor the condition of the paper. One of the techniques is by monitoring the paper
ageing by-products. Water, acids, furanic compounds, CO, CO2 and methanol are
among by-products generated by ageing of paper. The common compounds usually
monitored are Furanic compounds and CO/CO2. Recently, it is shown that methanol
also could be a good candidate for paper ageing indicator.
Ideally, the best way to analyze the condition of the paper is through DP or TS.
However, it is impossible to obtain paper samples from in-service transformers and the
only opportunity is through scrapping transformers. In this research, paper samples
were obtained from scrapped transformers. Ageing assessment of scrapped transformer
paper based on tests such as TS, LMA and AC breakdown voltage is discussed in this
thesis. Laboratory experiments are also conducted in order to support assessment of
scrapped transformer paper.

Chapter 3 Methodology
62
CHAPTER 3. METHODOLOGY
3.1. Introduction
Mechanical strength is a common parameter used for assessing the ageing status of
paper. Tensile Strength (TS) can be measured either in long or zero span although in
electrical insulation research papers, long span TS is often written also as TS “wide
span” measurement. It was reported from previous work [46] that the main factor for
tensile strength reduction of paper is due to the loss of inter-fibre bond strength and
long span TS is known as the best way to represent this parameter. There are several
issues such as paper size and condition that need to be addressed when measuring long
span TS of scrapped transformers paper samples.
Based on previous findings, acids in transformers can be split to Low Molecular
Weight Acid (LMA) or High Molecular Weight Acid (HMA) [16, 17, 19]. It was also
shown that paper could contain acids which are mainly LMA. Due to the polar nature
of LMA, a technique based on water extraction was proposed to measure LMA and
HMA in paper and oil [19].
The first section of this chapter explains the procedure for sampling paper from
scrapped transformers. A study was conducted to examine the factors that could affect
the TS measurements of scrapped transformers paper samples. The process to measure
LMA and HMA content in paper and oil is presented in the next section. The last
section describes the pre-processing of oil and paper samples for ageing experiments.
3.2. Paper sampling procedure from scrapped transformers
3.2.1. Phase and winding profile
Most of the transformers in the UK are of the core type design, and they can be further
categorized as three limbs or five limbs. Core type transformers have their core limbs
concentrically wound by winding as shown in Figure 3.1 a). The arrangement of
windings in a transformer is shown in Figure 3.1 b). The closest winding to the core is
normally a tertiary winding (TV) followed by a low voltage winding (LV) and a high

Chapter 3 Methodology
63
voltage winding (HV). For economical reasons, an autotransformer is mainly used for
the high voltage transmission system. Generally, the connection is made by letting the
LV winding to be the common mainly shared with the HV winding. Through this
connection, the LV winding is also called the common winding (CW) and the rest of
the HV winding becomes the series winding (SW). Almost all transformers used for
ageing analysis in this thesis are autotransformers.
Figure 3.1 Sampling procedure for a) Phase and b) Winding profiles.
The first step of the procedure, once a transformer is taken out from service for
scrapping, is to measure the oil properties such as acids, interfacial tension, furanic
compounds and dielectric properties. The next step is to remove the oil from
SIDE VIEW
Phase A Phase B Phase C
TOP VIEW
FRONT VIEW
CORE
WINDING
HV (SW)
LV (CW)
TV
a)
Core TV HV
(SW)
Inner Outer Top
Centre
Bottom LV
(CW)
b)
5 LIMBS (CORE
TYPES)
INSIDE VIEW – FROM FRONT VIEW
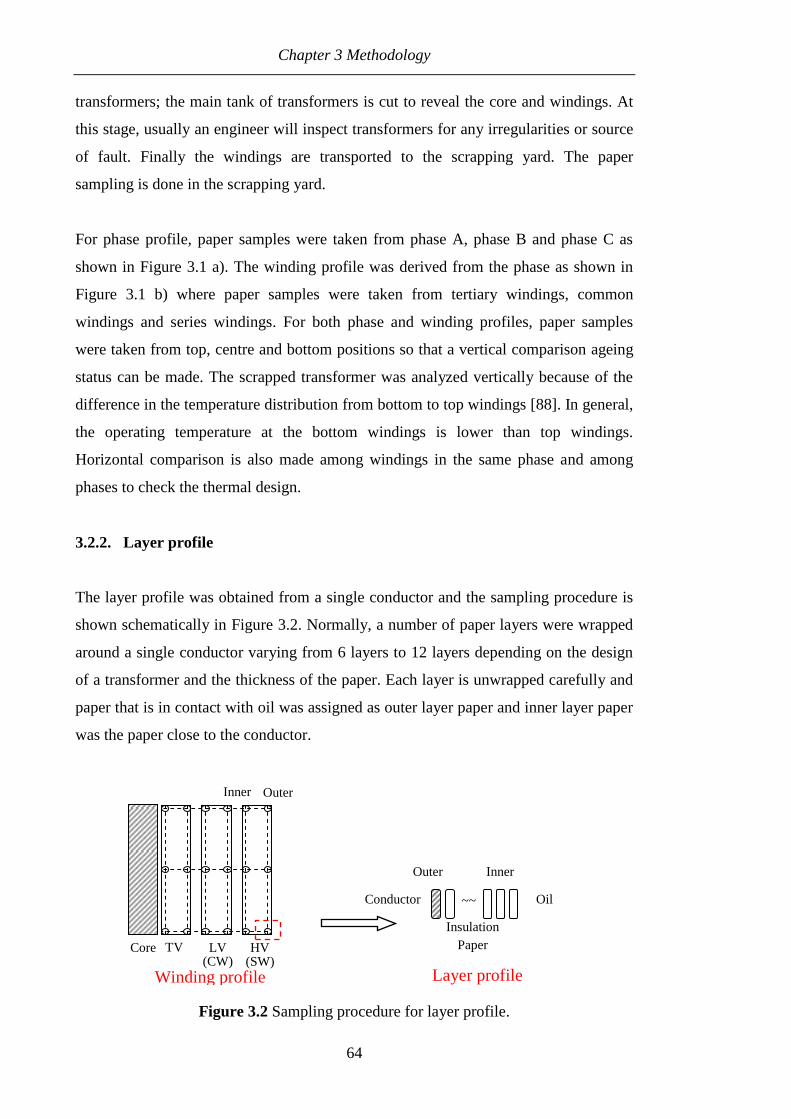
Chapter 3 Methodology
64
transformers; the main tank of transformers is cut to reveal the core and windings. At
this stage, usually an engineer will inspect transformers for any irregularities or source
of fault. Finally the windings are transported to the scrapping yard. The paper
sampling is done in the scrapping yard.
For phase profile, paper samples were taken from phase A, phase B and phase C as
shown in Figure 3.1 a). The winding profile was derived from the phase as shown in
Figure 3.1 b) where paper samples were taken from tertiary windings, common
windings and series windings. For both phase and winding profiles, paper samples
were taken from top, centre and bottom positions so that a vertical comparison ageing
status can be made. The scrapped transformer was analyzed vertically because of the
difference in the temperature distribution from bottom to top windings [88]. In general,
the operating temperature at the bottom windings is lower than top windings.
Horizontal comparison is also made among windings in the same phase and among
phases to check the thermal design.
3.2.2. Layer profile
The layer profile was obtained from a single conductor and the sampling procedure is
shown schematically in Figure 3.2. Normally, a number of paper layers were wrapped
around a single conductor varying from 6 layers to 12 layers depending on the design
of a transformer and the thickness of the paper. Each layer is unwrapped carefully and
paper that is in contact with oil was assigned as outer layer paper and inner layer paper
was the paper close to the conductor.
Figure 3.2 Sampling procedure for layer profile.
~~
Outer Inner
Insulation
Paper
Conductor Oil
Layer profile
Core TV LV HV
Inner Outer
(CW) (SW)
Winding profile

Chapter 3 Methodology
65
3.3. TS measurements
All measurements of paper strength in this PhD thesis were carried out based on long
span TS. The gap distance and width of sample required for tests are about 180 mm ±
1 mm. For each location, at least 10 tests were done on paper samples. However, the
amount of paper from a scrapped transformer usually is limited and thus the number of
tests was sometimes reduced to a minimum of 4 tests for each sample in several cases.
The crosshead speed and full scale load range were set to 20 mm/min and 0.5 kN
according to [72, 73]. Tests were carried out in the paper science laboratory with a
condition of 23 °C and 50% relative humidity. During the refurbishment of the
laboratory, the tests were conducted in a building having the temperature ranging from
21 °C to 23 °C and the humidity ranging from 35 % to 50 %.
3.3.1. TS or TI measurements
Paper from scrapped transformers usually comes in different types and grammages.
Tensile Index (TI) is preferred to TS for since it considers grammage in the
calculation.
Conductor and layer types of paper were tested in this section. Table 3.1 shows the
properties of both types of paper. Twenty thickness measurements were carried out for
each type of paper by a digital micrometer. The grammage for the conductor type
paper tested in this thesis range from 46 g/m² to 51 g/m² with an average value of 48
g/m². On the other hand, the grammage of the layer type paper range from 168 g/m² to
171 g/m² with an average value of 170 g/m². All grammage measurements were
carried out without any present of oil. The calculated density does match with the
value given by the manufacturer for both types of paper. For each type of paper, 10
tests of long span TS were carried out without any present of the oil. The TS and TI of
both types of paper were calculated by Equation (2.5) and Equation (2.6) in Chapter 2.

Chapter 3 Methodology
66
Table 3.1 Properties of new conductor and layer types paper.
Type of
paper
Thickness
(mm)
Grammage
(g/m²)
Apparent density
(Manufacturer)
(g/cm³)
Apparent density
(Calculated)
(g/cm³)
Conductor 0.053 48 0.93 0.92
Layer 0.237 170 0.76 0.72
It is observed that the conductor type paper has a lower strength than the layer type
paper if comparison is made based on TS as shown in Table 3.2; however the reason
for the high strength of layer type paper is due to the grammage since thickness does
not affect the fibre bonding at a given density and load carrying capability.
The effect of grammage is considered in the TI calculation and it is shown that the
specific strength of the conductor type paper is higher than that of the layer type paper.
Furthermore, TI also could show that the specific strength of the paper is a function of
density where high density paper has higher strength than low density paper depending
on the type of fibre.
Table 3.2 TI and TS comparison between conductor and layer types paper.
Type of paper TS (kN/m) TI (Nm/g)
Conductor 5.25 ± 0.21 109 ± 4.58
Layer 15.6 ± 0.53 91.6 ± 3.14
± represents standard deviation
Thus, in this thesis, TI will be used to describe the strength of the paper.
3.3.2. Factors affecting TI measurements
3.3.2.1. Paper samples condition
All samples tested for TI in this section were new, conductor paper. The properties of
this type of paper can be seen in Table 3.1. All samples tested were not impregnated in
oil except for the influence of oil impregnation section. All measurements of paper
strength in this section were carried out based on long span TI.

Chapter 3 Methodology
67
3.3.2.2. Paired t-test
A statistical method known as paired t-test was applied to all data in this section in
order to check whether there is any significant difference between means of samples.
The calculation procedure can be seen in Figure 3.3. The first step is to split the data
into two groups. Each group contains at least 10 TI measurements. The next step is to
subtract data in group 1, x1 with data in group 2, x2. The mean, d and standard
deviation, Sd of the difference is calculated and standard error, Se can be obtained by
dividing Sd with the square root of sample size, n. The T can be calculated based on d
and Se while tcrit at 95 % confidence level can be obtained from T table based on
specified degree of freedom, df. If T (calculated from mean and standard deviation of 2
groups) is higher than tcrit (from T table), it indicates that the mean for 2 groups are
different from each other.
Figure 3.3 Paired t-test calculation procedure.
Arrange the data into two groups, x1 and x2
Calculate the mean difference, d and Se
1 2d = x -x , d
e
SS =
n
Calculate T
e
dT =
S
If T > tcrit Mean
difference
No mean difference
Determine tcrit at 95 % confidence based on degree of freedom, df
df = n-1

Chapter 3 Methodology
68
3.3.2.3. Effect of length
The study was carried out since it is difficult to obtain the standard size, 180 mm long,
samples of the service aged paper according to the standard [72, 73]. It can be seen
from Figure 3.4 that the percentage difference between 30 mm and 180 mm is less than
5 % which indicate the lengths within the measurement range has small influence on
the TI measurements. There is a decreasing trend of TI as the length is increased. This
is called ‘scale effect’ where the probability of finding weakest link will be high if the
size of the sample is increased [89].
Figure 3.4 TI of new conductor paper versus length. Data are mean of 10 samples and
error bars represent the standard deviation.
According to the paired t-test, it is observed that the TI difference between 15 mm and
30 mm is not statistically significant as shown in Table 3.3. Similar observation was
also found for the comparison between 60 mm and 180 mm. On the other hand, it is
shown that there is some significant difference of TI statistically for other length
comparisons.

Chapter 3 Methodology
69
Table 3.3 Means comparison between each length
Mean difference (Based on T test at 95% confidence interval)
15 mm 30 mm 60 mm 180 mm
15 mm - No Yes Yes
30 mm No - Yes Yes
60 mm Yes Yes - No
180 mm Yes Yes No -
3.3.2.4. Effect of folding stress
Service aged paper can be subjected to folding stress due to the wrapping of the paper
around the conductor. A study was carried out on the influence of the folding stress on
TI measurement. In order to study this effect, new paper samples were folded with
moderate force at 2 different locations at an angle of 90 ° in order to imitate the folding
stress in paper from a service aged transformers as shown in Figure 3.5. It is
anticipated that the folding stress will create a weak point on the fibre. The gap length
for TI measurement was set as 30 mm.
Figure 3.5 Paper samples arrangement for the effect of folding stress.
It can be seen that paper under folding stress undergoes 14 % reduction of TI in Figure
3.6. There is a significant difference of TI at the 95 % confidence interval according to
Gap between
two clamps was
set at 30 mm
Upper clamp
(moveable)
Lower clamp
(stationary)
Paper
samples
Force
Arrangement
of TI
measurement
For clamp Folding stress is introduced
at these locations

Chapter 3 Methodology
70
the paired t-test. This effect might be more severe for service aged paper since the
folding area condition could be more severe compared to new paper.
Figure 3.6 TI of new conductor paper with and without folding stress. Data are mean
of 10 samples and error bars represent the standard deviation.
3.3.2.5. Effect of oil impregnation
The influence of oil impregnation on TI measurements was also examined. Three types
of paper conditions were prepared according to Figure 3.7. The gap length for TI
measurement was set at 30 mm and 180 mm.
Results are shown in Figure 3.8. It is observed that paper impregnated fully with oil,
with or without temperature, experiences a small TI reduction between 3.7 % and 6.1
% as seen in Table 3.4. Statistically, it is found that there is a significant difference of
TI between dry and full impregnation with/without temperature for both 30 mm and
180 mm as shown in Table 3.5. There is no influence of impregnation temperature on
the TI measurement based on paired t-test which suggests that there is no premature
ageing occurring during impregnation process.
A test was also conducted in order to see whether the small reduction is caused by the
slippage of the paper on the clamp by having only the gap between two clamps

Chapter 3 Methodology
71
impregnated with oil. It is found that paper still undergoes a small TI reduction
between 2.6 % to 2.8 %.
Figure 3.7 Preparations of paper samples for the effect of oil impregnation.
Figure 3.8 Influence of oil on TI. Data are mean of 10 samples and error bars
represent the standard deviation.
For clamp
Gap between
two clamps
Baseline- Dry
Sample 1
Only gap is impregnated with oil
No vacuum and temperature
Oil
Gap between
two clamps was
set at 30 mm
and 180 mm
Upper clamp
(moveable)
Lower clamp
(stationary)
Paper
samples
Force
Arrangement
of TI
measurement
Sample 2 and 3
For Sample 2, full impregnation
with oil in vacuum oven without
temperature
For Sample 3, full impregnation
with oil in vacuum oven at 85 °C

Chapter 3 Methodology
72
Table 3.4 Percentage difference of TI between baseline and samples.
Sample Difference at
30 mm (%)
Difference at
180 mm (%)
Between Baseline and Sample 1 2.6 % 2.8 %
Between Baseline and Sample 2 6.1 % 3.7 %
Between Baseline and Sample 3 5.2 % 4.6 %
Table 3.5 Means comparison between baseline and samples.
Mean difference at 30 mm (Based on T test at 95% confidence interval)
Baseline Sample 1 Sample 2 Sample 3
Baseline - No Yes Yes
Mean difference at 180 mm (Based on T test at 95% confidence interval)
Baseline Sample 1 Sample 2 Sample 3
Baseline - No Yes Yes
3.3.2.6. Effect of reducing paper length in the clamp
Another study was carried out in order to study the influence of reducing paper length
under the clamp i.e. clamp area is fully filled with paper or only 50 %. The gap length
for the TI measurement was set at 15 mm. The arrangement of the test can be seen in
Figure 3.9.
Figure 3.9 Paper samples arrangement for the effect reducing paper length in the
clamp.
17.5 mm
Gap between
two clamps was
set at 15 mm
Upper clamp
(moveable)
Lower clamp
(stationary)
Paper
samples
Force
Arrangement
of TI
measurement
17.5 mm
Sample 1
The paper length in
both clamps is 35 mm.
35 mm
35 mm
Sample 2
The paper length in both
clamps is 17.5 mm.
For clamp

Chapter 3 Methodology
73
There is about 35 % reduction of TI for the case where paper has shorter length under
the clamp which can be seen in Figure 3.10. Statistically, it is found that reducing the
length of paper in the clamp can caused significant reduction of TI. The reduction
might be caused by paper slippage on the clamp. It is essential to keep the paper in the
full clamp area with a shorter but fixed gap length to avoid large error in TI
measurement in the case of paper shortage from a service aged scrapped transformer.
Figure 3.10 Effect of reducing paper length in the clamp area of TI. Data are mean of
10 samples and error bars represent the standard deviation.
3.4. TAN, LMA and HMA measurements
3.4.1. TAN measurements
The common practise to measure the Total Acid Number in (TAN) oil is based on
automatic potentiometric measurement [90]. The measurement was done by dissolving
the sample in the solvent (500 ml of toluene, 495 ml of iso-propanol and 5 ml of water)
and titrated potentiometrically with the reagent (0.1 M (Molar Concentration)
Potassium hydroxide in iso-propanol) using a glass indicating electrode and a reference
electrode (Metrohm Solvotrode 6.0229.100). The end point of the measurement was
taken once the volume of reagent corresponds to a PH of 11.5 which was recorded by
Metrohm oil titrino plus. The detail procedure to measure TAN can be seen in Figure
3.11.

Chapter 3 Methodology
74
Figure 3.11 Procedure to measure TAN.
The calculation of Total Acid Number (TAN) of oil can be seen in Equation (3.1).
1 v v(V -CV)×m ×C
TAN = m
(3.1)
where V1 = Volume titrated for oil + solvent (ml).
CV = Volume titrated for solvent (ml).
mv = Molar mass of reagent (g/mol).
Cv = Concentration of reagent (mol/l).
m = Weight of oil (g).
3.4.2. LMA and HMA measurements
The principle of LMA and HMA measurements in oil and paper is based on the
chemical nature of the acid itself. LMA is known as polar compound and HMA is
known as less-polar compound. Thus, by using another polar compound such as water,
the LMA could be extracted from the oil and paper. The measurement of LMA and
HMA was done according to the method developed by Ingebrigtsen [19].
a) Measurement of LMA and HMA in oil
25ml of oil was mixed with an equal volume of distilled water and mixed overnight
using a magnetic stirrer as seen in Figure 3.12. The next step was to leave the mixture
sample still for at least half an hour in order to separate into two layers. Water and oil
5.0 g of oil 70 ml of solvent
+
1st STEP
Titrate the solvent
2nd
STEP
Titrate the oil and solvent
3rd
STEP
Calculate TAN by Equation (3.1)
70 ml of solvent

Chapter 3 Methodology
75
layer were then extracted and titrated according to BS 62021 [19, 90]. The acidity
result obtained from water layer is defined as LMA while the oil layer as HMA.
Acidity of clean water was measured and subtracted from the measurement of LMA in
oil. The oil layer defined as HMA was measured in the same manner as TAN. The
acidity of the sample was calculated according to the weight of oil used for extraction.
Figure 3.12 Procedure to measure LMA and HMA in oil.
The calculation of LMA and HMA in oil can be seen in Equation (3.2).
o w v v
o
(V -CV )×m ×CLMA/HMA in oil =
m (3.2)
where Vo = Volume titrated for water extract or oil extract+ solvent (ml).
CVw = Volume titrated for water + solvent (ml).
mv = Molar mass of reagent (g/mol).
Cv = Concentration of reagent (mol/l).
mo = Weight of oil (g).
Mixture of
oil and water
25ml of oil
(Measure the weight)
25ml of water
+ = 1
st STEP
Mix oil and water
2nd
STEP
Stir the mixture overnight
Magnetic stirrer
4th
STEP
Titrate the oil and water for LMA and HMA using Metrohm Oil
Titrino Plus. LMA and HMA are calculated by Equation (3.2)
3rd
STEP
Extract water from the mixture
Oil extracts
(HMA)
Water extracts
(LMA)
+ =
Mixture of
oil and water

Chapter 3 Methodology
76
b) Measurement of LMA in paper
A known weight of paper, ranging from 0.5 g to 1.0 g, was prepared and immersed in
25 ml of water for 3 days without stirring as shown in Figure 3.13. After the extraction
period, 10 ml of the extracting water was titrated according to BS 62021 [19, 90]. The
leftover paper was dried in air circulating oven at 70 °C for 2 day and acidity was
calculated by dividing with the 40 % of the dry weight of paper since only 10 ml was
used for titration.
Figure 3.13 Procedure to measure LMA in paper.
The calculation of LMA in paper can be seen in Equation (3.3).
w v v
p
(Vp-CV )×m ×CLMA in paper =
m (3.3)
1st STEP
Mix paper and water
Mixture of
paper and
water
0.5 to 1.0 g of paper 25ml of water
+ =
3rd
STEP
Extract water from the mixture
10 ml of water
(LMA)
=
Mixture of
paper and
water
2nd
STEP
Leave the mixture without any stirring
for 3 days Mixture of
paper and
water
4th
STEP
Titrate the water for LMA using Metrohm Oil Titrino Plus. LMA is
calculated by Equation (3.3)

Chapter 3 Methodology
77
where Vp = Volume titrated for water extract + solvent (ml).
CVw = Volume titrated for water + solvent (ml).
mv = Molar mass of reagent (g/mol).
Cv = Concentration of reagent (mol/l).
mp = Dry weight of paper (g).
3.4.2.1. Efficiency of LMA extraction from paper
A study was conducted to check whether 3 days is sufficient to extract the LMA from
the paper. The test was conducted by having the same paper sample titrated for 3
times and after each titration, new water was added again to the paper for the next
extraction. The age and properties of paper samples tested can be seen in Table 3.6.
Table 3.6 Age and paper properties of each transformer.
Transformers Age
(years)
Paper
thickness
(mm)
Grammage
(g/cm³)
Apparent paper
density
(g/cm³)
Transformer a 37 0.13 137 1.08
Transformer b 45 0.09 101 1.17
Transformer c 35 0.11 89 0.79
Transformer d 42 0.04 42 1.07
Two paper samples from scrapped transformers with different LMA in paper values
are shown in Figure 3.14. It is shown that 72.2 % of LMA was extracted on the first,
23.8 % on the second and 4 % on the third extraction for Transformer a. For
Transformer b, 75.5 % of LMA was extracted on the first, 19.7 % on the second, and
4.8 % on the third extraction.

Chapter 3 Methodology
78
Figure 3.14 Low molecular weight acid extraction efficiency using water. Data are
mean of 2 measurements.
The results show that the majority of LMA would be extracted on the first extraction
and only a small amount of LMA was left in the paper on the second and third
extraction. There is no significant difference in the percentage of extraction for paper
having either low or high amount of LMA, therefore extraction once is appropriate and
the value of LMA in paper can be used to conduct cross comparison.
The repeatability of LMA measurements was also checked by measuring twice the
water extract. It can be seen from Table 3.7 that the repeatability of the measurements
is good. The difference between first and second measurements for Transformer b, c
and d are around 18 %, 0.4 % and 6 %. The slight deviation between first and second
measurements for Transformer b might be due to some of LMA is not distributed well
in the water since no stirring is involved during the extraction process. Since the
repeatability of the measurements is good, almost all LMA measurements in this thesis
are measured twice and the average value is taken.
Table 3.7 LMA measurement on service aged paper.
Measurement Transformer b
(mg KOH/g)
Transformer c
(mg KOH/g)
Transformer d
(mg KOH/g)
1st 1.30 2.81 3.76
2nd
1.06 2.80 3.98

Chapter 3 Methodology
79
3.5. Pre-processing of materials for ageing experiment
3.5.1. Pre-processing of oil
Mineral oil Gemini X and natural ester FR3 were first filtered using a nylon membrane
filter with a pore size of 0.2 µm. The basic properties of these oils based on the
Product Datasheets can be seen in Table 3.8. The important properties are acidity,
viscosity and AC breakdown voltage since it could influence the performance of
transformers after subjected to ageing. The next step is to dry mineral oil in air
circulating oven for 24 hours at 105 °C in order to remove the water. On the other
hand, for natural ester, the drying is done in vacuum oven (less than 10 mbar) at 85 °C
for 72 hours. The drying of natural ester is done in vacuum oven and at a long duration
because the water saturation is higher than mineral oil. The final water content for
mineral oil and natural ester are 10 ppm and 20 ppm respectively.
Table 3.8 Basic properties of Gemini X and FR3.
Type of paper Unit Gemini X FR3
Density @ 20 °C kg/dm3
0.88 0.92 (25 °C)
Viscosity @ 40 °C mm2/s 8.7 34
Flash point °C 144 316
Pour point °C -60 -21
Acidity mg KOH/g <0.01 0.04
Aromatic content % 10 -
Water content mg/kg <20 30
Antioxidant content wt% 0.38 -
AC breakdown voltage
-Before treatment kV 40- 60 (d=2.5 mm) -
- After treatment kV >70 (d=2.5 mm) 56 (d= 2.0 mm)
Dielectric dissipation factor
@ 90 °C - 0.03 (100 °C) <0.001

Chapter 3 Methodology
80
3.5.2. Pre-processing of paper
Conductor paper was used for all ageing experiment. The property of this paper can be
seen in Table 3.2. In order to prepare dry paper sample, the paper was dried in air
circulating oven for 24 hours at 105 °C. The next step was to impregnate the paper
with either dry mineral oil or natural ester in vacuum oven for 24 hours at 85 °C. The
final water content for paper is less than 0.5 %.
For wet paper sample, the dried paper impregnated with either mineral oil or natural
ester was left in desiccators with a relative humidity of 90 % for 7 days. The final
water content paper is around 5 %.
3.6. Summary
There are several aspects that need to be taken care when measuring TI of service aged
paper sample. Reducing the length of the paper sample and oil impregnation only has
minor influence on the TI measurements. It is important to eliminate paper samples
which are damaged and mechanically stressed during scrapping since folding effect
show that it could influence the TI measurements. The most crucial practice is to make
sure that the size of the paper sample is sufficient to cover the clamp area in order to
avoid significant errors on the TI measurements of service aged paper.
Three days of extraction period is sufficient to extract most of the LMA from the
paper. Furthermore the repeatability of the LMA measurements of the water extract is
good.

Chapter 4 Ageing Assessment of Paper through Tensile Strength Measurements
81
CHAPTER 4. AGEING ASSESSMENT OF PAPER THROUGH TENSILE
STRENGTH MEASUREMENTS
4.1. Introduction
Up until now, there are several studies on the ageing of paper in transformers were
carried out through laboratory ageing experiments. Although much knowledge on the
ageing of paper was obtained through these studies, it is difficult to apply to in-service
transformers. One of the reasons is the ageing mechanisms in transformers is complex
and involves many factors at one time.
Transformers scrapping provide a good opportunity to study the ageing of in-service
transformers. The study could give an overview on the ageing profile in a transformer
when it was in-service. Only a few studies were carried out on scrapped transformers
using techniques such as Degree of Polymerization (DP) and water content of paper
[91, 92]. Apart from DP and water content, Tensile Index (TI) is another method that
could be used to analyze the ageing of paper.
This chapter discusses the TI phase, winding and layer profiles of scrapped
transformers. The relationship between TI and a transformer age is modelled using the
Weidmann’s equation. Life assessment of transformer population was carried out
based on this relationship. Finally, the effect of ageing on the dielectric strength of
paper is discussed in this chapter.
4.2. Case study
A total of 10 transformers were measured for TI as seen in Table 4.1. These
transformers were used at transmission voltage levels where power ratings vary from
150 MVA to 1000 MVA. Only Transformer 10 was retired due to ageing. It is
observed that most of the transformers failed due to the core overheating problem [93].
Other typical problems found on transformers are loose clamping bolts, dielectric
faults and gassing at high load. Only one failure is related to the paper which is caused
by hotspot near to the top location. The hotspot might be caused by the design
problem. This case study will be used for analysis in this chapter and Chapter 5.

Chapter 4 Ageing Assessment of Paper through Tensile Strength Measurements
82
Table 4.1 Case study of transformers.
Transformer Rating Age
(years) Reason for scrapping
1 240MVA
400/132kV 11
- Core and frame circulating current
problem
2 240MVA
400/132/13kV 11
- Localised conductor erosion causing
circulating current within the winding
through a poor and possibly
intermittent contact
3 1000MVA
400/275kV 35 - Gassing at high load
4 240MVA
275/132kV 41
- Loose clamping and core
overheating
5 180MVA
275/132kV 42
- Loose clamping and core
overheating
6 120MVA
275/132kV 45
- Closure of substation
- Vulnerable to dielectric fault
7 240MVA
275/132kV 45 - Corrosive sulphur
8 180MVA
400/132/13kV 48
- Core and frame circulating current
problem
9 150MVA
275/132/11kV 50
- Winding hotspot causing severe
paper degradation
10 180MVA
275/66kV 37
- Short circuit in C phase HV winding
caused by severe solid insulation
ageing
- Over wrapping on the HV winding
causes localised heating on certain
areas

Chapter 4 Ageing Assessment of Paper through Tensile Strength Measurements
83
4.3. TI measurements of scrapped transformers
The sampling of paper for TI analysis was carried out according to the procedure
mentioned in Figure 3.1 and Figure 3.2 of Chapter 3. The oil residue on the paper
samples was wiped using a tissue before being tested for TI. Based on all
measurements, it was found that the TI of paper for scrapped transformers ranges from
84.6 Nm/g to 20.3 Nm/g. The first part of this section describes the profile of TI along
phase, winding and layer.
4.3.1. TI profiles of scrapped transformers
4.3.1.1. Phase and winding profiles
Three transformers were analyzed for phase and winding profiles which are A, B and
C phase Common Windings (CW) of Transformer 6, A, B and C windings Series
Windings (SW) of Transformer 4 and the CW and SW of B phase of Transformer 8.
These transformers are chosen for analysis because there are enough paper samples
available to give a good representation of the vertical profile of top, centre and bottom
locations. It is known that these locations could show the temperature profile. Paper
properties and Total Acid Number (TAN) of oil before scrapping for each transformer
can be seen in Table 4.2.
Table 4.2 Paper properties and TAN of each transformer for phase and winding
profiles.
Transformers
Paper
thickness
(mm)
Apparent
paper density
(g/cm³)
Highest TAN of oil
before scrapped
(mg KOH/g)
Transformer 4 0.15 0.93 0.21
Transformer 6 0.04 1.07 0.16
Transformer 8 0.11 0.79 0.16
The vertical profile of TI of each phase can be seen in Figure 4.1. Significant
difference of TI at 95 % confidence interval is observed between A phase, B phase and
C phase at the centre and bottom windings of Transformer 4 according to the paired t-

Chapter 4 Ageing Assessment of Paper through Tensile Strength Measurements
84
test. On the other hand, there is no significant difference of TI at 95 % confidence
interval according to the paired t-test for all phases of Transformer 6 except between A
phase and C phase at the centre winding of Transformer 6.
It is suspected that the difference of TI at the centre and bottom windings of
Transformer 4 might be caused by the difference of moisture and acid distribution
since it is generally known that temperatures at these locations are relatively low.
Moisture and acids are known as the main accelerator of paper ageing [18, 27]. On the
other hand, small difference of TI between each phase is observed at the top winding.
The observation might indicate that paper at the top winding experienced almost
similar degradation. One of the possible reasons is that the paper degradation at the top
winding is mainly dominated by temperature.
Figure 4.2 shows the vertical profile of TI between windings of phase B of
Transformer 8. According to the paired t-test, there is significant difference of TI at 95
% confidence interval between windings of phase B for Transformer 8. The finding
might indicate that the temperature and moisture/acids distribution between windings
for this transformer might be different.
It is noticed that the TI for a young transformer could be similar to an old transformer
by comparing B phase CW of Transformer 8 and Transformer 4. One of the possible
reasons is the loading of Transformer 8 is higher than Transformer 4. TAN in oil
indicates ageing, and it is shown that the TAN in oil of Transformer 4 is higher than
Transformer 8. It is believed that the “chemical age” of Transformer 4 is older than
Transformer 8although the “usage age” is showing oppositely. However, no loading
history could be obtained for both transformers, so the hypothesis cannot be
confirmed. Another reason might be due to the paper thickness of Transformer 4 is
higher than Transformer 8. According to previous literature [43], thick paper degrades
faster than thin paper due to the higher temperature and slower heat conduction.
Based on the phase and winding studies, it is found the TI at the top winding is slightly
lower than bottom winding. The observation is in line with previous findings [91, 92].
One of the main factors that could affect the paper degradation is heat. Since
temperature is usually high at the top winding and hotspots are normally located near

Chapter 4 Ageing Assessment of Paper through Tensile Strength Measurements
85
to this location, it is reasonable to expect the TI at this position is lower [91, 92].
However, in some cases, the TI at the bottom winding could be lower than top winding
as shown by B phase of Transformer 4. It is suspected that there might be the
accumulation of water at the bottom winding of Transformer 4 when it was in-service.
It is known that that water has significant impact on the ageing of paper in
transformers [35].
a) b)
Figure 4.1 TI profiles among different phases a) Transformer 4 (SW) and b)
Transformer 6 (CW). Data are mean of 5 to 10 samples and error bars represent the
standard deviation.
Figure 4.2 TI profiles among different windings of Transformer 8. Paper samples were
taken from B phase. Data are mean of 4 to 6 samples and error bars represent the
standard deviation.

Chapter 4 Ageing Assessment of Paper through Tensile Strength Measurements
86
4.3.1.2. Layer profile
Two transformers were analyzed for layer profile. The paper samples were taken from
B phase, High Voltage (HV) bottom winding of Transformer 10 and B phase, CW top
winding of Transformer 6. These transformers are chosen in order to show the
difference of layer profile between severely aged paper (shown by Transformer 10)
and moderately aged paper (shown by Transformer 6). As mentioned in Table 4.1,
Transformer 10 failed due to the short circuit in turn conductors as a result from severe
solid insulation ageing while Transformer 6 is decommissioned due to the closure of
the substation. Paper properties and TAN of oil of these two transformers can be seen
Table 4.3.
Table 4.3 Age, paper properties and TAN of each transformer for layer profile.
Transformers
Paper
thickness
(mm)
Paper
density
(g/cm³)
Highest TAN of oil
before scrapped
(mg KOH/g)
Transformer 10 0.086 1.17 0.42
Transformer 6 0.040 1.07 0.16
The profile of TI along layer for Transformer 10 can be seen in Figure 4.3. It is
observed that the 1st layer paper has lower TI than the rest of layers with a value of
22.4 Nm/g. TI remains unchanged from the 2nd
layer to 8th
layer paper with an average
value of 62.5 Nm/g.
Another example of layer profile for Transformer 6 can be seen in Figure 4.4. It is
observed that the 1st and 11
th layers of paper have lower TI than the other layers. TI for
both 1st and 11
th layers paper are almost the same, with values of 33.2 Nm/g and 34.4
Nm/g. TI remains unchanged from the 2nd
layer to 10th
layer paper with an average
value of 44.3 Nm/g

Chapter 4 Ageing Assessment of Paper through Tensile Strength Measurements
87
Figure 4.3 TI profiles among different layers of Transformer 10. Paper samples were
taken from B phase, HV bottom. Data are mean of 9 to 10 samples and error bars
represent the standard deviation.
Figure 4.4 TI profiles among different layers of Transformer 6. Paper samples were
taken from B phase, CW top. Data are mean of 9 to 10 samples and error bars
represent the standard deviation.
Previous studies have shown similar pattern for multilayer insulation where the outer
layer paper usually degraded more than others [94, 95]. It was proposed that multilayer
insulation in transformers is dominated by two main degradation mechanisms [94].

Chapter 4 Ageing Assessment of Paper through Tensile Strength Measurements
88
It is noticed that the TI for a young transformer could be lower than an old transformer
by comparing first layer paper of Transformer 10 and 6. It believed that the fast
degradation of Transformer 10 is dominated by chemical degradation which mainly
involves the paper layers in direct contact with oil. The chemical degradation mainly
depends on the condition of the oil. From the scrapping report, it is reported that the
highest TAN of Transformer 10 is 0.42 mg KOH/g while that of Transformer 6 is 0.16
mg KOH/g. The high TAN of Transformer 10 might indicate that it has experienced
high loading when it was in-service. However, no loading history could be obtained
for both transformers. It is suspected that the difference in the TAN could be the
reason that the 1st layer paper of Transformer 10 has lower TI than that of Transformer
6. Acids, especially Low Molecular Weight Acid (LMA) could accelerate the ageing
of paper. Moreover, according to previous studies, it was found that LMA tends to
increase with the increment of total acidity [19]. Figure 4.5 shows the visual inspection
for each layer of the paper sample Transformer 10. It is observed that the paper
becomes darker as the number of layer progresses from inner layer to outer layer.
Outer layer paper usually is the darkest since it is in direct contact with the oil.
Figure 4.5 Example of paper taken from Transformer 10 a) 1st layer b) 2
nd layer c) 3
rd
layer d) 4th
layer e) 5th
layer f) 6th
layer g) 7th layer h) 8th
layer. Paper samples were
taken from B phase, HV bottom of Transformer 10.
Another reason probably is that the initial TI of 1st layer paper for Transformer 10 is
already lower than that of Transformer 6 since no information on the initial TI could be
obtained for both transformers. However, based on tests carried out on new conductor
type paper obtained from a transformer manufacturer, it was found that TI is high
ranging from 109 Nm/g to 115 Nm/g as shown in section 3.3.2.3 of Chapter 3. Paper
used in transformers usually has a high initial strength in order to withstand
mechanical stresses such as short circuit [18]. Thus, it is believed that the initial TI of
h)
a) b) c) d) e) f) g) h)

Chapter 4 Ageing Assessment of Paper through Tensile Strength Measurements
89
1st layer paper for both Transformer 10 and 6 should be high when it was first placed
in-service.
The low TI of 1st layer paper could lead to the failure of the transformer. As the TI of
paper reduces, there is a higher probability that the fibres might break from paper and
combines with metallic particles to initiate discharge and finally led to arcing and
sparking. The fibres could also align in the oil to provide a channel for short circuit
between conductors.
The second mechanism is thermal degradation which concerns the layer of paper close
to the conductor. Thermal degradation generally relies on the conductor temperature. It
can be seen that the effect of thermal degradation is apparent to Transformer 6.
4.3.2. Relationship between TI and age
The relationship between the TI of paper and a transformer age for, 9 transformers, can
be seen in Figure 4.6. Transformer 10 was not included in Figure 4.6 since it will be
used as the end of life criterion for next section. The scattering of data for each age is
due to the TI at different locations in a transformer.
It is observed that the TI for transformer population decreases as the age increases. A
similar trend was also observed with the reduction of DP of paper with a transformer
age [96]. However, the trend does not indicate ageing is a function of transformer age,
but a result of accumulative effect from temperature, moisture and acids. Loading is a
major source of heat while moisture might be introduced from the surrounding
atmospheric condition and as a product of ageing generated together with acids.

Chapter 4 Ageing Assessment of Paper through Tensile Strength Measurements
90
Figure 4.6 TI versus age of 9 transformers. Paper samples were taken from different
locations. Data are mean of 4 to 10 samples.
Figure 4.7 and Figure 4.8 show the daily typical summer and winter loading for some
of the transformers in Figure 4.6. The date for the daily loading of both seasons were
chosen based on the suggestion given by the utility report [97]. The average daily
loading at both seasons for Transformer 1 is high compared to other transformers as
seen in Figure 4.9 and Figure 4.10 which explains why it has the low TI at a young
age. Even though the average daily loading during summer for Transformer 2 is lower
than Transformer 1, it is observed that its TI is almost the same as Transformer 1 and
this might indicate the intrinsic thermal design of Transformer 2 is not as good as
Transformer 1.
On the other hand, it is noticed that TI is low even though the average daily loading of
both season for Transformer 4 and 5 is relatively low. This could be again, a thermal
design issue, however, at this point of research, we assume that all transformers under
study are having normalized thermal design and loading, generic to all transmission
transformers in the UK, so the ageing of paper in a transformer is mainly influenced by
age. As a transformer age increases, paper will degrade which results in loss of
mechanical strength.

Chapter 4 Ageing Assessment of Paper through Tensile Strength Measurements
91
Figure 4.7 Daily loading of typical summer (19/06/2009).
Figure 4.8 Daily loading of typical winter (04/12/2009).
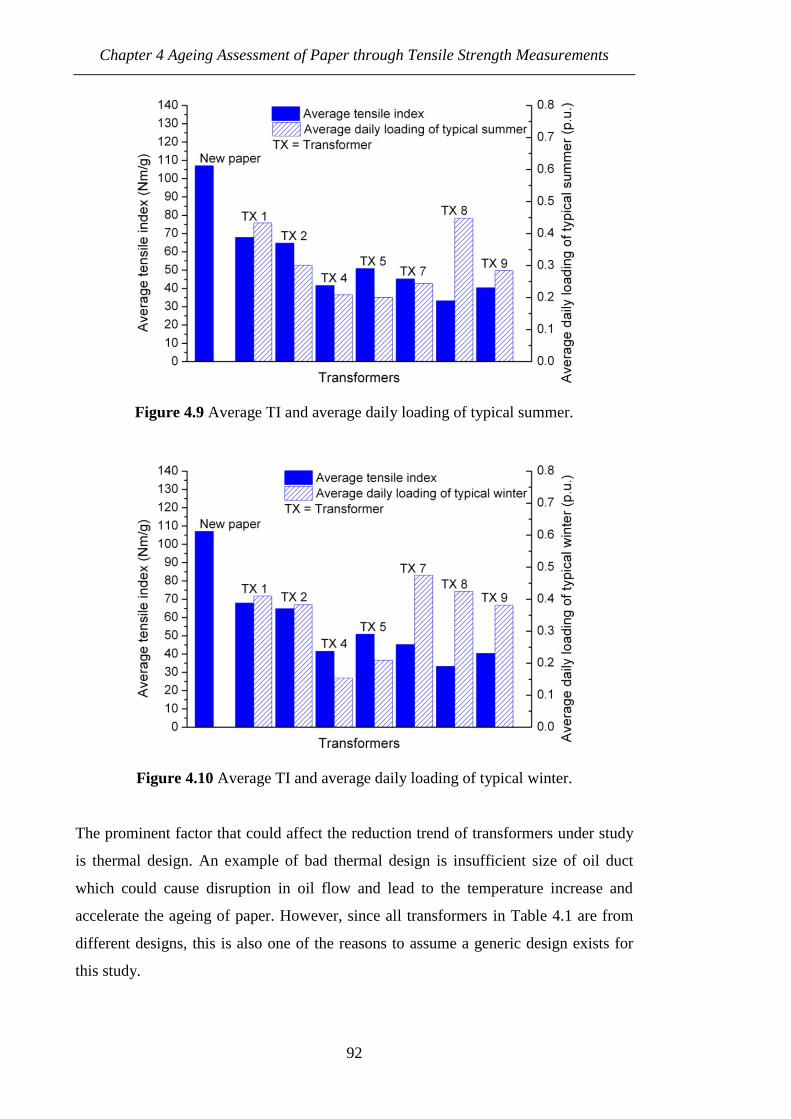
Chapter 4 Ageing Assessment of Paper through Tensile Strength Measurements
92
Figure 4.9 Average TI and average daily loading of typical summer.
Figure 4.10 Average TI and average daily loading of typical winter.
The prominent factor that could affect the reduction trend of transformers under study
is thermal design. An example of bad thermal design is insufficient size of oil duct
which could cause disruption in oil flow and lead to the temperature increase and
accelerate the ageing of paper. However, since all transformers in Table 4.1 are from
different designs, this is also one of the reasons to assume a generic design exists for
this study.

Chapter 4 Ageing Assessment of Paper through Tensile Strength Measurements
93
4.4. Modelling relationship between TI and transformer age
4.4.1. Modelling procedure for transformer population
4.4.1.1. Comparison between Weidmann and Ding & Wang model
Initially, two models were considered to represent the relationship between TI and
transformer age. The model developed by Emsley and Heywood [46] is not considered
since it is difficult to use their model to make a practical estimation from limited
ageing data [43, 98].
The first model developed by researchers in Weidmann is as seen in Equation (4.1)
[43]. The model was derived from first order reactions. It has the advantages of
requiring only a few number of data points and provide a quick empirical solution to
the fitting of the measured TI data [22].
TI-C t
0TI = TI exp
(4.1)
where TI = TI at time (t) (Nm/g).
TI0 = Initial TI (Nm/g).
CTI = Ageing rate (years-1
).
t = Time (years).
The second model developed by Ding and Wang is shown in Equation (4.2) [98]. The
degradation of paper can be characterized by TI
ω where TI
ω = 0 represents the new
paper with 100 % retention of TI while TI
ω = 1 corresponds to the failure of paper.
TI-k t*
TI TIω = ω (1-exp )
TI
0
TIω =1-
TI (4.2)

Chapter 4 Ageing Assessment of Paper through Tensile Strength Measurements
94
where TIω = Percentage of TI loss.
*TIω = Capacity of TI degradation reservoir.
TIk = Ageing rate (years-1
).
Equation (4.3) can be obtained by re-arranging of Equation (4.2). This equation has a
similar form to Equation (4.1) and can be used to describe the relationship between TI
and transformer age.
TI-k t*
0 TITI = TI (1-ω (1-exp ))
(4.3)
The main criterion for choosing the suitable model for the relationship between TI and
transformer age is that it can estimate the life when TI reaches the lowest TI of
Transformer 10. The fitting of both models was carried out based on the average of the
measured TI of each transformer. The definition of initial and measured TI is
illustrated in Figure 4.11.
Figure 4.11 Definition of initial and measured TI.
The initial TI was set as a parameter for fitting for both models. It is difficult to obtain
information on the initial TI of paper used in each transformer. Thus, a range of initial
TI values were chosen from both literatures [18, 46] and the measured TI of new
papers obtained from manufacturers. Once the range has been obtained, it is split into

Chapter 4 Ageing Assessment of Paper through Tensile Strength Measurements
95
the average, lowest and highest values as seen in Table 4.4. The values of initial TI is
reasonable since papers used in transformers usually have high initial strength in order
to withstand mechanical stresses such as short circuit [18].
Table 4.4 Classification of initial TI.
Initial TI TI (Nm/g)
Average 107
Lowest 104
Highest 112
An example of not setting initial TI as a fitting parameter can be seen in Figure 4.12.
At first instance it is observed that there are 2 stages of relationship between TI of
paper and a transformer age. The first stage is the fast reduction of TI of paper from
start until the age reaches 10 years. The second stage is the slow reduction of TI of
paper between age of 10 and 50 years. However, no modelling was carried out to
represent the 2 stage relationship since the paper with age of 10 years could be
subjected to higher loading which in turn caused the low TI. The initial TI based on
fitting is around 96 Nm/g which is lower than any values given in Table 4.4. Thus, the
initial TI needs to be set, in advance, when the fitting is carried out for both models.
Figure 4.12 Fitting for the average of the measured TI according to Weidmann model.
The initial TI was not set as fitting parameter.

Chapter 4 Ageing Assessment of Paper through Tensile Strength Measurements
96
It is observed that for the Weidmann model, the fitting line slightly deviates from the
actual average of the measured TI of the 11 years old transformers (Transformer 1 and
2) as shown in Figure 4.13. One of the possible reasons is that the paper obtained from
these transformers might be subjected to advanced ageing as discussed in section 4.3.2.
It is also noticed that the Weidmann model meets the criterion of end of life at the
same age intersect with the Transformer 10 criterion when all three different values of
initial TI are used.
On the other hand, it is found that the average measured TI of 11 years old
transformers (Transformer 1 and 2) could be modelled by Ding and Wang model as
shown Figure 4.14. As mentioned earlier, the paper samples for both transformers
might be subjected to advanced ageing due to the high loading. Furthermore, Ding and
Wang model cannot reach the criterion of end of life i.e. the final estimated TI remains
at a value around 40 Nm/g, and this indicate that its suitability is more towards the
initial and mid-age trend estimation
Thus, the Weidmann model is selected to represent the relationship between TI and
transformer age since it could meet the criterion defined earlier. Life assessment of
transformer population will be carried out based on this model.
Figure 4.13 Fitting for the average of the measured TI according to Weidmann model.
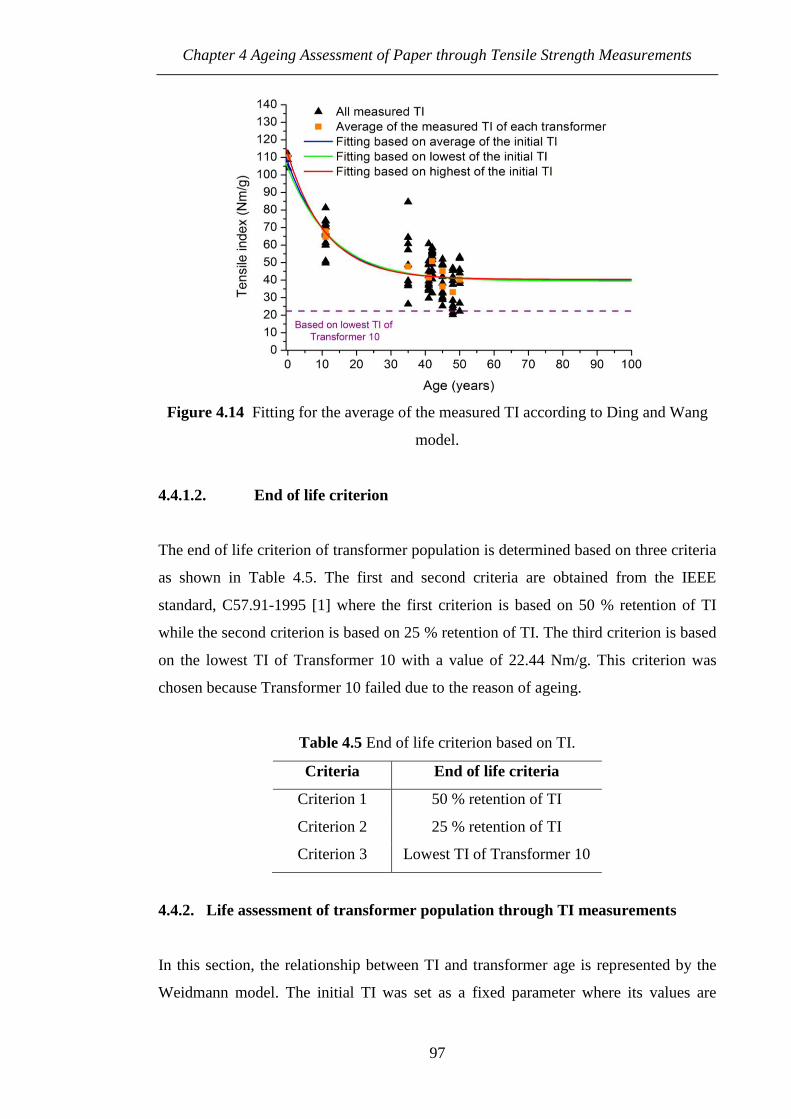
Chapter 4 Ageing Assessment of Paper through Tensile Strength Measurements
97
Figure 4.14 Fitting for the average of the measured TI according to Ding and Wang
model.
4.4.1.2. End of life criterion
The end of life criterion of transformer population is determined based on three criteria
as shown in Table 4.5. The first and second criteria are obtained from the IEEE
standard, C57.91-1995 [1] where the first criterion is based on 50 % retention of TI
while the second criterion is based on 25 % retention of TI. The third criterion is based
on the lowest TI of Transformer 10 with a value of 22.44 Nm/g. This criterion was
chosen because Transformer 10 failed due to the reason of ageing.
Table 4.5 End of life criterion based on TI.
Criteria End of life criteria
Criterion 1 50 % retention of TI
Criterion 2 25 % retention of TI
Criterion 3 Lowest TI of Transformer 10
4.4.2. Life assessment of transformer population through TI measurements
In this section, the relationship between TI and transformer age is represented by the
Weidmann model. The initial TI was set as a fixed parameter where its values are

Chapter 4 Ageing Assessment of Paper through Tensile Strength Measurements
98
given in Table 4.4. The lives at three ends of life criteria are determined based on the
fitting line where the life criteria are shown in Table 4.5.
4.4.2.1. Life assessment between top and bottom windings
The first step is to assess the life of paper sample taken from top and bottom windings.
Figure 4.15 and Figure 4.16 show the fitting results of the average of the measured TI
at the top and bottom windings.
It is noticed that the fitting lines for top winding reach the end of life criterion faster
than those of bottom winding. For example, the estimated life from the top winding
based on Criterion 3 is around 58 years while that from bottom winding is around 81
years. As mentioned earlier in section 4.3.1.1, high temperature and hotspot usually is
located at the top winding. Since heat could accelerate the ageing of paper, it is
expected that the average measured TI at the top winding is low which in turn lead to
the reduction of paper life.
Figure 4.15 Fitting for the average of the measured TI at the top winding. Each point
represents the average of the measured TI at the top winding of each transformer.

Chapter 4 Ageing Assessment of Paper through Tensile Strength Measurements
99
Figure 4.16 Fitting for the average of the measured TI at the bottom winding. Each
point represents the average of the measured TI at the bottom winding of each
transformer.
As expected, the ageing rate based on the highest initial TI is the highest for both top
and bottom windings as shown in Table 4.6 and Table 4.7. The r² value is high for both
fittings, ≥ 0.855. The average ageing rate at the top winding is around 2.70×10⁻²
while
at bottom winding is around 1.94×10⁻²
. The ageing rate at the top winding is 1.4 times
higher than that of bottom winding.
Table 4.6 Ageing rate for the average of the measured TI at the top winding.
Fitting
parameters
Based on average
of the initial TI
Based on lowest
of the initial TI
Based on highest
of the initial TI
CTI (years-1
) 2.68×10⁻²
2.59×10⁻²
2.82×10⁻²
r² 0.924 0.928 0.905
Table 4.7 Ageing rate for the average of the measured TI at the bottom winding.
Fitting
parameters
Based on average
of the initial TI
Based on lowest
of the initial TI
Based on highest
of the initial TI
CTI (years-1
) 1.93×10⁻²
1.85×10⁻²
2.06×10⁻²
r² 0.888 0.899 0.855

Chapter 4 Ageing Assessment of Paper through Tensile Strength Measurements
100
Life assessment of paper at the top and bottom windings is given in Table 4.8 and
Table 4.9. It is observed that the difference between the life estimated based on lowest
and highest initial TI is smaller at the top winding compared to the bottom winding.
The difference at the top winding ranges from 2 years to 3 years while at the bottom
winding ranges from 3 to 7 years.
Generally, the estimated life at the top winding is lower than bottom winding. It is also
observed that the estimated life based on Criterion 1 is around 50 % of estimated life
based on Criterion 2. The finding is expected since the Weidmann model is similar to
the exponential decay equation which is often used to express the half life of
radioactive materials. If Criterion 3 is chosen as the end of life criterion, the estimated
life at the top winding is 58 years with 48 years and 70 years as the lower and upper
limit of 95 % confidence band. On the other hand, the estimated life at the bottom
winding is 81 years with 66 years and 96 years as the lower and upper limit of 95 %
confidence band.
Table 4.8 Estimated life for the average of the measured TI at the top winding.
End of life
criteria
Based on average of
the initial TI (years)
Based on lowest of
the initial TI (years)
Based on highest of
the initial TI (years)
F LCL UCL F LCL UCL F LCL UCL
Criterion 1 26 22 31 27 23 32 25 21 30
Criterion 2 51 43 61 53 44 63 50 40 59
Criterion 3 58 48 70 59 49 71 57 47 69
F= Based on fitting, LCL and UCL= Based on lower and upper limit of 95 % confidence band
Table 4.9 Estimated life for the average of the measured TI at the bottom winding.
End of life
criteria
Based on average of
the initial TI (years)
Based on lowest of
the initial TI (years)
Based on highest of
the initial TI (years)
F LCL UCL F LCL UCL F LCL UCL
Criterion 1 36 30 43 37 31 45 34 28 41
Criterion 2 72 59 86 75 62 89 68 55 82
Criterion 3 81 67 96 83 69 99 78 63 94
F= Based on fitting, LCL and UCL= Based on lower and upper limit of 95 % confidence band

Chapter 4 Ageing Assessment of Paper through Tensile Strength Measurements
101
Based on this result, it is found that paper at the top winding degrades at a higher rate
than bottom winding. Due to this reason, the life of transformer should be based on
those TI obtained from top.
4.4.2.2. Life assessment of transformer population
A TI reduction trend can be observed for transformer population by considering all
transformers are from the same design and experienced the same loading as shown in
Figure 4.17 and Figure 4.18.
It is shown that if Criterion 3 is taken as the end of life criterion, the life estimated
based on the average of the measured TI is around 68 years while based on the lowest
of the measured TI is around 42 years. It is found that the life estimated based on the
lowest of the measured TI agrees with the current utility end of life definition of 40
years.
Figure 4.17 Fitting for the average of the measured TI. The square point represents
the average of the measured TI from different locations of each transformer.

Chapter 4 Ageing Assessment of Paper through Tensile Strength Measurements
102
Figure 4.18 Fitting for the lowest of the measured TI. The round point represents the
lowest of the measured TI from different locations of each transformer.
The ageing rates for both the average and lowest of the measured TI are given in Table
4.10 and Table 4.11. The r² value is high for both fittings, ≥ 0.8. As expected, the
ageing rate for the lowest of the measured TI is higher than the average of the
measured TI. The average ageing rate for the average of the measured TI is around
2.31×10⁻²
while the lowest of the measured TI is around 3.72×10⁻²
.
Table 4.10 Ageing rate for the average of the measured TI.
Fitting
parameters
Based on average
of the initial TI
Based on lowest
of the initial TI
Based on highest
of the initial TI
CTI (years-1
) 2.30×10⁻²
2.21×10⁻²
2.43×10⁻²
r² 0.831 0.836 0.8
Table 4.11 Ageing rate for the lowest of the measured TI.
Fitting
parameters
Based on average
of the initial TI
Based on lowest
of the initial TI
Based on highest
of the initial TI
CTI (years-1
) 3.71×10⁻²
3.60×10⁻²
3.86×10⁻²
r² 0.912 0.918 0.897

Chapter 4 Ageing Assessment of Paper through Tensile Strength Measurements
103
The estimated life of the transformer population can be seen in Table 4.12 and Table
4.13. It is observed that the difference between estimated life based on the lowest and
highest initial TI is smaller for the lowest TI than the average of the measured TI.
If Criterion 3 is taken as the end of life criterion, the estimated life from the average of
the measured TI is around 68 years with 55 years and 82 years as the lower and upper
limit of 95 % confidence band. On the other hand, the estimated life from the lowest of
the measured TI is around 42 years with 33 years and 52 years as the lower and upper
limit of 95 % confidence band.
Table 4.12 Estimated life for the average of the measured TI.
End of life
Criteria
Based on average of
the initial TI (years)
Based on lowest of
the initial TI (years)
Based on highest of
the initial TI (years)
F LCL UCL F LCL UCL F LCL UCL
Criterion 1 30 25 37 31 26 38 28 24 36
Criterion 2 60 49 73 62 51 75 57 46 70
Criterion 3 68 55 82 70 57 83 65 53 81
F= Based on fitting, LCL and UCL= Based on lower and upper limit of 95 % confidence band
Table 4.13 Estimated life for the lowest of the measured TI.
End of life
Criteria
Based on average of
the initial TI (years)
Based on lowest of
the initial TI (years)
Based on highest of
the initial TI (years)
F LCL UCL F LCL UCL F LCL UCL
Criterion 1 19 15 24 20 16 25 18 14 23
Criterion 2 37 29 46 39 30 48 36 28 45
Criterion 3 42 33 52 43 34 53 42 32 52
F= Based on fitting, LCL and UCL= Based on lower and upper limit of 95 % confidence band
The estimated life based on Criterion 2 is slightly lower than Criterion 3 and if
Criterion 1 is chosen as the end of life criterion, the estimated life would be much
lower than Criterion 2 and 3. Thus, it is proposed to re-introduce the 20 % retention of
TI criterion proposed previously by Dakin [99]. Table 4.14 shows the comparison of
the estimated life between Criterion 3 and Criterion 4 (20 % retention of TI). It is
observed that the estimated life is almost similar where the difference between
Criterion 3 and 4 is less than 5 %.
Chapter 4 Ageing Assessment of Paper through Tensile Strength Measurements
104
Table 4.14 Average estimated life for the transformer population.
Parameters
Based on average of the
measured TI (years)
Based on lowest of the
measured TI (years)
Criterion 3 Criterion 4 Criterion 3 Criterion 4
F 68 70 42 43
LC 55 57 33 34
UCL 82 83 52 53
F= Based on fitting, LCL and UCL= Based on lower and upper limit of 95 % confidence band
The end of life for transformers is usually defined based on the lowest of the measured
TI or DP. It is found that Criterion 4 is sufficient to represent the end of life of the
transformer population and the estimated life agrees with the current end of life of 40
years.
4.5. Effect of ageing on dielectric strength of paper
In this section, different experiments were conducted for examining the dielectric
performance of the paper subjected to in-service ageing.
4.5.1. Experiment description
Service aged paper was obtained from Transformer 10 and the TI of the paper is 24.13
Nm/g. New paper, conductor and layer types were used to compare with the service
aged paper. The properties of each paper can be seen in Table 4.15. The density of
conductor and layer types paper was obtained from the manufacturer’s datasheet. It can
be seen that service aged paper has the highest density followed by conductor and
layer types paper. Aged mineral oil was obtained from previous ageing experiments.
The oil was aged without copper and paper under open condition for 6 months at 105
°C.

Chapter 4 Ageing Assessment of Paper through Tensile Strength Measurements
105
Table 4.15 Properties of paper used for breakdown test.
Type of paper Grammage
(g/m²)
Apparent density
(g/cm³)
Thickness
(mm)
Layer paper 170 0.76 0.237
Conductor paper 48 0.93 0.053
Service aged paper 101 1.17 0.086
New and aged mineral oils were first filtered and dried according to the procedure in
section 3.5.1 of Chapter 3. The pre-processing procedure of paper is described in
section 3.5.2 of Chapter 3. The acidity of new and aged mineral oil was measured after
the pre-processing procedure. The acidity of new oil is 0.01 mg KOH/g and the acidity
of aged oil is 0.22 mg KOH/g.
AC breakdown test was carried out using sphere electrodes with a diameter of 12.5
mm. All oil and paper samples were tested for breakdown voltage at a same gap
distance. In order to achieve this purpose, different number of paper layers were used
since paper comes in difference thickness as seen in Table 4.16. The gap between
electrodes was determined by the thickness of service aged paper (highest) and the
same gap distance was maintained for conductor and layer type papers. The gap
distance was also maintained when testing breakdown strength of the oil. A 50 Hz AC
voltage with increasing rate of 0.5 kV/s was applied to the paper impregnated with
mineral oil. The breakdown can be detected by the current relay set to 4 mA which
isolates the sample tested from the source in order to avoid the oil and paper
deterioration. A total of 40 measurements of breakdown voltage were carried out on
each sample.
Table 4.16 Number of paper layers used in breakdown tests.
Type of paper Number of layers Thickness (mm)
Conductor paper (New) 4 0.212
Layer paper (New) 1 0.237
Service aged paper 3 0.258
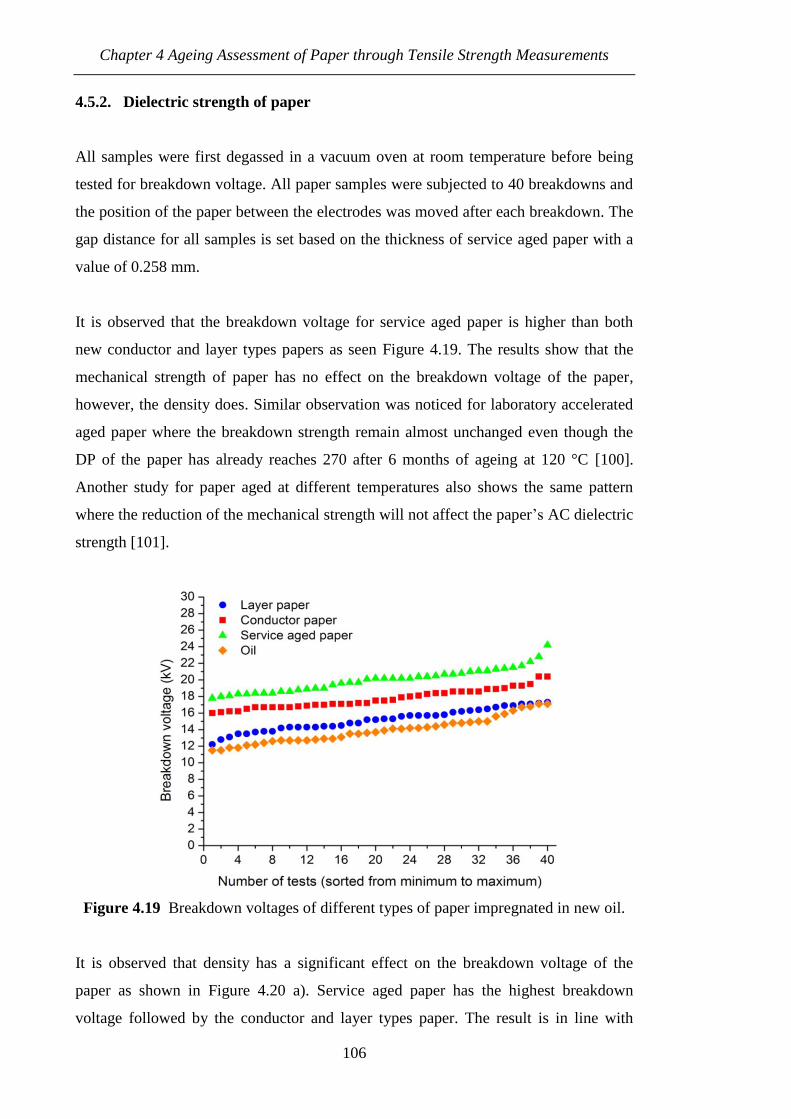
Chapter 4 Ageing Assessment of Paper through Tensile Strength Measurements
106
4.5.2. Dielectric strength of paper
All samples were first degassed in a vacuum oven at room temperature before being
tested for breakdown voltage. All paper samples were subjected to 40 breakdowns and
the position of the paper between the electrodes was moved after each breakdown. The
gap distance for all samples is set based on the thickness of service aged paper with a
value of 0.258 mm.
It is observed that the breakdown voltage for service aged paper is higher than both
new conductor and layer types papers as seen Figure 4.19. The results show that the
mechanical strength of paper has no effect on the breakdown voltage of the paper,
however, the density does. Similar observation was noticed for laboratory accelerated
aged paper where the breakdown strength remain almost unchanged even though the
DP of the paper has already reaches 270 after 6 months of ageing at 120 °C [100].
Another study for paper aged at different temperatures also shows the same pattern
where the reduction of the mechanical strength will not affect the paper’s AC dielectric
strength [101].
Figure 4.19 Breakdown voltages of different types of paper impregnated in new oil.
It is observed that density has a significant effect on the breakdown voltage of the
paper as shown in Figure 4.20 a). Service aged paper has the highest breakdown
voltage followed by the conductor and layer types paper. The result is in line with
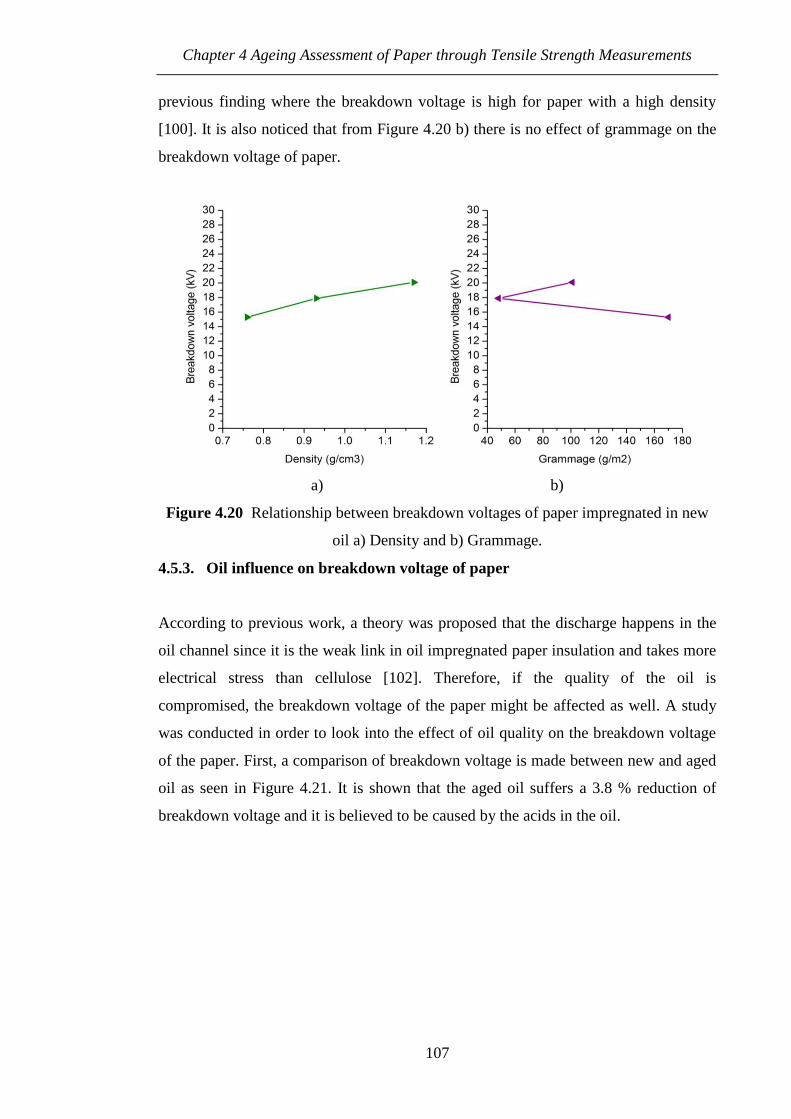
Chapter 4 Ageing Assessment of Paper through Tensile Strength Measurements
107
previous finding where the breakdown voltage is high for paper with a high density
[100]. It is also noticed that from Figure 4.20 b) there is no effect of grammage on the
breakdown voltage of paper.
a) b)
Figure 4.20 Relationship between breakdown voltages of paper impregnated in new
oil a) Density and b) Grammage.
4.5.3. Oil influence on breakdown voltage of paper
According to previous work, a theory was proposed that the discharge happens in the
oil channel since it is the weak link in oil impregnated paper insulation and takes more
electrical stress than cellulose [102]. Therefore, if the quality of the oil is
compromised, the breakdown voltage of the paper might be affected as well. A study
was conducted in order to look into the effect of oil quality on the breakdown voltage
of the paper. First, a comparison of breakdown voltage is made between new and aged
oil as seen in Figure 4.21. It is shown that the aged oil suffers a 3.8 % reduction of
breakdown voltage and it is believed to be caused by the acids in the oil.

Chapter 4 Ageing Assessment of Paper through Tensile Strength Measurements
108
Figure 4.21 Breakdown voltages of new and aged oils.
For paper impregnated in aged oil, it is observed that the reduction of breakdown
voltage increases ranging from 7 % to 9 % as seen in Figure 4.22, Figure 4.23 and
Figure 4.24. The reduction for paper impregnated in aged oil is almost 2 times higher
than that of the aged oil itself. These results show that the oil quality could affect the
overall performance of breakdown voltage of oil/paper system.
Figure 4.22 Breakdown voltages of layer type paper impregnated in new and aged
oils.

Chapter 4 Ageing Assessment of Paper through Tensile Strength Measurements
109
Figure 4.23 Breakdown voltages of conductor type paper impregnated in new and
aged oils.
Figure 4.24 Breakdown voltages of service aged paper impregnated in new and aged
oils.
Figure 4.25 shows the comparison between breakdown strengths of paper impregnated
in new and aged oil. Similar trend is observed for all types of paper, that paper
impregnated in aged oil suffers around 7 % to 9 % reduction of breakdown strength.

Chapter 4 Ageing Assessment of Paper through Tensile Strength Measurements
110
Figure 4.25 Average breakdown strengths of new and aged paper. Data are mean of
50 tests and error bars represent the standard deviation.
4.5.4. Statistical analysis on breakdown voltage of paper
Statistical analysis was performed in order to determine the suitable distribution for the
breakdown voltage data. Normal and Weibull distribution were used to fit all
breakdown voltage data as seen in Figure 4.26, Figure 4.27, Figure 4.28 and Figure
4.29. A distribution is considered a good fit if the data points follow a straight line. It is
found that normal distribution is the best fitting for all breakdown voltage data.
101
0.01
0.05
0.1
0.25
0.5
0.75
0.9 0.95
0.99
0.999
Breakdown voltage (kV)
Pro
ba
bility
Layer paper
Weibull fit of layer paper
Conductor paper
Weibull fit of conductor paper
Aged paper
Weibull fit of aged paper
New oil
Weibull fit of new oil
Figure 4.26 Weibull probability plots of new and aged paper impregnated in new oil.

Chapter 4 Ageing Assessment of Paper through Tensile Strength Measurements
111
101
0.01
0.05
0.1
0.25
0.5
0.75
0.9 0.95
0.99
0.999
Breakdown voltage (kV)
Pro
ba
bili
ty
Layer paper
Weibull fit of layer paper
Conductor paper
Weibull fit of conductor paper
Aged paper
Weibull fit of aged paper
Aged oil
Weibull fit of aged paper
Figure 4.27 Weibull probability plots of new and aged paper impregnated in aged oil.
0 5 10 15 20 25
0.01
0.05
0.1
0.25
0.5
0.75
0.9
0.95
0.99 0.995
0.999
Breakdown voltage (kV)
Pro
ba
bili
ty
Layer paper
Normal fit of layer paper
Conductor paper
Normal fit of conductor paper
Aged paper
Normal fit of aged paper
New oil
Normal fit of new oil
Figure 4.28 Normal probability plots of new and aged paper impregnated in new oil.

Chapter 4 Ageing Assessment of Paper through Tensile Strength Measurements
112
0 5 10 15 20 25
0.01
0.05
0.1
0.25
0.5
0.75
0.9
0.95
0.99 0.995
0.999
Breakdown voltage (kV)
Pro
ba
bili
ty
Layer paper
Normal fit of layer paper
Conductor paper
Normal fit of conductor paper
Aged paper
Normal fit of aged paper
Aged oil
Normal fit of aged oil
Figure 4.29 Normal probability plots of new and aged paper impregnated in aged oil.
Table 4.17 and Table 4.18 show the average breakdown voltage comparison between
normal and Weibull fitting. It is found that the average breakdown voltage obtained
from Weibull fitting is higher than normal fitting. According to the normal fitting, the
oil has the highest value of standard deviation followed by the service aged paper,
conductor and layer types paper. This indicates that oil has a higher variation of
breakdown voltage than paper.
Table 4.17 Average breakdown voltage of new and aged paper impregnated in new
and aged oil based on Weibull fitting.
Test condition Oil (kV) Layer paper
(kV)
Conductor
paper (kV)
Service aged
paper (kV)
Average (new oil) 14.1 15.3 17.9 20.1
Average (aged oil) 13.6 14.2 16.3 18.8
Table 4.18 Average breakdown voltage of new and aged paper impregnated in new
and aged oil based on normal fitting.
Test condition Oil
(kV)
Layer paper
(kV)
Conductor
paper (kV)
Service aged
paper (kV)
Average (new oil) 13.9±1.57 15.2±1.33 17.7±1.16 20.0±1.43
Average (aged oil) 13.4±1.87 14.0±1.37 16.2±0.91 18.6±1.58
± represents standard deviation

Chapter 4 Ageing Assessment of Paper through Tensile Strength Measurements
113
4.5.5. Breakdown mechanism of insulation paper
Multiple breakdowns were applied to a single point on paper impregnated in new and
aged oil. Two types of paper were used for the experiment, which are layer type paper
and service aged paper. The properties for both types of paper can be seen in Table
4.15. The gap distance between electrodes was determined by the individual thickness
of each paper. After each breakdown, the oil and paper sample is degassed for 5
minutes in order to reduce the influence of bubbles trap inside the paper pores. Due to
the 4 mA protection relay setting, the energy release during the breakdown test is
small, thus the fibre will not be seriously damaged.
The test results in Figure 4.30 and Figure 4.31 show that the breakdown voltage of
new paper impregnated in either new or aged oil remains almost unchanged even after
100 breakdowns. The degassing process helps to remove bubbles and thus prevents the
reduction of breakdown voltage of the new paper.
However, the situation is different for service aged paper where there is a reduction of
breakdown voltage after a certain number of tests. Point 1 and point 2 represent two
different paper samples. It is observed that for service aged paper impregnated in new
and aged oil, the breakdown voltage suddenly reduces to 0 kV after 32nd
, 42nd
, 83rd
and
90th
breakdown all varied but shorter than 100 breakdowns. A 0 kV breakdown voltage
represent the two electrodes is short circuited. The reduction of breakdown voltage for
service aged paper probably due to the carbonization of the fibre. As the paper aged,
the fibre is easily carbonized which could creates a conductive channel between the
two electrodes [100].
According to the visual inspection, service aged paper was easily destroyed when
subjected to breakdown voltage tests as compared to new paper. New paper creates
only carbonized dot while service aged paper create carbonized hole after being
subjected to breakdown tests as shown in Figure 4.32. It is believed that the carbonized
channel in the new paper is not as conductive as that of service aged paper to cause
sudden reduction on the breakdown voltage. In our case study, it is believed that the
energy released by the test equipment is not high and thus requires a numbers of tests
before sudden reduction on the breakdown voltage can be observed.

Chapter 4 Ageing Assessment of Paper through Tensile Strength Measurements
114
Figure 4.30 Multiple breakdowns at single point of paper impregnated in new oil.
Figure 4.31 Multiple breakdowns at single point of paper impregnated in aged oil.
a) b)
Figure 4.32 Paper condition after breakdown tests a) New paper and b) Aged paper.
Chapter 4 Ageing Assessment of Paper through Tensile Strength Measurements
115
4.6. Summary
There are only small differences in TI profiles among different windings and phases.
This is reasonable since most transformers are designed symmetrically among phases
and oil flow distributions considered among windings. A study on multi layer
insulation shows that layer profile does exists and it is influenced by thermal and
chemical degradations.
A relationship between TI and transformer age was found and represented by the
Weidmann model. It is shown that the end of life of transformer population based on
paper TI is best represented by the 20 % retention of TI. Based on this criterion the
estimated life based on the lowest of the measured TI is around 43 years with 34 years
and 53 years as the lower and upper limit of 95 % confidence band.
It is observed that reduction of mechanical strength due to ageing does not bear any
relationship with the breakdown strength of the paper. However, paper density and oil
condition could influence the dielectric strength of the paper. Further study on the
breakdown mechanism shows that new paper could maintain its dielectric strength
even after being subjected to multiple breakdowns, provided that bubbles and other
impurities such as carbonized cellulose particles are avoided. However, as the paper
aged, the fibre strength is damaged and it is easy to carbonize. So, a conductive
channel along the carbonized fibre will be created by this process lead to the reduction
of the dielectric strength of the aged paper.
As a summary, it is shown that ageing of a transformer could be represented by the
mechanical property of the paper. It is difficult to determine the ageing status of the
paper based on electrical property since paper can maintain its electrical performance
under ageing conditions.

Chapter 5 Ageing Assessment of Paper through Low Molecular Weight Acid
Measurements
116
CHAPTER 5. AGEING ASSESSMENT OF PAPER THROUGH LOW
MOLECULAR WEIGHT ACID MEASUREMENTS
5.1. Introduction
Ageing of paper and oil could generate different types of by-product such as water,
furans, gases and acids. Some of these by-products were used to determine the ageing
condition of transformers.
Recently it is found that there are two types of acids existing in paper and oil which are
Low Molecular Weight Acid (LMA) and High Molecular Weight Acid (HMA),
whereas most of LMA tend to stay in paper and most of HMA tend to stay in oil [16,
17]. Since a transformer’s functionality is closely related to its dielectric strength, it is
essential to study the effect of LMA and HMA on this property. It is also important to
examine the effect of these acids on the paper ageing.
So far, there is no publication describing study being conducted on the LMA contents
in scrapped transformer’s paper samples. LMA in paper samples from scrapped
transformers was measured in this PhD research study. Analysis of the relationship
between LMA and Tensile Index (TI) was performed in order to determine if LMA can
be used to indicate ageing profiles of transformer population.
LMA and HMA tests were carried out on in-service aged oil samples in order to
determine the partitioning between these acids for in-service transformers. Similar tests
were conducted on laboratory aged oil samples in order to study factors that could
affect the generation of LMA in oil. A paper TI prediction model was proposed based
on the measurement of LMA in oil.
5.2. Effect of LMA and HMA on breakdown voltage of oil and ageing of paper
The effect of LMA and HMA on the breakdown voltage of oil was first examined in
this section. A study was also carried out on the relationship between breakdown

Chapter 5 Ageing Assessment of Paper through Low Molecular Weight Acid
Measurements
117
voltage and TAN of in-service oils. The effect of LMA and HMA on the paper aged
under dry and wet condition was studied in the second part of this section.
5.2.1. Effect of LMA and HMA on breakdown voltage of oil
5.2.1.1. Experiment description
Different amounts of either LMA ranging from 0.2 g to 0.4 g or HMA ranging from 1
g to 19 g were mixed with 500 ml dry and filtered mineral oil by magnetic stirrer for 3
hours at 50 °C. The oil was dried and filtered according to the procedure described in
section 3.5.1 of Chapter 3. The properties of LMA and HMA can be seen in Table 5.1.
The pKa value describes the extent of an acid can dissociate in solution where smaller
number means the acid has high dissociation rate. After the mixing procedure, the oil
sample was titrated for acidity measurement and then tested for breakdown voltage.
Table 5.1 Properties of LMA and HMA.
Types of acid
Molecular
weight
rM (g/mol)
Acid
dissociation
constant (pKa)
Melting
temperature
mT (°C)
Boiling
temperature
bT (°C)
LMA (Formic) 46 3.8 8.3 101
HMA (Stearic) 285 4.9 69.3 232
The AC breakdown test was carried out by mushroom VDE electrodes with a diameter
of 36 mm according to the ASTM standard, ASTM D1816 [103]. A 50 Hz AC voltage
with increasing rate of 0.5 kV/s was applied to the natural ester. The gap distance was
set at 1 mm and a total of 50 measurements of breakdown voltage were carried out on
all samples.
5.2.1.2. Test results
It is found that LMA has a significant effect on the breakdown voltage of the oil as
seen in Figure 5.1. The oil suffers a rapid reduction of breakdown voltage as LMA
increases up to 0.1 mg KOH/g. As the LMA increases further, the low breakdown
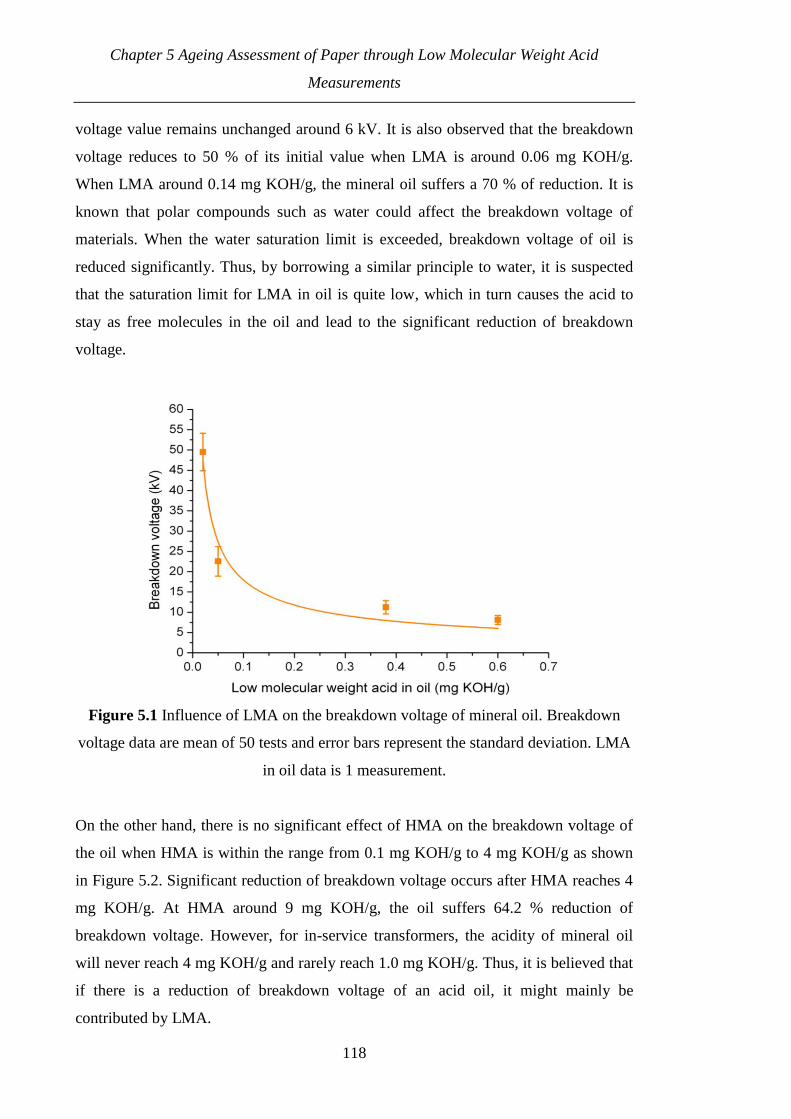
Chapter 5 Ageing Assessment of Paper through Low Molecular Weight Acid
Measurements
118
voltage value remains unchanged around 6 kV. It is also observed that the breakdown
voltage reduces to 50 % of its initial value when LMA is around 0.06 mg KOH/g.
When LMA around 0.14 mg KOH/g, the mineral oil suffers a 70 % of reduction. It is
known that polar compounds such as water could affect the breakdown voltage of
materials. When the water saturation limit is exceeded, breakdown voltage of oil is
reduced significantly. Thus, by borrowing a similar principle to water, it is suspected
that the saturation limit for LMA in oil is quite low, which in turn causes the acid to
stay as free molecules in the oil and lead to the significant reduction of breakdown
voltage.
Figure 5.1 Influence of LMA on the breakdown voltage of mineral oil. Breakdown
voltage data are mean of 50 tests and error bars represent the standard deviation. LMA
in oil data is 1 measurement.
On the other hand, there is no significant effect of HMA on the breakdown voltage of
the oil when HMA is within the range from 0.1 mg KOH/g to 4 mg KOH/g as shown
in Figure 5.2. Significant reduction of breakdown voltage occurs after HMA reaches 4
mg KOH/g. At HMA around 9 mg KOH/g, the oil suffers 64.2 % reduction of
breakdown voltage. However, for in-service transformers, the acidity of mineral oil
will never reach 4 mg KOH/g and rarely reach 1.0 mg KOH/g. Thus, it is believed that
if there is a reduction of breakdown voltage of an acid oil, it might mainly be
contributed by LMA.

Chapter 5 Ageing Assessment of Paper through Low Molecular Weight Acid
Measurements
119
Figure 5.2 Influence of HMA on breakdown voltage of mineral oil. Breakdown
voltage data are mean of 50 tests and error bars represent the standard deviation. HMA
in oil data is 1 measurement.
5.2.1.3. Relationship between breakdown voltage and Total Acid Number
(TAN) of in-service transformers
A total of 147 transformers excluding scrapped and oil regenerated transformers were
analyzed from a distribution transformer database. Yearly measurements of AC
breakdown tests and TAN were carried out on each transformer and corresponding
relationship is shown in Figure 5.3. The breakdown voltage test was carried out
according to IEC standard, IEC 156 [104] while TAN according to BSI standard, BS
62021[90].
It is observed that there is no clear correlation between TAN and the breakdown
voltage of in-service oil. The scattering of the data is high where the breakdown
voltage can be as low as 7 kV for TAN less than 0.1 mg KOH/g or as high as 60 kV
for TAN around 1.11 mg KOH/g.
Previous finding shows that under laboratory controlled experiment, the breakdown
voltage of oil could be affected by many factors such as water, particles and acidity
[105]. However, for in-service transformers, these ageing by-products co-exist
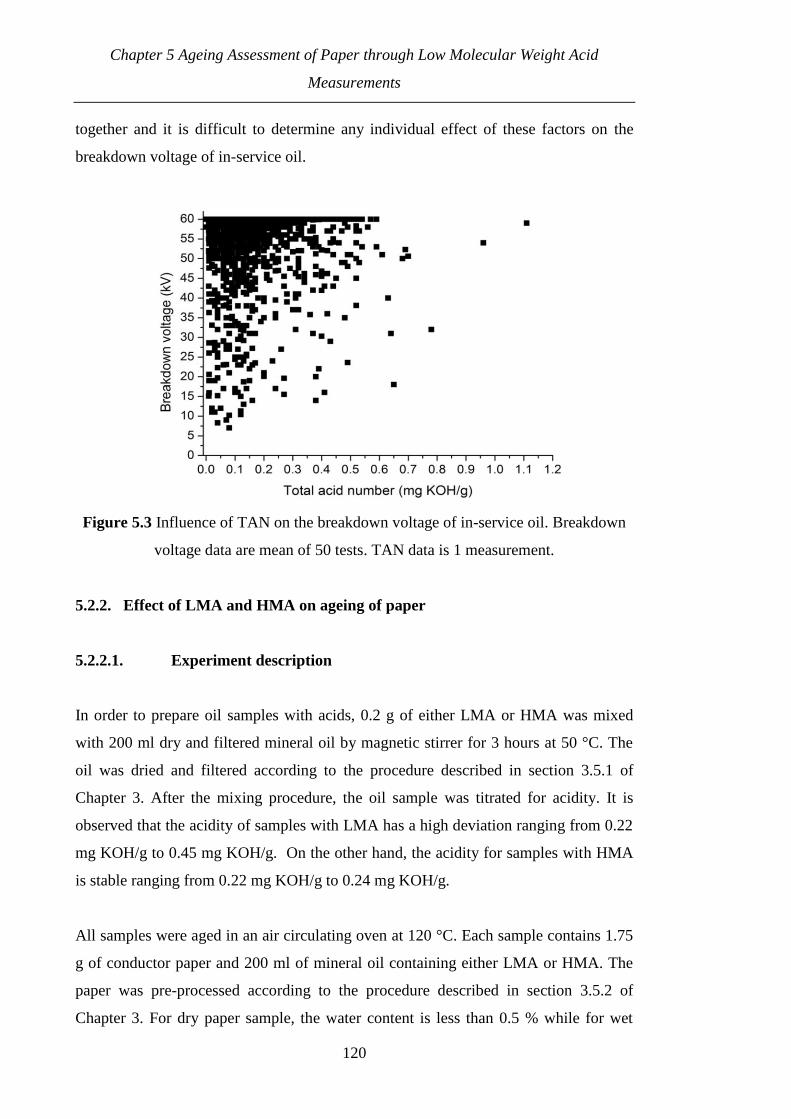
Chapter 5 Ageing Assessment of Paper through Low Molecular Weight Acid
Measurements
120
together and it is difficult to determine any individual effect of these factors on the
breakdown voltage of in-service oil.
Figure 5.3 Influence of TAN on the breakdown voltage of in-service oil. Breakdown
voltage data are mean of 50 tests. TAN data is 1 measurement.
5.2.2. Effect of LMA and HMA on ageing of paper
5.2.2.1. Experiment description
In order to prepare oil samples with acids, 0.2 g of either LMA or HMA was mixed
with 200 ml dry and filtered mineral oil by magnetic stirrer for 3 hours at 50 °C. The
oil was dried and filtered according to the procedure described in section 3.5.1 of
Chapter 3. After the mixing procedure, the oil sample was titrated for acidity. It is
observed that the acidity of samples with LMA has a high deviation ranging from 0.22
mg KOH/g to 0.45 mg KOH/g. On the other hand, the acidity for samples with HMA
is stable ranging from 0.22 mg KOH/g to 0.24 mg KOH/g.
All samples were aged in an air circulating oven at 120 °C. Each sample contains 1.75
g of conductor paper and 200 ml of mineral oil containing either LMA or HMA. The
paper was pre-processed according to the procedure described in section 3.5.2 of
Chapter 3. For dry paper sample, the water content is less than 0.5 % while for wet
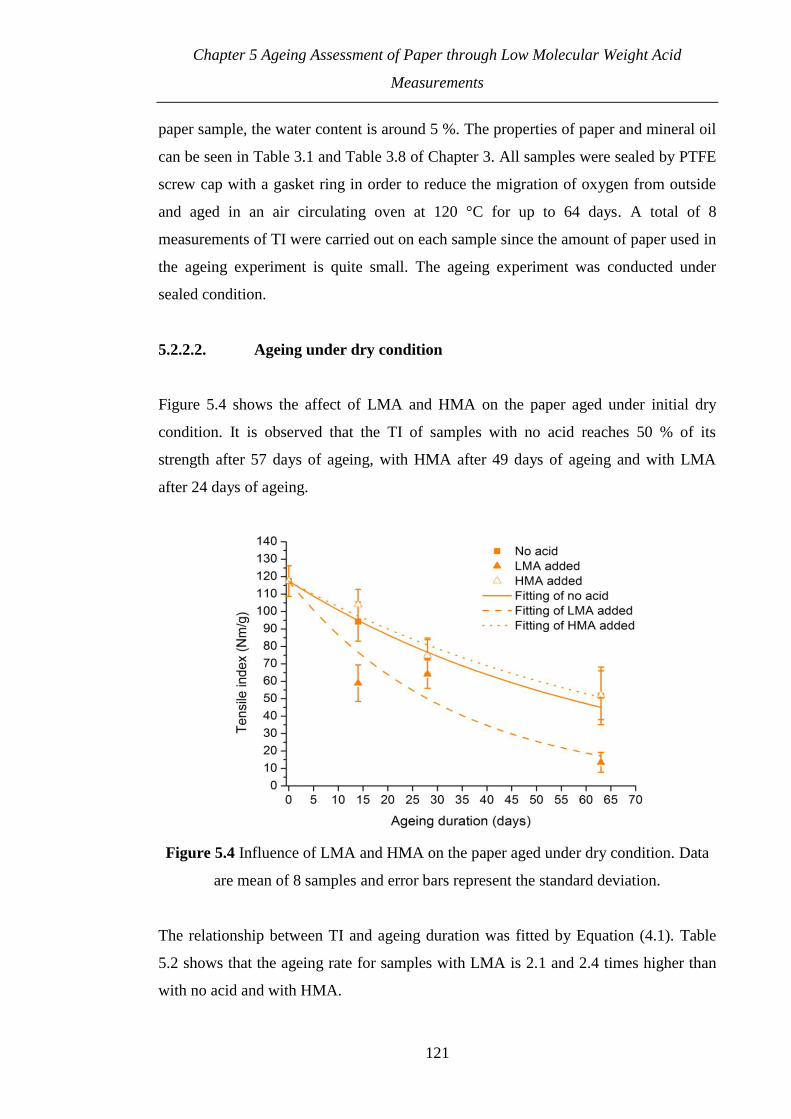
Chapter 5 Ageing Assessment of Paper through Low Molecular Weight Acid
Measurements
121
paper sample, the water content is around 5 %. The properties of paper and mineral oil
can be seen in Table 3.1 and Table 3.8 of Chapter 3. All samples were sealed by PTFE
screw cap with a gasket ring in order to reduce the migration of oxygen from outside
and aged in an air circulating oven at 120 °C for up to 64 days. A total of 8
measurements of TI were carried out on each sample since the amount of paper used in
the ageing experiment is quite small. The ageing experiment was conducted under
sealed condition.
5.2.2.2. Ageing under dry condition
Figure 5.4 shows the affect of LMA and HMA on the paper aged under initial dry
condition. It is observed that the TI of samples with no acid reaches 50 % of its
strength after 57 days of ageing, with HMA after 49 days of ageing and with LMA
after 24 days of ageing.
Figure 5.4 Influence of LMA and HMA on the paper aged under dry condition. Data
are mean of 8 samples and error bars represent the standard deviation.
The relationship between TI and ageing duration was fitted by Equation (4.1). Table
5.2 shows that the ageing rate for samples with LMA is 2.1 and 2.4 times higher than
with no acid and with HMA.

Chapter 5 Ageing Assessment of Paper through Low Molecular Weight Acid
Measurements
122
Table 5.2 Ageing rate of dry condition.
Condition Ageing rate, CTI (days-1
) r²
With no acid 1.5×10⁻²
0.986
With LMA 3.1×10⁻²
0.940
With HMA 1.3×10⁻²
0.956
5.2.2.3. Ageing under wet condition
For wet ageing condition, the effect of LMA on the paper ageing is greatly enhanced
as seen in Figure 5.5. The TI of samples with LMA reduces to 50 % of its strength
after 7 days of ageing while with no acid and with HMA after 33 days of ageing.
Figure 5.5 Influence of LMA and HMA on the paper aged under wet condition. Data
are mean of 8 samples and error bars represent the standard deviation.
The ageing rate is further increased for wet ageing condition as seen in Table 5.3. The
ageing rate of samples with LMA under wet ageing condition is around 3 times higher
than under dry ageing condition. It is also observed that the ageing rate of samples
with LMA is 4 times higher than without no acid and with HMA. The r² fitting of
samples with LMA is low because the variation of TI measurement will be high, as
paper reaches the brittle state.

Chapter 5 Ageing Assessment of Paper through Low Molecular Weight Acid
Measurements
123
Table 5.3 Ageing rate of wet condition.
Condition Ageing rate, CTI (days-1
) r²
With no acid 2.2×10⁻²
0.793
With LMA 9.7×10⁻²
0.700
With HMA 2.2×10⁻²
0.911
The ageing rate of samples with no acid is almost similar to with HMA, for both dry
and wet condition, this indicates that there is no effect of HMA on the paper ageing.
The increment factor was calculated by Equation (5.1).
Ageing rate of samples with LMA or HMA
Increment factor = Ageing rate of samples with no acid
(5.1)
Table 5.4 shows the increment factors for the combination of acids and water, when
taking dry and new oil and paper condition as reference; the ageing rate for samples
with LMA increases 3.1 times from dry to wet ageing condition. On the other hand, a
low increment of ageing rate is observed for HMA added samples where it increases
1.7 times from dry to wet ageing condition.
Table 5.4 Increment factors of dry and wet ageing conditions.
Condition Increment factor
(dry ageing condition)
Increment factor
(wet ageing condition)
With LMA 2.1 6.5
With HMA 0.9 1.5
It is clear that LMA and water have multiplicative effect on the paper ageing. Similar
observation was also found with DP in previous finding [16]. According to previous
theory, the hydrolysis of paper is catalyzed by H+
originated from dissociated acids
[18]. LMA can be easily dissociated since the pKa value is lower than HMA. By
adding LMA, the rate of acid dissociation will increase and the resultant H+ catalyzes
the hydrolysis of wet paper and thus accelerates the paper degradation.

Chapter 5 Ageing Assessment of Paper through Low Molecular Weight Acid
Measurements
124
5.3. LMA measurements of scrapped transformers paper
In total, 9 transformers were examined for LMA analysis. Paper samples for LMA
measurement were taken from the same location as in section 4.3 of Chapter 4. The oil
residue on the paper samples were wiped using a tissue before being tested for LMA.
Based on all measurements, it was found that the LMA in paper for scrapped
transformers ranges from 0.2 mg KOH/g to 6.4 mg KOH/g. LMA in paper was first
analyzed by comparing phases, windings and layers where the sampling of paper is
carried out according to the procedure described in Figure 3.1 and Figure 3.2 of
Chapter 3. The second part of this section describes the relationship between LMA in
paper, TI and transformer age.
5.3.1. LMA profile of scrapped transformers
5.3.1.1. Phase and winding profiles
The same transformers as in section 4.3.1.1 of Chapter 4 were analyzed for the profile
of LMA along windings and phases. The vertical profile of LMA in paper for A, B and
C phases can be seen in Figure 5.6. The age, paper properties and TAN of oil of each
transformer can be seen in Table 4.2 of Chapter 4. It is observed that the LMA in paper
has a big difference between phases at the top and centre winding. For example, the
LMA in paper at the top winding of Transformer 6 for A and C phase are much lower
than B phase.

Chapter 5 Ageing Assessment of Paper through Low Molecular Weight Acid
Measurements
125
a) b)
Figure 5.6 LMA in paper profiles among different phases a) Transformer 4 (SW) and
b) Transformer 6 (CW). Data are mean of 2 measurements.
Figure 5.7 LMA in paper profiles among different windings of Transformer 8. Paper
samples were taken from B phase. Data are mean of 2 measurements.
It is suspected that the LMA in paper at the top winding for some of the phases of
Transformer 4 and Transformer 6 might be evaporated due to the high temperature at
this location. Top winding usually has high temperature and hotspot is normally
located near to this location. On the other hand, it is reasonable to expect the LMA in
paper at the centre location between phases has a big difference since the TI for both
transformers also shows similar profiles. Paper ageing will result in the reduction of TI
and at the same time lead to the formation of LMA which mainly stays in paper. Small

Chapter 5 Ageing Assessment of Paper through Low Molecular Weight Acid
Measurements
126
difference of LMA in paper between phases is noticed at the bottom winding. Since
temperature is usually low at the bottom winding, the LMA should not evaporate and
should remain in the paper.
Figure 5.7 shows the vertical profile of LMA in paper for windings. It is difficult to
draw any conclusion for the winding profile since only one transformer is available for
the analysis.
It can be seen that paper at the top winding yields slightly higher LMA than bottom
winding. The paper at the top winding is usually more degraded than bottom winding
because the temperature is higher at the top. Since most of LMA originates from paper
ageing, it is reasonable to expect that the LMA in paper is slightly higher at the top
winding than bottom winding. However in some cases, LMA in paper at the bottom
winding can be slightly higher than top winding which can be seen from A phase of
Transformer 6. It is suspected that there might be an evaporation of LMA in paper at
the top winding for this transformer.
5.3.1.2. Layer profile
Same transformers as in section 4.3.1.2 of Chapter 4 were analyzed for the profile of
LMA along layer. The age, paper properties and TAN of oil of each transformer can be
seen in Table 4.3 of Chapter 4. It is observed that between the 8th
to 4th
layers paper,
the LMA for Transformer 10 ranges from 1.88 mg KOH/g to 3.98 mg KOH/g with an
average value of 2.90 mg KOH/g as shown in Figure 5.8. The highest LMA is
observed at the 2nd
layer paper with a value of 7.24 mg KOH/g. The 1st layer paper has
a lower LMA than the 2nd
layer paper probably due to the evaporation of LMA.
Similar pattern of LMA in paper for multilayer insulation is observed for Transformer
6, as shown in Figure 5.9. The lowest LMA is observed at the 11th
layer paper with a
value of 1.86 mg KOH/g. The LMA slightly increase at the 10th
layer paper and remain
almost unchanged up to the 2nd
layer paper with an average value of 3.31 mg KOH/g.
The 1st layer paper has the highest LMA with a value of 5.5 mg KOH/g.
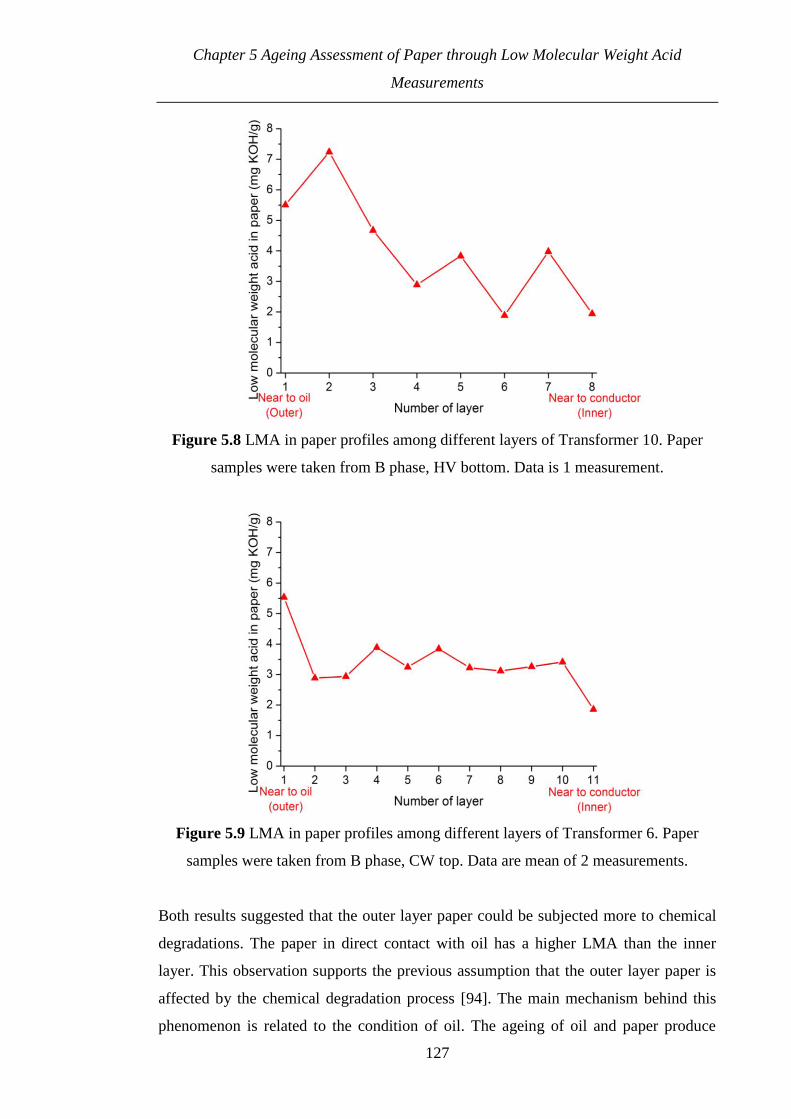
Chapter 5 Ageing Assessment of Paper through Low Molecular Weight Acid
Measurements
127
Figure 5.8 LMA in paper profiles among different layers of Transformer 10. Paper
samples were taken from B phase, HV bottom. Data is 1 measurement.
Figure 5.9 LMA in paper profiles among different layers of Transformer 6. Paper
samples were taken from B phase, CW top. Data are mean of 2 measurements.
Both results suggested that the outer layer paper could be subjected more to chemical
degradations. The paper in direct contact with oil has a higher LMA than the inner
layer. This observation supports the previous assumption that the outer layer paper is
affected by the chemical degradation process [94]. The main mechanism behind this
phenomenon is related to the condition of oil. The ageing of oil and paper produce

Chapter 5 Ageing Assessment of Paper through Low Molecular Weight Acid
Measurements
128
different by-products and some of them could accelerate the ageing of paper such as
water and LMA. Even though most of water and LMA stay in the paper, there is still a
small amount left in oil. Thus, paper in close contact with oil could be subjected to a
higher rate of degradation due to the existence of these by-products. As paper
undergoes further degradation, more water and LMA will be produced and stay in the
outer layer paper. Furthermore, as the condition of oil becomes worse, it will also
contribute to the increment of LMA in the outer layer paper.
It can be seen that the LMA in paper of the first three layers of Transformer 10 is
higher than Transformer 6. The high LMA in paper in Transformer 10 is expected
since the outer layer paper suffers more severe degradation than Transformer 6 based
on the mechanical strength reduction. Furthermore, it is noticed that a high amount of
LMA is expected for paper with a low TI as shown in Figure 5.10 and Figure 5.11.
Thus, it is suggested that there is a relationship between TI and LMA in paper.
Figure 5.10 TI and LMA in paper profiles among different layers of Transformer 10.
Paper samples were taken from B phase, HV bottom. LMA in paper data is 1
measurement. TI data are mean of 9 to 10 samples.

Chapter 5 Ageing Assessment of Paper through Low Molecular Weight Acid
Measurements
129
Figure 5.11 TI and LMA in paper profiles among different layers of Transformer 6.
Paper samples were taken from B phase, CW top. LMA in paper data are mean of 2
measurements. TI data are mean of 9 to 10 samples.
The study on the 1st layer paper of both transformers shows that the LMA in paper for
a young transformer could be higher than an old transformer. On the other hand, the TI
for a young transformer can lower than an old transformer. It is suspected that
Transformer 10 might be subjected to either a higher loading or worse thermal design
than Transformer 6. This is supported by the fact that TAN of the oil for Transformer
10 is higher than Transformer 6. The scrapping report of Transformer 10 briefly
mentioned that the severe degradation of solid insulation is due to the high loading.
However, no loading history could be obtained for both transformers.
5.3.2. Relationship between LMA in paper, TI and transformer age
5.3.2.1. Relationship between LMA in paper and TI
Figure 5.12 shows the relationship between LMA in paper and TI based on the
measurements of 9 scrapped transformers. It is shown that there is a link between TI
and LMA; i.e. LMA in paper increases as TI of paper decreases. The correlation
between TI of paper and LMA in paper was calculated based on Pearson correlation

Chapter 5 Ageing Assessment of Paper through Low Molecular Weight Acid
Measurements
130
factor as shown in Equation (5.2). The Pearson correlation describes that the closer the
value to either -1 or 1, the stronger the correlation between variables.
xy
2 2
(x-x) (y-y)r =
(x-x) (y-y)
(5.2)
where rxy
= Correlation factor.
x and y
= Variables.
x and y
= Mean of variables.
The correlation factor between TI and LMA in paper is –0.71 which indicates that
there is strong correlation between these parameters. As the paper degrades, LMA will
be generated and it accumulates in the paper which in turn contributes to the further
increment of LMA. The relationship between LMA in paper and TI of paper also
might indicate that the generation of LMA is higher than the consumption of LMA.
The measured LMA is a result from the subtraction of LMA generation with LMA
consumption.
Figure 5.12 LMA in paper versus TI of 9 transformers. Paper samples were taken
from different locations. LMA in paper data are mean of 2 measurements. TI data are
mean of 4 to 10 samples.
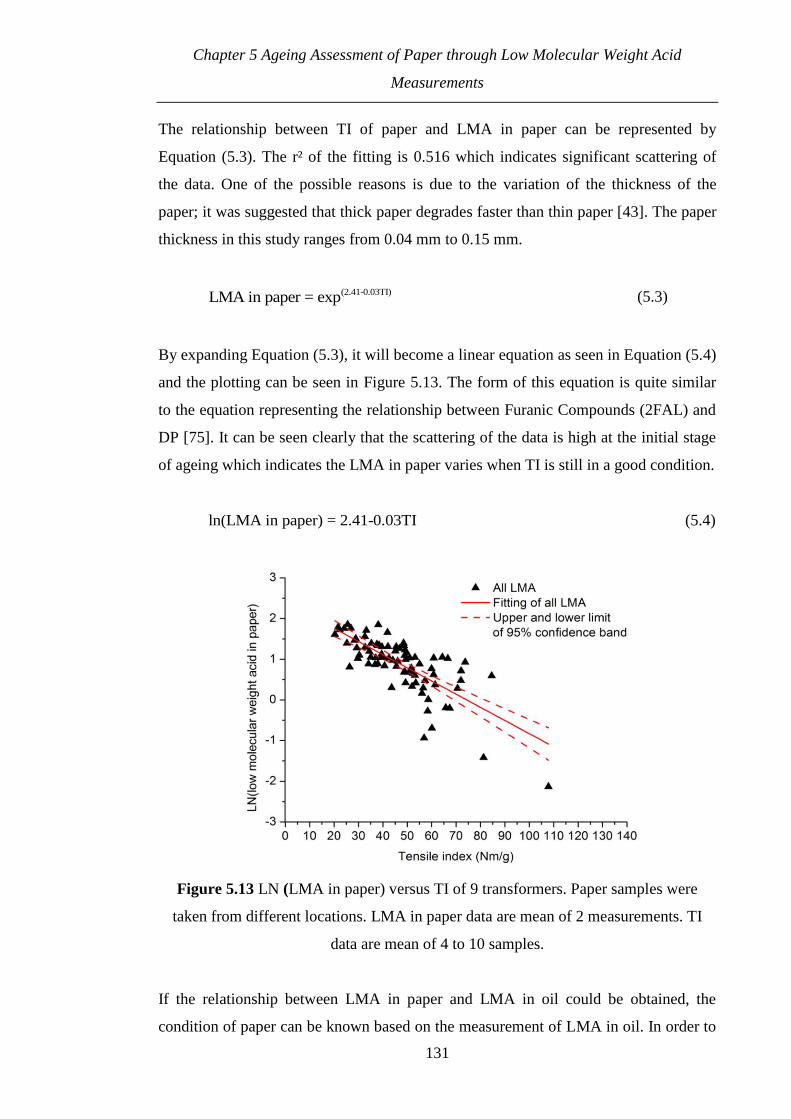
Chapter 5 Ageing Assessment of Paper through Low Molecular Weight Acid
Measurements
131
The relationship between TI of paper and LMA in paper can be represented by
Equation (5.3). The r² of the fitting is 0.516 which indicates significant scattering of
the data. One of the possible reasons is due to the variation of the thickness of the
paper; it was suggested that thick paper degrades faster than thin paper [43]. The paper
thickness in this study ranges from 0.04 mm to 0.15 mm.
(2.41-0.03TI)LMA in paper = exp (5.3)
By expanding Equation (5.3), it will become a linear equation as seen in Equation (5.4)
and the plotting can be seen in Figure 5.13. The form of this equation is quite similar
to the equation representing the relationship between Furanic Compounds (2FAL) and
DP [75]. It can be seen clearly that the scattering of the data is high at the initial stage
of ageing which indicates the LMA in paper varies when TI is still in a good condition.
ln(LMA in paper) = 2.41-0.03TI (5.4)
Figure 5.13 LN (LMA in paper) versus TI of 9 transformers. Paper samples were
taken from different locations. LMA in paper data are mean of 2 measurements. TI
data are mean of 4 to 10 samples.
If the relationship between LMA in paper and LMA in oil could be obtained, the
condition of paper can be known based on the measurement of LMA in oil. In order to

Chapter 5 Ageing Assessment of Paper through Low Molecular Weight Acid
Measurements
132
achieve this goal, a study on the partitioning of LMA in paper and oil under different
conditions is needed.
5.3.2.2. Relationship between LMA in paper and transformer age
The relationship between LMA in paper and transformer age can be seen in Figure
5.14. The LMA in paper data was obtained from the same location as TI in Figure 4.6.
It can be seen that the LMA in paper can be as high as 3.2 mg KOH/g for a young
transformer - Transformer 1. As shown in Figure 5.15 and Figure 5.16, the average
daily loading of typical summer and winter for Transformer 1 is relatively high as
compared to the other transformers, and this could be the reason for the high LMA
observed in the paper at a young age. The effect of loading on the amount of LMA in
paper is also shown by Transformer 5. It is shown that the low amount of LMA in
paper corresponds well with the low average daily loading at both seasons. However, it
is observed that the LMA in paper could be high even though the average daily loading
of both seasons is, low as shown by Transformer 4. Thus, it is believed that age could
also influence the amount of LMA in paper. As transformer age increases, the paper
will degrade with the accelerated help from ageing by-products even at low load which
in turn increase the amount of LMA in paper.
Figure 5.14 LMA in paper versus transformer age of 9 transformers. Data are mean of
2 measurements.

Chapter 5 Ageing Assessment of Paper through Low Molecular Weight Acid
Measurements
133
Figure 5.15 Average LMA in paper and average daily loading of typical summer.
Figure 5.16 Average LMA in paper and average daily loading of typical winter.
Another possible factor that could influence the amount of LMA left in paper is
design. However, it is difficult to see the effect of design on the amount of LMA in
paper since all transformers under study come from different designs.
An increment trend can be observed between LMA in paper and transformer age by
considering all transformers are from the same design and experienced the same
loading as shown in Figure 5.17. The trend suggested that the LMA tend to accumulate
in the paper with the increment of time. However, there is no evidence to prove the

Chapter 5 Ageing Assessment of Paper through Low Molecular Weight Acid
Measurements
134
accumulation of LMA in paper since it is impossible to measure LMA in paper of
individual transformer while it is in-service. It is found that the significant increment
of LMA occurs after 40 years in service.
Figure 5.17 Fitting of LMA in paper versus transformer age of 9 transformers. Data
are mean of 2 LMA in paper measurements.
An exponential relationship was used to represent the increment of LMA in paper with
transformer age as shown in Equation (5.5).
Ct
0A = A +Bexp (5.5)
where A and A0 = Current LMA in paper and initial LMA in paper (mg KOH/g).
B = Constant (mg KOH/g).
C = Increment rate of LMA in paper (years-1
).
t = Transformer age (years).
Table 5.5 shows the fitting parameter of the relationship between LMA in paper and
transformer age. A0 was set to 0.12. The constant, B was adjusted in order to make sure
the initial LMA in paper obtained from the fitting as close as possible to (A0+B= 0.12
mg KOH/g) since LMA measured from the new conductor paper is around this value.
The r² of the fitting is low for both average and highest LMA at a value of 0.38 and
0.294 due to high deviation of LMA in paper for Transformer 1 and 2.

Chapter 5 Ageing Assessment of Paper through Low Molecular Weight Acid
Measurements
135
Table 5.5 Increment rate of LMA in paper and constant of the fitting.
Fitting parameters Based on average LMA Based on highest LMA
B (mg KOH/g) 2105.6 2108.0
C ( 1years ) 2108.9 2109.0
r² 0.380 0.294
5.4. LMA and HMA ratio between paper and oil
5.4.1. LMA ratio between paper and oil
5.4.1.1. Experiment description
An experiment was conducted in order to study the partitioning of LMA in paper and
oil. Three different ratios of paper and oil were used as shown in Table 5.6. Around
0.08 g of LMA was mixed with the 75 g of dry and filtered mineral oil by magnetic
stirrer for 3 hours at 50 °C in a 250 ml beaker. The oil was dried and filtered according
to procedure described in section 3.5.1 of Chapter 3. After the mixing procedure, the
oil and LMA mixture is titrated for acidity and the value is recorded as initial amount
of LMA in oil. The dry paper is added into oil containing LMA and it is left to stand in
a 250 ml bottle for at least 10 days. The paper was dried according to the procedure
described in section 3.5.2 of Chapter 3. It is observed that there is about 13 %
difference between the highest and lowest value of initial LMA in oil. The difference
might be due to the incomplete mixture of LMA with the oil especially for Sample 2.
Table 5.6 LMA ratio of paper and mineral oil. Data is 1 measurement.
Samples Ratio
(paper (g): oil (g))
LMA added
(g)
Initial LMA in oil
(mg KOH/g)
Sample 1 4.67: 75 0.084 0.68
Sample 2 7: 75 0.083 0.62
Sample 3 14: 75 0.082 0.70

Chapter 5 Ageing Assessment of Paper through Low Molecular Weight Acid
Measurements
136
5.4.1.2. Influence of paper and oil ratio on the partitioning of LMA in
paper and oil
Table 5.7 shows that as the paper weight increases, the LMA in oil decreases. On the
other hand, the value of LMA in paper ranges from 12.89 mg KOH/g to 21.17 mg
KOH/g. The results show that most of the LMA tends to stay in the paper. The ratio of
LMA in paper and oil is heavily influenced by the weight ratio of paper and oil. By
increasing the amount of paper in the paper/oil system, more LMA could migrate from
oil to paper and stay in the paper. Furthermore, the percentage ratio of LMA and HMA
in oil might change if the weight ratio of paper and oil changes.
Table 5.7 LMA and HMA ratio of paper and mineral oil. LMA in paper data are mean
of 2 measurements and LMA in oil data is 1 measurement.
Ratio
(paper (g): oil (g))
LMA in paper
(mg KOH/g)
LMA in oil
(mg KOH/g)
Absolute weight
ratio of LMA
(paper: oil)
4.67: 70 18.09 0.27 4.47: 1
7: 70 21.17 0.14 15.1:1
14: 70 12.89 0.01 257.8: 1
The relationship between weight ratio of paper and oil and LMA ratio of paper and oil
can be seen in Figure 5.18. It can be seen that the LMA ratio doubled once the paper
weight is increased by 2.33 g. As the paper weight is increased by 7 g, the LMA ratio
increased almost 8 times.
It is observed that the weight ratio of paper and oil has significant effect on the LMA
ratio of paper and oil. The information could be used for predicting LMA in paper in
transformers based on LMA in oil provided the design information (weight of paper
and oil) is known.

Chapter 5 Ageing Assessment of Paper through Low Molecular Weight Acid
Measurements
137
Figure 5.18 LMA ratio of paper and oil versus weight ratio of paper and oil. LMA in
paper data are mean of 2 measurements. LMA in oil data is 1 measurement.
5.4.2. LMA and HMA ratio of oil
5.4.2.1. LMA and HMA ratio of in-service oil
Table 5.8 shows the list of transformers used for analysis of LMA and HMA ratio of
oil. All transformers are used at transmission level and still in-service. The oil
sampling was done by the oil maintenance company. All transformers come from
different designs.
Table 5.8 Case study of transformers.
Transformer Rating Age (years)
11 240MVA 400/132kV 1
12 40MVA 275/20.5kV 9
13 180MVA 275/66kV 16
14 1000MVA 400/275kV 20
15 240MVA 400/132kV 26
16 240MVA 400/132kV 37
17 120MVA 275/66kV 42
Only two loading history could be obtained for this case study. The daily loading of
typical summer and winter of Transformer 15 and 16 can be seen in Figure 5.19 and

Chapter 5 Ageing Assessment of Paper through Low Molecular Weight Acid
Measurements
138
Figure 5.20. The dates for the daily loading of both seasons were chosen based on the
suggestion given by the utility [97]. It is noticed that the average daily loading of both
seasons for Transformer 15 are slightly higher than Transformer 16.
Figure 5.19 Daily loading of typical summer (19/06/2009).
Figure 5.20 Daily loading of typical winter (04/12/2009).
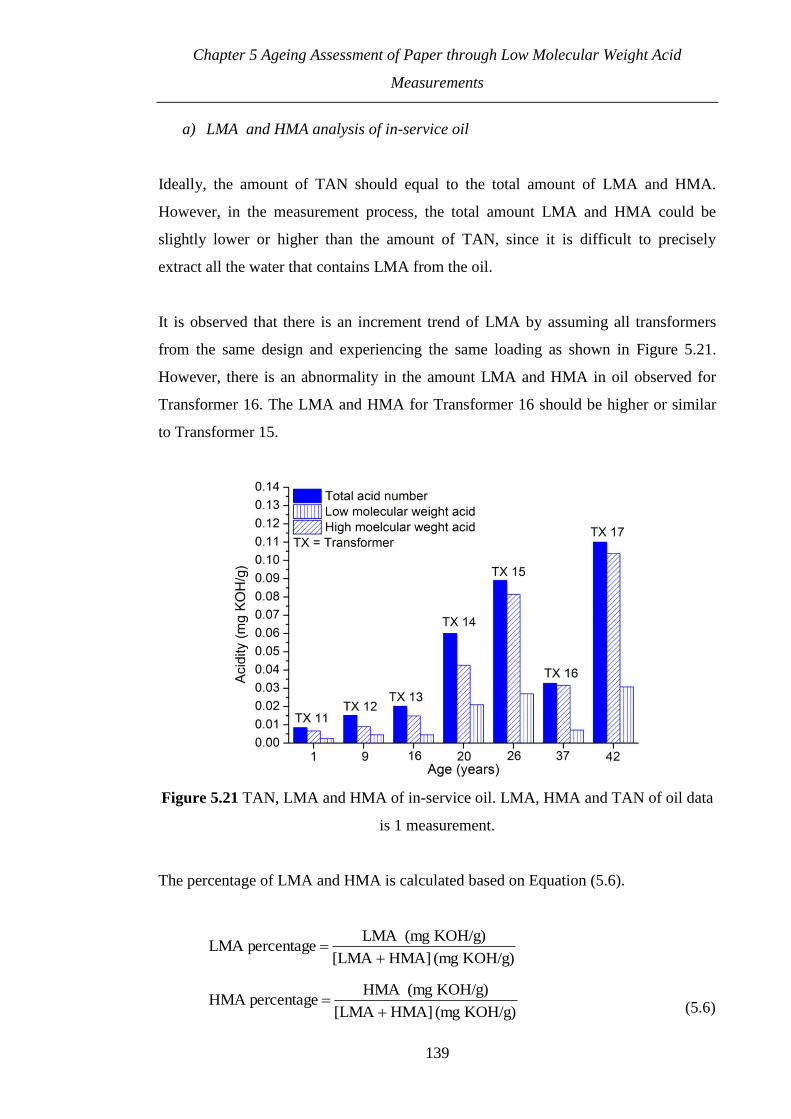
Chapter 5 Ageing Assessment of Paper through Low Molecular Weight Acid
Measurements
139
a) LMA and HMA analysis of in-service oil
Ideally, the amount of TAN should equal to the total amount of LMA and HMA.
However, in the measurement process, the total amount LMA and HMA could be
slightly lower or higher than the amount of TAN, since it is difficult to precisely
extract all the water that contains LMA from the oil.
It is observed that there is an increment trend of LMA by assuming all transformers
from the same design and experiencing the same loading as shown in Figure 5.21.
However, there is an abnormality in the amount LMA and HMA in oil observed for
Transformer 16. The LMA and HMA for Transformer 16 should be higher or similar
to Transformer 15.
Figure 5.21 TAN, LMA and HMA of in-service oil. LMA, HMA and TAN of oil data
is 1 measurement.
The percentage of LMA and HMA is calculated based on Equation (5.6).
KOH/g) (mg HMA] [LMA
KOH/g) (mgLMA percentageLMA
KOH/g) (mg HMA] [LMA
KOH/g) (mgHMA percentageHMA
(5.6)

Chapter 5 Ageing Assessment of Paper through Low Molecular Weight Acid
Measurements
140
No clear increment pattern of LMA percentage is observed in oil as seen in Table 5.9.
Most of acids observed in the in-service aged oil are HMA and the percentage ranges
from 64.9 % to 81.6 %. On the other hand, the LMA percentage ranges from 18.4 % to
33.6 % with an average percentage of 26.1 %.
Table 5.9 LMA and HMA percentages of in-service oil.
Age (years) LMA percentage (%) HMA percentage (%)
1 26.6 73.4
9 33.6 64.9
16 23.4 76.6
20 33.0 67.0
26 24.9 75.1
37 18.4 81.6
42 22.9 77.1
5.4.2.2. LMA and HMA ratio for ageing of oil without any presence of
paper
A study was conducted on laboratory aged oil sample in order to determine the amount
of LMA generated by oil and factors that could affect the generation. A series of LMA
and HMA measurements were performed on previous laboratory aged mineral oil.
a) Experiment description
Aged mineral oil was obtained from previous ageing experiments. The oil was aged
without paper at 115°C under open and sealed condition with or without the presence
of copper. TAN, LMA and HMA were measured for each sample.
b) Ageing under sealed and open condition without copper
It is observed for sealed samples that there is a small increment of LMA in oil and it
reaches to 0.013 mg KOH/g after 45 days of ageing as seen in Figure 5.22. Similar as

Chapter 5 Ageing Assessment of Paper through Low Molecular Weight Acid
Measurements
141
LMA, the TAN increases slowly and saturates at 0.06 mg KOH/g. The result indicates
that the oil suffers moderate ageing without any presence of oxygen and copper.
Figure 5.22 LMA and HMA ratio of mineral oil aged under sealed condition without
copper. LMA, HMA and TAN of oil data is 1 measurement.
It can be seen that the percentage of LMA ranges from 17.5 % to 21.2 % with an
average percentage of 16.8 % and for HMA ranges from 78.8 % to 86.8 % as seen in
Table 5.10.
Table 5.10 LMA and HMA percentages of mineral oil aged under sealed condition
without copper.
Ageing duration (days) LMA percentage (%) HMA percentage (%)
1 17.5 82.5
2 17.9 82.1
3 14.3 85.7
14 13.2 86.8
56 21.2 78.8
Similar to sealed samples, LMA in oil for open samples show increment as the ageing
duration increases and can reach up to 0.074 mg KOH/g as seen in Figure 5.23. It is
believed the actual amount of LMA in oil could be higher than the measured value.

Chapter 5 Ageing Assessment of Paper through Low Molecular Weight Acid
Measurements
142
According to the previous literature, there are three types of LMA that could exist in
transformers which are formic acid, acetic acid and levulinic acid. The boiling
temperatures of these acids range from 101 °C to 243 °C. Some of the LMA might be
evaporated to the air since the ageing is conducted under open condition and the
temperature is set to 115 °C. It is suspected that after 14 days, the sample has
experienced higher evaporation compared to other samples since the amount measured
is quite low. It is also observed that the TAN of open samples is higher than sealed
samples due to the presence of oxygen that accelerates the oxidation of the oil.
Figure 5.23 LMA and HMA ratio for mineral oil aged under open condition without
copper. LMA, HMA and TAN of oil data is 1 measurement.
The percentage ratio of LMA and HMA can be seen in Table 5.11. The variation of
LMA percentage is higher for open samples ranging from 3.5 % to 33.7 % with an
average percentage of 23.4 % ignoring the 3.5 % LMA of 14 days sample, while HMA
ranges from 66.3 % to 96.5 %. The percentage of LMA is low for 14 days sample is
low because the amount of LMA is too low compared to HMA which in turn affect the
calculation of LMA percentage in Equation (5.6).

Chapter 5 Ageing Assessment of Paper through Low Molecular Weight Acid
Measurements
143
Table 5.11 LMA and HMA percentage of mineral oil aged under open condition
without copper.
Ageing duration (days) LMA percentage (%) HMA percentage (%)
1 33.7 66.3
2 28.6 71.4
3 15.8 84.2
7 14.2 85.8
14 3.5 96.5
56 24.6 75.4
According to both sealed and open samples, it is shown that oil could also generate
LMA with a percentage among TAN from 16.8 % to 23.4 %.
c) Ageing under sealed and open condition with copper
It can be seen in Figure 5.24 that the LMA in oil is almost at the same level as HMA
in oil for sealed samples aged with copper. There is a slight increment pattern of LMA
in oil observed and the highest recorded is 0.052 mg KOH/g. There is no significant
increment of TAN observed for all ageing durations.
According to previous literature, oxidation of oil is promoted by Hydroxy (HO)
radicals originated from Hydrogen Peroxide (H2O2) [18]. H2O2 can be produced from
oxygen and water. The existence of metal cations such as copper helps to dissociate the
H2O2 into HO radicals. Since oxygen is not present in the sealed test, less H2O2 is
produced which in turn reduces the presence HO radicals and slows down the
oxidation of the oil.

Chapter 5 Ageing Assessment of Paper through Low Molecular Weight Acid
Measurements
144
Figure 5.24 LMA and HMA ratio for mineral oil aged under sealed condition with
copper. LMA, HMA and TAN of oil data is 1 measurement.
It is observed that the LMA percentage of sealed samples aged with copper is higher
than without copper as shown in Table 5.12. The percentage of LMA ranges from 44.2
% to 46.3 % with an average percentage of 45.4 % and HMA ranges from 53.7 % to
54.1 %. It is found that copper could affect the percentage ratio of LMA and HMA
ratio.
Table 5.12 LMA and HMA percentage of mineral oil aged under sealed condition with
copper.
Ageing duration (days) LMA percentage (%) HMA percentage (%)
14 45.9 54.1
21 44.2 55.8
36 46.3 53.7
Only 2 aged oil samples could be obtained for the case study as seen in Figure 5.25. As
expected, the presence of both copper and oxygen increases the TAN of the oil
significantly and the highest LMA in oil observed is 0.098 mg KOH/g. It is also
noticed that the LMA in oil for both samples is almost similar. It is believed that the
actual amount of LMA in oil for 56 days sample should be higher than the 12 days
sample. Thus, it is suspected that the LMA in oil for 56 days sample might be

Chapter 5 Ageing Assessment of Paper through Low Molecular Weight Acid
Measurements
145
evaporated since the temperature of ageing is slightly higher than the lowest boiling
temperature of LMA. Table 5.13 shows the calculated percentage of LMA and HMA.
Figure 5.25 LMA and HMA ratio for mineral oil aged under open condition with
copper. LMA, HMA and TAN of oil data is 1 measurement.
Table 5.13 LMA and HMA percentage of mineral oil aged under open condition with
copper.
Ageing duration (days) LMA percentage (%) HMA percentage (%)
12 43.7 56.3
56 15.1 84.9
d) Summary on LMA and HMA ratio of oil ageing without any presence of paper
It is found that LMA could also be generated by oil and its amount could be increased
under oxidation and presence of copper. The result supports the assumption that the
ageing mechanisms in transformers starts from the oxidation of oil which generates
LMA and initiates the hydrolysis of paper as shown Figure 2.13 of Chapter 2.
Once paper is introduced in the oil, the percentage ratio of LMA in oil might change
since this acid prefers to stay in the paper. Thus, the LMA measured in paper might be
a combination of LMA obtained from oil oxidation and paper ageing.
Chapter 5 Ageing Assessment of Paper through Low Molecular Weight Acid
Measurements
146
5.5. Life assessment of transformers through LMA measurement
It is proposed that LMA could be used as an ageing marker to determine the ageing
condition of the paper. Ideally, the LMA in paper could be predicted if the relationship
between LMA in paper and LMA in oil is known. Through LMA in paper, the TI can
be calculated based on Equation (5.4). Furthermore, life assessment of transformers
could be carried out based on the predicted TI.
5.5.1. Calculation procedure
The calculation procedure of life assessment of a transformer can be seen in Figure
5.26. Two inputs are required for the calculation which is:
a) Equation to represent LMA in paper versus transformer age
b) Equation to represent LMA in oil versus transformer age
The calculation can be divided into two stages. The first stage calculates the TI and the
second stage computes the transformers life consumption. LMA in paper and TI are
predicted in the first stage of the calculation. The second stage calculates the life
consumption of a transformer. TI and a transformer’s life consumption will be
computed as the outputs for the calculation.

Chapter 5 Ageing Assessment of Paper through Low Molecular Weight Acid
Measurements
147
Figure 5.26 Calculation procedure for predicting TI and transformer life consumption.
Equation to represent LMA in oil versus
transformer age
Equation to represent LMA in paper
versus transformer age
INPUT
Modelling the relationship between LMA in paper and LMA in oil
Prediction of LMA in paper based on LMA in oil
Calculate TI based on Equation (5.4)
Prediction of TI based on LMA in paper
PREDICTION OF TI BASED ON LMA IN OIL
OUTPUT 1
TI
OUTPUT 2
Transformer life
consumption
Equation (5.4) = LMA in paper versus TI
Equation (4.1) = TI versus transformer age
PREDICTIONOFTRANSFORMER’SLIFE
CONSUMPTION BASED ON LMA Prediction of transformer’s life consumption
Calculate transformer life consumption based on Equation (4.1)

Chapter 5 Ageing Assessment of Paper through Low Molecular Weight Acid
Measurements
148
5.5.2. Prediction of TI based on LMA in oil
5.5.2.1. Prediction of LMA in paper based on LMA in oil
The first step is to determine the relationship between LMA in paper/LMA in oil and
transformer age. Two inputs are required for the model as follows:
Input 1 Relationship between LMA in paper and transformer age
LMA in paper versus transformer age can be represented by Equation (5.5).
Input 2 Relationship between LMA in oil and transformer age
The procedures to determine the equation that can represent LMA in oil versus
transformer age are shown in Figure 5.27.
Figure 5.27 Procedure of modelling the relationship between LMA in oil and
transformer age.
PRO 1 Assumptions
There are two limitations in determination of the equation that can represent the
relationship between LMA in oil and transformer age, and they are:
Assumptions
PRO 1
Fitting of TAN versus transformer age (based on distribution
transformers)
PRO 2
Apply the same equation of TAN versus transformer age
to LMA in oil versus transformer age
PRO 3

Chapter 5 Ageing Assessment of Paper through Low Molecular Weight Acid
Measurements
149
Lim 1 LMA in oil of scrapped transformers could not be measured since oil
samples are not available.
Lim 2 The number of LMA in oil of in-service transformers data in
Figure 5.21 is too small to have confidence on the fitting process.
Thus, three assumptions are made in order to simplify the fitting process and they are
listed as follows:
Asm 1 The amounts of LMA in oil of scrapped transformers are the same as
in-service transformers.
Based on the fact that both scrapped and in-service transformers operate
at transmission level where the loading profiles of all transformers do
not vary significantly.
Asm 2 The yearly LMA in oil follow the same increment pattern of yearly
TAN.
Based on the fact that the LMA percentage for transformers with age
ranging from 1 year to 42 years varies slightly with the average value of
26.1 % as shown in Table 5.9.
Asm 3 The yearly TAN of transmission transformers (400/132 kV, 400/275 kV
and 275/132 kV) is similar to distribution transformers (132/33 kV).
Based on fact that both 400/132 kV and 275/132 kV transformers are
interconnected at the 132 kV bus with 132/33 kV transformers and
should have similar pattern of loading.
PRO 2 Fitting of TAN versus transformer age
Due to Lim 2, it is difficult to model the relationship between LMA in oil versus
transformer age. Thus, an approach based on Asm 2 was employed which required
fitting of TAN versus transformer age. Further assumption is made based on Asm 3
since the available TAN data are from distribution transformers.
The same case study as in section 5.2.1.3 was used to determine the relationship
between TAN and transformer age as shown in Figure 5.28. It is observed that there is
a scattering of the data in the early age which is believed to be caused by abnormal
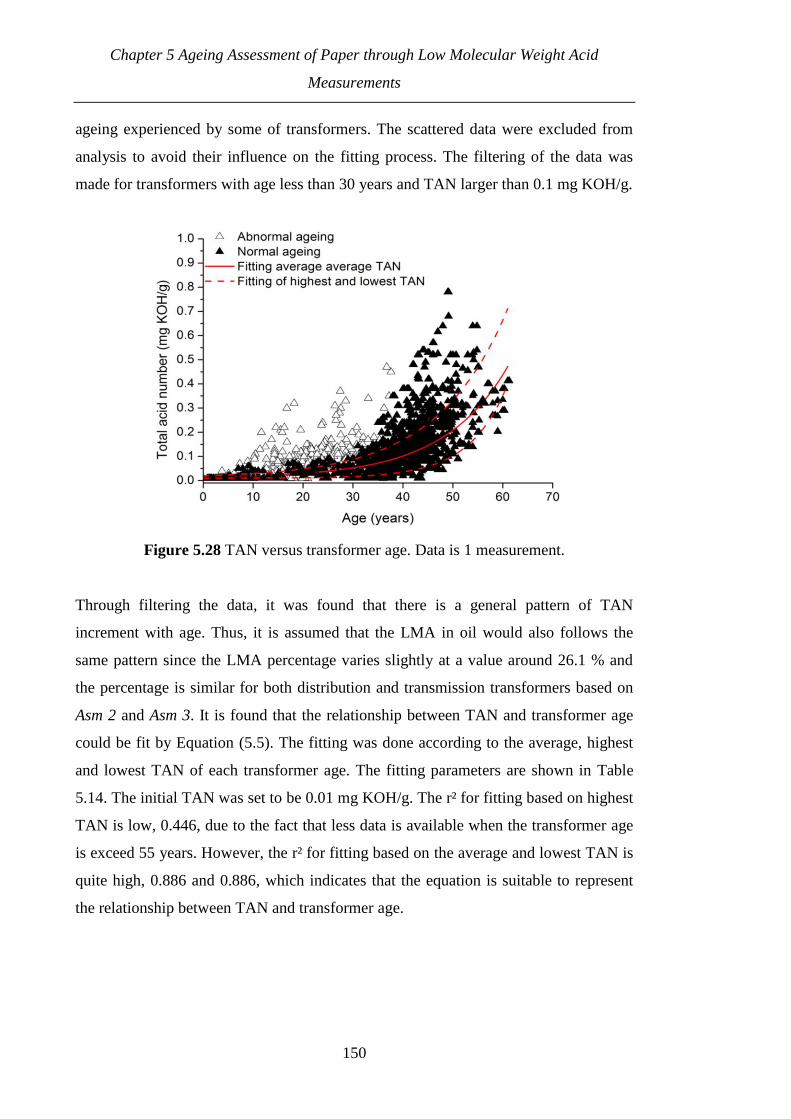
Chapter 5 Ageing Assessment of Paper through Low Molecular Weight Acid
Measurements
150
ageing experienced by some of transformers. The scattered data were excluded from
analysis to avoid their influence on the fitting process. The filtering of the data was
made for transformers with age less than 30 years and TAN larger than 0.1 mg KOH/g.
Figure 5.28 TAN versus transformer age. Data is 1 measurement.
Through filtering the data, it was found that there is a general pattern of TAN
increment with age. Thus, it is assumed that the LMA in oil would also follows the
same pattern since the LMA percentage varies slightly at a value around 26.1 % and
the percentage is similar for both distribution and transmission transformers based on
Asm 2 and Asm 3. It is found that the relationship between TAN and transformer age
could be fit by Equation (5.5). The fitting was done according to the average, highest
and lowest TAN of each transformer age. The fitting parameters are shown in Table
5.14. The initial TAN was set to be 0.01 mg KOH/g. The r² for fitting based on highest
TAN is low, 0.446, due to the fact that less data is available when the transformer age
is exceed 55 years. However, the r² for fitting based on the average and lowest TAN is
quite high, 0.886 and 0.886, which indicates that the equation is suitable to represent
the relationship between TAN and transformer age.

Chapter 5 Ageing Assessment of Paper through Low Molecular Weight Acid
Measurements
151
Table 5.14 Increment rate of TAN and constant of the fitting.
Fitting
parameters
Based on
average TAN
Based on
highest TAN
Based on lowest
TAN
B (mg KOH/g) 4.3×10⁻³
9.3×10⁻³
0.14×10⁻³
C( 1years ) 7.7×10⁻²
7.1×10⁻²
1.3×10⁻²
r² 0.886 0.446 0.886
PRO 3 Apply the same equation of TAN versus transformer age to LMA in oil
versus transformer age
To model the LMA in oil versus transformer age, by applying the same equation as
TAN versus transformer age, is shown in Figure 5.29. The result of the fitting can be
seen in Table 5.15. The initial LMA in oil was set to 0.001 mg KOH/g. The low r²,
0.364, is due to less data available for the study.
Figure 5.29 LMA in in-service oil versus transformer age.
Table 5.15 Increment rate of LMA in oil and constant of the fitting.
Fitting parameters Value
B (mg KOH/g) 2.0×10⁻³
C (years-1
) 6.3×10⁻²
r² 0.364

Chapter 5 Ageing Assessment of Paper through Low Molecular Weight Acid
Measurements
152
The final step is to combine Equation (5.7) and Equation (5.8) in order to develop
Equation (5.9) as shown in Figure 5.30. The constant, B and increment rate of LMA in
paper, C in Equation (5.7) was obtained based on the average LMA as shown in Table
5.5.
Figure 5.30 Modelling procedure for the relationship between LMA in paper and
LMA in oil
5.5.2.2. Prediction of TI based on LMA in paper
Once the model for LMA in paper versus LMA in oil is obtained, the TI could be
predicted based on Equation (5.4). An example of the TI calculation based on LMA in
oil is shown as follows:
Step 1 Measure LMA in oil from in-service transformers
For examples, the LMA in oil measured from two transformers are 0.01 mg
KOH/g and 0.03 mg KOH/g.
0.09AgeLMA in paper = 0.12+0.056exp (5.7)
LMA IN PAPER VERSUS TRANSFORMER AGE
0.06AgeLMA in oil = 0.001+0.002exp
(5.8)
LMA IN OIL VERSUS TRANSFORMER AGE
+
=
1.41LMA in oil-0.001LMA in paper = 0.12+0.056( )
0.002 (5.9)
LMA IN PAPER VERSUS LMA IN OIL

Chapter 5 Ageing Assessment of Paper through Low Molecular Weight Acid
Measurements
153
Step 2 Calculate LMA in paper based on Equation (5.9)
Based on Equation (5.9), the LMA in paper for both transformers are 0.59 mg
KOH/g and 2.55 mg KOH/g.
Step 3 Calculate TI based on Equation (5.4)
Through Equation (5.4), the predicted TI for both transformers are 97.9 Nm/g
and 49.1 Nm/g.
Since the prediction is made based on a few reasonable assumptions, an error on the
prediction of TI of the paper could be expected. The model could be improved if the
oil of a transformer which is planned to be scrapped can be obtained for the
measurement of LMA. Through this procedure, the relationship between LMA in
paper and oil could be refined and thus improve the prediction of TI.
5.5.2.3. Ratio of LMA in paper in oil
A study was conducted to examine how the LMA in paper and oil ratio changes over a
transformer’s life. The ratio shown in Equation (5.10) was calculated based on the data
of the same age obtained from both Equation (5.7) and Equation (5.8).
LMA in paper versus transformer age
Ratio of LMA in paper and oil = LMA in oil versus transformer age
(5.10)
The relationship between LMA in paper/oil ratio and transformer age can be seen in
Figure 5.31. It is observed that initially, the ratio reduces slightly and starts to increase
after 10 years in-service. It is believed that at the initial stage of ageing, less LMA is
generated in transformers and most of them are consumed to accelerate the ageing of
the paper. As the paper aged, more LMA will be generated in the system and stay in
the paper which contributes to the increment of the ratio. It is suspected that at this
point, the generation of LMA is higher than the consumption of LMA since the
measured LMA is a result from the subtraction of LMA generation with LMA
consumption.

Chapter 5 Ageing Assessment of Paper through Low Molecular Weight Acid
Measurements
154
Figure 5.31 Ratio of LMA in paper and oil versus transformer age
5.5.3. Prediction of transformers life consumption based on LMA
5.5.3.1. Prediction of transformer life consumption
Transformer life consumption could be calculated based on the predicted TI obtained
from the LMA in oil. The first step is to re-arrange Equation (4.1) into Equation (5.11).
0
TI
lnTI -lnTIt =
C (5.11)
where TI = Predicted TI (Nm/g).
TI0 = Initial TI (Nm/g).
CTI = Ageing rate (years-1
).
t = Life (years).
Ageing rate based on average initial TI and lowest measured TI are chosen in order to
illustrate the life consumption calculation. The ageing rate based on these criteria is
3.71×10⁻²
as given in Table 4.11 of Chapter 4 while according to Table 4.4 of Chapter
4, the average initial TI is 107 Nm/g. By using the predicted TI from the previous

Chapter 5 Ageing Assessment of Paper through Low Molecular Weight Acid
Measurements
155
example in section 5.5.2.2, the life consumption can be calculated based on Equation
(5.11) and the result can be seen in Table 5.16.
Table 5.16 Life consumptions based on average initial TI of 107 Nm/g.
Predicted TI (Nm/g) 97.9 Nm/g 49.1 Nm/g
Life consumed (years) 2 21
5.6. Summary
LMA could affect the performance of the breakdown voltage of oil. It is shown that the
breakdown voltage of oil could be reduced to half when LMA in oil is as low as 0.06
mg KOH/g. There is no effect of HMA on this property. LMA has a significant impact
to the ageing of paper. The impact is greatly enhanced with moisture as the ageing rate
can be increased by a factor of 6. On the other hand, it is observed that there is little
effect of HMA on ageing of paper.
There is no significant difference of LMA in paper profile along phases and windings
of scrapped transformers. The profile of LMA in paper for multilayer insulation shows
that there is an existence of chemical degradation which mainly involves the paper
layer in contact with oil. Two relationships were found between LMA in paper, TI and
transformer age. The first relationship shows that as LMA in paper increases, TI
decreases. The shape of Chendong’s model between furanic compounds and degree of
polymerization [75] was found suitable to represent the relationship between LMA in
paper and TI. It is also found that LMA in paper increases as transformer age
increases.
The LMA ratio in paper and oil is strongly influenced by the weight ratio of paper and
oil. A study on the in-service oil shows that there is a slight increment of LMA in oil
as age increases. The average percentage of LMA in in-service aged oil is around 26.1
%. Further study on laboratory aged oils shows that LMA could also be generated
from the oil. Using information obtained from scrapped and in-service transformers, a
general TI prediction model based on LMA in oil was developed with a few reasonable
assumptions.

Chapter 6 Ageing Assessment of Natural Ester
156
CHAPTER 6. AGEING ASSESSMENT OF NATURAL ESTER
6.1. Introduction
In recent years, application of alternative insulating liquids for transformers is
becoming an important topic since the demand for the high fire safety is increased.
Natural ester is viewed as one of the possible replacement for mineral oil.
Acidity and viscosity are common methods used to assess the oxidation level of
natural ester. Acidity is usually expressed as Total Acid Number (TAN) and viscosity
is defined as fluid’s internal resistance to flow, also known as a measure of fluid
friction. Acids accelerate the ageing process of oil and paper. Recently it was
suggested that the current measurement technique of TAN is unsatisfactory since it
could not distinguish the types of acid in oil [16, 19]. According to these studies, it
was found that acids generated from ageing of paper and mineral oil consist of Low
Molecular Weight Acid (LMA) and High Molecular Weight Acid (HMA), where
LMA was found to be more dangerous since it could accelerate the paper degradation
[16]. However, there is no study being conducted on the LMA and HMA of natural
ester and its impact toward paper ageing.
The performance of natural ester under oxidation is examined through TAN and
viscosity measurements. Next, the behaviour of natural ester aged under sealed
condition is examined. TAN, viscosity, LMA and HMA measurements were carried
out throughout the ageing duration. Finally, the effect of LMA and HMA on the paper
ageing and the breakdown voltage of natural ester are discussed in this chapter.
6.2. Oxidation of natural ester
The first part of this section investigates the oxidation process of natural ester. The
second part discusses the behaviour of natural ester under oxidation and pyrolysis with
the presence of paper, copper and steel.

Chapter 6 Ageing Assessment of Natural Ester
157
6.2.1. Ageing of natural ester only
6.2.1.1. Experiment description
Aged natural ester and mineral oil were obtained from previous ageing experiments.
The natural ester and mineral oil were aged without paper and copper at 115 °C under
open and sealed conditions. TAN was measured for each sample.
6.2.1.2. Test results
The comparison of TAN between natural ester and mineral oil aged under open
condition without any presence of paper, copper and steel can be seen in Figure 6.1. It
is observed that the TAN of natural ester is higher than mineral for all ageing
durations. The TAN of natural ester starts to increase rapidly after 7 days of ageing. On
the other hand, the increment of TAN for mineral oil is almost linear. The results show
that under oxidation, the generation of TAN for natural ester is much higher than
mineral oil.
Figure 6.1 TAN of natural ester and mineral oil aged at 115 °C under open condition
without any presence of paper, copper and steel. Data is 1 measurement.

Chapter 6 Ageing Assessment of Natural Ester
158
6.2.2. Ageing of natural ester with presence of paper, copper and steel
6.2.2.1. Experiment description
High temperature laboratory accelerated ageing experiments were conducted based on
two ratios ageing materials. The first ratio, define as single ratio for material
weight/surface area of oil, paper, copper and steel can be seen in Table 6.1. The ratio
was calculated according to a 6.6 kV/415 V, 1 MVA free breathing natural ester filled
distribution transformer.
Table 6.1 Amount of oil, paper, copper and steel ratio for single ratio.
Natural ester (ml) Kraft paper (g) Copper (cm2) Steel (cm
2)
900 7.86 0.10 3.31
The second ratio can be seen in Table 6.2 and it is defined as double ratio. Natural
ester and mineral oil were used for the ageing experiments of double ratio for
comparative purpose.
Table 6.2 Amount of oil, paper, copper and steel ratio for double ratio.
Natural ester/mineral oil (ml) Kraft Paper (g) Copper (cm²) Steel (cm²)
900 7.86 0.20 6.62
Kraft paper with a density of 0.93 g/cm³ was used for all ageing experiments. The oil
and paper were dried and filtered according to the procedure described in section 3.5.1
and 3.5.2 of Chapter 3. On the other hand, copper and steel were de-coated by a sand
paper in order to remove the surface oxidation layer.
Open and sealed ageing experiments were conducted for both ratios of natural ester
and only sealed ageing experiment was carried out for mineral oil. For sealed samples,
PTFE screw cap with a gasket ring was used and the sealing tape was wrapped around
the bottle neck in order to reduce the migration of oxygen from outside.
The ageing temperature was set at 170 °C and only 6 samples were placed in the air
circulating oven at any given time in order to obtain a good and even temperature

Chapter 6 Ageing Assessment of Natural Ester
159
distribution for all the samples. The longest ageing duration for single ratio samples
was set to 50 days. Only natural ester was used for the single ratio ageing experiment.
All double ratio samples were aged for 10, 20, 23 and 27 days. However for natural
ester, 23 days sealed sample, was not used for analysis since there was probably a
sealing problem.
6.2.2.2. Test results
a) TAN
Figure 6.2 shows the comparison of TAN for natural ester and mineral oil aged under
open condition with presence of paper, copper and steel between single and double
ratios.
Figure 6.2 TAN of natural ester aged at 170 °C under open condition with presence of
paper, copper and steel. Data is 1 measurement.
It is observed that for natural ester, the initial increment of TAN is slow for both single
and double ratio samples. After 10 days of ageing, the TAN increases rapidly and
saturates after 30 days of ageing for single ratio samples and 23 days of ageing for
double ratio samples. The high amount of TAN for natural ester might be caused by
severe oxidation and pyrolysis. The oxidation is contributed by the free oxygen of
open samples while pyrolysis from the high temperature of the ageing experiment.

Chapter 6 Ageing Assessment of Natural Ester
160
It was found that there is a small effect of doubling the surface area of steel and copper
on the TAN of natural ester. The TAN of double ratio samples are slightly higher and
saturate faster than those of single ratio samples. The highest TAN for single and
double ratio samples is 9.27 mg KOH/g and 8.77 mg KOH/g.
b) Viscosity
The viscosity of natural ester aged under open condition with the presence of paper,
copper and steel can be seen in Figure 6.3. It is observed that the increment of
viscosity for mineral oil is not as rapid as natural ester. The viscosity increases from 10
cP to 23 cP after 60 days of ageing.
It was found that the viscosity of natural ester starts to increase rapidly after 10 days of
ageing and reaches the plateau after 30 days of ageing. The high viscosity of natural
ester indicates that both oxidation and pyrolysis could significantly change the
molecular structure of natural ester. According to the previous literature [106], the
mechanism of viscosity change can be described by the molecular weight change.
Under the presence of air, the triglycerides molecules of natural ester are exposed to
thermal polymerization. Through this process, the molecules will react with oxygen
and lead to chain scission or cross linking. Chain scission and cross linking will result
in the production of large molecules which can change the molecular weight and
increase the viscosity.

Chapter 6 Ageing Assessment of Natural Ester
161
Figure 6.3 Viscosity of natural ester aged under open condition with presence of
paper, copper and steel. Data are mean of 5 measurements. Mineral oil was aged under
open condition with paper, copper, zinc, iron and aluminium [107].
It is shown that there is no clear effect of doubling the surface area of copper and steel
on the viscosity of natural ester. The only difference of viscosity between single and
double ratio samples is observed at 10 days of ageing where the viscosity of double
ratio samples is twice higher than that of single ratio samples. The highest viscosity for
single and double ratio samples is 417.6 cP and 518.6 cP.
It is generally known that even severely aged mineral oil in an in-service transformer
can seldom have a significant increase of viscosity, therefore viscosity is not normally
used as the indicator of ageing for mineral oil. To show the comparison, some
viscosity results of mineral oil are also plotted in Figure 6.3. The viscosity data of
mineral oil was obtained from previous literature [107]. The materials ratio of the
ageing experiment is 30 g of paper/pressboard, 300 ml of mineral oil, 0.15 g of
aluminium, 0.15 g of zinc, 0.75 g of iron and 0.75 g of copper. The sample was aged at
130 °C under open condition for 60 days [107].

Chapter 6 Ageing Assessment of Natural Ester
162
6.2.2.3. Relationship between viscosity and TAN
Figure 6.4 shows that there are 2 stages which can be observed from the relationship
between viscosity and TAN of natural ester aged under open condition with the
presence of paper, copper and steel. In the first stage, the viscosity increases linearly as
TAN increases to 8 mg KOH/g which indicates that the molecular weight change
occurs at the same time as the generation of acids. The molecular weight change of
natural ester occurs as a result of chain scission and cross linking of triglycerides
molecules [106]. The second stage starts once the chain scission and cross linking of
triglycerides molecules reduces and TAN continues to increase. It is shown that the
viscosity remains unchanged as TAN increases beyond 8 mg KOH/g.
Figure 6.4 Viscosity versus TAN of natural ester aged under open condition with
presence of paper, copper and steel. Viscosity data are mean of 5 measurements. TAN
data is 1 measurement.
6.2.2.4. Oxidation inhibitor depletion
Oxidation inhibitor is quite important to be present in order to prevent severe oxidation
of natural ester. Oxidation of natural ester can be promoted by free radicals produced
by interaction of triglycerides molecules with oxygen. The oxidation inhibitor helps to
interrupt and terminate the process of the free radicals generation [108]. Once the

Chapter 6 Ageing Assessment of Natural Ester
163
oxidation inhibitor is depleted, natural ester will suffer rapid oxidation, which led to
the rapid change of its physical and chemical properties.
It is believed that the ageing of natural ester under severe oxidation and pyrolysis can
be described by 3 stages. The first stage is the consumption of oxidation inhibitor. At
this period, the TAN and viscosity increases slowly with time because the oxidation
inhibitor is still available to protect the natural ester from oxidation as shown in Figure
6.1, Figure 6.2 and Figure 6.3.
The second stage starts once the oxidation inhibitor is depleted. It is shown by the
rapid increment of TAN and viscosity, as shown in Figure 6.2 and Figure 6.3 after 10
days of ageing for natural ester. Since the ageing temperature is high in these case
studies, it is believed that pyrolysis might exist together with oxidation and helped to
accelerate the degradation of natural ester.
The third stage initiates once the TAN saturates at a high value and it is observed that
at this stage the natural ester changes to a dark coloured and gelling substance which
first appears on the top part of the bottle as shown in Figure 6.5 a). The bulk natural
ester is not gelled yet because it has a small surface area to access oxygen i.e. large
volume/surface ratio. Exposure of natural ester with a large surface area to access
oxygen i.e. small volume/surface ratio, will cause it to oxidize more rapidly.
Moreover, it was also found that the LMA and HMA content of natural ester at this
stage could not be determined since the mixture of water and oil could not be separated
and a yellowish solution was created as shown in Figure 6.5 b). It is believed that the
chemical structure of the sample has changed significantly after subjected to oxidation
and pyrolysis.

Chapter 6 Ageing Assessment of Natural Ester
164
a) b)
Figure 6.5 Natural ester aged under open condition with presence of paper, copper,
and steel for single ratio samples. a) Natural ester condition after 50 days of ageing and
b) Mixture of aged natural ester and water.
6.3. Application of natural ester to sealed transformers
In order to ensure and maintain optimum performance of natural esters, exposure to
oxygen must be minimized. Thus, sealing against air is the best way to gain benefits
from natural ester. This section investigates the performance of natural ester aged
under sealed condition. The LMA and HMA ratio of natural ester is also examined in
the final part of this section.
6.3.1. Ageing of natural ester only
6.3.1.1. Experiment description
The description of the ageing experiment can be seen in section 6.2.1.1. TAN, LMA
and HMA were measured for each sample.
6.3.1.2. Test results
Figure 6.6 shows the TAN of natural ester and mineral oil aged without any presence
of paper, copper and steel. It was found that the TAN generated by natural ester aged
under sealed condition is much lower than open condition as seen in Figure 6.1. The
highest TAN for natural ester aged under sealed condition is 0.21 mg KOH/g while
under open condition is 0.72 mg KOH/g. There is no rapid increment of TAN and it is
Gelling
substance
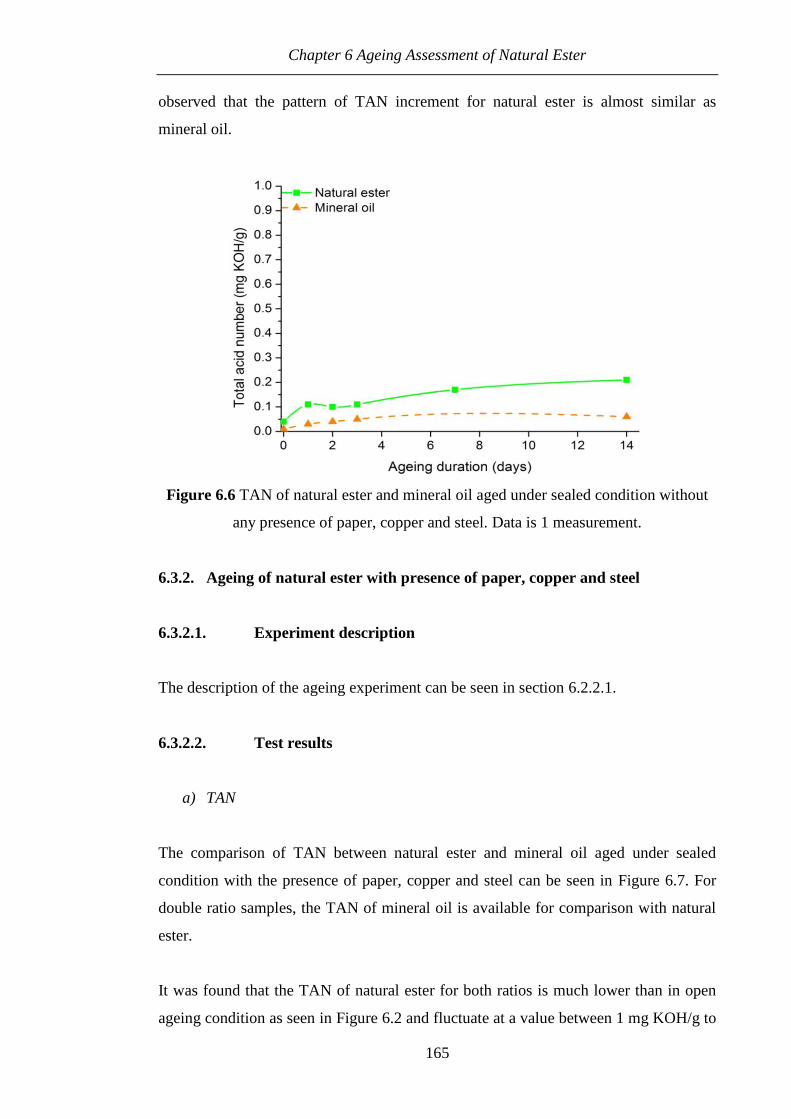
Chapter 6 Ageing Assessment of Natural Ester
165
observed that the pattern of TAN increment for natural ester is almost similar as
mineral oil.
Figure 6.6 TAN of natural ester and mineral oil aged under sealed condition without
any presence of paper, copper and steel. Data is 1 measurement.
6.3.2. Ageing of natural ester with presence of paper, copper and steel
6.3.2.1. Experiment description
The description of the ageing experiment can be seen in section 6.2.2.1.
6.3.2.2. Test results
a) TAN
The comparison of TAN between natural ester and mineral oil aged under sealed
condition with the presence of paper, copper and steel can be seen in Figure 6.7. For
double ratio samples, the TAN of mineral oil is available for comparison with natural
ester.
It was found that the TAN of natural ester for both ratios is much lower than in open
ageing condition as seen in Figure 6.2 and fluctuate at a value between 1 mg KOH/g to

Chapter 6 Ageing Assessment of Natural Ester
166
2 mg KOH/g. On the other hand, for mineral oil, there is a linear increment of TAN at
a much lower value than natural ester. The double ratio samples have a highest value
of 0.09 mg KOH/g after aged for 27 days. It is believed that the generation of TAN in
sealed samples is dominated by pyrolysis since there is little oxygen and water existing
in a sample initially. As the ageing progresses, water is produced from degradation of
paper and natural ester which will initiates the hydrolysis of natural ester.
Figure 6.7 TAN of natural ester and mineral oil aged under sealed condition with
presence of paper, copper and steel. Data is 1 measurement. For S. Tenbohlen, mineral
oil was aged under sealed condition with paper, copper, zinc, iron and aluminium
[107]. For R. Liao, mineral oil was aged under sealed condition with paper and copper
[2].
It is observed that the effect of doubling the surface area of steel and copper on the
TAN of natural ester is slightly different in sealed condition from open condition. The
TAN of double ratio samples are lower than those of single ratio samples. The highest
TAN of single ratio samples is 2.06 mg KOH/g while that of double ratio samples is
1.37 mg KOH/g.
Additional TAN of mineral oil was also obtained from literatures [2, 107] and plotted
together in Figure 6.7. The ageing condition for S. Tenbohlen’s experiment is
described in section 6.2.2.2 b). The ageing condition for R. Liao’s experiment is
described in [2]. The materials ratio of this ageing experiment is 5 g of paper, 50 g of

Chapter 6 Ageing Assessment of Natural Ester
167
mineral oil and 100 cm² of sheet copper [2]. The sample was aged at 130 °C under the
sealed condition for 65 days. The highest TAN of mineral oil is from S. Tenbohlen
with a value of 0.22 mg KOH/g and R. Liao with a value of 0.08 mg KOH/g.
b) Viscosity
The comparison of viscosity between natural ester and mineral oil aged under sealed
condition with paper, copper and steel can be seen in Figure 6.8. For double ratio
samples, the viscosity of mineral oil is available for comparison with natural ester.
The viscosity of natural ester for both ratios remains unchanged at a value around 32
cP until the end of ageing period. Based on double ratio samples, it was found that the
pattern of viscosity for mineral oil is similar to natural ester, it remains unchanged at a
value around 8 cP. Since little oxygen and water exist in the sample initially, the
polymerization of tryiglycerides molecules is slow which results in the little change of
molecular weight. Thus, since the change in the molecular weight is less, the viscosity
of natural ester remains unchanged during the ageing period.
Figure 6.8 Viscosity of natural ester and mineral oil aged under sealed condition with
presence of paper, copper and steel. Data are mean of 5 measurements. For S.
Tenbohlen, mineral oil was aged under sealed condition with paper, copper, zinc, iron
and aluminium [107].

Chapter 6 Ageing Assessment of Natural Ester
168
There is no effect of doubling the surface area ratio of copper and steel on the viscosity
of natural ester. The average viscosity for both single and double ratio at 40 °C is
around 30 cP.
On the contrary, there is a slight change in the viscosity of mineral oil observed by S.
Tenbohlen. The ageing condition for S. Tenbohlen is described in section 6.2.2.2 b)
[107]. Since the viscosity measurements were only done at the beginning and the end
of S. Tenbohlen’ experiment, his results are inconclusive.
6.3.2.3. Relationship between viscosity and TAN
The relationship between viscosity and TAN of natural ester aged under sealed
condition with presence of paper, copper and steel can be seen in Figure 6.9. It is
observed that the pattern is different from open samples as seen in Figure 6.4. The
viscosity increases only slightly and remains unchanged when acidity is increased
from 1.03 mg KOH/g to 2.06 mg KOH/g. The result indicates that by minimising the
contact of natural ester with oxygen, the chain scission and cross linking of natural
ester triglycerides molecules could be reduced significantly.
In sealed condition, it is envisaged that reaching stage 2 as shown in Figure 6.4 will
take considerably long time hence it is absolutely right for the natural ester
manufacturers to recommend natural ester to be used in sealed transformers.

Chapter 6 Ageing Assessment of Natural Ester
169
Figure 6.9 Viscosity versus TAN of natural ester aged under sealed condition with
presence of paper, copper and steel. Viscosity data are mean of 5 measurements. TAN
data is 1 measurement.
6.3.3. LMA and HMA of natural ester
6.3.3.1. LMA and HMA ratio for ageing of natural ester only
a) Experiment description
The description of the ageing experiment can be seen in section 6.2.1.1.
b) Test results
Figure 6.10 shows the comparison of LMA and HMA for natural ester and mineral oil
aged under sealed ageing condition without any presence of paper, copper and steel. It
was found that there is a small increment of LMA in natural ester. The highest LMA
and HMA in natural ester are 0.048 mg KOH/g and 0.19 mg KOH/g. On the other
hand, the increment trend of LMA in mineral oil is not significant as in natural ester.
The highest LMA and HMA in mineral oil are 0.0048 mg KOH/g and 0.032 mg
KOH/g.

Chapter 6 Ageing Assessment of Natural Ester
170
Figure 6.10 LMA and HMA of natural ester and mineral oil aged under sealed
condition without any presence of paper, copper and steel. LMA and HMA of natural
ester data is 1 measurement.
The LMA/HMA percentages versus ageing duration for both natural ester and mineral
oil without any presence of paper, copper and steel are given in Table 6.3. The
calculation of LMA/HMA percentage was carried out according to Equation (5.5) of
Chapter 5. For natural ester, it is observed the LMA percentage ranges from 7.5 % and
26.8 % with an average percentage of 16.9 %. For mineral oil, the LMA percentage is
slightly lower than natural ester and ranges from 13.2 % to 17.9 % with an average
percentage of 15.8 %.
Table 6.3 LMA and HMA percentages in natural ester and mineral oil aged under
sealed condition without any presence of paper, copper and steel.
Ageing time
(days)
Natural ester
(%)
Mineral oil
(%)
LMA HMA LMA HMA
1 17.1 82.9 17.5 82.5
2 7.5 92.5 17.9 82.1
3 26.8 73.2 14.3 85.7
7 20.2 79.8 - -
14 12.8 87.2 13.2 86.8

Chapter 6 Ageing Assessment of Natural Ester
171
It is observed that the average percentage of LMA generated by natural ester is 16.9 %.
However, the percentage might be changed if the natural ester is aged with paper.
Thus, the study of LMA and HMA ratio was carried out on natural ester aged under
sealed condition with the presence of paper, copper and steel.
6.3.3.2. LMA and HMA ratio of natural ester aged with presence of paper,
copper and steel
a) Experiment description
The description of the ageing experiment can be seen in section 6.2.2.1.
b) Test results
The comparison of LMA and HMA in natural ester and mineral oil aged under sealed
condition with the presence of paper, copper and steel can be seen in Figure 6.11.
There is no clear increment pattern of LMA in natural ester observed for single ratio
samples. On the contrary, it is observed that there is an increment trend of LMA in
natural ester for double ratio samples.
It was found the amount of LMA for ageing of natural ester with presence of paper,
copper and steel is higher than ageing of natural ester only shown in Figure 6.10. One
of the possible reasons is due to the polar nature of natural ester. As paper aged, more
LMA will be produced in the system. Since natural ester is much more polar, therefore
the partition between paper and natural ester favours the stay of LMA in natural ester.
It is observed that the LMA in natural ester for single and double ratio samples is
higher than mineral oil. From section 6.3.2.2 a), it was shown that the TAN is much
higher in natural ester and so is the amount of LMA in natural ester is higher. It is
noticed that there is no clear increment pattern of LMA in mineral oil. The highest
LMA and HMA in mineral oil are 0.038 mg KOH/g and 0.015 mg KOH/g.
It was found that there is an effect of doubling the surface area of steel and copper on
the LMA of natural ester. The LMA of double ratio samples is slightly higher than that

Chapter 6 Ageing Assessment of Natural Ester
172
of single ratio samples. The highest LMA in natural ester for single ratio samples is
0.094 mg KOH/g while for double ratio samples 0.135 mg KOH/g.
Figure 6.11 LMA and HMA of natural ester and mineral oil aged under sealed
condition with presence of paper, copper and steel. LMA and HMA of natural ester
data is 1 measurement.
The LMA and HMA percentages of natural ester and mineral oil aged under sealed
condition with the presence of paper, copper and steel can be seen in Table 6.4. It was
found that mineral oil has a higher LMA percentage than natural ester. Most of acids in
mineral oil are LMA which percentages are ranging from 51.1 % to 71.3 %. On the
other hand, natural ester has a much lower LMA percentage than mineral oil ranging
from 1.5 % to 8.6 % for single ratio and from 4.6 % to 11.6 % for double ratio
samples. Most of acids in natural ester are HMA ranging from 91.4 % to 98.5 % for
single ratio samples and 88.3 % to 95.4 % for double ratio samples.
It was found that the average percentage of LMA for ageing of natural ester with the
presence of paper, copper and steel is lower than ageing of natural ester only as seen in
Table 6.3.

Chapter 6 Ageing Assessment of Natural Ester
173
Table 6.4 LMA and HMA percentages in natural ester and mineral oil aged under
sealed condition with presence of paper, copper and steel.
Ageing time
(days)
Natural ester -
single ratio
(%)
Natural ester -
double ratio
(%)
Mineral oil -
double ratio
(%)
LMA HMA LMA HMA LMA HMA
10 1.5 98.5 4.6 95.4 68.4 31.6
20 4.3 95.7 7.5 92.5 70.4 29.6
23 - - - - 71.3 28.7
27 - - 11.7 88.3 51.1 48.9
30 8.6 91.4 - - - -
40 3.4 96.6 - - - -
50 2.7 97.3 - - - -
A comparison was made for LMA in paper between natural ester and mineral ester as
seen in Figure 6.12. It is observed that LMA in paper for mineral oil is higher than
natural ester. The increment of LMA in paper for mineral oil is almost linear where the
concentration starts to slightly declined after 23 days of ageing. On the other hand,
LMA in paper for natural ester for both ratios remains almost unchanged after 10 days
of ageing at much lower value than mineral oil.
It was found that there is a significant effect of doubling the surface area of steel and
copper on the LMA in paper of natural ester. The LMA in paper of double ratio
samples saturates at much higher value than single ratio samples. The highest LMA in
paper of double ratio and single ratio samples are 4.1 mg KOH/g and1.7 mg KOH/g.

Chapter 6 Ageing Assessment of Natural Ester
174
Figure 6.12 LMA in paper of natural ester and mineral oil aged under sealed condition
with presence of paper, copper and steel. Data are mean of 2 measurements.
6.4. Effect of LMA and HMA on breakdown voltage of natural ester and
ageing of paper
The first part of this section examined the effect of LMA and HMA on the breakdown
voltage of natural ester. The effect of LMA and HMA on the paper aged under dry and
wet condition was studied in the second part of this section.
6.4.1. Effect of LMA and HMA on breakdown voltage of natural ester
6.4.1.1. Experiment description
Different amounts of either LMA ranging from 0.2 g to 1.6 g or HMA ranging from 1
g to 19 g were mixed with 500 ml dry and filtered natural ester by magnetic stirrer for
3 hours at 50 °C. The properties of these acids can be seen in Table 5.1 of Chapter 5.
The natural ester was dried and filtered according to the procedure described in section
3.5.1 of Chapter 3. After the mixing procedure, the natural ester sample was titrated for
acidity and tested for breakdown voltage. The breakdown voltage test was carried out
using mushroom VDE electrodes with a diameter of 36 mm according to ASTM
standard, ASTM D1816 [103]. A 50 Hz AC voltage with increasing rate of 0.5 kV/s

Chapter 6 Ageing Assessment of Natural Ester
175
was applied to the natural ester. The gap distance was set at 1 mm and a total of 50
measurements of breakdown voltage were carried out on each sample.
6.4.1.2. Test results
It was found that the breakdown voltage remains almost unchanged even after the
LMA reaches to 4 mg KOH/g as shown in Figure 6.13. The reason behind this
phenomenon might be due to the polar nature of natural ester. It is known that the
breakdown voltage of oils could be influenced by polar compounds such as water.
Once the saturation limit of water in oils is exceeded, the breakdown voltage will be
significantly reduced. Since LMA is a polar compound, it is suspected that its
saturation limit in natural ester is high, which might explain the reason why the
breakdown voltage is not affected.
Figure 6.13 Influence of LMA on the breakdown voltage of natural ester. Data are
mean of 50 tests and error bars represent the standard deviation. LMA in natural ester
data is 1 measurement.
It is observed that there is no effect of HMA on the breakdown of natural ester. The
breakdown voltage remains unchanged even after the HMA increases up to 9 mg
KOH/g as seen in Figure 6.14.
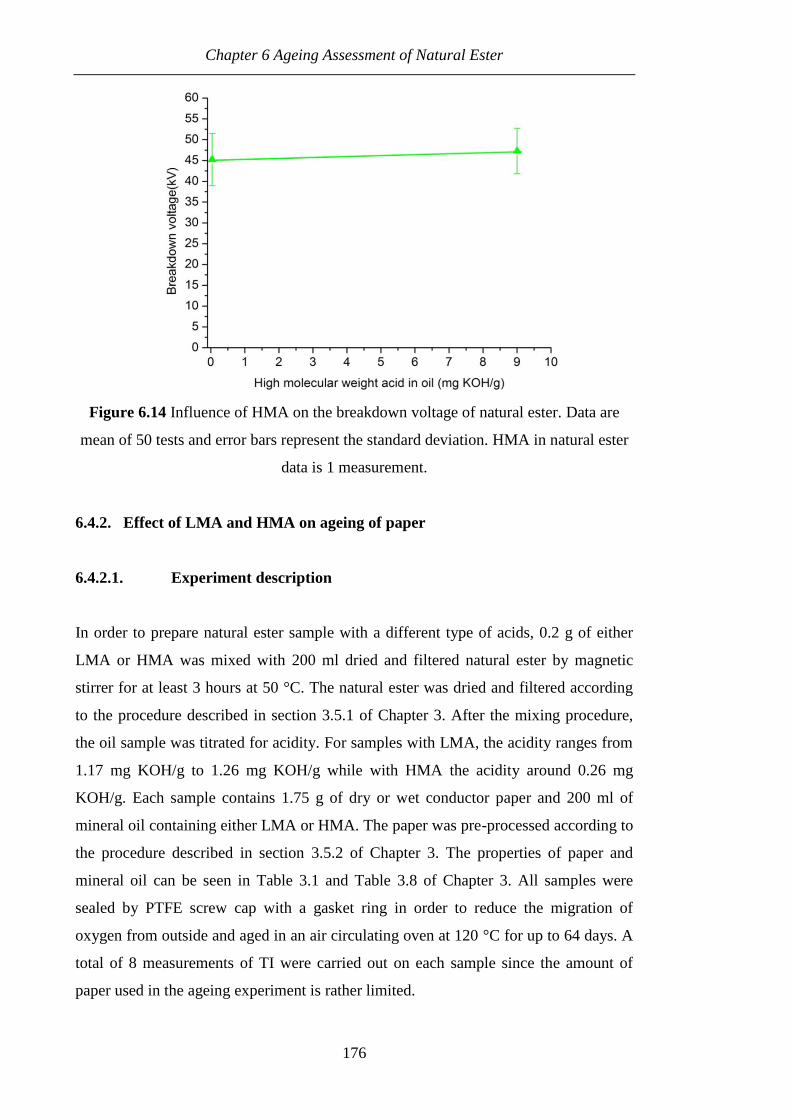
Chapter 6 Ageing Assessment of Natural Ester
176
Figure 6.14 Influence of HMA on the breakdown voltage of natural ester. Data are
mean of 50 tests and error bars represent the standard deviation. HMA in natural ester
data is 1 measurement.
6.4.2. Effect of LMA and HMA on ageing of paper
6.4.2.1. Experiment description
In order to prepare natural ester sample with a different type of acids, 0.2 g of either
LMA or HMA was mixed with 200 ml dried and filtered natural ester by magnetic
stirrer for at least 3 hours at 50 °C. The natural ester was dried and filtered according
to the procedure described in section 3.5.1 of Chapter 3. After the mixing procedure,
the oil sample was titrated for acidity. For samples with LMA, the acidity ranges from
1.17 mg KOH/g to 1.26 mg KOH/g while with HMA the acidity around 0.26 mg
KOH/g. Each sample contains 1.75 g of dry or wet conductor paper and 200 ml of
mineral oil containing either LMA or HMA. The paper was pre-processed according to
the procedure described in section 3.5.2 of Chapter 3. The properties of paper and
mineral oil can be seen in Table 3.1 and Table 3.8 of Chapter 3. All samples were
sealed by PTFE screw cap with a gasket ring in order to reduce the migration of
oxygen from outside and aged in an air circulating oven at 120 °C for up to 64 days. A
total of 8 measurements of TI were carried out on each sample since the amount of
paper used in the ageing experiment is rather limited.

Chapter 6 Ageing Assessment of Natural Ester
177
6.4.2.2. Ageing under dry condition
It was found that LMA has a significant effect on the paper aged under dry condition
in natural ester as seen Figure 6.15. There is no effect of HMA on the paper ageing and
it is observed that the effect is almost similar to with no acid. It is observed that the TI
of samples with LMA reach 50 % of its strength after 37 days of ageing while with
HMA and no acid after 64 days of ageing.
Figure 6.15 Influence of LMA and HMA on the paper aged under dry condition. Data
are mean of 8 samples and error bars represent the standard deviation.
The fitting of relationship between TI and ageing duration was carried out by Equation
(4.1). It was found that the rate of ageing for samples with HMA is similar to with no
acid as seen in Table 6.5. The rate of ageing of samples with LMA is 2 times higher
than with HMA and no acid.
Table 6.5 Ageing rate of dry condition.
Condition Ageing rate, CTI (days-1
) r²
With no acid 1.0×10⁻²
0.928
With LMA 1.9×10⁻²
0.909
With HMA 0.9×10⁻²
0.984

Chapter 6 Ageing Assessment of Natural Ester
178
6.4.2.3. Ageing under wet condition
Figure 6.16 shows the effect of LMA and HMA on the paper aged under wet condition
in natural ester. For all ageing conditions, the TI of 14 days samples are lower than
those of 28 days and 63 days samples and this could be caused by the systematic flaw
of sample preparation due to time limit, no confirmation test have been done so far.
Figure 6.16 Influence of LMA and HMA on the paper aged under wet condition. Data
are mean of 8 samples and error bars represent the standard deviation.
The fitting parameters for paper aged under wet condition in natural ester can be seen
in Table 6.6. It is observed that the fitting of samples with LMA and HMA is not good
due to the high scattering of the data. The r² for both samples are quite low compared
to with no acid.
Table 6.6 Ageing rate of wet condition.
Condition Ageing rate, CTI (days-1
) r²
With no acid 1.1×10⁻²
0.809
With LMA 2.4×10⁻²
0.388
With HMA 1.2×10⁻²
0.295
Table 6.7 shows the increments factors for natural ester and mineral oil under dry
ageing condition. The increment factor is calculated by Equation (5.1) of Chapter 5.
The increment factor of samples with LMA for natural ester aged under wet condition

Chapter 6 Ageing Assessment of Natural Ester
179
is not calculated because the fitting is not good. It is observed the increment factor for
natural ester is lower than mineral oil. It is suspected that some of the LMA remains in
natural ester because it is more polar which explain the increment factor of natural
ester is slightly lower than mineral oil.
Table 6.7 Comparison of increment factors between natural ester and mineral oil under
dry ageing conditions.
Condition Natural ester Mineral oil
With LMA 1.9
2.1
With HMA 0.9
0.9
6.5. Summary
Oxidation can significantly change the chemical and physical properties of natural
ester. The mechanism of the natural ester degradation under severe oxidation could be
divided into 3 stages. The first stage is the consumption of oxidation inhibitor. The
second stage is the fast oxidation phase of natural ester where the oxidation inhibitor
has already been depleted. The third stage is the saturation stage where natural ester
starts to experience severe physical and chemical changes. Thus, the cooling
performance of natural ester might be affected if it is used in free breathing
transformers.
On the other hand, it was found that natural ester is suitable for hermetically sealed
transformers. The TAN and viscosity remain stable even under high temperature of
ageing for a considerably long period. It is also noticed that more LMA stays in natural
ester which could be the direct reason why there is less severe degradation to the paper
in natural ester than in mineral oil, apart from water scavenging and hydrolytic
protections.
There is no effect of LMA and HMA on the breakdown voltage of natural ester within
the case study range. It is suspected that the saturation limit of LMA in natural ester is
high which prevents any reduction on the breakdown voltage.
Conclusions and future work
180
CHAPTER 7. CONCLUSIONS AND FUTURE WORK
7.1. Conclusions
7.1.1. General
This thesis described an extensive study on ageing assessment of the scrapped
transformers through Tensile Index (TI) and Low Molecular Weight Acid (LMA)
measurements as well as high temperature ageing assessment of paper/natural ester
insulation system. Through experimental examinations and data analyses, the
objectives of this thesis are accomplished and thus useful findings and conclusions are
made.
The topics covered in this thesis are as follows:
Ageing assessment of scrapped transformers though TI of paper measurements
o Examination on the TI profile among different phases, windings and layers,
o Modelling the relationship between TI and transformer age for the
transformer population,
o The relationship between TI and dielectric strength of the paper.
Ageing assessment of scrapped transformers through LMA measurements
o Examination on the LMA profile among different phases, windings and
layers,
o Modelling the relationship between LMA, transformer age and TI for the
transformer population,
o Development of the TI prediction model based on LMA in oil,
o The effect of LMA and HMA on the breakdown voltage of oil and on paper
ageing in mineral oil.
Ageing assessment of paper/natural ester system
o Examination on the performance of natural ester under high temperature
oxidation,
o Evaluate the suitability of natural ester application for sealed transformers,
o The effect of LMA and HMA on the breakdown voltage of natural ester and
paper ageing in natural ester.

Conclusions and future work
181
7.1.2. Summary of main findings
The TI profile of scrapped transformers was examined with consideration of phases,
windings, and layer locations. Based on the case studies, it was found that there is no
significant difference on the TI profiles among different phases and windings, and this
indicates that basic symmetry of thermal design and uniform ageing are achieved. The
vertical TI profile is mainly influenced by the temperature distribution and might
change if a large amount of water is present at the bottom location. It is known that the
ageing of paper could be accelerated by water. Investigation reveals that chemical and
thermal degradation are the main mechanisms affecting the layer profile. Based on the
population analysis, it was found that there is a relationship between TI and
transformer age and is well represented by the Weidmann model. According to this
model, the end of life of the transformer population is best represented by 20 %
retention of TIs and the estimated life for the population is around 43 years with 34
years and 53 years as lower and upper limit of 95 % confidence band. There is no end
of life criterion which can be made based on the dielectric strength of the paper since
this property is not influenced by ageing. However, aged paper might fail if it is
subjected to repeated discharges due to the weakness of the fibre and is susceptible
towards carbonization. The dielectric strength of the paper could also be affected if the
oil quality is heavily compromised.
It was found that LMA has a significant reduction effect on the breakdown voltage of
mineral oil. Investigation on the effect of LMA on paper ageing reveals that the ageing
rate is greatly enhanced if LMA is dissociated by water. The LMA in paper profile of
scrapped transformers was examined according to phases, windings and layer
locations. Similar as TI profile, the LMA in paper profile among different windings
and phases shows no major difference. The examination shows that the chemical
degradation mechanism does exist in multilayer insulation and it mainly affects the
outer layer paper. Based on the population analysis, it was found that LMA in paper
increases exponentially as the transformer age increases. The end of life criterion based
on LMA in paper could be determined if the analogy of the relationship between LMA
in paper and TI of paper is described the same as Chendong’s equation of furanic
compounds and degree of polymerization. The study on the LMA partitioning in paper
and oil shows that it is strongly influenced by the weight ratio of paper and oil. The

Conclusions and future work
182
average percentage of LMA in in-service aged oil is around 26.1 %. TI prediction
model based on LMA in oil was developed by using information obtained from
scrapped and in-service transformers based on a few reasonable assumptions. The life
of transformers could also be determined by this model.
The effect of high temperature oxidation on natural ester was studied and compared
with mineral oil. It was found that the oxidation of natural ester under high temperature
can be classified into three stages. The first stage is the fast consumption of oxidation
inhibitor. The second stage initiates once the oxidation inhibitor is depleted and the
third stage is the gelling and solidifying stage. It was found that natural ester is suitable
for application in sealed transformers since the ageing performance is good and
comparable to mineral oil. It is observed that most LMA tend to stay in natural ester
and this could be the reason for the good ageing property of paper in natural ester apart
from water scavenging and hydrolytic protection. Furthermore, it is shown that the
effect of LMA on the paper aged in natural ester is not as severe as in mineral oil. It is
suspected that the LMA migrates into natural ester more since it is more polar and thus
prevents severe degradation to the paper. It is also suspected that the saturation of
LMA in natural ester is high which prevents the natural ester from suffering the
reduction of AC breakdown voltage.
7.2. Future work
Although the end of life of transformer population is modelled by 10 transformers, the
end of life model can be further refined by obtaining more data from the early stage of
ageing (i.e. 5 years to 35 years).
The LMA in paper profiles along phases, windings and layers can be further examined
by studying the migration of LMA through oil circulation. Taking layer profile as an
example, the layer profile can be further studied by determining the extent of LMA
migration under different layers. The chemical and thermal degradation mechanisms of
layer profile could also be verified by laboratory experiments. Apart from migration of
LMA, the TI prediction model can be improved by obtaining LMA in oil before the
transformer is scrapped.

Conclusions and future work
183
Further examination can be carried out on the depletion of oxidation inhibitor by
GC/MS spectroscopy. The analysis can provide the detail view of the structural change
suffered by natural ester under severe oxidation. The polar nature of natural ester can
be further investigated by looking into partitioning of LMA in paper and natural ester
with the consideration of water.

Appendix I: Tensile Index (TI) of New and Service Aged Paper
184
APPENDIX I: Tensile Index (TI) of New and Service Aged Paper
Table I.1 TI of new conductor type paper without oil impregnation at different
lengths.
Test No. 15 mm (Nm/g) 30 mm (Nm/g) 60 mm (Nm/g) 180 mm
(Nm/g)
1 117.3 117.1 105.6 112.8
2 108.7 113.2 104.3 104.7
3 108.8 119.7 102.2 109.5
4 115.5 106.9 105.4 105.9
5 108.1 108.8 111.3 104.7
6 112.8 115.6 107.2 114.0
7 117.7 111.7 113.1 114.6
8 110.3 122.8 111.1 112.7
9 116.3 119.4 104.4 112.6
10 114.3 112.0 117.6 102.3
Average (Nm/g) 113.0 114.7 108.2 109.4
Standard
deviation (Nm/g) 3.8 5.1 4.9 4.6
Table I.2 TI of new layer type paper without oil impregnation.
Test No. 180 mm
(Nm/g)
1 89.5
2 92.5
3 94.9
4 93.3
5 96.5
6 89.1
7 87.9
8 92.1
9 87.1
10 93.7
Average (Nm/g) 91.6
Standard
deviation (Nm/g) 3.1
Table I.3 TI of new conductor type paper with oil impregnation.
Test No. S1 (Nm/g) S2 (Nm/g) S3 (Nm/g)
30 mm 180mm 30 mm 180mm 30 mm 180mm
1 109.7 107.5 117.2 105.8 105.8 102.7
2 113.8 97.6 99.9 99.9 110.1 111.3
3 109.7 108.0 108.4 97.1 112.3 105.8
4 108.6 112.9 105.3 105.2 104.9 106.6
5 113.0 105.9 108.0 104.8 110.8 105.4
6 117.3 113.4 107.7 106.5 105.0 107.9
7 101.9 105.4 101.9 107.5 109.8 98.9
8 117.3 101.6 112.1 106.0 110.1 100.9
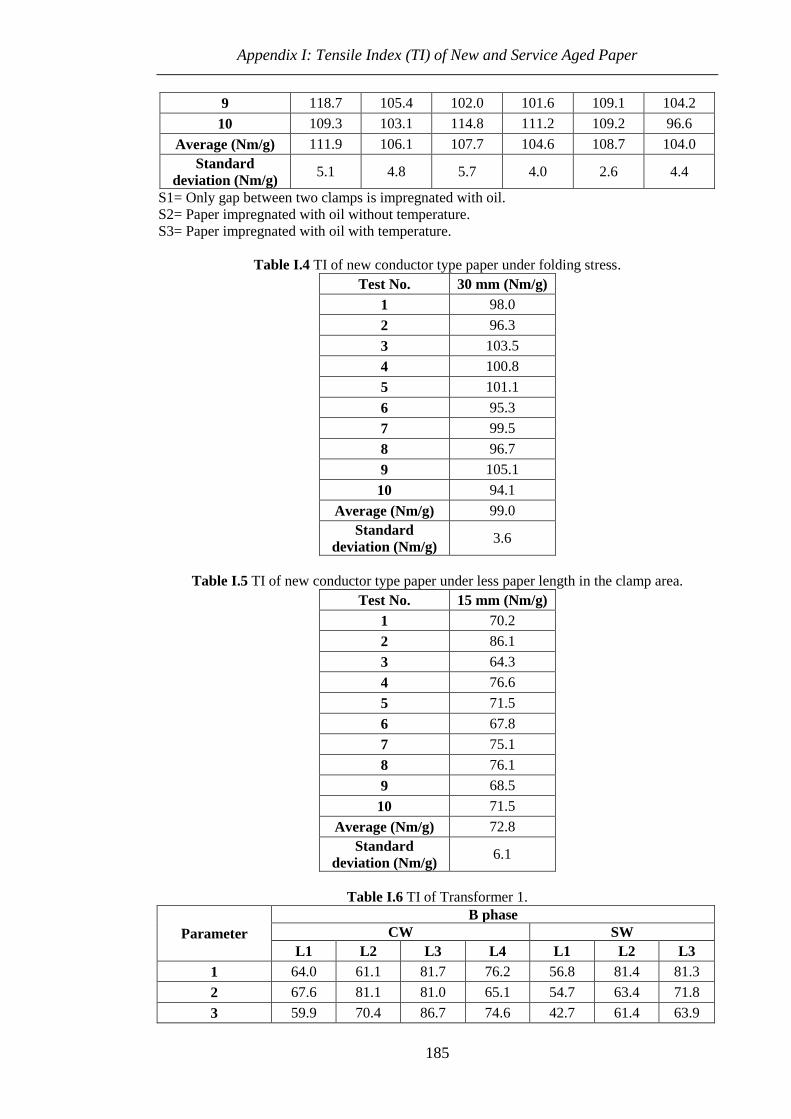
Appendix I: Tensile Index (TI) of New and Service Aged Paper
185
9 118.7 105.4 102.0 101.6 109.1 104.2
10 109.3 103.1 114.8 111.2 109.2 96.6
Average (Nm/g) 111.9 106.1 107.7 104.6 108.7 104.0
Standard
deviation (Nm/g) 5.1 4.8 5.7 4.0 2.6 4.4
S1= Only gap between two clamps is impregnated with oil.
S2= Paper impregnated with oil without temperature.
S3= Paper impregnated with oil with temperature.
Table I.4 TI of new conductor type paper under folding stress.
Test No. 30 mm (Nm/g)
1 98.0
2 96.3
3 103.5
4 100.8
5 101.1
6 95.3
7 99.5
8 96.7
9 105.1
10 94.1
Average (Nm/g) 99.0
Standard
deviation (Nm/g) 3.6
Table I.5 TI of new conductor type paper under less paper length in the clamp area.
Test No. 15 mm (Nm/g)
1 70.2
2 86.1
3 64.3
4 76.6
5 71.5
6 67.8
7 75.1
8 76.1
9 68.5
10 71.5
Average (Nm/g) 72.8
Standard
deviation (Nm/g) 6.1
Table I.6 TI of Transformer 1.
Parameter
B phase
CW SW
L1 L2 L3 L4 L1 L2 L3
1 64.0 61.1 81.7 76.2 56.8 81.4 81.3
2 67.6 81.1 81.0 65.1 54.7 63.4 71.8
3 59.9 70.4 86.7 74.6 42.7 61.4 63.9
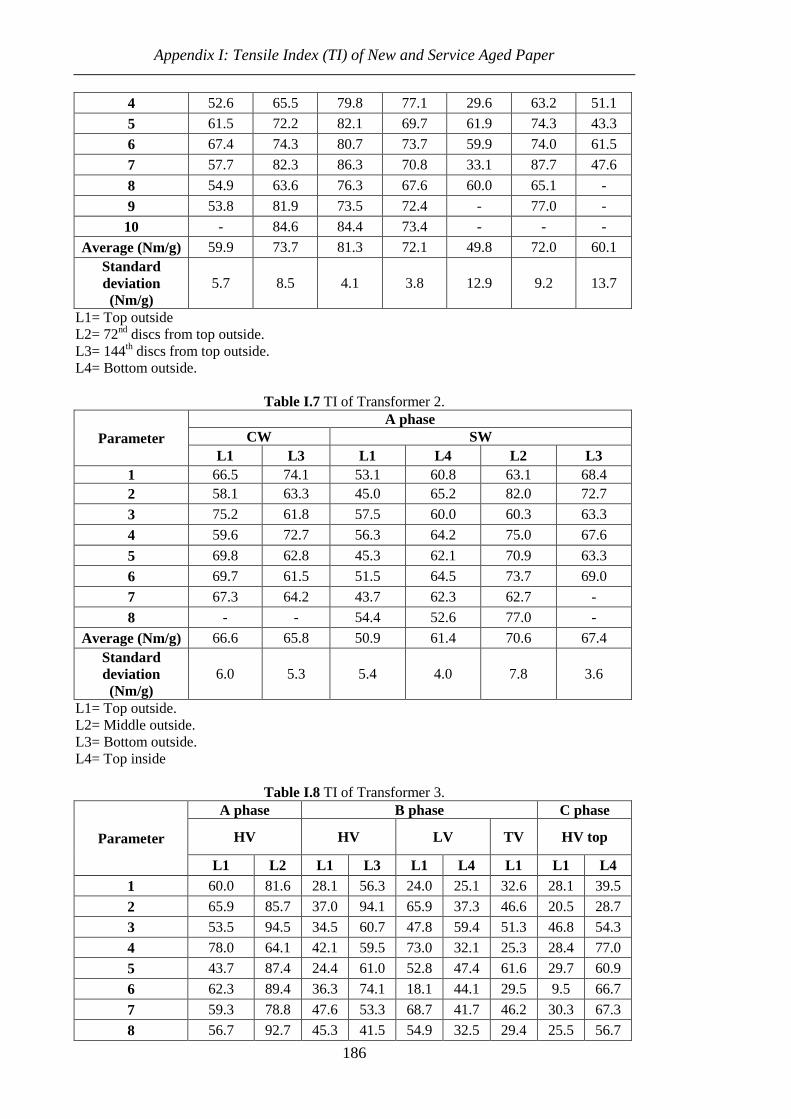
Appendix I: Tensile Index (TI) of New and Service Aged Paper
186
4 52.6 65.5 79.8 77.1 29.6 63.2 51.1
5 61.5 72.2 82.1 69.7 61.9 74.3 43.3
6 67.4 74.3 80.7 73.7 59.9 74.0 61.5
7 57.7 82.3 86.3 70.8 33.1 87.7 47.6
8 54.9 63.6 76.3 67.6 60.0 65.1 -
9 53.8 81.9 73.5 72.4 - 77.0 -
10 - 84.6 84.4 73.4 - - -
Average (Nm/g) 59.9 73.7 81.3 72.1 49.8 72.0 60.1
Standard
deviation
(Nm/g)
5.7 8.5 4.1 3.8 12.9 9.2 13.7
L1= Top outside
L2= 72nd
discs from top outside.
L3= 144th discs from top outside.
L4= Bottom outside.
Table I.7 TI of Transformer 2.
Parameter
A phase
CW SW
L1 L3 L1 L4 L2 L3
1 66.5 74.1 53.1 60.8 63.1 68.4
2 58.1 63.3 45.0 65.2 82.0 72.7
3 75.2 61.8 57.5 60.0 60.3 63.3
4 59.6 72.7 56.3 64.2 75.0 67.6
5 69.8 62.8 45.3 62.1 70.9 63.3
6 69.7 61.5 51.5 64.5 73.7 69.0
7 67.3 64.2 43.7 62.3 62.7 -
8 - - 54.4 52.6 77.0 -
Average (Nm/g) 66.6 65.8 50.9 61.4 70.6 67.4
Standard
deviation
(Nm/g)
6.0 5.3 5.4 4.0 7.8 3.6
L1= Top outside.
L2= Middle outside.
L3= Bottom outside.
L4= Top inside
Table I.8 TI of Transformer 3.
Parameter
A phase B phase C phase
HV HV LV TV HV top
L1 L2 L1 L3 L1 L4 L1 L1 L4
1 60.0 81.6 28.1 56.3 24.0 25.1 32.6 28.1 39.5
2 65.9 85.7 37.0 94.1 65.9 37.3 46.6 20.5 28.7
3 53.5 94.5 34.5 60.7 47.8 59.4 51.3 46.8 54.3
4 78.0 64.1 42.1 59.5 73.0 32.1 25.3 28.4 77.0
5 43.7 87.4 24.4 61.0 52.8 47.4 61.6 29.7 60.9
6 62.3 89.4 36.3 74.1 18.1 44.1 29.5 9.5 66.7
7 59.3 78.8 47.6 53.3 68.7 41.7 46.2 30.3 67.3
8 56.7 92.7 45.3 41.5 54.9 32.5 29.4 25.5 56.7

Appendix I: Tensile Index (TI) of New and Service Aged Paper
187
9 68.1 78.1 38.9 85.9 60.0 47.6 23.4 28.5 60.8
10 - 93.5 43.6 57.4 21.1 29.5 21.8 16.5 60.8
Average
(Nm/g) 60.8 84.6 37.8 64.4 48.6 39.7 36.8 26.4 57.3
Standard
deviation
(Nm/g)
9.6 9.3 7.4 15.8 20.5 10.4 13.6 9.8 14.0
L1= Top outside.
L2= Top outside (2nd
layer paper)
L3= Bottom outside.
L4= Top outside (near to conductor).
Table I.9 TI of Transformer 4.
Parameter
B phase
CW SW Tap
L1 L2 L3 L1 L2 L3 L3
1 21.9 32.8 31.2 30.3 49.9 24.1 34.1
2 25.0 41.8 23.9 29.3 51.2 19.3 41.3
3 42.6 40.1 28.7 36.7 30.3 55.5 35.3
4 40.6 47.6 33.5 23.6 42.1 59.8 26.5
5 57.6 30.2 29.7 42.3 32.0 50.6 30.1
6 38.6 34.8 31.4 43.3 35.2 48.7 42.3
7 35.1 30.5 - 41.2 39.0 30.2 29.1
8 34.0 28.9 - 26.1 19.2 40.3 -
9 27.3 28.5 - 33.7 49.6 25.7 -
10 47.9 - - 37.8 30.9 40.6 -
Average (Nm/g) 37.1 35.0 29.7 34.4 37.9 39.5 34.1
Standard
deviation
(Nm/g)
10.9 6.7 3.3 7.0 10.4 14.1 6.0
Parameter
A phase C phase
SW SW
L1 L2 L3 L1 L1 L2 L3
1 52.5 70.8 55.4 46.1 34.7 48.6 42.1
2 30.8 51.2 38.6 41.2 35.9 54.0 38.6
3 58.4 46.2 55.2 48.1 33.4 69.0 49.1
4 39.6 76.8 52.3 52.2 30.8 42.8 34.7
5 50.0 65.1 40.9 40.7 41.7 55.8 36.4
6 39.2 53.7 45.2 45.2 - 43.4 54.0
7 - - 57.4 43.4 - 51.7 -
8 - - 47.7 56.1 - 34.1 -
9 - - 52.0 58.1 - 43.1 -
10 - - 65.4 56.1 - 50.4 -
Average (Nm/g) 45.1 60.6 51.0 48.7 35.3 49.3 42.5
Standard
deviation
(Nm/g)
10.3 12.1 8.1 6.5 4.0 9.5 7.6
L1= Top outside.
L2= Middle outside.
L3= Bottom outside.

Appendix I: Tensile Index (TI) of New and Service Aged Paper
188
Table I.10 TI of Transformer 5.
Parameter
A phase
Not stated
L3 L4 L5 L6 L7 L8 L9 L10 L11 L12
1 57.3 70.5 61.9 58.0 44.2 57.9 51.9 50.9 31.7 40.0
2 43.0 68.0 31.5 60.4 50.3 62.1 48.1 56.3 50.0 26.0
3 49.9 62.8 65.0 61.2 52.8 64.0 57.9 29.5 44.7 46.5
4 44.1 63.0 61.8 61.7 53.9 57.4 61.0 45.7 51.5 35.7
5 56.8 59.7 52.9 44.5 59.9 61.6 56.3 48.8 54.8 44.5
6 50.4 53.3 50.2 59.0 39.7 57.2 59.6 60.4 57.3 29.4
7 73.4 37.2 62.5 55.9 54.0 56.0 44.9 37.7 39.0 49.7
8 - 39.3 59.7 57.3 41.8 53.4 57.8 67.2 35.6 46.8
9 - 61.4 53.2 49.9 59.3 50.3 63.6 46.0 - 39.4
10 - 53.8 51.5 57.4 60.3 66.1 58.9 - - 48.8
Average (Nm/g) 53.5 56.9 55.0 56.5 51.6 58.6 56.0 49.2 45.6 40.7
Standard
deviation
(Nm/g)
10.3 11.2 9.8 5.4 7.5 4.9 5.9 11.4 9.4 8.2
Parameter
B phase C phase
Not stated HV
L1 L2 L1 L2
1 44.9 55.4 9.9 67.9
2 57.0 44.2 33.3 66.3
3 52.4 29.2 31.0 57.3
4 57.7 53.3 38.9 51.5
5 50.5 44.9 36.8 56.2
6 52.1 37.0 46.5 57.3
7 52.6 45.4 24.9 62.8
8 59.6 24.0 37.9 60.3
9 51.7 50.6 35.4 57.2
10 - 51.6 - 46.7
Average (Nm/g) 53.2 43.6 32.7 58.4
Standard
deviation
(Nm/g)
4.4 10.5 10.4 6.4
L1= Top outside.
L2= Bottom outside.
L3= 3rd
discs from top outside.
L4= 3rd
discs from bottom outside.
L5= 4th discs from top outside.
L6= 4th discs from bottom outside.
L7= 5th discs from top outside.
L8= 5th discs from bottom outside.
L9= 6th discs from top outside.
L10= 6th discs from bottom outside.
L11= 7th discs from top outside.
L12= 7th discs from bottom outside.
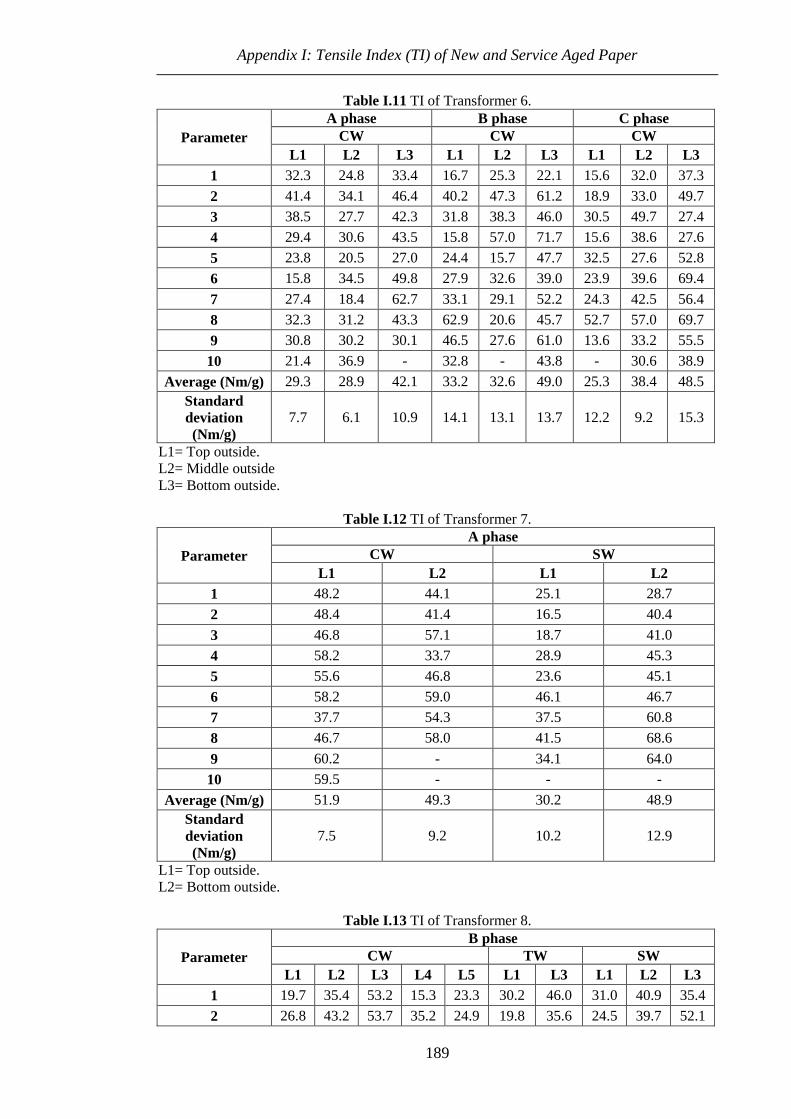
Appendix I: Tensile Index (TI) of New and Service Aged Paper
189
Table I.11 TI of Transformer 6.
Parameter
A phase B phase C phase
CW CW CW
L1 L2 L3 L1 L2 L3 L1 L2 L3
1 32.3 24.8 33.4 16.7 25.3 22.1 15.6 32.0 37.3
2 41.4 34.1 46.4 40.2 47.3 61.2 18.9 33.0 49.7
3 38.5 27.7 42.3 31.8 38.3 46.0 30.5 49.7 27.4
4 29.4 30.6 43.5 15.8 57.0 71.7 15.6 38.6 27.6
5 23.8 20.5 27.0 24.4 15.7 47.7 32.5 27.6 52.8
6 15.8 34.5 49.8 27.9 32.6 39.0 23.9 39.6 69.4
7 27.4 18.4 62.7 33.1 29.1 52.2 24.3 42.5 56.4
8 32.3 31.2 43.3 62.9 20.6 45.7 52.7 57.0 69.7
9 30.8 30.2 30.1 46.5 27.6 61.0 13.6 33.2 55.5
10 21.4 36.9 - 32.8 - 43.8 - 30.6 38.9
Average (Nm/g) 29.3 28.9 42.1 33.2 32.6 49.0 25.3 38.4 48.5
Standard
deviation
(Nm/g)
7.7 6.1 10.9 14.1 13.1 13.7 12.2 9.2 15.3
L1= Top outside.
L2= Middle outside
L3= Bottom outside.
Table I.12 TI of Transformer 7.
Parameter
A phase
CW SW
L1 L2 L1 L2
1 48.2 44.1 25.1 28.7
2 48.4 41.4 16.5 40.4
3 46.8 57.1 18.7 41.0
4 58.2 33.7 28.9 45.3
5 55.6 46.8 23.6 45.1
6 58.2 59.0 46.1 46.7
7 37.7 54.3 37.5 60.8
8 46.7 58.0 41.5 68.6
9 60.2 - 34.1 64.0
10 59.5 - - -
Average (Nm/g) 51.9 49.3 30.2 48.9
Standard
deviation
(Nm/g)
7.5 9.2 10.2 12.9
L1= Top outside.
L2= Bottom outside.
Table I.13 TI of Transformer 8.
Parameter
B phase
CW TW SW
L1 L2 L3 L4 L5 L1 L3 L1 L2 L3
1 19.7 35.4 53.2 15.3 23.3 30.2 46.0 31.0 40.9 35.4
2 26.8 43.2 53.7 35.2 24.9 19.8 35.6 24.5 39.7 52.1

Appendix I: Tensile Index (TI) of New and Service Aged Paper
190
3 22.5 45.5 36.3 36.3 20.7 11.0 32.4 24.5 36.8 51.4
4 27.5 47.6 38.7 15.6 17.7 20.1 45.0 23.9 38.3 36.9
5 - 37.8 - - 20.8 - - 33.1 31.7 -
6 - - - - 22.1 - - 33.5 - -
7 - - - - 21.8 - - - - -
Average (Nm/g) 24.1 41.9 45.5 25.6 21.6 20.3 39.8 28.4 37.5 43.9
Standard
deviation
(Nm/g)
3.7 5.1 9.3 11.8 2.3 7.8 6.8 4.6 3.6 9.0
L1= Top outside.
L2= Middle outside.
L3= Bottom outside.
L4= Top inside
L5= Top 2nd
strand from inside
Table I.14 TI of Transformer 9.
Parameter
A phase B phase C phase
HV LV HV LV HV
L1 L1 L3 L1 L2 L1 L1 L2
1 9.7 42.1 30.9 42.2 37.0 20.2 37.1 45.7
2 12.1 23.3 56.7 49.5 59.4 23.8 41.1 58.5
3 21.5 40.7 47.5 38.1 55.1 20.2 26.4 65.9
4 36.1 43.2 49.0 46.3 55.3 25.0 37.7 51.7
5 28.3 35.2 - 41.1 58.1 - 35.7 52.0
6 32.0 47.8 - 47.2 52.0 - 41.0 47.3
7 40.3 44.4 - - 47.5 - 45.3 50.6
8 28.0 40.9 - - 54.1 - 40.5 -
9 31.3 38.5 - - - - - -
10 29.5 - - - - - - -
Average
(Nm/g) 26.9 39.6 46.0 44.1 52.3 22.3 38.1 53.1
Standard
deviation
(Nm/g)
9.8 7.1 10.9 4.3 7.2 2.5 5.6 7.0
L1= Top outside.
L2= Middle outside.
L3= Bottom outside.
Table I.15 TI of different layers for Transformer 10. Paper samples were taken from B phase,
HV bottom.
Parameter Number of layer
1 2 3 4 5 6 7 8
1 11.3 52.3 65.9 50.0 76.5 75.1 76.1 61.9
2 29.0 44.6 61.5 71.6 74.1 80.3 39.3 78.9
3 16.9 56.7 70.4 63.4 71.8 54.1 76.3 68.6
4 16.4 56.7 57.4 40.9 51.0 77.6 71.9 81.9
5 54.6 42.4 70.8 52.9 84.9 55.9 39.9 53.7
6 10.4 59.8 60.6 40.4 55.4 70.1 73.1 49.5
7 36.8 32.9 72.0 71.1 45.9 83.4 59.1 83.4
8 5.0 83.6 62.7 80.6 67.3 75.2 37.6 56.9

Appendix I: Tensile Index (TI) of New and Service Aged Paper
191
9 28.3 59.6 45.1 72.9 77.2 33.3 70.3 64.8
10 15.8 58.0 - 69.7 86.6 85.9 24.4 38.9
Average (Nm/g) 22.4 54.6 62.9 61.3 69.1 69.1 56.8 63.9
Standard
deviation
(Nm/g)
14.9 13.5 8.4 14.3 14.0 16.5 19.5 14.7
Table I.16 TI of different layers for Transformer 6. Paper samples were taken from B phase,
CW top.
Parameter Number of layer
1 2 3 4 5 6 7 8
1 16.7 60.2 25.9 46.7 42.4 40.7 45.4 50.7
2 40.2 42.7 54.9 50.0 35.0 39.1 51.8 35.5
3 31.8 36.2 40.5 54.9 61.3 45.9 53.2 56.8
4 15.8 40.1 38.3 33.6 51.4 36.5 46.1 53.1
5 24.4 62.5 42.4 35.3 48.8 40.9 38.7 41.4
6 27.9 52.1 48.7 57.8 49.8 47.9 54.6 26.1
7 33.1 50.1 52.0 52.4 43.4 59.5 52.0 23.6
8 62.9 62.0 43.0 32.1 35.0 53.8 42.7 46.5
9 46.5 32.6 46.6 18.4 45.3 38.0 24.5 33.9
10 32.8 21.3 45.5 - 49.2 - 54.2 38.9
Average (Nm/g) 33.2 46.0 43.8 42.4 46.2 44.7 46.3 40.6
Standard
deviation
(Nm/g)
14.1 13.8 8.1 13.1 7.9 7.8 9.4 11.2
Parameter 9 10 11
1 47.8 46.2 14.0
2 45.5 47.9 24.0
3 20.8 55.2 31.0
4 32.0 38.9 27.3
5 45.2 52.4 41.6
6 39.5 40.3 39.7
7 17.9 50.8 35.1
8 56.7 69.5 50.6
9 24.4 48.8 46.2
10 47.1 56.9 -
Average (Nm/g) 37.7 50.7 34.4
Standard
deviation
(Nm/g)
13.2 8.8 11.6

Appendix II: Low Molecular Weight Acid (LMA) in Service Aged Paper
192
APPENDIX II: Low Molecular Weight Acid (LMA) of Service Aged Paper
Table II.1 LMA in paper of Transformer 1.
Parameter
B phase
CW SW
L1 L2 L3 L4 L1 L2 L3
1 2.08 1.88 0.38 1.77 3.23 1.67 0.43
2 2.24 3.19 0.11 2.32 3.19 1.55 0.57
Average (mg
KOH/g) 2.16 2.53 0.24 2.05 3.21 1.61 0.50
L1= Top outside
L2= 72nd
discs from top outside.
L3= 144th discs from top outside.
L4= Bottom outside.
Table II.2 LMA in paper of Transformer 2.
Parameter
A phase
CW SW
L1 L3 L1 L4 L2 L3
1 2.07 2.32 1.98 0.55 1.53 0.40
2 1.50 1.51 1.96 1.39 1.14 1.24
Average (mg
KOH/g) 1.79 1.91 1.97 0.97 1.33 0.82
L1= Top outside.
L2= Middle outside.
L3= Bottom outside.
L4= Top inside
Table II.3 LMA in paper of Transformer 3.
Parameter
A phase B phase C phase
HV HV LV TV HV top
L1 L2 L1 L3 L1 L4 L1 L1 L4
1 2.81 2.11 4.02 2.59 3.79 2.84 2.38 2.44 1.92
2 2.79 1.51 3.58 3.13 - - - 2.06 1.30
Average (mg
KOH/g) 2.80 1.81 3.80 2.86 3.79 2.84 2.38 2.25 1.61
L1= Top outside.
L2= Top outside (2nd
layer paper)
L3= Bottom outside.
L4= Top outside (near to conductor).
Table II.4 LMA in paper of Transformer 4.
Parameter
B phase
CW SW Tap
L1 L2 L3 L1 L2 L3 L3
1 3.34 2.44 2.70 3.23 2.34 1.92 2.24
2 3.26 - 3.47 2.41 3.39 3.63 2.64
Average (mg
KOH/g) 3.30 2.44 3.08 2.82 2.87 2.77 2.44

Appendix II: Low Molecular Weight Acid (LMA) in Service Aged Paper
193
Parameter
A phase C phase
SW SW
L1 L2 L3 L1 L1 L2 L3
1 3.19 1.92 2.73 1.99 3.85 2.03 1.80
2 3.48 1.82 2.88 - 4.19 3.38 3.81
Average (mg
KOH/g) 3.33 1.87 2.81 1.99 4.02 2.70 2.80
L1= Top outside.
L2= Middle outside
L3= Bottom outside tap.
Table II.5 LMA in paper of Transformer 5.
Parameter
A phase
Not stated
L3 L4 L5 L6 L7 L8 L9 L10 L11 L12
1 0.78 0.42 2.98 1.53 2.96 0.70 1.30 1.80 3.04 2.29
2 2.26 0.36 1.86 1.15 1.43 1.32 1.06 2.14 1.88 2.33
Average (mg
KOH/g) 1.52 0.39 2.42 1.34 2.19 1.01 1.18 1.97 2.46 2.31
Parameter
B phase C phase
Not stated HV
L1 L2 L1 L2
1 2.55 1.53 2.84 1.42
2 3.14 1.18 4.48 0.10
Average (mg
KOH/g) 2.85 1.35 3.66 0.76
L1= Top outside.
L2= Bottom outside.
L3= 3rd
discs from top outside.
L4= 3rd
discs from bottom outside.
L5= 4th discs from top outside.
L6= 4th discs from bottom outside.
L7= 5th discs from top outside.
L8= 5th discs from bottom outside.
L9= 6th discs from top outside.
L10= 6th discs from bottom outside.
L11= 7th discs from top outside.
L12= 7th discs from bottom outside.
Table II.6 LMA in paper of Transformer 6.
Parameter
A phase B phase C phase
CW CW CW
L1 L2 L3 L1 L2 L3 L1 L2 L3
1 3.35 4.26 3.72 4.27 4.67 2.80 4.44 3.76 4.10
2 3.83 4.79 3.70 6.80 4.83 4.04 3.63 3.97 3.97
Average (mg
KOH/g) 3.59 4.52 3.71 5.53 4.75 3.42 4.03 3.87 4.04
L1= Top outside.
L2= Middle outside
L3= Bottom outside.

Appendix II: Low Molecular Weight Acid (LMA) in Service Aged Paper
194
Table II.7 LMA in paper of Transformer 7.
Parameter
A phase
CW SW
L1 L2 L1 L2
1 1.69 1.93 3.01 2.67
2 1.10 1.12 - 3.31
Average (mg
KOH/g) 1.40 1.53 3.01 2.99
L1= Top outside.
L2= Bottom outside.
Table II.8 LMA in paper of Transformer 8.
Parameter
B phase
CW TW SW
L1 L2 L3 L4 L5 L1 L3 L1 L2 L3
1 5.93 4.87 3.61 6.35 5.79 4.96 3.10 4.23 3.72 3.54
2 5.66 5.66 3.78 6.44 6.15 5.06 2.79 4.42 4.14 3.54
Average (mg
KOH/g) 5.79 5.26 3.70 6.39 5.97 5.01 2.95 4.33 3.93 3.54
L1= Top outside.
L2= Middle outside.
L3= Bottom outside.
L4= Top inside
L5= Top 2nd
strand from inside
Table II.9 LMA in paper of Transformer 9.
Parameter
A phase B phase C phase
HV LV HV LV HV
L1 L1 L3 L1 L2 L1 L1 L2
1 2.30 6.40 4.18 2.63 1.48 5.29 6.84 1.57
2 2.88 5.26 3.29 2.67 2.38 5.94 5.86 2.09
Average (mg
KOH/g) 2.59 5.83 3.74 2.65 1.93 5.62 6.35 1.83
L1= Top outside.
L2= Middle outside.
L3= Bottom outside.
Table II.10 LMA in paper of different layers for Transformer 10. Paper samples were taken
from B phase, HV bottom.
Parameter Number of layer
1 2 3 4 5 6 7 8
1 5.51 7.24 4.67 2.89 3.83 1.88 3.98 1.94
2 - - - - - - - -
Average (mg
KOH/g) 5.51 7.24 4.67 2.89 3.83 1.88 3.98 1.94

Appendix II: Low Molecular Weight Acid (LMA) in Service Aged Paper
195
Table II.11 LMA in paper of different layers for Transformer 6. Paper samples were taken
from B phase, CW top.
Parameter Number of layer
1 2 3 4 5 6 7 8
1 4.27 2.92 2.13 3.89 2.72 3.34 3.22 2.94
2 6.80 2.86 3.74 - 3.76 4.34 - 3.30
Average (mg
KOH/g) 5.53 2.89 2.94 3.89 3.24 3.84 3.22 3.12
Parameter 9 10 11
1 3.26 2.81 1.92
2 - 4.01 1.80
Average (mg
KOH/g) 3.26 3.41 1.86

Appendix III: Effect of Ageing on Breakdown Voltage of Paper
196
APPENDIX III: Effect of Ageing on Breakdown Voltage of Paper
Table III.1 AC breakdown voltages of different types of paper impregnated in new oil. The
gap distance between two sphere electrodes was set at 0.258 mm.
Test No.
Breakdown voltages of different types of paper and new
oil (kV)
Layer type Conductor
type
Service
aged paper New oil
1 14.3 18.6 20.2 16.7
2 14.3 17.2 18.1 17.1
3 16.9 20.4 19.0 14.6
4 15.3 20.4 17.8 14.1
5 15.8 16.7 21.5 14.2
6 16.7 18.6 21.7 14.9
7 15.2 18.6 21.1 16.8
8 13.8 18.9 24.2 15.0
9 14.3 17.9 20.5 17.1
10 14.8 19.3 20.4 11.8
11 12.2 16.7 19.7 15.9
12 13.7 17.1 20.4 12.7
13 13.5 16.8 19.7 14.4
14 16.4 16.9 19.4 13.9
15 17.1 18.0 18.4 14.8
16 17.3 18.4 22.8 15.0
17 15.7 17.5 18.3 13.1
18 17.1 19.3 20.2 14.1
19 15.7 18.9 18.6 14.3
20 13.8 17.5 21.4 15.6
21 16.2 17.1 20.8 16.3
22 14.5 17.6 18.4 12.7
23 16.5 16.7 18.4 14.8
24 14.8 16.7 20.7 12.9
25 16.1 16.5 20.1 13.5
26 16.3 16.2 20.2 11.8
27 16.9 16.1 19.0 13.6
28 15.7 18.4 18.6 12.7
29 13.1 19.0 21.3 12.6
30 14.3 17.0 21.1 13.5
31 13.5 16.2 20.7 11.5
32 15.2 18.6 18.3 12.7
33 17.2 17.0 18.9 12.2
34 14.2 19.5 18.8 11.5
35 15.7 18.3 19.6 13.7
36 15.3 18.1 20.2 12.1
37 14.4 16.0 18.0 14.2
38 12.8 17.1 21.0 12.4
39 14.4 17.2 20.2 12.8

Appendix III: Effect of Ageing on Breakdown Voltage of Paper
197
40 15.6 16.7 22.2 12.9
Average (kV) 15.2 17.7 20.0 13.9
Standard deviation (kV) 1.3 1.2 1.4 1.6
Table III.2 AC breakdown voltages of different types of paper impregnated in aged oil. The
gap distance between two sphere electrodes was set at 0.258 mm.
Test No.
Breakdown voltages of different types of paper and aged
oil (kV)
Layer type Conductor
type
Service
aged paper Aged oil
1 14.9 17.7 18.0 16.4
2 15.7 16.6 17.7 14.4
3 15.0 15.2 16.6 15.8
4 14.9 15.5 19.8 16.1
5 14.6 16.1 18.7 10.5
6 15.5 16.7 20.1 12.7
7 13.5 18.3 19.0 11.8
8 16.0 17.3 19.4 9.4
9 14.9 16.0 16.0 9.4
10 14.9 17.7 17.7 13.4
11 12.4 15.5 20.2 13.2
12 13.1 16.8 15.5 14.3
13 12.7 16.1 18.9 14.0
14 15.1 15.3 19.0 14.5
15 15.0 17.4 20.7 14.0
16 13.8 15.9 19.7 14.4
17 12.6 16.7 19.8 11.8
18 16.0 17.1 20.4 11.7
19 14.9 16.2 16.6 15.5
20 11.8 16.7 17.8 14.3
21 12.7 17.5 19.8 14.4
22 14.9 16.7 17.9 11.8
23 16.9 16.5 17.5 11.4
24 13.1 15.3 18.9 12.4
25 13.3 17.3 20.2 14.6
26 13.5 15.9 15.5 13.0
27 15.0 15.6 15.2 12.1
28 13.5 15.3 20.2 15.3
29 13.5 14.7 19.6 14.3
30 14.8 15.5 17.5 15.0
31 12.1 15.8 19.2 16.8
32 15.8 15.1 18.4 14.1
33 15.7 15.9 20.3 12.3
34 12.6 15.3 18.4 9.4
35 13.1 14.8 16.9 14.1
36 13.3 17.3 21.6 14.0
37 11.6 15.8 18.5 11.3

Appendix III: Effect of Ageing on Breakdown Voltage of Paper
198
38 11.4 15.7 18.8 14.2
39 13.4 15.0 17.0 12.9
40 13.5 16.7 20.2 14.5
Average (kV) 14.0 16.2 18.6 13.4
Standard deviation (kV) 1.4 0.9 1.6 1.9

Appendix IV: Effect of Low Molecular Weight Acid (LMA) and High Molecular Weight
Acid (HMA) on Breakdown Voltage of Oil and Ageing of Paper
199
APPENDIX IV: Effect of Low Molecular Weight Acid (LMA) and High
Molecular Weight Acid (HMA) on Breakdown Voltage of Oil and Ageing of
Paper
Table IV.1 AC breakdown voltages of new mineral oil with different amount of LMA. The
gap distance between two VDE electrodes was set at 1 mm.
Test No.
Breakdown voltage of new mineral oil with different
amount of LMA (kV)
(Clean) 0.02
mg KOH/g
0.05mg
KOH/g
0.4 mg
KOH/g
0.6 mg
KOH/g
1 49.4 25.5 13.1 7.2
2 47.5 21.5 12.2 9.4
3 49.0 21.2 11.6 8.7
4 46.0 27.1 11.8 7.0
5 49.4 25.9 12.8 7.8
6 54.6 25.8 13.1 9.0
7 51.9 17.0 13.1 8.7
8 44.9 26.6 11.3 8.2
9 52.2 25.1 10.0 8.7
10 49.2 22.4 12.5 10.0
11 45.7 26.6 11.8 8.7
12 53.0 18.4 10.7 10.0
13 51.5 29.5 11.6 8.7
14 37.3 26.7 11.9 10.0
15 46.0 22.8 12.8 8.7
16 41.7 18.9 10.8 10.0
17 56.9 21.2 12.0 8.7
18 49.5 21.9 9.4 8.2
19 54.1 26.0 11.9 9.2
20 53.5 28.2 11.1 9.4
21 39.9 27.2 12.5 8.7
22 56.5 19.0 12.7 6.4
23 42.9 19.3 11.7 8.1
24 50.5 17.2 11.0 7.1
25 44.2 27.0 11.8 8.6
26 51.8 20.3 12.6 6.9
27 55.0 18.2 9.3 7.3
28 44.6 18.9 10.8 7.3
29 53.1 14.4 11.5 8.3
30 50.0 25.4 10.7 10.4
31 48.5 19.6 12.7 8.4
32 47.2 26.9 12.1 8.5
33 51.0 26.2 10.9 8.7
34 39.7 19.5 11.4 9.1
35 55.6 24.7 11.9 7.8
36 54.3 21.5 9.9 8.5

Appendix IV: Effect of Low Molecular Weight Acid (LMA) and High Molecular Weight
Acid (HMA) on Breakdown Voltage of Oil and Ageing of Paper
200
37 47.8 16.8 11.5 7.3
38 45.7 23.8 2.5 6.8
39 47.9 22.9 11.0 7.9
40 51.2 20.8 9.3 7.5
41 50.3 24.4 9.5 7.5
42 45.8 23.6 12.7 7.6
43 53.6 26.4 10.3 6.7
44 53.9 24.3 11.3 6.5
45 50.1 20.7 10.4 8.1
46 56.3 21.1 10.0 6.5
47 54.9 23.8 11.4 6.9
48 52.7 18.1 11.3 5.6
49 45.7 17.5 10.2 6.4
50 51.1 19.8 11.4 8.0
Average (kV) 49.5 22.6 11.2 8.1
Standard deviation (kV) 4.6 3.6 1.6 1.1
Table IV.2 AC breakdown voltages of new mineral oil with different amount of HMA. The
gap distance between two VDE electrodes was set at 1 mm.
Test No.
Breakdown voltage of new mineral oil with different
amount of HMA (kV)
0.6 mg
KOH/g
1.6 mg
KOH/g
3.1 mg
KOH/g
9.0 mg
KOH/g
1 45.0 59.5 50.3 19.4
2 45.2 58.0 48.8 15.7
3 45.3 55.3 52.3 23.3
4 47.5 53.2 50.2 21.4
5 38.1 53.8 50.3 23.0
6 42.2 53.6 49.6 22.3
7 45.6 53.8 43.2 7.1
8 46.9 47.0 50.5 9.1
9 39.7 50.4 47.8 18.5
10 38.3 48.2 44.2 19.5
11 39.6 51.0 47.3 17.9
12 41.2 51.5 42.9 18.4
13 44.2 47.9 40.6 14.7
14 37.7 57.4 42.6 22.3
15 42.0 46.4 45.6 29.1
16 41.5 52.6 49.2 27.2
17 43.3 48.0 41.1 20.1
18 39.5 52.5 43.2 17.7
19 41.5 50.0 40.2 18.7
20 39.1 55.4 41.5 27.4
21 46.8 53.2 40.3 9.5
22 44.3 44.5 37.5 13.2

Appendix IV: Effect of Low Molecular Weight Acid (LMA) and High Molecular Weight
Acid (HMA) on Breakdown Voltage of Oil and Ageing of Paper
201
23 43.8 51.5 45.1 25.1
24 43.3 47.5 43.5 18.5
25 37.1 49.4 44.6 12.0
26 43.8 46.3 43.8 9.3
27 37.5 42.2 37.0 9.7
28 44.9 47.9 48.5 5.8
29 41.4 36.6 47.8 15.1
30 36.3 42.7 49.1 11.4
31 40.2 42.9 45.9 11.9
32 39.0 43.3 38.1 26.2
33 41.8 45.8 35.2 40.4
34 40.2 46.8 36.2 6.5
35 41.5 46.8 44.0 16.0
36 41.9 45.3 46.3 17.1
37 41.1 47.3 43.5 7.2
38 39.8 44.1 38.5 5.7
39 41.5 35.7 52.5 15.1
40 40.9 43.7 47.8 13.4
41 40.0 42.4 42.8 19.1
42 45.9 41.5 45.5 15.9
43 39.5 47.8 47.5 17.1
44 43.7 45.5 39.1 24.1
45 46.4 43.7 56.3 15.1
46 32.6 40.9 49.2 15.5
47 39.2 48.6 46.4 22.6
48 44.5 44.7 39.3 28.8
49 47.0 41.7 51.8 32.2
50 42.4 39.3 51.1 11.9
Average (kV) 41.8 47.7 45.1 17.7
Standard deviation (kV) 3.2 5.3 4.8 7.3
Table IV.3 AC breakdown voltages of new natural ester with different amount of LMA. The
gap distance between two VDE electrodes was set at 1 mm.
Test No.
Breakdown voltage of new natural ester with different
amount of LMA (kV)
(Clean)
0.04 mg
KOH/g
0.6 mg
KOH/g
1.2 mg
KOH/g
2.0 mg
KOH/g
4.0 mg
KOH/g
1 52.6 47.7 42.1 48.8 47.3
2 51.9 48.4 40.6 46.9 38.3
3 49.9 46.3 46.4 49.5 44.2
4 45.4 46.8 42.7 49.0 43.5
5 32.7 48.7 40.8 57.5 42.0
6 54.4 53.5 46.3 51.3 41.5
7 39.9 47.1 28.2 53.0 45.1
8 48.6 45.9 44.0 50.3 27.1

Appendix IV: Effect of Low Molecular Weight Acid (LMA) and High Molecular Weight
Acid (HMA) on Breakdown Voltage of Oil and Ageing of Paper
202
9 48.2 48.1 44.2 58.7 37.4
10 46.9 48.5 45.5 53.7 38.3
11 50.8 49.0 30.8 53.1 34.3
12 51.5 45.5 45.1 55.2 39.4
13 42.6 47.5 39.1 50.0 34.2
14 49.1 48.8 46.6 54.2 38.5
15 48.4 50.9 44.2 58.2 34.8
16 50.1 45.6 41.9 54.4 42.8
17 44.6 49.1 38.5 50.4 39.2
18 36.4 46.1 43.8 52.1 30.8
19 56.3 40.8 44.4 47.6 37.2
20 50.3 50.0 46.3 50.9 29.1
21 41.0 27.9 44.2 59.0 29.2
22 50.5 48.6 42.8 58.7 40.5
23 33.7 51.6 40.2 47.1 41.0
24 49.5 50.3 43.6 52.1 35.6
25 48.7 47.7 43.3 54.0 41.5
26 42.5 45.2 43.2 47.3 42.0
27 48.0 53.1 47.8 46.6 39.6
28 44.2 49.4 39.0 49.7 38.3
29 40.2 46.2 44.8 58.0 32.2
30 50.9 40.0 36.9 51.0 38.3
31 44.9 42.9 35.8 58.9 32.2
32 49.1 51.3 43.3 58.3 36.9
33 49.5 53.1 37.9 50.4 39.0
34 43.1 50.9 33.5 50.4 37.1
35 47.6 38.7 30.0 53.7 37.9
36 40.7 48.1 46.4 48.7 38.5
37 42.0 45.3 44.3 55.3 37.6
38 36.5 45.3 44.8 60.9 36.9
39 45.9 51.3 33.2 50.7 40.3
40 46.9 51.9 30.0 36.2 37.1
41 47.4 48.5 32.0 43.3 36.0
42 47.6 45.8 32.1 45.6 38.0
43 47.2 51.4 35.5 46.4 28.5
44 24.2 49.7 39.8 56.6 32.6
45 38.6 50.1 35.2 47.8 34.7
46 35.8 48.6 38.1 46.4 36.5
47 44.5 49.5 31.8 46.3 33.5
48 34.4 43.3 35.3 51.3 37.4
49 49.0 51.7 35.3 50.0 34.0
50 46.4 48.1 31.4 49.0 31.5
Average (kV) 45.2 47.6 39.9 51.5 37.2
Standard deviation (kV) 6.3 4.3 5.5 4.8 4.4

Appendix IV: Effect of Low Molecular Weight Acid (LMA) and High Molecular Weight
Acid (HMA) on Breakdown Voltage of Oil and Ageing of Paper
203
Table IV.4 AC breakdown voltages of new natural ester with different amount of HMA. The
gap distance between two VDE electrodes was set at 1 mm.
Test No.
Breakdown voltage of new natural ester with different
amount of HMA (kV)
9.0 mg KOH/g
1 51.0
2 53.1
3 48.4
4 49.4
5 54.2
6 45.8
7 49.3
8 45.8
9 48.4
10 42.9
11 54.9
12 43.8
13 51.3
14 51.9
15 49.3
16 44.0
17 44.2
18 45.0
19 52.6
20 41.5
21 50.4
22 45.0
23 45.3
24 30.8
25 55.6
26 46.2
27 43.8
28 46.1
29 51.3
30 53.9
31 41.5
32 36.2
33 53.1
34 53.8
35 39.5
36 39.6
37 50.4
38 48.4
39 45.1
40 51.8

Appendix IV: Effect of Low Molecular Weight Acid (LMA) and High Molecular Weight
Acid (HMA) on Breakdown Voltage of Oil and Ageing of Paper
204
41 45.9
42 38.4
43 53.3
44 38.2
45 54.1
46 54.1
47 45.3
48 47.5
49 45.1
50 47.9
Average (kV) 47.3
Standard deviation (kV) 5.4
Table IV.5 TI of conductor type paper ageing in mineral oil under dry condition. Data are
mean of 8 samples.
Parameter
Ageing under dry condition
Start With no acid With LMA
Ageing duration 0 14 28 63 14 28 63
Average (Nm/g) 117.4 94.3 73.6 51.7 58.9 64.1 13.5
Standard deviation (Nm/g) 8.8 11.3 10.3 16.5 10.5 8.2 5.7
Parameter
Ageing under dry
condition
With HMA
Ageing duration 14 28 63
Average (Nm/g) 103.9 74.7 52.1
Standard deviation (Nm/g) 8.7 10.1 14.0
Table IV.6 TI of conductor type paper ageing in mineral oil under wet condition. Data are
mean of 8 samples.
Parameter
Ageing under wet condition
Start With no acid With LMA
Ageing duration 0 14 28 63 14 28 63
Average (Nm/g) 117.4 66.9 60.5 54.3 12.6 18.7 14.6
Standard deviation (Nm/g) 8.8 12.5 9.3 14.3 5.0 2.9 4.2
Parameter
Ageing under wet
condition
With HMA
Ageing duration 14 28 63
Average (Nm/g) 78.4 74.0 39.5
Standard deviation (Nm/g) 8.7 13.8 21.6

Appendix IV: Effect of Low Molecular Weight Acid (LMA) and High Molecular Weight
Acid (HMA) on Breakdown Voltage of Oil and Ageing of Paper
205
Table IV.7 TI of conductor type paper ageing in natural ester under dry condition. Data are
mean of 8 samples.
Parameter
Ageing under dry condition
Start With no acid With LMA
Ageing duration 0 14 28 63 14 28 63
Average (Nm/g) 120.0 94.4 83.7 69.5 72.4 78.1 32.2
Standard deviation (Nm/g) 7.7 14.3 10.0 11.8 11.8 6.8 11.1
Parameter
Ageing under dry
condition
With HMA
Ageing duration 14 28 63
Average (Nm/g) 104.0 94.3 61.7
Standard deviation (Nm/g) 7.7 6.5 14.5
Table IV.8 TI of conductor type paper ageing in natural ester under wet condition. Data are
mean of 8 samples.
Parameter
Ageing under wet condition
Start With no acid With LMA
Ageing duration 0 14 28 63 14 28 63
Average (Nm/g) 120.0 79.5 79.2 66.6 40.5 58.0 52.3
Standard deviation (Nm/g) 7.7 12.8 11.4 8.7 9.2 4.3 6.9
Parameter
Ageing under wet
condition
With HMA
Ageing duration 14 28 63
Average (Nm/g) 77.6 83.2 76.0
Standard deviation (Nm/g) 7.5 6.3 9.1

APPENDIX V: List of Publications
206
APPENDIX V: List of Publications
[1] N. Azis and Z.D. Wang, "Acid generation study of natural ester," in
International Symposium of High Voltage (ISH), Hannover, Germany, pp.
E-048, 22-26 August, 2011.
[2] N. Azis and Z.D. Wang, "Examining paper ageing in service," in Euro
TechCon 2010, Chester, United Kingdom, 8 - 10 November, 2010.
[3] Q. Liu, Z.D. Wang, N. Azis, W.W. Sampson, P. Jarman, S. Ryder, and H. Z.
Ding, "Assessment of ageing conditions through paper tensile strength analysis
of scrapped transformers," in International Symposium of High Voltage (ISH),
Cape Town, South Africa, pp. 264-269, 24-28 August, 2009.

References
207
REFERENCES
[1] "IEEE guide for loading mineral oil immersed transformers," IEEE Std
C57.91-1995, 1996.
[2] R. Liao, S. Liang, C. Sun, L. Yang and H. Sun, "A comparative study of
thermal aging of transformer insulation paper impregnated in natural ester and
in mineral oil," European Transactions on Electrical Power, vol. 20, pp. 518-
533, 2010.
[3] C. P. McShane, J. L. Corkran, K. J. Rapp and J. Luksich, "Aging of paper
insulation retrofilled with natural ester dielectric fluid," IEEE Conference on
Electrical Insulation and Dielectric Phenomena (CEIDP), Albuquerque, NM,
USA, pp. 124-127, 19-22 October, 2003.
[4] C. P. McShane, K. J. Rapp, J. L. Corkran, G. A. Gauger and J. Luksich, "Aging
of paper insulation in natural ester dielectric fluid," IEEE Conference on Power
Engineering Society (PES) Transmission and Distribution, Atlanta, GA, USA,
vol. 2, pp. 675-679, 28 October - 2 November, 2001.
[5] C. P. McShane, K. J. Rapp, J. L. Corkran, G. A. Gauger and J. Luksich, "Aging
of kraft paper in natural ester dielectric fluid," IEEE International Conference
on Dielectric Liquids (ICDL), Graz, Austria pp. 173-177, 7 - 12 July, 2002.
[6] K. J. Rapp, C. P. McShane and J. Luksich, "Interaction mechanisms of natural
ester dielectric fluid and kraft paper," IEEE International Conference on
Dielectric Liquids (ICDL), Coimbra, Portugal pp. 393-396, 26 June - 1 July,
2005.
[7] H. M. Wilhelm, L. Tulio, R. Jasinski and G. Almeida, "Aging markers for in-
service natural ester based insulating fluids," Dielectrics and Electrical
Insulation, IEEE Transactions on, vol. 18, pp. 714-719, 2011.
[8] M. J. Heathcote, "The J & P Transformer Book," Elsevier 13 Ed., 2007.
[9] P. K. B. Hodges, "Hydraulic Fluids," Elsevier, 1996
[10] NynasNapthenic, "Base oil handbook," Nynas Napthenic AB, 2001.
[11] J. Sabau, "On line reclamation of aged transformer oils," Electrical Insulation
Conference and Electrical Manufacturing & Coil Winding Conference, Ohio,
USA, pp. 557-565, 16 - 18 October, 2001.
[12] C. P. McShane, "Vegetable oil based dielectric coolants," IEEE Electrical
Insulation Magazine, vol. 8, pp. 34-41, 2002.
[13] E. Sherwin, "Oxidation and antioxidants in fat and oil processing," Journal of
the American Oil Chemists' Society, vol. 55, pp. 809-814, 1978.
[14] R. Kumarathasan, A. B. Rajkumar, N. R. Hunter and H. D. Gesser,
"Autoxidation and yellowing of methyl linolenate," Progress in Lipid Research,
vol. 31, pp. 109-126, 1992.
[15] D. Rooney and L. R. Weatherley, "The effect of reaction conditions upon lipase
catalysed hydrolysis of high oleate sunflower oil in a stirred liquid - liquid
reactor," Process Biochemistry, vol. 36, pp. 947-953, 2001.
[16] L. E. Lundgaard, W. Hansen and S. Ingebrigtsen, "Ageing of mineral oil
impregnated cellulose by acid catalysis," IEEE Transactions on Dielectrics and
Electrical Insulation, vol. 15, pp. 540-546, 2008.
[17] L. E. Lundgaard, W. Hansen, S. Ingebrigtsen, D. Linhjell and M. Dahlund,
"Aging of kraft paper by acid catalyzed hydrolysis," IEEE International
Conference on Dielectric Liquids (ICDL), Coimbra, Portugal pp. 381-384, 26
June - 1 July, 2005.

References
208
[18] L. E. Lundgaard, W. Hansen, D. Linhjell and T. J. Painter, "Aging of oil
impregnated paper in power transformers," IEEE Transactions on Power
Delivery, vol. 19, pp. 230-239, 2004.
[19] S. Ingebrigtsen, M. Dahlund, W. Hansen, D. Linhjell and L. E. Lundgaard,
"Solubility of carboxylic acids in paper (kraft) oil insulation systems," IEEE
Conference on Electrical Insulation and Dielectric Phenomena (CEIDP),
Colorado, USA, pp. 253-257, 17-20 October, 2004.
[20] A. M. Emsley, X. Xiao, R. J. Heywood and M. Ali, "Degradation of cellulosic
insulation in power transformers part 3: effects of oxygen and water on ageing
in oil," IEE Proceedings on Science, Measurement and Technology, vol. 147,
pp. 115-119, 2000.
[21] A. M. Franklin, "Simpler measurement of relative humidity in electrical
insulating oils," Electr. Rev., vol. 194, p. 373, 1974.
[22] H. P. Moser and V. Dahinden, "Transformerboard II," H. Weidmann AG, CH-
8640 Rapperswil, 1999.
[23] W. R. Wilson, "A fundamental factor controlling the unit dielectric strength of
oil," AIEE Trans. Power App. Syst., vol. 72, pp. 68-74, 1953.
[24] J. Dai, Z. D. Wang and P. Jarman, "Moisture and aging effect on the creepage
discharge characteristics at the oil/transformer board interface under divergent
field," IEEE Conference on Electrical Insulation and Dielectric Phenomena
(CEIDP), Quebec, Canada, pp. 662-665, 26-29 October, 2008.
[25] R. J. Heywood, A. M. Emsley and M. Ali, "Degradation of cellulosic insulation
in power transformers part I: factors affecting the measurement of the average
viscometric degree of polymerisation of new and aged electrical papers," IEE
Proceedings on Science, Measurement and Technology, vol. 147, pp. 86-90,
2000.
[26] A. M. Emsley and G. C. Stevens, "Review of chemical indicators of
degradation of cellulosic electrical paper insulation in oil-filled power
transformers," IEE Proceedings on Science, Measurement and Technology, vol.
141, 1994.
[27] A. M. Emsley and G. C. Stevens, "Kinetics and mechanisms of the low-
temperature degradation of cellulose," Cellulose, vol. 1, pp. 26-56, 1994.
[28] A. M. Emsley, "The kinetics and mechanisms of degradation of cellulosic
insulation in power transformers," Polymer Degradation and Stability, vol. 44,
pp. 343-349, 1994.
[29] T. A. Prevost and T. V. Oommen, "Cellulose insulation in oil filled power
transformers part I: history and development," IEEE Electrical Insulation
Magazine, vol. 22, pp. 28-35, 2006.
[30] H. P. Moser, "Transformerboard " Special print of Scientia Electrica, USA,
1979.
[31] K. Niskanen, "Paper physics," Technical Association of the Pulp Paper,
Industry, 1998.
[32] T. A. Prevost, "Thermally upgraded insulation in transformers," Electrical
Insulation Conference and Electrical Manufacturing Expo, Indiana, USA, pp.
120-125, 23 - 26 October, 2005.
[33] BS EN60641-1:2008, "Specification for pressboard and presspaper for
electrical purposes part 1: definitions and general requirements," British
Standard Institution (BSI), 2008.
[34] BS EN60763-1:2011, "Laminated pressboard for electrical purposes part 1:
definitions, classification and general requirements," British Standard
Institution (BSI), 2011.

References
209
[35] D. H. Shroff and A. W. Stannett, "A review of paper aging in power
transformers," IEE Proceedings on Generation, Transmission and Distribution,
vol. 132, pp. 312-319, 1985.
[36] H. Yoshida, Y. Ishioka, T. Suzuki, T. Yanari and T. Teranishi, "Degradation of
insulating materials of transformers," Electrical Insulation, IEEE Transactions
on, vol. EI-22, pp. 795-800, 1987.
[37] R. M. Morais and E. Engelstein, "Thermal ageing of oil paper insulation,"
IEEE International Conference on Dielectric Liquids (ICDL), Grenoble,
France, pp. 495-499, 10-14 September, 1990.
[38] D. J. T. Hill, T. T. Le, M. Darveniza and T. Saha, "A study of degradation of
cellulosic insulation materials in a power transformer part 1: molecular weight
study of cellulose insulation paper," Polymer Degradation and Stability, vol.
48, pp. 79-87, 1995.
[39] D. J. T. Hill, T. T. Le, M. Darveniza and T. Saha, "A study of degradation of
cellulosic insulation materials in a power transformer part 2: tensile strength of
cellulose insulation paper," Polymer Degradation and Stability, vol. 49, pp.
429-435, 1995.
[40] D. J. T. Hill, T. T. Le, M. Darveniza and T. Saha, "A study of degradation of
cellulosic insulation materials in a power transformer part 3: degradation
products of cellulose insulation paper," Polymer Degradation and Stability, vol.
51, pp. 211-218, 1996.
[41] M. C. Lessard, L. Van Nifterik, M. Masse, J. F. Penneau and R. Grob,
"Thermal aging study of insulating papers used in power transformers," IEEE
Conference on Electrical Insulation and Dielectric Phenomena (CEIDP),
California, USA, vol. 2, pp. 854-859, 20 - 23 October, 1996.
[42] S. Levchik, J. Scheirs, G. Camino, W. Tumiatti and M. Avidano,
"Depolymerization processes in the thermal degradation of cellulosic paper
insulation in electrical transformers," Polymer Degradation and Stability, vol.
61, pp. 507-511, 1998.
[43] H. P. Gasser, J. Huser, C. Krause, V. Dahinden and A. M. Emsley,
"Determining the ageing parameters of cellulosic insulation in a transformer,"
IEE Conference Publication on High Voltage Engineering Symposium, vol. 4,
pp. 4.143-4.147, 1999.
[44] A. M. Emsley, R. J. Heywood, M. Ali and C. M. Eley, "On the kinetics of
degradation of cellulose," Cellulose, vol. 4, pp. 1-5, 1997.
[45] A. M. Emsley, X. Xiao, R. J. Heywood and M. Ali, "Degradation of cellulosic
insulation in power transformers part 2: formation of furan products in
insulating oil," IEE Proceedings on Science, Measurement and Technology vol.
147, pp. 110-114, 2000.
[46] A. M. Emsley, X. Xiao, R. J. Heywood and M. Ali, "Degradation of cellulosic
insulation in power transformers part 4: effects of ageing on the tensile strength
of paper," IEE Proceedings on Science, Measurement and Technology, vol.
147, pp. 285-290, 2000.
[47] K. J. Rapp and J. Luksich, "Reaction rates of paper aged in natural ester
dielectric fluid," IEEE Conference on Electrical Insulation and Dielectric
Phenomena (CEIDP), Ontario, Canada, pp. 209-212, 14-17 October, 2001.
[48] P. Thomas, A. K. Shukla and Raghuveer, "Ageing studies on paper oil to assess
the condition of solid insulation used in power transformers," IEEE
International Conference on Solid Dielectrics (ICSD), Eindhoven, Netherlands
pp. 69-72, 25 - 29 June, 2001.

References
210
[49] M. Mirzaie, A. Gholami and H. Tayyebi, "Thermal degradation of cellulose
paper insulation in power transformers," IEEE International Conference on
Solid Dielectrics (ICSD), Winchester, UK, pp. 673-676, 8 - 13 July, 2007.
[50] P. Verma, D. S. Chauhan and P. Singh, "Effects on tensile strength of
transformer insulation paper under accelerated thermal and electrical stress,"
IEEE Conference on Electrical Insulation and Dielectric Phenomena (CEIDP),
Vancouver BC, Canada, pp. 619-622, 14-17 October, 2007.
[51] J. Unsworth and F. Mitchell, "Degradation of electrical insulating paper
monitored with high performance liquid chromatography," IEEE Transaction
on Electrical Insulation, vol. 25, pp. 737-746, 1990.
[52] "Thermal performance of transformers," CIGRE Brochure 393, 2009.
[53] M. H. Glomm Ese, K. B. Liland and L. E. Lundgaard, "Oxidation of paper
insulation in transformers," IEEE Transactions on Dielectrics and Electrical
Insulation, vol. 17, pp. 939-946, 2010.
[54] "Ageing of cellulose in mineral oil insulated transformers " CIGRE Brochure
323, 2007.
[55] G. L. Patrick, "Organic chemistry," Taylor & Francis Routledge, p. 368, 2004.
[56] John Scheirs, Giovanni Camino, Mauro Avidano and Wander Tumiatti, "Origin
of furanic compounds in thermal degradation of cellulosic insulating paper,"
Journal of Applied Polymer Science, vol. 69, pp. 2541-2547, 1998.
[57] X. Zou, N. Gurnagul, T. Uesaka and J. Bouchard, "Accelerated aging of papers
of pure cellulose: mechanism of cellulose degradation and paper
embrittlement," Polymer Degradation and Stability, vol. 43, pp. 393-402, 1994.
[58] X. Zou, T. Uesaka and N. Gurnagul, "Prediction of paper permanence by
accelerated aging part I: kinetic analysis of the aging process," Cellulose, vol.
3, pp. 243-267, 1996.
[59] John Scheirs, Giovanni Camino, Wander Tumiatti and Mauro Avidano, "Study
of the mechanism of thermal degradation of cellulosic paper insulation in
electrical transformer oil," Journal of Applied Polymer Science, vol. 259, pp.
19-24, 1998.
[60] R. Gilbert, J. Jalbert, P. Tetreault, B. Morin and Y. Denos, "Kinetics of the
production of chain end groups and methanol from the depolymerization of
cellulose during the ageing of paper/oil systems part 1: standard wood kraft
insulation," Cellulose, vol. 16, pp. 327-338, 2009.
[61] J. Fabre and A. Pichon, "Deteriorating processes and products of paper in oil,
application to transformers," CIGRE, p. 137, 1960.
[62] B. Fallou, "Synthèse des travaux effectués au LCIE sur le complexe papier-
huile," Rev. Gén. l’Elect., vol. 79, pp. 645-661, 1970.
[63] I. Hohlein and A. J. Kachler, "Aging of cellulose at transformer service
temperatures part 2: influence of moisture and temperature on degree of
polymerization and formation of furanic compounds in free breathing systems,"
IEEE Electrical Insulation Magazine, vol. 21, pp. 20-24, 2005.
[64] T. V. Oommen and T. A. Prevost, "Cellulose insulation in oil filled power
transformers: part II maintaining insulation integrity and life," IEEE Electrical
Insulation Magazine, vol. 22, pp. 5-14, 2006.
[65] A. J. Kachler and I. Hohlein, "Aging of cellulose at transformer service
temperatures part 1: influence of type of oil and air on the degree of
polymerization of pressboard, dissolved gases, and furanic compounds in oil,"
IEEE Electrical Insulation Magazine, vol. 21, pp. 15-21, 2005.

References
211
[66] P. Pahlavanpour, Eklund and M. A. Martins, "Insulating paper ageing and
furfural formation," Electrical Insulation Conference and Electrical
Manufacturing & Coil Winding Technology Conference, Indiana, USA, pp.
283-288, 23-25 September, 2003.
[67] W. J. McNutt, "Insulation thermal life considerations for transformer loading
guides," IEEE Transactions on Power Delivery, vol. 7, pp. 392-401, 1992.
[68] J. Jalbert, R. Gilbert, P. Tétreault, B. Morin and D. Lessard-Déziel,
"Identification of a chemical indicator of the rupture of 1,4-β-glycosidic bonds
of cellulose in an oil-impregnated insulating paper system," Cellulose, vol. 14,
pp. 295-309, 2007.
[69] BS EN60450:2004, "Measurement of the average viscometric degree of
polymerization of new and aged cellulosic electrically insulating materials,"
British Standard Institute (BSI) 2004.
[70] M. Ali, C. Eley, A. M. Emsley, R. Heywood and X. Xaio, "Measuring and
understanding the ageing of kraft insulating paper in power transformers,"
IEEE Electrical Insulation Magazine, vol. 12, pp. 28-34, 1996.
[71] D. F. Caulfield and D. E. Gunderson, "Paper testing and strength
characteristics," TAPPI proceedings Washington, DC. Atlanta, pp. 31-40,
1988.
[72] BS EN4415 and IEC1924, "Determination of the tensile properties of paper and
board part 1: constant rate of loading method," British Standard Institute (BSI)
and International Electrotechnical Commission (IEC), 1992.
[73] BS EN ISO1924, "Paper and board determination of tensile properties part 2:
constant rate of elongation method," British Standard Institute (BSI) and
International Electrotechnical Commission (IEC), 1995.
[74] BS ISO15361:2000, "Pulps determination of zero span tensile strength, wet or
dry," British Standard Institute (BSI), 2000.
[75] I. Chendong, "Monitoring paper insulation aging by measuring furfural
contents in oil," International Symposium on High Voltage Engineering (ISH),
Dresden, August, 1991.
[76] B. Pahlavanpour, "Power transformer insulation ageing," CIGRE Study
Committee 15 Symposium, Sydney, Australia, 1995.
[77] A. de Pablo, "Furfural and ageing: how are they related," IEE Colloquium on
Insulating Liquids (Ref. No. 1999/119), pp. 5/1-5/4, 1999 1999.
[78] P. J. Burton, M. Carballeira, M. Duval, J. Fuller, C. W. Graham, A. D. Pablo, J.
Samat and E. Spicar, "Applications of liquid chromatography to the analysis of
electrical insulating material," CIGRE Paris Session, pp. 15-08, 1988.
[79] BS EN61198:1994 and IEC1198:1993, "Mineral insulating oils methods for the
determination of 2-furfural and related compounds," British Standard Institute
(BSI) and International Electrotechnical Commission (IEC), 1994.
[80] R. D. Stebbins, D. S. Myers and A. B. Shkolnik, "Furanic compounds in
dielectric liquid samples: review and update of diagnostic interpretation and
estimation of insulation ageing," IEEE International Conference on Properties
and Applications of Dielectric Materials (ICPADM), Nagoya, Japan, vol. 3, pp.
921-926, 1 - 5 June, 2003.
[81] H. Lutke, I. Hohlein and A. J. Kachler, "Transformer ageing research on
furanic compounds dissolved in insulating oil," CIGRE Paris Session, pp. 15-
302, 2002.
[82] J. A. Lapworth, R. J. Heywood, P. N. Jarman and C. Myers, "Transformer
insulation: toward more reliable residual life assessments," CIGRE A2-D1
Colloquium, Bruges, 2007.
References
212
[83] J. Nejedly and H. Halbwirth, "Furan derivates in oil: correlation between 2FAL
and DP in a hermetically sealed transformer," CIGRE Paris Session, pp. D1-
212, 2008.
[84] I. Hohlein and A. J. Kachler, "Progress in transformer ageing research, impact
of moisture on DP of solid insulation and furane development in oil at
transformer service temperatures," CIGRE Paris Session, pp. D1-309, 2004.
[85] D. Allan, "Recent advances in the analysis and interpretation of aged insulation
from operating power transformers," IEEE International Conference on
Properties and Applications of Dielectric Materials (ICPADM), Seoul, Korea,
vol. 1, pp. 202-205 25-30 May, 1997.
[86] BS EN60567:2005, "Oil filled electrical equipment sampling of gases and of
oil for analysis of free and dissolved gases guidance," British Standard Institute
(BSI), 2005.
[87] BS EN60599:1999 and IEC60599:1999, "Mineral oil impregnated electrical
equipment in service guide to the interpretation of dissolved and free gases
analysis," British Standard Institute (BSI) and International Electrotechnical
Commission (IEC), 1999.
[88] BS IEC60076-7:2005, "Power transformers part 7: loading guide for oil
immersed power transformers," British Standard Institute (BSI) and
International Electrotechnical Commission (IEC), 2005.
[89] S. J. I'Anson and W. W. Sampson, "Competing Weibull and stress transfer
influences on the specific tensile strength of a bonded fibrous network,"
Composites Science and Technology, vol. 67, pp. 1650-1658, 2007.
[90] BS EN62021-1:2003, "Insulating liquids determination of acidity part 1:
automatic potentiometric titration," British Standard Institute (BSI), 2003.
[91] T. Leibfried, U. Thieb, I. Hohlein, B. Breitenbauch, T. Lainck, J. Leibner and
S. Truant, "Profile of water content and degree of polymerisation in the solid
insulation of power transformers," IEEE International Symposium on Electrical
Insulation (ISEI), Indiana, USA, pp. 109-112, 19 - 22 September, 2004.
[92] C. Homagk, K. Mossner and T. Leibfried, "Investigation on degradation of
power transformer solid insulation material," IEEE Conference on Electrical
Insulation and Dielectric Phenomena (CEIDP), Quebec, Canada, pp. 75-78, 26-
29 October, 2008.
[93] "Doble powertest scrapping reports," 2008 - 2011.
[94] Q. Liu, Z.D. Wang, N. Azis, W.W. Sampson, P. Jarman, S. Ryder and H. Z.
Ding, "Assessment of ageing conditions through paper tensile strength analysis
of scrapped transformers," International Symposium of High Voltage (ISH),
Cape Town, South Africa, pp. 264-269, 24-28 August 2009.
[95] D. Allan, C. Jones and B. Sharp, "Studies of the condition of insulation in aged
power transformers part 1: insulation condition and remnant life assessments
for in-service units," IEEE International Conference on Properties and
Applications of Dielectric Materials (ICPADM), Tokyo, Japan, vol. 2, pp.
1116-1119, 8-12 July 1991.
[96] N. Amano, "Improvement in maintenance and inspection of transformers in
Japan," Transmission and Distribution Conference and Exhibition: Asia
Pacific. IEEE/PES, vol. 2, pp. 1500-1505, vol.2, 6-10 October, 2002.
[97] "National Grid seven year statement " 2009.
[98] H. Ding and Z. Wang, "On the degradation evolution equations of cellulose,"
Cellulose, vol. 15, pp. 205-224, 2008.

References
213
[99] T. W. Dakin, "Electrical insulation deterioration treated as a chemical rate
phenomenon," Transactions of the American Institute of Electrical Engineers,
vol. 67, pp. 113-122, 1948.
[100] J. Dai, "Studies on failure mechanisms of transformer cellulose insulation with
consideration of ester oil application," PhD thesis in Electrical and Electronic
Engineering, 2009.
[101] T. S. R. Murthy, U. Yugandhar, S. C. Gupta, A. Bhoomaiah and J. S. Kuntia,
"Study on the effect of impulse voltage withstandability on the thermally-aged
transformer paper," in Electrical Insulation, 2004. Conference Record of the
2004 IEEE International Symposium on, 2004, pp. 38-41.
[102] K. Giese, "The effects of cellulose insulation quality on electrical intrinsic
strength," IEEE Electrical Insulation Magazine, vol. 10, pp. 38-42, 1994.
[103] ASTMD1816, "Standard test method for dielectric breakdown voltage of
insulating oils of petroleum origin using VDE electrodes," ASTM international,
West Conshohocken, PA, USA, 2004.
[104] BS EN60156:1996 and IEC156:1995, "Insulating liquids determination of the
breakdown voltage at power frequency test method," British Standard Institute
(BSI) and International Electrotechnical Commission (IEC), 1996.
[105] M. Koch, M. Fischer and S. Tenbohlen, "The breakdown voltage of insulation
oil under the influences of humidity, acidity, particles and pressure,"
International Conference Advances in Processing, Testing and Application of
Dielectric Materials, Wroclaw, Poland, pp. 98-103, 26 - 28 September, 2007.
[106] J. Viertel, K. Ohlsson and S. Singha, "Thermal aging and degradation of thin
films of natural ester dielectric liquids," IEEE International Conference on
Dielectric Liquids (ICDL), Trondheim, Norway, pp. 1-4, 26-30 June, 2011.
[107] S. Tenbohlen and M. Koch, "Aging performance and moisture solubility of
vegetable oils for power transformers," IEEE Transactions on Power Delivery,
vol. 25, pp. 825-830, 2010.
[108] I. Fofana, J. S. N'Cho, J. C. Olivares-Galvan, R. Escarela-Perez and P. S.
Georgilakis, "Comparative studies of the stabilities to oxidation and electrical
discharge between ester fluids and transformer oils," North American Power
Symposium (NAPS), Massachusetts, USA, pp. 1-4, 4-6 August, 2011.