Age and Sex of Population Income Education Performance of Criminal Justice System.
36
-
date post
21-Dec-2015 -
Category
Documents
-
view
215 -
download
0
Transcript of Age and Sex of Population Income Education Performance of Criminal Justice System.


Age and Sex of Population
Income
Education
Performance of Criminal Justice System

Age and Sex of Population
No significant changes over time
Increases/Decreases in crime not mirrored by changes in young male population
Ratio of males to females similar to rest of California

Income
Personal Income 1990/1998
05.000
10.00015.00020.00025.00030.00035.00040.00045.00050.000
Kin
gs
Imp
erial
Me
rced
Tu
lare
Ke
rn San
Be
rnard
ino
FRES
NO
San
Joaq
uin
S
tanis
laus
Rive
rsid
e
San
Lu
isO
bis
po
Sacram
en
to
Lo
sA
ng
ele
s
San
Die
go
Mo
nte
rey
San
taB
arbara
Ve
ntu
ra
So
no
ma
San
ta Cru
z
Alam
ed
a
Oran
ge
Co
ntra
Co
sta
San
ta Clara
San
Mate
o
San
Francis
co
1990 1998
Low but not lowest

Education
Low but not poorest level in Central Valley

Violent Offenses
Automobile Thefts
Gang Activity

Violent Offenses
Fresno County Violent Crime
0.00
500.00
1,000.00
1,500.00
2,000.00
Y 1
991
Y 1
992
Y 199
3
Y 199
4
Y 199
5
Y 199
6
Y 199
7
Y 199
8
Y 199
9
Y 200
0

1999 California Crime Index without Motor Vehicle Theft
0200400600800
100012001400160018002000

1999 California Crime Index without MV Theft & Aggr. Assault
0200400600800
100012001400

Cal. Crime Index-Fresno County Cities
01000200030004000500060007000
Clo
vis
Co
alin
ga
Fire
ba
ug
h
Fo
wle
r
Fre
sn
o
Hu
ron
Ke
rma
n
Kin
gs
bu
rg
Re
ed
ley
Sa
ng
er
Se
lma
19951996199719981999

California Crime Index 1999-Selected Cities
0500
1000150020002500300035004000

Automobile Thefts
Motor Vehicle Theft Rate1990-1999
0
500
1000
1500
2000
2500
Fresn
o
Kern
Lo
sA
ng
eles
Merced
San
Dieg
o
Stan
islaus
Tulare
Califo
rnia
Units 1990 1991 1992 1993 1994 1995 1996 1997 1998 1999

Gang Activity

Law Enforcement
Courts
Corrections


Violent Felony and Felony Assault Arrest Rates-Fresno County
0
200
400
600
800
1000
198219831984198519861987198819891990199119921993199419951996199719981999
violfelarr Fasslt

1999 Comparison of Adult Felony Arrests Rates for Weapons Offenses
020406080
Sa
n M
ate
o
Sa
nta
Cla
ra
Sa
n L
uis O
bisp
o
Ora
ng
e
Kin
gs
Sa
n D
ieg
oF
RE
SN
OP
lace
r L
os A
ng
ele
s V
en
tura
S
on
om
a
So
lan
o
Sa
nta
Cru
z S
an
Joa
qu
in
Bu
tteM
on
tere
y C
on
tra C
osta
S
an
Fra
ncisco
R
iversid
e
Ala
me
da
T
ula
re
Sa
cram
en
to
Sa
n B
ern
ard
ino
K
ern
Sta
nisla
us
Sh
asta
Me
rced

1999-Comparison of Juvenile Felony Arrest Rates for Weapons Offenses
05
101520253035
Sa
n Fran
cisco
Sa
n Lu
is ...C
on
tra C
osta
A
lame
da
S
anta
Ba
rbara
S
an M
ate
o
Sa
cram
en
toO
ran
ge
F
RE
SN
OP
lacer
Lo
s An
gele
sV
entu
ra
So
lan
o S
ono
ma
Rive
rside
Tu
lare
Sh
asta B
utte
K
ings
Sa
n Be
rna
rdin
o M
onte
reyS
an D
ieg
o
Sta
nislau
s K
ern
S
anta
Clara
Sa
nta C
ruz
Sa
n Joaq
uin M
erced

Fresno County-Juvenile arrest ratefor violent felonies
0
50
100
150
19
82
19
83
19
84
19
85
19
86
19
87
19
88
19
89
19
90
19
91
19
92
19
93
19
94
19
95
19
96
19
97
19
98
19
99
Juvenile Motor Vehicle Theft Arrest Rate-1994
0
50
100
150
200
250

Arrests as percentage of total reported Motor Vehicle Thefts -1999
05
10152025303540

Central Valley counties surrounding Fresno county have similar demographics but a consistently lower California Index Crime rates compared to Fresno County. What is notable about the differences, however, is that the rate of California Index crimes for Fresno County had the steepest decline of any central valley county. A review of crime rates from 1990-1999, shows Fresno County with a 54% decline in Index Crimes from the highest rate in 1992. Much smaller Madera County experienced a decline of 52% in 1999, compared to its highest year of 1995, and in Stanislaus County, the county with the next highest drop in Index Crimes, the 1999 data shows a difference of 34% compared to its highest year of 1993. Fresno County Index Crimes dropped every subsequent year beginning with1992 and ending in 1999. There were no significant demographic changes in Fresno County during the time period when compared to other central valley counties. The disproportionate differences in the drop of crime rates in Fresno County may be associated with criminal justice activity, including personnel increases in the City of Fresno Police Department, the city with the highest crime rates in the county, and the creation of special units to address gang activity, auto theft and related offenses.


Fresno County-New Admissions to the CDC
1,000
1,100
1,200
1,300
1,400
Adm.1997 Adm.1998 Adm. 1999 Adm. 2000

Probation Officer Caseloads 1999(Misdemeanor/Felony combined)
020406080
100120140160

Adult Felony Probation Caseloads-1999
01020304050607080

Percent Adult Felony Case Dismissals-1998
010203040

1990 1991 1992 1993 1994 1995 1996 1997 1998
Sacramento 20.8 19.3 18.8 18.7 17.9 20.7 11.4 4.6 16.6
Tulare 11.3 9.9 7.7 6.2 5.9 4.2 3.8 5.2 5.1
Contra Costa 15.4 14.1 12.2 10.5 9.7 8.5 10.3 9 9.9
Los Angeles 10.8 10.9 10.8 10.7 11.5 11.2 9.3 9.4 9.6
San Diego 11.4 10.7 10.8 9.4 10.2 10 9.3 9.7 9.8
Monterey 15.7 16.3 14.3 12.2 15 12.1 11 10.1 10.2
Orange 11.5 11 10 8.1 7.8 6.9 8.5 11.7 11.4
Kern 11.5 9.8 10.5 9.7 10.7 10.3 13.5 13.4 14.7
San Joaquin 15.9 15.3 13.9 11.7 13.3 18 17.3 15.9 16.2
Stanislaus 21.2 19 17.6 15.8 16.6 13.8 10.7 16.8 18.4
Kings 17 13.7 16.5 13.1 16.7 19.1 14.5 19.2 24.9
Merced 9.4 9.2 8.6 9.9 11.1 15.6 20.3 22.2 19.4
San Francisco 12.5 13.1 16.4 15.7 16.5 22.2 25 28.5 24.1
FRESNO 23.1 21.9 21.5 19.5 30.2 29.5 25.8 31.9 30.1
Case Dismissals


California Inmate Population
148,000
150,000
152,000
154,000156,000
158,000
160,000
162,000
Pop 1997 Pop 1998 Pop 1999 Pop 2000
19 February 2003- 159,695 of which 18,632 are INS Holds

Parolees per Capita and County-1999
050
100150200250300350
Co
ntra
Co
sta
Sa
n L
uis O
bisp
oS
an
ta C
ruz
Sa
n F
ran
ciscoS
an
Ma
teo
So
no
ma
Ve
ntu
raP
lace
rA
lam
ed
a
Mo
nte
rey
Sa
nta
Ba
rba
raO
ran
ge
Sta
nisla
us
Hu
mb
old
tS
an
Joa
qu
inS
an
Die
go
So
lan
oT
ula
reS
acra
me
nto
FR
ES
NO
Me
rced
Co
un
tyL
os A
ng
ele
s R
iversid
eS
ha
staS
an
Be
rna
rdin
oK
ing
s K
ern

Percent of Parolees Returned to Custody-1999
05
10152025303540
Gle
nn
Im
pe
rial
Sa
nta
Cru
z H
um
bo
ldt
Kin
gs
Pla
cer
Sa
n L
uis O
bisp
o
So
no
ma
M
erce
d
Sh
asta
M
on
tere
y S
an
ta B
arb
ara
S
an
Ma
teo
T
ula
re
Sa
n F
ran
cisco
Sa
n Jo
aq
uin
S
ola
no
V
en
tura
S
tan
islau
s C
on
tra C
osta
F
RE
SN
OA
lam
ed
a
Sa
nta
Cla
ra
Ke
rn
Sa
cram
en
toO
ran
ge
R
iversid
e
Sa
n B
ern
ard
ino
S
an
Die
go
L
os A
ng
ele
s
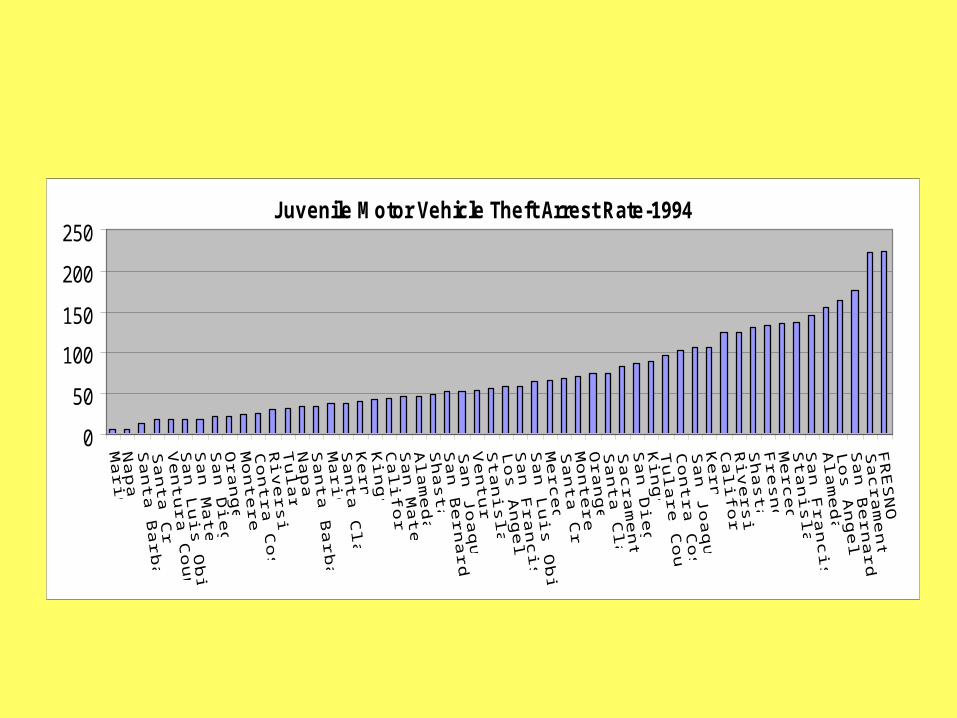
Fresno County Parolee Violators Returned to CDC
300
350
400
450
Y 1997 Y 1998 Y 1999 Y 2000


More probation/parole officers
Target hardening efforts-reduce opportunities for crime
More Creative Approaches to dealing with Motor Vehicle Theft
Greater efforts aimed at gangs and weapons related offenses.
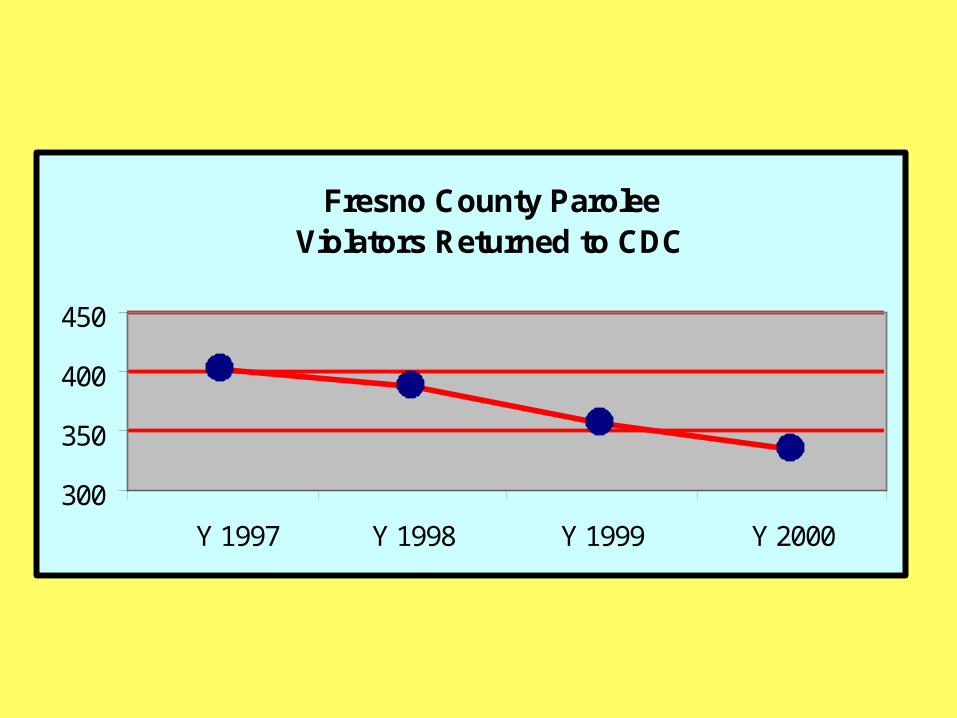
Reducing FTAs (LAO)
Reducing Early Releases from Jail (LAO)