Age 21 Cost-Benefit Analysis of the Title I Chicago Child ...clstudy.org/documents/Cba.pdf · Age...
37
Educational Evaluation and Policy Analysis Winter 2002, Vol. 24, No. 4, pp. 267-303 Is. Age 21 Cost-Benefit Analysis of the Title I Chicago Child-Parent Centers Arthur J. Reynolds University of Wisconsin-Madison Judy A. Temple Northern Illinois University Dylan L. Robertson Enily A. Mann University of Wisconsin-Madison We conducted thefirst cost-benefit analysis of afederallyfinanced, comprehensive early childhood program. The Title I Chicago Child-Parent Centers are located in public schools and provide educational andfamily support services to low-income childrenfrom ages 3 to 9. Using datafrom a cohort of 1,539 program and comparison-group children born in 1980 who participate in the Chicago Longitudinal Study, measures of program participation were significantly associated with greater school achievement, higher rates of high school completion, and with significantly lower rates of remedial education services, juvenile delinquency, and child maltreatment. Economic analyses indicated that the measured and projected economic benefits of preschool participation, school-age participation, and extended program participation exceeded costs. In present-value 1998 dollars, the preschool program provided a return to society of $7.14 per dollar invested by increasing economic well-being and tax revenues, and by reducing public expenditures for reme- dial education, criminal justice treatment, and crime victims. The extended intervention program (4 to 6 years of participation) provided a return to society of $6.11 per dollar invested while the school-age program yielded a return of $1.66 per dollar invested. Findings demonstrate that an es- tablished public program can provide benefits thatfar exceed costs. Key elements of CPCprogram effectiveness include an instructionalfocus on literacy, opportunities for intensive parent involve- ment, and implementation by well-trained staff within a single administrative system. Keywords: cost-benefit analysis, early childhood intervention, longitudinal studies, urban education We are grateful for funding support provided by the National Institute of Child Health and Human Development (No. R01HD34294), the Office of Educational Research and Improvement in the U.S. Department of Education (Nos. R305T990477 and R306F960055), and the Institute for Research on Poverty at the University of Wisconsin-Madison. We thank the Juvenile Justice Division in the Circuit Court of Cook County, the City Colleges of Chicago, the Illinois De- partment of Child and Family Services, and the Chapin Hall Center for Children at the University of Chicago for assistance in data collection. We also thank the Departments of Early Childhood Programs and Research, Assessment, and Analysis in the Chicago Public Schools for cooperation in data collection and technical assistance. We thank E. Michael Foster and W. Steven Barnett for their helpful feedback. An earlier version of this article was presented at the June 2001 annual meet- ing of the Society for Prevention Research in Washington, DC. 267
Transcript of Age 21 Cost-Benefit Analysis of the Title I Chicago Child ...clstudy.org/documents/Cba.pdf · Age...

Educational Evaluation and Policy AnalysisWinter 2002, Vol. 24, No. 4, pp. 267-303
Is.
Age 21 Cost-Benefit Analysis of the Title I ChicagoChild-Parent Centers
Arthur J. ReynoldsUniversity of Wisconsin-Madison
Judy A. TempleNorthern Illinois University
Dylan L. RobertsonEnily A. Mann
University of Wisconsin-Madison
We conducted thefirst cost-benefit analysis of afederallyfinanced, comprehensive early childhood
program. The Title I Chicago Child-Parent Centers are located in public schools and provide
educational andfamily support services to low-income childrenfrom ages 3 to 9. Using datafrom
a cohort of 1,539 program and comparison-group children born in 1980 who participate in the
Chicago Longitudinal Study, measures of program participation were significantly associated with
greater school achievement, higher rates of high school completion, and with significantly lower
rates of remedial education services, juvenile delinquency, and child maltreatment. Economic
analyses indicated that the measured and projected economic benefits of preschool participation,
school-age participation, and extended program participation exceeded costs. In present-value
1998 dollars, the preschool program provided a return to society of $7.14 per dollar invested by
increasing economic well-being and tax revenues, and by reducing public expenditures for reme-
dial education, criminal justice treatment, and crime victims. The extended intervention program
(4 to 6 years of participation) provided a return to society of $6.11 per dollar invested while the
school-age program yielded a return of $1.66 per dollar invested. Findings demonstrate that an es-
tablished public program can provide benefits thatfar exceed costs. Key elements of CPCprogram
effectiveness include an instructionalfocus on literacy, opportunities for intensive parent involve-ment, and implementation by well-trained staff within a single administrative system.
Keywords: cost-benefit analysis, early childhood intervention, longitudinal studies, urban education
We are grateful for funding support provided by the National Institute of Child Health and Human Development
(No. R01HD34294), the Office of Educational Research and Improvement in the U.S. Department of Education
(Nos. R305T990477 and R306F960055), and the Institute for Research on Poverty at the University of Wisconsin-Madison.
We thank the Juvenile Justice Division in the Circuit Court of Cook County, the City Colleges of Chicago, the Illinois De-
partment of Child and Family Services, and the Chapin Hall Center for Children at the University of Chicago for assistance
in data collection. We also thank the Departments of Early Childhood Programs and Research, Assessment, and Analysis in
the Chicago Public Schools for cooperation in data collection and technical assistance. We thank E. Michael Foster and
W. Steven Barnett for their helpful feedback. An earlier version of this article was presented at the June 2001 annual meet-
ing of the Society for Prevention Research in Washington, DC.
267

Reynolds, Temple, Robertson, and Mann
RESEARCH over four decades indicates that earlychildhood interventions have beneficial effectson children's health and well-being. Participa-tion in a variety of interventions of good qualityis associated with improved health status, cog-nitive skills, achievement motivation, and schoolreadiness in the short term as well as schoolachievement, educational attainment, and reduc-tions in remedial services and criminal behaviorin the longer term (Barnett, 1995; Committeefor Economic Development, 2002; Consortium forLongitudinal Studies, 1983; Council of EconomicAdvisors, 1997; Karoly et al., 1998; Ramey et al.,2000; Schweinhart, Barnes, & Weikart, 1993;Zigler, Taussig, & Black, 1992).
Because they can improve children's educa-tional and socioeconomic prospects, early child-hood programs are believed to be cost effective.Relatively little evidence exists, however, thatthese preventive interventions provide long-termbenefits that substantially exceed costs. Giventhat the annual cost to the nation of school dropoutand crime in the United States is estimated to be$350 billion (Cohen, 1998; National Science andTechnology Council, 1997), the identification ofcost-effective prevention programs can reducepublic expenditures devoted to later treatmentand remedial services. The cost-effectiveness oflarge-scale early childhood interventions is un-known. At a time when annual state and federalexpenditures for early care and education approach$20 billion, better understanding is needed of thelong-term benefits of these investments to societyat large (Currie. 2001; U.S. General AccountingOffice, 1999).
Cost-benefit analyses show promising evi-dence that three early childhood interventionscan be an efficient use of public resources. Ameta-analysis of studies of the federally fundedSpecial Supplemental Food Program for Women,Infants, and Children (WIC) found that reduc-tions in rates of low and very low birth weight ledto substantial savings in hospitalization costsfor infants in the first year of life (Avruch &Cackley, 1995; U.S. General Accounting Office,1992). Each dollar spent on WIC was found toreturn $3.07 in medical savings to Medicaid andprivate payers. Two model programs that pro-vide a broader array of child and family servicesalso show cost-effectiveness. Participation in thePrenatal/Early Infancy Project, a nurse home-
268
visitation program for young mothers havingtheir first child, was associated with improvedmaternal and child outcomes into adulthood thattotaled about $30,000 per participant (a return of$5 per dollar invested) in government savings onwelfare spending, criminal justice system, andtangible crime-victim costs (Karoly et al., 1998;Olds et al., 1997).
The High/Scope Perry Preschool Programalso showed substantial cost-effectiveness. Par-ticipation in this center-based program begin-ning at age 3 was associated with public bene-fits totaling about $45,000 per child (a return of$4 per dollar invested) at age 27 in increasedtax revenues associated with higher measuredand projected earnings, reduced expendituresto the criminal justice system, reduced tangiblelosses to crime victims, and reduced expendi-tures for remedial education (Barnett, 1996;Schweinhart et al., 1993). With participants'increased earning capacity and averted intangi-ble costs to crime victims added, the total soci-etal benefit was nearly $9 per dollar invested.Both interventions resulted in savings to govem-ment of about $25,000 per participant (Karolyet al., 1998). Although these studies show sub-stantial reductions in expenditures on remedialeducation, criminal justice, and social services,corresponding evidence is needed about con-temporary early childhood programs adminis-tered through established educational and socialinstitutions.
Research in the Chicago Child-Parent Center(CPC) Program, a multi-site, federally fundedintervention operating in the Chicago publicschools, has indicated that relative to alternativekindergarten intervention, participation begin-ning in preschool is associated with several be-havioral outcomes that predict later economicand social well-being-including higher cognitiveskills, greater school achievement, and improvedconsumer skills-and with lower incidence ofschool remedial services in early adolescence(Reynolds, 1994, 2000; Reynolds & Temple,1995, 1998). In the most recent study (Reynolds,Temple, Robertson, & Mann, 2001), relative toparticipation in full-day kindergarten interven-tion, CPC preschool participation at ages 3 or 4was associated with significantly higher rates ofschool completion by age 20, with lower rates ofofficial juvenile arrests, violent arrests, and mul-tiple arrests by age 18, and with lower rates of

special education services and grade retention.Males experienced greater benefits than theirfemale counterparts in educational attainment.
School-age participation and extended pro-gram participation for 4 to 6 years were associ-ated with lower rates of special education ser-vices and grade retention. Estimated effects ofprogram participation over the years have beenunaffected by alternative model specificationand analytic methods (Reynolds & Temple,1995; Reynolds et al., 2001; Temple, Reynolds,& Miedel, 2000). These outcomes are sugges-tive of sizable economic benefits to participantsand society. Studies of other CPC cohorts havefound similar patterns of effects (Conrad & Eash,1983; Fuerst & Fuerst, 1993).
In this study, we conduct the first cost-benefitanalysis of an established, large-scale early child-hood intervention for preschool children andtheir families. Funded by Title I of the Elemen-tary and Secondary Education Act of 1965, CPCis, after Head Start, the nation's oldest federallyfunded preschool program. It shares with HeadStart a focus on comprehensive services. Openedin 1967, the program provides services from ages3 to 9 in 23 sites in high-poverty neighborhoods.Using data from the ongoing Chicago Longitudi-nal Study, we investigate the benefits of pre-school participation, school-age participation,and extended program participation in (a) reduc-ing expenditures for school remedial servicesthrough the end of high school, including specialeducation and grade retention, (b) reducing crim-inal justice system expenditures associated witharrest, adjudication, and treatment for both juve-nile and adult crime, (c) reducing child welfaresystem expenditures associated with child mal-treatment, (d) averting tangible costs to victimsof crime and child maltreatment, and (e) increas-ing earnings capacity and tax revenues as a con-sequence of higher rates of high school comple-tion. Given our earlier findings, we hypothesizedthat the overall benefits of program participa-tion to the general public and society at largewould exceed costs and that the benefits of pre-school participation relative to costs wouldexceed those for school-age intervention andextended intervention. We also expected thateconomic benefits for males would be greaterthan for females and that more extensive partic-ipation would provide greater benefits than lessextensive participation.
Methods
Sample and Design
The Chicago Longitudinal Study (CLS, 1999)investigates the life-course development of 1,539children from low-income families; 93% areblack and 7% are Hispanic. Born in 1980, chil-dren and families in this ongoing study attendedkindergarten programs in 25 sites in 1985-86(Reynolds, 1999, 2000). The original sampleincluded the entire cohort of 989 children whocompleted preschool and kindergarten in all 20Child-Parent Centers with combined programsand 550 low-income children who did not attendthe program in preschool but instead participatedin a full-day kindergarten program in five ran-domly selected schools and in schools affiliatedwith the Child-Parent Centers. 14.8 percent of thecomparison group attended Head Start preschool;the remaining children were in home care.
In this quasi-experimental design, the compari-son group matched the program group on age, eli-gibility for intervention, and family socioeconomicstatus. The eligibility criteria for the program are(a) residence in a Title I school attendance area(i.e., serves high proportions of low-income fam-ilies), (b) demonstration of substantial educa-tional need due to poverty and associated factors,and (c) parents agree to participate. Since 1985,data have been collected yearly on a wide varietyof educational, social, and family experiences fromschool records, teachers, parents, and children.
As described previously (Reynolds, 2000;Reynolds et al., 2001), we assessed the impact ofCPC program participation beginning at age 3 onlater well-being above and beyond participationin the "treatment as usual" for low-income chil-dren in Chicago. The usual services included anenriched all-day kindergarten program and, forthe most part, no center-based preschool. Theeffect of the preschool program was estimatedby comparing the performance of the preschoolgroup who entered the program at ages 3 or 4against all other children in the study who at-tended the most typical early childhood pro-grams in low-income neighborhoods. Childrenwho attended Head Start and kindergarten pro-grams were included in the comparison groupbecause they were most representative of low-income children in Chicago and of those in al-temative early interventions.' The effect of theschool-age program was assessed by comparing
269

Reynolds, Temple, Robertson, and Mann
children participating in the school-age programfor one or more years with those not participat-ing in the school-age program regardless of theirpreschool participation. Because the school-ageprogram was open to any child attending theelementary school, we included all children whoparticipated. To control for the influence of ear-lier or later program participation, the effects ofschool-age and preschool intervention were esti-mated simultaneously. The effect of the extendedintervention was assessed by comparing childrenwho entered the CPCs in preschool and contin-ued their participation through second or thirdgrade (for 4 to 6 years) to all other children withless participation in either preschool or first-tothird-grades (from I to 4 years). Thus, this com-parison assesses the important question of theadded value of extended program participationover less extensive program participation.
The patterns of participation and postprogramdata collection are shown in Table 1 (see Appen-dix A for additional information). By age 21,
1,286 children (83.6% of the original sample) haddata for at least one of the major study outcomes.Educational attainment was known for 86.8%percent and 82.9% of the original preschool andcomparison groups, respectively, with no evidenceof selective attrition (Reynolds, 2000; Temple,Reynolds, & Miedel, 2000).2 Rates of samplerecovery were higher (above 90%) for the out-comes of juvenile arrest and child maltreatment(Ns = 1,404, 1,408). Children in the attrition andstudy samples were equivalent on child and familybackground attributes. Program outcomes weremeasured from school records, family and youthsurveys, and court records.
Group Comparability
As shown in Table 2, the program and com-parison groups in the follow-up sample weresimilar on many child and family characteristicsmeasured at the beginning of the study.3 Thesecharacteristics were measured from school recordsand family surveys from the preschool years to
TABLE 1Levels of Program Participation for Child-Parent Center and Comparison Groups in theChicago Longitudinal Study
Sample Characteristic CPC Intervention Group Comparison GroupOriginal sample size 989 550Preschool participation, % 100 14.8
Number of cases, 1 year 455 38Number of cases, 2 years 534 47Mean number of years 1.55 0.15
Kindergarten participation, %Full-day program, %
School-age participation, %Number of cases, 1 yearNumber of cases, 2 or 3 years
Extended participation, %Number of cases, 4 yearsNumber of cases, 5 yearsNumber of cases, 6 years
Total number of years of CPC program participationNumber of cases with known status at age 20-21
Educational attainment at age 21School remedial services, ages 6-18Juvenile arrest by age 18Child abuse and neglect, ages 4-17
Number of cases with at least two outcomesat age 20-21 follow-up
10059.9
69.2129555
55.9156313
843.95
858841911913
934
100100
30.238
128
0000
0.68
456445493495
504Note. Preschool participation of the comparison group was in Head Start. CPC participation began at age 3 and could continueto age 9 (3rd grade) in selected elementary schools. All children were eligible for participation in the school-age componentregardless of preschool status.
270

Age 21 Cost-Benefit Analysis of the Title I Chicago Child-Parent Centers
TABLE 2Group Equivalence of Program and Comparison Groups on Background Attributes for the Age 20-21
Follow-Up and Original Samples at the Beginning of the Study
Preschool Comparison OriginalGroup Group Sample
Child/Family Attribute (n = 841) (n = 445) p value p value
Female child, % 52.3 46.3 .017 .117
African American, % 94.0 92.6 .315 .945
Risk index (0-6), mean (SD) 3.56 3.62 .406 .095(1.3) (1.4)
High school-poverty (> 60%)*, % 77.1 71.9 .027 .038
Child eligible for subsidized meals 92.3 92.8 .772 .787
(< 130% of family poverty)*, %
Parent completed high school*, % 66.1 59.3 .033 .017
Single-parent status*, % 69.6 65.7 .223 .269
Parent not employed full-time 64.9 60.8 .204 .606
by child's age 12*, %
Missing parent education or meals 7.0 8.5 .329 .044
Mean number of siblings* 2.6 2.8 .007 .043
Parent was under age 20 at 23.2 19.2 .154 .250
child's birth, %
Child abuse or neglect by age 4, 1.1 1.3 .662 .951
(indicated report, %)
Census-track poverty, age 4, 46.0 39.9 <.001 <.001
mean (SD) (13.5) (11.9)
Census-track unemployment, age 4, 24.3 22.8 <.001 <.001
mean (SD) (6.0) (5.0)
Note. N= 1,286. variable included in risk index. Sample sizes vary by factor. Data collected from preschool to age 12. p values
show the significance of mean (or percentage) group differences for the age 20-21 and original samples, respectively. For high
school poverty, the 60% figure is the percentage of children in the school area who are from low-income families.
children's age 12. The family risk index, a sumof six dichotomous factors associated with lowerlevels of adjustment (i.e., low parental education,unemployment status, single-parent family sta-tus, eligibility for subsidized lunches, neighbor-hood poverty, four or more children in family),provides an overall summary of these character-istics. This cumulative index is a major correlateof child and family well-being (Bendersky &Lewis, 1994). The mean of the risk index wasequivalent between groups. Preprogram ratesof reported child abuse and neglect was similarbetween groups as were teenage parenthood,employment, and single-parent family status.Extended and school-age intervention groupsshowed similar patterns of equivalence.
Among the follow-up sample, the interventiongroup had a higher proportion of girls, a higherproportion of parents who had completed highschool, and fewer siblings. Alternatively, the
intervention group was more likely than com-parison group to reside in neighborhoods withhigher poverty and higher unemployment. Thelatter differences are the result of the centersbeing located in the most disadvantaged neigh-borhoods and that school personnel enroll chil-dren with the most economic and educationaldisadvantages. Because of these higher levels ofneighborhood disadvantage and because the com-parison group participated in alternative inter-ventions, findings are likely to lead to conserva-tive estimates of program effects. Nevertheless,estimates of intervention effects included the sexof child, race, family risk index, and program sites.Program sites were included to measure local fac-tors associated with participation.
Differences between groups in child and fam-ily outcomes provide good estimates of interven-tion effects for several reasons. First, most chil-dren in the preschool and school-age comparison
271

Reynolds, Temple, Robertson, and Mann
groups did not enroll in the program because theydid not live in an attendance area of the CPCs.Thus, home residency rather than parent interestdetermined participation. Indeed, the compari-son group was chosen from randomly selectedschools. Second, by comparing groups that re-ceived different intervention services, findings in-dicate the added value of the CPC program aboveand beyond participation in interventions thatprovide educational services. Third, we includeda set of covariates in the model to account formeasured differences between groups includingthe family risk index and program sites. Estimateswere unaffected by alternative model specifica-tions (e.g., risk factors entered separately), in-cluding those with additional covariates and withsmaller sample sizes. Previous studies show noevidence of selection bias for longer-term out-comes as assessed by simultaneous- equation andlatent variable models (Reynolds & Temple, 1995,1998; Temple et al., 2000). This is mostly due toprogram staff conducting extensive outreach toenroll children most in need.
Chicago Child-Parent Center Program
Because the CPC program is described fully inprevious reports (Reynolds, 2000; Reynolds et al.,2001), we provide only a summary of the mainfeatures in this section. Located in or close to pub-lic elementary schools, the CPC program pro-vides educational and family-support services tochildren between the ages of 3 and 9 (preschoolto second or third grade; see Figure 1). Withina structure of comprehensive services similar toHead Start, the intervention emphasizes the ac-quisition of basic skills in language arts and maththrough relatively structured but diverse learningexperiences that include teacher-directed, whole-class instruction in phonics, small-group activities,frequent field trips, and play. Literacy experiencesinvolving word analysis, oral communication, andlistening skills are highlighted as described inthe instructional activity guide (Chicago Board ofEducation, 1988). While learning activities in theprogram are generally consistent with contempo-rary practice, the CPCs, in contrast to most otherprograms, have emphasized basic skills since itopened in 1967 (Reynolds, 2000; Sullivan, 1971).
At the time of the study sample's participation,each of the 24 centers served approximately 100to 150 children aged 3 to 5 years (one center closedin 1987). The centers are located in the poorest
272
neighborhoods in Chicago. The mean rate offamily poverty in 1989 for the community areasserving the CPCs was 41% versus 17% for otherareas of the city. A head teacher and two coordi-nators direct each center, the parent-resourceteacher coordinates the family-support compo-nent and the school-community representativeprovides outreach to families.
The program was located in areas not beingserved by other preschool programs, and ratesof participation of eligible children exceeded80% in the neighborhoods of the CPCs. Thishigh level of enrollment (saturation) from thecommunity helps ensure that findings are rep-resentative of eligible children rather thanselective. The low-income status of the familiesprecluded enrollment in nonpublic care or edu-cation programs.
The preschool program runs three hours perday, five days per week during the 9-monthschool year, and usually includes a 6-week sum-mer program. After full-day or part-day kinder-garten, continuing services are provided in theaffiliated schools under the direction of the cur-riculum parent-resource teacher. Participation inthe school-age intervention is open to any childin the school, either in first and second grade in14 sites or first through third grade in six sites.
Major elements of the program include:
* A structured set of educational activities em-phasizing reading and math skills, and comple-mented with other instructional materials such asphonics curricula (e.g., Houghton Mifflin, Ginn),Language Lotto, Alpha Time, and Peabody Lan-guage Development Kits;
* Low child-to-staff ratios in preschool (17:2)and kindergarten (25:2);
* An intensive parent program that includesparticipating in parent room activities volunteer-ing in the classroom, attending school events andfield trips, and completing high school;
* Outreach activities, including resource mo-bilization, home visitation, and enrollment ofchildren;
* Regular staff development activities forteachers, all of whom have bachelor's degrees,are certified in early childhood education, and, aspublic-school employees, are relatively well-paid;
* Health and nutrition services, including healthscreening, speech therapy, and nursing and mealservices; and

0>1 0
p ,> ') Nt90 -'d
2 + 0 dii 'S 0 R 0) 0 4
0
m oc
0 0
2 0 0It .U
'' S t
a 00
0 5
S a
c~b ,r
0g ,,N a a
U'a ..
0 CiB a
E-
Z,
273

Reynolds, Temple, Robertson, and Mann
* Comprehensive school-age services includ-ing reduced class sizes (25 rather than 35+ chil-dren), teachers' aides for each class, parent pro-gram activities, extra instructional materials, andactivities to enrich reading and math skills.
Economic Methods
As a public investment in the lives of childrenand families, the Chicago Child-Parent CenterProgram is expected to provide benefits to partic-ipants that would be manifested many years laterin school achievement, utilization of remedial andtreatment services, educational attainment, andsocial functioning. A cost-benefit analysis iswarranted because these short- and long-termoutcomes of the program have measurable eco-nomic benefits. Moreover, the length, intensity,and breadth of services provided in this preven-tive intervention are substantially greater thanin most other intervention programs (Reynolds,2000). Previous reports from this study havedemonstrated with a high level of confidence thatprogram participation is independently linkedto better child and youth outcomes (Reynolds,1994, 2000; Reynolds & Temple, 1995, 1998;Reynolds et al., 2001).
Following standard economic procedures(Levin & McEwan, 2001; Lipscomb, Weinstein,& Torrance, 1996), we estimated the presentvalue of program benefits in 1998 dollars for fivemain categories: (a) reductions in expendituresfor school remedial services, including specialeducation and additional schooling required forretained students, (b) reductions in criminal jus-tice system expenditures for both juvenile andadult arrest and treatment, (c) reductions in childwelfare system expenditures, (d) averted tangi-ble expenditures to crime victims as a result oflower rates of arrest and to victims of child mal-treatment, and (e) increases in projected earningsof program participants and tax revenues as a re-sult of higher rates of high school completion.We did not estimate the benefits of the programon welfare participation. Although complete pub-lic aid data were not available, the parents of pro-gram and comparison-group participants so farhave comparable rates of welfare participation.
We distinguish three types of benefits in ouranalysis. Benefits to participants are returned tothe child and parent attending the program but donot directly benefit others in society. These ben-efits include increased earnings capacity in adult-
274
hood projected from educational attainment aswell as the benefit to parents from the provisionof part-day care for children. Benefits to the gen-eral public include averted expenditures of re-medial education and social welfare spending bygovermnents, reduced tangible expenditures tocrime victims as a result of lower rates of crime,and increased tax revenues to state and federalgovernments as a result of higher eamings ca-pacity. Benefits to society at large include thesum of benefits to program participants and to thegeneral public. We emphasize benefits to the gen-eral public in this article although estimates to allthree groups are presented, plus savings to gov-ernments.
Based on the above framework and given ourestimates of program impact, we used the fol-lowing procedure to calculate benefits and costsof CPC participation: (a) program costs and ben-efits are calculated in dollar terms, (b) the dollarvalues are converted to 1998 dollars to adjust forinflation, (c) the present values of future costs andbenefits are computed in 1998 dollars and evalu-ated at a baseline age of 3 using an annual dis-count rate of 3%, and (d) the present value of pro-gram costs is subtracted from the present valueof program benefits to obtain the net present valueof the intervention. Because it is common to es-timate the lifetime earnings benefits from highschool completion and adult crime from juvenilecrime, future benefits in these domains were pro-jected throughout adulthood (Karoly et al., 1998;Bamett, 1993, 1996). The present value of bene-fits is estimated at the beginning of the programat age 3 for all levels of program participation.Our choice of discount rate was recommended bythe U.S. Public Health Service (Lipscomb et al.,1996) and the U.S. General Accounting Office(1992). Alternative rates were tested as part ofsensitivity analysis. See Appendix B for an item-ized breakdown of benefit and cost categories.
Program Costs
The costs of the CPC program per participantwere estimated for the preschool and school-agecomponents of the program and for extendedprogram participation (four or more years of par-ticipation beginning in preschool). As shown inTable 3, these taxpayer costs include all outlaysfor staff, family and community support, admin-istration, operations and maintenance, instruc-tional materials, transportation and community

Age 21 Cost-Benefit Analysis of the Title I Chicago Child-Parent Centers
TABLE 3Itemized Costs in 1998 Dollars of the Chicago Child-Parent Center Program: Preschool and
School-Age Components
BRdgret Categorv Preschool Program Scol-g i rogram
Instructional staff
Family and school-community staff/parent program
Administration
Operations and maintenance
Instructional materials
Capital outlays and equipment
Transportation, food, and community services
School-wide services
School district support
Parent program participation
Capital depreciation and interest
Total cost in 1998 dollars
Number of children in 25 centers/schools
Average cost per child for one year
Present value of weighted average cost per child
Present value of weighted average cost per childfor 4 to 6 years of CPC participation
Amount above and beyond participation for1 to 4 years of intervention
7,864,225
1,744,945
2,288,153
1,905,311
140,772
76,075
85,364
779,901
141,632
1,421,695
1,652,121
18,100,194
4,114
4,400
6,692
7,849,856
25,634
1,481,416
117,621
118,864
42,796
140,744
897,300
10,674,231
6,757
1,580
2,981
10,000
4,057
Note. Original program costs (nominal dollars) for the preschool program were from 1985-1986 and for the school-age program
from 1986-1987. They were converted to 1998 dollars using the Consumer Price Index (CPI-U). The 1986, 1987, and 1998 CPI-U
values were, respectively, 109.6, 113.6, and 168.0. The present value was evaluated at age3 using an annual discount rate of 3%.
Parent program cost is based on 10 hours of participation per month at the minimum wage of $3.35. The present value of the
weighted average cost of I to 4 years of intervention (less-extensive participation) was $5,943.
services, school-wide services, school districtsupport, and capital depreciation and interest.Costs of the preschool program were based mainlyon the operational budget of the program for the1985-86 year (Chicago Public Schools, 1986a).The largest cost categories for the preschool pro-gram were instructional staff, administration,operations and maintenance, family and com-munity staff, and imputed capital depreciationand interest.4 The latter are based on replacementcosts of the preschool centers and forgone inter-est estimated over 50 years (Chicago Board ofEducation, 2001). These costs were supplementedwith others including opportunity costs for parentparticipation. 5 Costs for the school-age programare based on expenditures for the 1986-87 year(Chicago Public Schools, 1986a, 1986b). Thelargest category for the school-age program wasinstructional staff: teachers and teachers' aidesfor the reduction of class sizes and child-to-staffratios in each class.
The present value of the average cost of thepreschool program was $6,692 per participant.This cost is based on an average length of partic-ipation of 1.5 years. The average cost per childof 1 year of preschool was $4,400. The presentvalue of the average cost of the school-age pro-gram, above and beyond regular instruction,was $2,981 per participant. The cost of 1 yearof school-age participation was $1,580 per child.The present value of the average cost of the ex-tended program (four to six years of participation)was $10,000 per child. The marginal cost of the ex-tended program, above and beyond less extensiveparticipation (one to four years), was $4,057 perchild ($10,000 minus $5,943). The present valueof the average cost of the total program (pre-school + school-age) was $9,673 per child.
Adjustments for inflation using the GDP im-plicit price deflator for state and local govern-ment services instead of the Consumer Price Indexresulted in slightly lower estimates of average
275
School-Age Program

Reynolds, Temple, Robertson, and Mann
costs per participant. We did not include the costsfor the half-day or full-day CPC kindergartenprogram. This is because the comparison groupparticipated in an all-day kindergarten programthat approximated or exceeded the expendituresfor CPC kindergarten (Chicago Board of Educa-tion, 1984). Unlike the CPC program, the kinder-garten programs attended by the comparisongroup were all-day programs; 15% of the com-parison group participated in Head Start pre-school for 1 or 2 years. Inclusion of these costswould have increased the net economic return ofthe CPC program.
Program Benefits
Reductions in expenditures for schoolremedial services
Savings on school remedial services are esti-mated for grade retention and special educationplacement from kindergarten to grade 12. Theconsequence of grade retention is that a studentwill be expected to enroll in school for an addi-tional year. We used the average per pupil annualexpenditure in Chicago for general education asthe estimate for an additional year of school (Illi-nois State Board of Education, 1997). The pres-ent value of an additional year of school at age 19is $4,494 per child.
Expenditures for special education are theweighted average annual cost per pupil reportedby the Chicago Public Schools for four cate-gories: specific learning disability, emotional orbehavioral disturbance, speech and language im-pairment, and mental retardation (Chicago Pub-lic Schools, 1995). In 1998 undiscounted dollars,the estimated average annual cost per child forspecial education services was $7,791 above andbeyond regular instruction. The outcome mea-sure is the average number of years receivingspecial education services, with an annual pres-ent value of $5,971 per child.
Increases in lifetime earnings, compensation,and government tax revenues
Increases in lifetime earnings and compensa-tion for ages 18 to 65 are projected from differ-ences in high school completion between pro-gram and comparison groups. Obtained fromschool records and youth surveys, high schoolcompletion was defined as graduating from aregular high school or earning an equivalentdiploma (e.g., GED) by age 20 as reported in
276
Reynolds et al. (2001). We also investigated anage 21 measure. We used Census and Labor De-partment data from 1999 (Bureau of Census,2000) for Black full-time workers aged 25-29 toproject lifetime earning differences across fourcategories of educational attainment (less thanhigh school, high school completion, some col-lege, and four years of college or more) and bysex. Consistent with other lifetime earning pro-jections (Barnett, 1996), our estimates assume amodest 3% annual discount rate, 2% real incomegrowth rate, and a 20% fringe benefit rate. Thepresent value of after-tax lifetime earnings andcompensation of Blacks who complete highschool or continue on to college would be ex-pected to exceed the earnings of Blacks who donot complete high school by $183,183.6
Greater projected lifetime earnings of programparticipants would lead to a proportional increasein tax revenues to state and federal governments.We applied a 33.3% tax rate to the lifetime earn-ings estimates noted above. This includes a mod-est 15% federal tax, 3% state income tax, and15.3% FICA tax. The estimated present valueof increased tax revenues was projected to be$64,673 per participant.
Reductions in expenditures in the criminaljustice system for youth and adult crime
Savings in the criminal justice system weredetermined based on the effect of the CPC pro-gram on juvenile arrests. Juvenile court recordswere obtained for each study participant throughmanual and computer searches of court recordsin Chicago and two other cities. Our measureof crime was petitions to the juvenile court. Esti-mated criminal justice system expenditures in-cluded the administrative expenditures associatedwith arrest and the weighted national average ofthe proportion of cases that led to residential treat-ment, community treatment or probation services,and release (Bureau of Justice Statistics, 1997;Cohen, 1988). We used a national rate of adjudi-cation for juvenile petitions of 58% (Stahl et al.,1999).7 The highest cost is for residential treat-ment, with an annual expenditure per person of$32,237 in 1998 dollars in the county of residenceof study participants (Illinois Department of Cor-rections, 1999). The annual expenditures for com-munity treatment and probation services are, re-spectively, $17,649 and $7,017 per person. Basedon the mean age of arrest of 14, the present valueof expenditures to the crimninal justice system for

Age 21 Cost-Benefit Analysis of the Title I Chicago Child-Parent Centers
juveniles with court petitions is $13,690 per par-ticipant. Our estimates do not account for the factthat some youth would receive treatment for morethan one year, which would increase the averageexpenditures per participant. This is counterbal-anced to some extent by other youth receivingtreatment for shorter lengths of time.8
Because the strongest predictor of adult crimeis juvenile crime, our estimates for decreases inadult criminal justice system expenditures areprojected from juvenile arrests. Following theprocedures of previous studies (Greenwood,Model, Rydell, & Chiesa, 1998; Karoly et al.,1998), the effect of program participation on thearrest rate at the beginning of adulthood was es-timated to be 80% of the effect observed for ju-venile arrest, with a 10% rate of desistance peryear through age 44. The present value of theaverage cost of an adult criminal career evalu-ated at age 3 was estimated to be $32,973, and in-cludes the costs of arrest, judicial processing, andtreatment.
Reductions in tangible expenditures tocrime victims: youth and adults
Crime victim savings are direct expendituresincurred as a result of delinquent or criminal be-havior exclusive of pain and suffering. To esti-mate the value of these averted expenditures,we used national estimates of the amount andproportion of tangible losses to crime victimsfor violent and property offenses (Barnett, 1996;Karoly et al., 1998; Miller, Cohen, & Wiersema,1996). The present values of tangible expendi-tures per person to victims of juvenile and adultcrimes were, respectively, $14,354 and $34,572.To determine the amount of savings to victimsof juvenile crime, we multiplied the tangibleexpenditures per person by the mean numberofjuvenile arrests for violent and property chargesin our sample (0.236). Projected savings to victimsof adult crime were estimated from the present-value cost of an adult criminal career ($32,973over ages 19-44; Greenwood et al., 1998), basedon a target population crime rate of 30% and anincidence of arrest that is 80% of juvenile arrest.
Reductions in expenditures for the childwelfare system and victimization fromchild abuse and neglect
Our measure of child maltreatment was refer-rals to the juvenile court by the Department of
Child and Family Services or others between the
ages of 4 and 17. These petitions were substanti-ated reports of child abuse and neglect. One thirdof all reports of maltreatment to child welfareagencies are substantiated (U.S. Department ofHealth & Human Services, 1997). About 70% ofsubstantiated cases receive in-home services,while the remaining cases are placed in fostercare (Courtney, 1998). Court referrals are typi-cally the most serious cases of maltreatment inwhich immediate out-of-home placement may beneeded. We estimated that the weighted averageexpenditure per child for child welfare servicesfor a substantiated report of child abuse and ne-glect is $9,492 (1998 dollars; Courtney, 1998;Lamer, Stevenson, & Behrman, 1998).9 Afteradding administrative costs of $1,466 per childfor judicial processing associated with petitionsand assuming the referral occurs at an averageage of 10, the present value of the average costsis $8,910 per child. To the extent that children areplaced in out-of-home care for more than oneyear, these costs are conservative.
Victim costs were the tangible losses associ-ated with child abuse as estimated by the Na-tional Institute of Justice (Miller et al., 1996).They included medical care, mental health care,police/fire services, and lost productivity of vic-tims and their families such as forgone wages,missed school days, and certain legal expenses.The present value of the average costs for childabuse victimization is $5,623 per child.
Child care
Enrollment of children in half-day preschoolfive days per week is a benefit to parents byfreeing time to enhance their personal or careerdevelopment. The present value of time perparticipant was $1,657 per participant in 1998dollars. This was calculated assuming an aver-age of 540 hours (15 hours per week) per yearover 1.5 years of preschool, assuming that thevalue of the parent's time was equal to the min-imum wage of $3.35 per hour in 1986 (adjustedfor inflation).
College tuition
Because higher levels of educational attain-ment increase expenditures for attending college,our analysis also accounted for the cost of col-lege tuition for the public and individuals. Weused the average tuition for two years of atten-dance for three of the most frequently attended
277

Reynolds, Temple, Robertson, and Mann
colleges of Chicago youth: Northern Illinois Uni-versity, Southern Illinois University, and CityColleges of Chicago. Based on a college atten-dance rate of 47% in our sample at age 21, thepresent value to society of costs of college tuitionfor two years was $4,969 per participant. As-suming that taxpayers pay two-thirds of this cost,the costs born by the public and the individual are$3,313 and $1,656, respectively.
Results
Summary of Statistical Analysis
Following previous reports (Reynolds &Temple, 1998; Reynolds et al., 2001), we usedprobit, linear, and negative binomial regressionanalysis to estimate program effects for the cost-benefit analysis. Coefficients were transfonnedto marginal effects in LIMDEP (Greene, 1995).They represent the difference between groups inpercentage points after adjusting for the covari-ates. The amount of benefit was the adjusted dif-ference in the average outcome between pro-gram and comparison groups multiplied by themonetary estimate of the outcome. The effectsof preschool and school-age participation wereestimated jointly. These dichotomous programmeasures were entered simultaneously with thecovariates of sex of child, race/ethnicity, familyrisk status, and program sites represented by 20dummy variables (one for each program site).Program sites measure the influences associatedwith attendance in a particular center. Extendedprogram participation was compared to less ex-tensive program participation rather than no par-ticipation. Kindergarten achievement test scoreswere entered as an additional covariate in esti-mating the effect of extended intervention. Ad-justed group differences were robust across a rangeof model specifications, for different comparisongroups, and were unaffected by attrition.'0
Estimated Program Effects fromKindergarten to Early Adulthood
Table 4 summarizes the adjusted group differ-ences for each level of program participation inthe CPC for school achievement, family support,school remedial services, child maltreatment, ju-venile crime, and educational attainment. The val-ues take into account differences between groupsin sex of child, race/ethnicity, famnily risk index,and program sites (see Appendix C for unadjustedgroup differences). Of the family outcomes inves-
278
tigated, parent involvement in children's schoolhas shown the most consistent effects. Figure 2displays the performance levels of the programgroups forjuvenile arrest, special education place-ment, and high school completion.
Preschool participation
Adjusted for the covariates, participation forone or two years was significantly associated withnearly all child outcomes up to age 21. Preschoolparticipants had greater cognitive skills at kinder-garten entry, higher school achievement leadingto reductions in need for school remedial ser-vices, and ultimately lower rates of delinquencyand higher rates of school completion (see Table 4for other estimates). In percentage points, par-ticipants had an 10-point lower rate of specialeducation placement (41 % reduction), a 15-pointlower rate of grade retention (40% reduction), an8-point lower rate of juvenile arrest (16.9% vs.25.2%, a 33% reduction), and an 1 1-point higherrate of high school completion by age 20 (49.7%vs. 38.5%, a 29% increase). Using the age 21measure, participation was associated with a10.5-point higher rate of high school completion(61.9% vs. 51.4%, a 20% increase). Preschoolparticipants also had more years of completedschooling (11.23 vs. 10.87,p= .013).
By age 17, preschool participants also had a sig-nificantly lower rate of court-reported child mal-treatment than the comparison group (5.0%versus10.3%, a 51% reduction; see also Reynolds &Robertson, in press). Boys benefited from the pro-gram more than girls on the outcomes of kinder-garten achievement and high school completion.With the exception of early school achievementand child maltreatment, two years of preschoolprovided no performance advantages over oneyear for school remedial services, juvenile arrest,or high school completion.
School-age participation
Participation for one to three years was asso-ciated with fewer child and youth outcomes.School-age participation was associated withgreater school achievement at ages 9 and 15, andreduced need for school remedial services by18%. The adjusted rates of special educationplacement were 15.4% and 21.3%, respectively,for the program and comparison groups (a 28%reduction). Respective rates of grade retentionwere 23.8% and 34.3% or a 31% reduction over
(text continues on page 282)

I I 8 oV V V
0'N -0~ 0Cl00 C0q C0 C*0
oo
in o r- s 0in ael~~~~~~~~~I I °° ''
I I o ,: t 0
00 in
v vvv
vo' £0 0 t £o
0n C" c0 I4,t m V')
afi I o>n
\ 000 c40
I -D-0 0N
to
c 0
a)
0~~~~~)
t vo CO Co bo
<<
.4tSthm c'~~~0.
40 II) £0 0\ -4 -4 D
O) 0) 0) 0) °O
co o\0 mc"oc
00 00N
C !
VV
0
N t C) C?
I I
0- 4
-4 00 0 0C")
C9 '
00t _,
~~~~~0
-00 Q
t0
00, 4,00 -
7,
0 40 Cd0
40 3 )400
° o 0)4'
o 4m 0) oo .
|v * 40 o 4 -
0
s-"
0- C6 06o I\oO I i ° ° I °l °0C)~~~~~~~~~~~0
6OC50~~~~4
00 4f) C4
02F 000 of) \ tn C oo
N 00\40 C) 000. - )
Cf ) O
CD C000 0t"00
vo n asC\ Cl
n oo6 oom 6no6-
-~ =) -4 - -f -
-4 C")Cl0 0', e
C" C9 ) C
If) 0000 "'00
C) x xn C> C) ND
C" ") fcI'0l'0
-Cl = C")in 4P4
I O I C")
00 c)0 000 C")Cl 40\
-4 ---4 -4--4
-444)
Ct
40
a)
0)40t0)
1 0=
C.)
a40.
0
4040.
to
>040
00 0 0 >
o0 0 4
40 ., .5. o
0 0 0> Z0.
0 0~4
0)0
004 40>-
4 0 -- ' - 8> 40 0 40 0 ).0 0
C ) 0 0
t4o Xo tobm o Sm 40 C ~ 0 t()., = ,= .Y4 .4 .4 m 40 .4
a)0
8r4l
ti-
C!00
0)
m
00
0
0-400
80L)
400
u
I4
0
0.
0
m
0.4
400
0C.)
0.)4-
40
41-
-40
01)
-204040
40 "z40~0~I:
-16liL)
I
IID
4'
C
279

0
VC
- t ) t CO t C) ( l O c C)O C) 00 cq c CN cq ON 0E cq V)
OC ) O t C) O, e In t.,o . .. ..
6 r6O O O %D ~t cq vDin It XD O O r- O
II
cnC
\- c Cl- ccn Clq
~cC C, in -
s -
cM O~--M O 6cr) I 1 I I
C.oc
N - Cl O,I O6 D6
Cl - -' %xD 0. Cn C9 C)
cs . . . . .-= 14 D 0 0c'0-lgc- in
Clt Nt aWo0 a0o o od6oE
o It in 0o o r- r- 00 0000 00 rNNN- N- '.O \.0'.0\ 00 00 00 C\0'0\ 0 0C0 C
00
o -
CZ)906
> <oo
0 0
OCa z
3 0) C a 0) CO Z Z
v 0)
-0
0)
90
I V
0
0)
-00
0 )
0.
C)Ca-
I 0
.0
O-
0
0uz
0)
000
CC-0
.0 d )
= .0 CC-C
Ca -,C-0 0.0~> Po : z
z c)))
0
Cm 0n\ 00
0Cl Cl
cl C.)D .CD c. 00cO
0 0C.o c
CO.
>, 0 o0C
o o
;-) 0)
3 e E~~~~4
)< CaC)
.9 0
C)
CC; )
w
.00
.0 C o 0
CC ;t o Z.
)< u ) O
C) C ) I1,, c
CC .0)c....
C) <O
OC,=aDZ
>C 0 , 0 o
C) C) B Ca
*0 S o
t CS mO n
) 0 )c. ..
cn on CrO" It in
'Et r-:rD
00 CCC cn01~-t "
91
2
r.
015
000
a)
;i
0
00
0~00
0
0
CD
2.W0
0)
'0S
r.
9~
00
0aa
-C CaE
4 .,0ca
- .5 9 9aao '0 cO
C- ri 0 °
0zS
0 1 00
0S¢
;:GZs
0E
U
280

40-
35- /
30- /
2.519.2 20.12~~~~~~~2a0 2- 19.8 19.8 19.2 2z
16 20- / 16.9 .j
XL t5- i >= .,D ,
Preschool Comparison School-Age Comparison Extended Less ExtensiveParticipation Group Participation Group Participation
FIGURE 2a. Adjusted rates of child well-being for three program comparisons: Juvenile arrest by age 18.
40-/
35- /
30- //
24.6
tD25- / // 21t3 20.7
a)
06 20 - /.1 5A -.4{ ...35srx 13x5
14.4
fe 15 21. 20.7
Preschool Comparison School-Age Comparison Extended Less ExtensiveParticipation Group Participation Group Participation
FIGURE 2b. Adjusted rates of child well-beingfor three program comparisons: Special education by age 18.
281
7
�R�_,,
4A
t
,;Z,-
P�
L�

Reynolds, Temple, Robertson, and Mann
90- /
Preschool ComparisonParticipation Group
School-Age ComparisonParticipation Group
Extended Less ExtensiveParticipation
FIGURE 2c. Adjusted rates of child well-beingfor three program comparisons: High school completion by age 21.
the comparison group. No group differences thatwere statistically significant were found forjuve-nile arrest, high school completion, highest gradecompleted, or child maltreatment, although thepattern favored program participants.
Extended program participation
Relative to participation for one to four yearsand controlling for the covariates, program partic-ipation for four to six years beginning in preschoolwas associated with significantly higher levels ofearly and later school achievement, less need forschool remedial services such as special educa-tion (13.5% vs. 20.7%, a 35% reduction), andlower rates of child maltreatment (3.6% versus6.9%, a 33% reduction). Program participationwas marginally associated with a lower rate ofarrest for violent offenses (9.3% vs. 12.4% or a25% reduction). Although extended programparticipation was associated with a slightly higherrate of high school completion at age 20, it wasnot statistically significant. Because the com-parison group participated in the program andkindergarten achievement was included as a co-variate, these findings reflect the added value ofextensive participation above and beyond less
282
extensive participation. As shown in AppendixC, participation in extended intervention was sig-nificantly associated with higher rates of schoolcompletion, which is suggestive of positive bene-fits of the total program from preschool to secondor third grade.
Cost-Benefit Estimates
Table S and Figure 3 show the present value ofcosts and benefits in 1998 dollars evaluated atage 3 for the three components of the CPC pro-gram. The economic benefits were estimated fromthe adjusted group differences in Table 4. For ex-ample, while the effects of preschool participa-tion led to similar reductions in special educationand juvenile arrest, savings to the governmentwere greater for reducing juvenile arrest becausethe expenditures for providing criminal justiceservices are higher. We summarize the presentvalue and net present value of the benefits bylevel of program participation. (Appendix B pro-vides the calculations of benefits and costs; alsosee Temple & Reynolds, 2002). Benefits areeither measured by age 21 or projected throughadulthood on the basis of measured variables, andthese are distinguished in Table 5 and Figure 3.
.2.2E
cno 4
0
a)CL
1
70- / 61.9 58.3 58.3 59.4 57.2
30 ,Mffi
_ | r-= C_51I4 ,.'D0>. $2d-io-' ,.,'',i.'.
O . j . ::. .. '.z:
-
80- /
2

TABLE 5Estimated Benefits and Costs of the Child-Parent Center Preschool, School-Age, and Extended Programs
Per Participant (Present Value in 1998 Dollars Discounted at 3%)
Benefit or Cost For Participant Only For Taxpayers/Crime Victims
Preschool ProgramMeasured effect
Child careGrade retentionSpecial educationChild welfare savingsAbuse/neglect victim savingsJuvenile justice savingsJuvenile crime victim savings
Total measured
Projected effectEarnings/compensationTaxes on eamingsCollege tuitionAdult justice savingsAdult crime victim savings
Total projected
Total measured/projected
Cost of preschool program
Net present value
Measured effectChild careGrade retentionSpecial educationChild welfare savingsAbuse/neglect victim savingsJuvenile justice savingsJuvenile crime victim savings
Total measured
Projected effectEarnings/compensationTaxes on earningsCollege tuitionAdult justice savingsAdult crime victim savings
Total projected
Total measured/projected
Cost of school-age program
Net present value
School-Age Program
00000000
7320
-700
725
725
0
25
Measured effectChild careGrade retentionSpecial educationChild welfare savingsAbuse/neglect victim savingsJuvenile justice savingsJuvenile crime victim savings
Total measured
Extended Program
1,646000000
1,646
0467
4,001294186
1,9172,3689,233
1,646467
4,001294186
1,9172,368
10,879
(continued on next page)
283
Total Society
1,657692
4,180472298
4,5183,388
15,205
1,657000000
1,657
20,5170
-18600
20,331
21,988
0
21,988
$0692
4,180472298
4,5183,388
13,548
0
7,243-3712,6122,739
12,223
25,771-6,692
19,079
20,5177,243-5572,6122,739
32,554
47,759
-6,692
41,067
0
4722,866
125790
2733,815
0
4722,866
125790
2733,815
0259-13
0158404
4,219
-2,981
1,238
732259-20
0158
1,129
$4,944
-2,981
1,963
-

Reynolds, Temple, Robertson, and Mann
TABLE 5 (Continued)
Benefit or Cost For Participant Only For Taxpayers/Crime Victims Total SocietyProjected effect
Earnings/compensation 8,610 0 8,610Taxes on earnings 0 3,040 3,040College tuition -78 -156 -234Adultjustice savings 0 1,108 1,108Adult crime victim savings 0 1,369 1,369
Total projected 8,532 5,361 13,893Total measured/projected 10,178 14,594 24,772Cost of extended program 0 -4,057 -4,057Netpresentvalue 10,178 4,537 20,715
Preschool participation
Overall, the preschool program generated areturn to society of $47,759 per participant byage 21. Total benefits to the general public (tax-payers and crime victims) were $25,771 per par-ticipant. These economic benefits substantiallyexceeded the average cost of the program perparticipant of $6,692. The largest benefit wasprogram participants' increased earnings ca-pacity projected from higher educational attain-ment.11 The largest categories of public benefits,which excluded individual earnings, were in-creased taxes on earnings projected from educa-tional attainment ($7,243 or 28%) and savings tothe criminal justice system in adolescence andadulthood due to lower rates of arrest ($7,130 or28%). Reductions in expenditures for school re-
medial services ($4,652 or 18%) and savings ontangible costs to crime victims ($6,127 or 24%)also provided significant benefits to the public.Considered alone, each of these benefits exceededthe cost of one year of preschool ($4,400). Child-care benefits and savings in the child welfaresystem associated with lower maltreatment alsocontributed to economic returns.
As shown in Figure 4a, benefits to program par-ticipants accounted for 46% of the total societalbenefit, government savings for 41 %, and crime-victim savings for 13%. The preschool programprovided savings to the government of $19,346.The largest share of government savings, exclu-sive of crime-victims savings, was in reducedcosts to the juvenile and adult criminal justicesystem (43%). Other government savings included
I ~ -' - -________________
Childcare
buse and neglect
Crime victims
Justice system
College tuitio4
axes on eamings
Lifetime eamings
Grade retention
Special education
-$6,692 -, -F7 , I,I-$10,000 -$5,000
$1,657
t $770
-; ', : : , . $6,127
l, '= e`^$7,130^, I .I w ,I
-$557 v
i: : ^ " ^d , ̂̂ I ^, I $7,243
] $692
$4,180
.. I , _ , , , =... _ _
. - r `. _,", ' 7' ]'^ 57lrI , , , ' - -
I l l
$20,000 $25,000
FIGURE 3a. Estimated benefits and costs for three measures of CPCprogram participation: Preschool participation.
284
.0
o
0C
coa
0aa
0Ce
$° $$5,oo $10,000 $15,000
Present Value in Thousands (1998 $ Discounted at 3 %)
-I
I

Age 21 Cost-Benefit Analysis of the Title I Chicago Child-Parent Centers
Childcare
Abuse and neglect
Crime victims
Justice system
College tuition
Taxes on earnings
Lifetime eamings
Grade retention
Special education
I Irograrn
T I I
$0
] $204
Z $431
$0
-$20
$259
$732
$472
I .1 .1I .,I $2 $2,866
l E l l-$2,000 $0 $2,000
Present Value in Thousands (1998 $ Discounted at 3 %/6)
$4,000
Estimated benefits and costs for three measures of CPC program participation: School-age
increased tax revenues, reduced school services,and reduced expenditures in the child welfaresystem.
We also estimated the present value of bene-fits in 1998 dollars for two subgroups of pro-gram participants. One and two years of pre-school provided similar amounts of benefits tosociety ($51,350 and $43,820) and to the public
Childcare
Abuse and neglect
Crme victims
Justice system
College tuition[
Taxes on eamings
Lifetime eamings
Grade retention
Special education
| ,, f;, , \ ', XPxnrm~~~~~~~~~~
($27,247 and $26,261), respectively. This find-ing suggests a diminishing return of the secondyear over the first year, and is consistent withstudies of Perry preschool (Schweinhart et al.,1993) and a previous report, in which the sec-ond year of preschool provided a significant boostin kindergarten test scores but declined there-after (Reynolds, 1995). Respective societal and
$1,646
$480
' :$3.73
$3,025
-$234
$3,040
] $467
I9 Is I 0 1 $8,61(
-$10,000 -$5,000 $0 $5,000 $10,000 $150uuU
Present Value in Thousands (1998 $ Discounted at 3 %/6)
FIGURE 3c. Benefits and costs for three measures of CPCprogram participation: Extended participation relative
to less extensive participation.
285
a00
0
0'a)
M
CD)
0a)
-$6,000
FIGURE 3b.participation.
-$2,981 ' .
-$4,000 $6,000
0v
0amCu
U)
-$4,057
$4,+

Reynolds, Temple, Robertson, and Mann
13%
E3Program Participants
IGovemment Savings
r Crime Victims
FIGURE 4a. Sources of societal savings for CPCparticipation: CPC preschool participation.
public benefits of preschool participation forboys ($60,635 and $34,835) substantially ex-ceeded those of girls ($31,238 and $16,402).This was primarily due to findings that boysexperienced a greater program effect on highschool completion and, to a lesser extent, specialeducation placement.
School-age participation
The present value of benefits for the school-age program was substantially lower than forthe preschool program (see Table 5). This wasbecause school-age participation was not asso-ciated with juvenile arrest and high school com-pletion. The school-age program provided a soci-etal return of $4,944 per participant. Given adiscounted cost of $2.981, benefits modestlyexceeded the investment in the program. Theprimary benefit was lower expenditures for spe-cial education services. This savings plus thosedue to grade retention ($3,338) exceed the cost ofthe school-age program. Savings to juvenile andadult crime victims also were notable. Benefits tothe public (taxpayers and crime victims) exceededcosts as well. Indeed, nearly all the benefits of theschool-age program were public benefits.
In contrast to preschool, length of school-ageintervention was positively associated with eco-nomic benefits. The societal and public benefits of
15%
.ststI 4 1%
L 'J
a Program Participants
SGovemment Savings
r Crime Victims
FIGURE 4b. Sources of societal savings for CPCparticipation: CPC extended participation.
286
two or three years of school-age intervention ex-ceeded those of 1 year by, respectively, $17,516and $9,167. Moreover, girls experienced substan-tially greater economic benefits than boys fromschool-age participation.
Extended program participation
Relative to participation for one to four years,participation in the program for four to six years(preschool to second or third grade) also was as-sociated with economic benefits that exceededcosts (see Table 5 and Figure 4b). Overall, ex-tended program participants typically had thehighest levels of performance in the study. Thepresent value of benefits to society at large was$24,772 per participant. Given a net average costper child of $4,057, the extended interventionprogram provided a substantial return to societyat large. The greatest benefit to individual partic-ipants was increased earnings capacity due toeducational attainment. Benefits to the generalpublic were substantial at $14,594 per partici-pant. The largest category of public benefits wasreduced need for school remedial services, mostspecial education ($4,468 or 31%). Combinedcriminal justice system savings ($3,025 or 21 %)and averted tangible crime-victim expenditures($3,737 or 26%) also contributed relatively largeshares. Measured effects for grade retention andchild welfare system and victimization expendi-tures were relatively small.
As with preschool, boys benefited more thangirls from the extended program. The presentvalues of societal and public benefits for boyswere, respectively, $34,064 and $22,253, com-pared with benefits for girls of $13,131 and $3,861.Moreover, the public benefits of five or six yearsof participation were about double those of fouryears ($21,093 vs. $10,245).
Benefit-to-Cost Ratios
Figure 5 provides a summary of the CPC pro-gram's monetary return to society as a ratio ofbenefits to costs. The total benefit to society waslargest for the preschool program. Every dollarinvested in preschool retumed $7.14 in educa-tional, social welfare, and socioeconomic bene-fits. The total public benefit was $3.85 per dollarinvested. These are substantial levels of cost-effectiveness. The societal benefit-to-cost ratiofor one year of preschool was more than twicethat of two years ($12.02 vs. $5.05 per dollar

1(
v0
g
0
0
Z~
0
aG)
0
0C
00a)3v:
v
IL
Preschool School-Age Extended
FIGURE 5. Benefit-to-cost ratios for three measures of CPC program participation.
invested). Likewise, preschool boys experienceda larger societal benefit-to-cost ratio than programgirls did ($9.06 vs. $4.67 per dollar invested).
Although having lower benefit-to-cost ratiosthan the preschool program, the school-age andextended intervention programs provided retumsthat exceeded costs. Their respective benefit-to-cost ratios of $1.66 and $6.11 to society at largeand $1.42 and $3.60 to the general public showthey can contribute positively to educational re-forms. Values for the extended intervention pro-gram were close to those for the preschool pro-gram. The societal benefit-to-cost ratio for theschool-age program was higher for girls than forboys ($3.81 vs. $1.15), while boys experiencedproportionally greater benefits than girls fromextended intervention ($8.37 vs. $3.23). The so-
cietal benefit-to-cost ratio for five or six years ofthe extended program was nearly twice that offour years of participation ($5.61 vs. $2.92). Al-though providing less comprehensive servicesthan the preschool program, the main attributesof the school-age program-lower class sizesand instructional coordination in the early schoolgrades-can be implemented in a straightforwardmanner without major changes in existing pro-grams and services.
Sensitivity Analysis
Because benefit estimates vary as a function ofthe discount rate, we estimated program benefitsusing discount rates from 0-7%. As shown inFigure 6a, economic benefits of preschool partic-ipation to society and the general public including
287

Reynolds, Temple, Robertson, and Mann
0 1 2 3 4 5 6 7
Discount Rate
FIGURE 6a. Sensitivity analysis for estimated total and general public benefits and cost for three programmeasures: preschool program.
govermnent exceeded program costs even underthe highest discount rates of 5% to 7%. Findingsbased on a 5% annual discount rate, for example,yielded a benefit-to-cost ratio to society of about$5 per dollar invested and to the general public of
10500
S0
CO
0
I:L
CO
0.5CD0
co0)a.
about $3 per dollar invested. The economnic ben-efits of extended program participation also wererobust to annual discount rates of up to 7% (seeFigure 6c). The benefits of school-age partici-pation were less robust to alternative discount
0 1 2 3 4 5 6 7
Discount Rate
FIGURE 6b. Sensitivity analysis for estimated total and general public benefits and cost for three programmeasures: school-age program.
288

s 45000-U
0._36000- . - - - Total Benefits.
G, " - General Public
CU " ^Extended Cost(027000 - .
0.
9'1000-
,-~~~~~~~~~~~~~~~~~~~~~~
0 1 2 3 4 5 6 7
Discount Rate
FIGURE 6c. Sensitivity analysis for estimated total and general public benefits and cost for three program
measures: extended program.
rates, but returns to society exceeded costs formost of the discount rates. (see Figure 6b)
Alternative procedures for estimating lifetimeearnings and compensation, such as the use ofdifferent age cohorts (e.g., 1998) and earningsmeasures (e.g., any work experience versus full-time workers only) yielded findings that werequalitatively similar to those reported. 12 Similarpatterns of findings were found with alternativeestimates of savings to the criminal justice system.
Our findings on savings to crime victims maybe conservative since only tangible savings weremeasured, such as property losses, hospitaliza-tion, and lost productivity. The inclusion of in-tangible costs to crime victims due to pain andsuffering, and to risk of death may be justified.Such costs were included in economic analysesof the High/Scope Perry Preschool Program (Bar-nett, 1996; Schweinhart et al., 1993). Because in-tangible costs to crime victims (e.g., pain andsuffering, risk of death) have been estimated tobe about three times tangible costs (Karoly et al.,1998; Miller et al., 1996), the inclusion of avertedintangible costs associated withjuvenile and adultcrime would have added, in present-value 1998
dollars, savings of $20,178 per participant for
preschool, $1,379 for school-age intervention,and $11,958 per participant for extended inter-vention. These added savings increase the publicbenefit-cost ratios to $6.87 per dollar investedfor preschool, $1.88 per dollar invested forschool-age intervention, and $6.54 per dollarinvested for extended intervention. The societalbenefit-cost ratios were, $10.15, $2.12, and $9.05,respectively.
Discussion
As the first cost-benefit analysis of a federallyfinanced early childhood intervention, our find-ings indicate that all levels of participation in theChicago Child-Parent Centers were associatedwith economic benefits that exceeded costs. Thepreschool program, the most intensive and com-prehensive component, yielded the greatest ben-efits by age 21. For every dollar invested in thepreschool program, about $4 were returned to thegeneral public through government savings onschool remedial services, criminal justice systemand child welfare system costs, and averted crime-victim expenditures. About $7 were returned tosociety at large for each dollar invested throughincreased economic well-being and reduced pub-
289

Reynolds, Temple, Robertson, and Mann
lie expenditures on educational and social welfareservices.
The largest share of benefits was attributableto the link between preschool participation andhigher rates of school completion and lower ratesof juvenile arrest, which in turn led to greaterprojected economic and social benefits over thelife course. Boys and one-year preschool partic-ipants experienced proportionally the greatestamount of economic benefits from preschool.School-age and extended programs also redeemedtheir costs and provided positive benefits to soci-ety and the general public. Boys and five- to six-year participants benefited most from extendedintervention.
Contributions to Knowledge
Findings contribute substantially to knowl-edge about the benefits of early childhood pro-grams for low-income children. They indicatethat large-scale contemporary programs imple-mented by school districts can lead to major ben-efits that improve children's well-being and laterquality of life. By providing comprehensive andintensive services to children and families overseveral years, the CPC program appears to re-duce the likelihood of later scholastic and socialdifficulties and to enhance well-being. The majorcontribution of preschool participation to lateroutcomes is consistent with many previous studies(Barnett, 1995; Karoly et al., 1998). The observedlinks with educational attainment and crime pre-vention are especially significant given that schooldropout and crime are general risk factors forseveral leading health indicators described bythe Surgeon General in the Healthy People 2010Initiative (U.S. Department of Health and HumanServices, 2001), including substance abuse, men-tal illness, and injury and violence. Low educa-tional attainment also is associated with lowerrates of health insurance coverage and reducedaccess to quality health care. Thus, higher educa-tional attainment promotes greater use of pre-ventive health services and lowers the risk of dis-ease (Shea et al., 1991; Wolfe, 1995). Becausethe study sample is almost all African American,early childhood interventions like the Child-ParentCenters also may help reduce racial disparitiesin health outcomes and service utilization.
Although preschool participation beginningat age 3 showed the greatest benefits relative tocosts, findings demonstrate that public programs
290
which provide a broad array of educational andfamily support services in the first decade of lifecan make a substantial difference in the lives ofchildren nearly two decades later. These effectshave measurable economic benefits. Moreover,the evidence of long-term beneficial effects forearly childhood interventions like the ChicagoChild-Parent Centers is substantially greater thanfor other types of programs (Currie, 2001; Durlak& Wells, 1997; Reynolds, 2000). Recent studiesof Head Start cohorts into early adulthood (Garces,Currie, & Thomas, 2000; Oden, Schweinhart,Weikart, Marcus, & Xie, 2000) are suggestiveof positive benefits of other large-scale programs.
Our cost-benefit findings are similar to thosereported in studies of the High/Scope Perry Pre-school Program (Bamett, 1996; Schweinhartetal.,1993). Assessing preschool education programslocated in public schools, the High/Scope Perryand CPC studies show that total benefits exceedcosts by a factor of 7 or higher despite differencesin time frame, location, social context, and cur-riculum. Regarding curriculum, Perry empha-sized child-initiated activities while CPC empha-sized teacher-directed activities but both providedfamily services and employed teachers with atleast bachelor's degrees and certification in earlychildhood. While the cost of CPC program perparticipant is substantially lower, Perry achieveda net economic return (benefits minus costs) of$95,446 per participant (Barnett, 1996) comparedto $61,245 per participant for the CPC program.These values include intangible crime-victim sav-ings but are based on different assumptions andages of assessment.
Both programs found that the return on in-vestment is higher for one-year participants, butfemales experienced greater benefits in Perrywhereas in the CPC program males experiencedgreater benefits. This difference could be due tothe high-poverty context of the CPC program inwhich African American boys are at much higherrisk of school failure than girls (Wilson, 1996).Program participation appears to moderate thishigher level of risk. The finding that boys expe-rience a greater early achievement advantage fromparticipation than girls is consistent with thisinterpretation (Reynolds, 2000). This suggeststhat early interventions can be especially protec-tive for boys in settings of highest risk.
Study findings also compare favorably to thosereported in studies of the Prenatal/Early Infancy

Age 21 Cost-Benefit Analysis of the Title I Chicago Child-Parent Centers
Project (Karoly et al., 1998; Olds et al., 1997)
and federally funded WIC program (Avruch &
Cackley, 1995). Our finding of about $3 of gov-ernment saving for every dollar invested in
preschool, for example, is in the middle of the
range of $2 to $4 reported for the other programs.The CPC program differs from these programs in
several respects, however. Like Head Start, the
Child-Parent Centers provide comprehensiveservices, including intensive famnily support ac-
tivities, health and social services, and center-
based preschool education. The other programstargeted parenting skills, preventive health ser-
vices, and nutrition education up to age 3 with
less emphasis on family social services and
children's education. As a nurse home-visitationprogram, the Early Infancy Project has predom-
inantly shown effects on family economic and
socialization outcomes (Olds et al., 1997). The
main economic benefits of WIC are reduced
hospital costs to public and private payers due to
lower rates of low birth weight. These benefits
do not extend to the educational and social out-comes found in comprehensive early childhoodprograms. In contrast to model programs, the
Child-Parent Centers also are established, feder-ally financed programs in different sites within
existing educational and social agencies. Com-
pared with other programs, the generalizabilityof findings from the school-based CPC programto contemporary programs is high.
Understanding the Impact of School-Age andExtended Intervention
Although the economic benefits of the school-
age and extended intervention components were
lower than those of the preschool component,they indicate an efficient use of services. The
school-age program from first to third grades,through smaller class sizes and enriched instruc-tion, reduced the need for later remedial educationand provided a continuum of intervention services
necessary to support the successful adjustmentof children at risk (see Table 4; Reynolds et al.,
2001). The benefits of the extended interventionprogram exceeded costs by a factor of 6 and sup-
port the added value of continuing participationinto the early grades. Indeed, children who par-
ticipated in the program for 5 or 6 years had the
highest levels of educational attainment and
lowest rates of school remedial services and ar-
rest. The benefits of extended intervention alsowere largest for participants enrolling for five orsix years.
Why didn't the school-age program alone yieldgreater economic benefits? Designed to help pro-mote a smooth transition to elementary school,the school-age program provided fewer and lessintensive services than the preschool program.The program coordinator in elementary schoolalso runs the parent program, and the major com-ponent is reduced class sizes. Auxiliary servicesare shared with other students in the school. More-over, the criterion for demonstrating the effec-tiveness of school-age and extended interventionwas high because the comparison group was en-rolled in school full time and could have up tofour years of program participation.
Finally, the combined and possibly synergisticeffect of preschool and school-age interventionwas not tested because kindergarten achievement,an outcome of preschool participation, was in-cluded as a covariate in the model to estimatethe effects of extended intervention. Differencesbetween participants in extended interventionand the comparison group were larger withoutkindergarten achievement in the model, whichmay provide a better indication of the impact ofthe total program (see Appendix C). As reportedin previous studies (Reynolds, 2000; Reynolds& Temple, 1998; Reynolds et al., 2001) and inothers (Campbell &Ramey, 1995; Rhine, 1981),extended intervention significantly contributesto children's school success. A major benefit isthat the CPC program provides a single system ofearly education from ages 3 to 9 that can enhancewell-being (Zigler & Styfco, 1993).
Sources of Effects of Early Intervention
Why do investments in early childhood educa-tion lead to positive outcomes of such economicsignificance? Unlike most other intervention pro-grams, the Child-Parent Centers provide compre-hensive and intensive services to families overextended periods of time. Structured literacy andparent involvement activities are especially sig-nificant. High quality may be attributable to thefact that as public school teachers, staffs are rela-tively well-paid, have at least bachelor's degreeswith certification in early childhood education,and participate in ongoing professional develop-ment activities. Implementation by professionalstaffs who are well compensated and have college
291

Reynolds, Temple, Robertson, and Mann
degrees is key to the success of the High/ScopePerry Preschool (Schweinhart et al., 1993) andthe Prenatal/Early Infancy Project (Olds et al.,1997). Whereas the Perry Preschool model has aninstructional philosophy of child-initiated activi-ties, the CPCs emphasize teacher-directed activi-ties organized around reading and math readinessskills. As findings clearly indicate, both instruc-tional approaches can be effective. What appearsto be key is program quality and attention to all ofchildren's learning needs.
Within this structure, three generative mech-anisms integral to the CPC program theory havebeen identified to account for long-term effects(Reynolds, 2000; Reynolds, Ou, & Topitzes,2002). The first is the cognitive and literacy ad-vantage that promotes school readiness amongprogram participants. This initial cognitive ad-vantage enhances early school performance, cul-minating in reduced need for remedial educa-tion, higher educational attainment and lowerrates of arrest. Other studies support this explana-tion (Consortium for Longitudinal Studies, 1983;Ramey et al., 2000; Schweinhart et al., 1993). Thesecond mechanism that helps explain the long-term effects of intervention is family support be-havior. Because program participation has beenfound to enhance parental involvement in chil-dren's education, this greater level of involve-ment continues after the end of the program andcontributes to the maintenance of learning gains.This involvement also may promote the formationof family-school partnerships and reduce socialisolation (Comer, 1980; Reynolds & Robertson,in press). The third mechanism of interventioneffects supported by previous research in the studyis postprogram school support. Relative to thecomparison group, children who participate inthe CPC program are more likely to attend ele-mentary schools of higher quality and are lesslikely to change schools. These later school expe-riences are directly associated with educationalattainment and delinquency prevention (Reynolds,Chang, & Temple, 1998). Enhancing the qualityof the school environment is a major goal of ex-tended early childhood programs (Currie, 2001;Currie & Thomas, 2000; Zigler & Styfco, 1993).Family and school support factors are independentof the early cognitive advantages experiencedby program participants. These three generativemechanisms also influence each other to providelong-term benefits (Reynolds & Robertson, inpress). Future investigations may reveal related
292
mechanisms that account for the effects of thisprogram and others.
Limitations and Qualifications
Study findings should be interpreted within thecontext of three qualifications. First, our esti-mates of increased eamings capacity over the lifecourse and cost savings in the adult criminal jus-tice system and for crime victims were based onprojected rather than measured effects. It is pos-sible that benefit estimates could be altered dur-ing the adult life course in either direction. Futureeconomic and social conditions are difficult topredict with confidence and could affect the as-sumptions underlying the analysis concerningproductivity and discounting. Reductions in mar-ginal tax rates, for example, would reduce ourestimates of tax revenues. Increased economicproductivity would likely increase estimates ofindividuals' earnings. Nevertheless, the projectedbenefits are based on educational attainment andjuvenile crime at the beginning of adulthood, thestrongest respective predictors of later economicwell-being and criminal behavior (Haveman &Wolfe, 1994; Sampson & Laub, 1993). In addi-tion, our findings are likely to be robust becauseestimated benefits were spread across severaloutcomes and did not depend on any single mea-sure. The robustness of our findings is furthersupported by cost-benefit analysis of the High/Scope Perry Preschool Program, in which esti-mated benefits increased from age 19 to age 27follow-up assessments (Bamett, 1993, 1996).
The second qualification is that the benefits ofseveral outcomes of the program were not mea-sured. The relationship between educational at-tainment and nonlabor-market benefits (Have-man & Wolfe, 1994; Wolfe, 1995) suggests thatprogram effects on children's education mayhave a positive influence on health status and fu-ture farnily health status, fertility choices, and theamount of schooling obtained by one's children.Reductions in the need for participation in wel-fare programs also are possible, and we madeno attempt to estimate their economic benefits.Moreover, because the CPC program providescomprehensive services that extend beyond thechildren served, changes in parents' own educa-tion and employment may occur and should beexplored in future studies. The demonstrated linkbetween educational attaiDment and health statusalso may lead to lower disease risks that often go
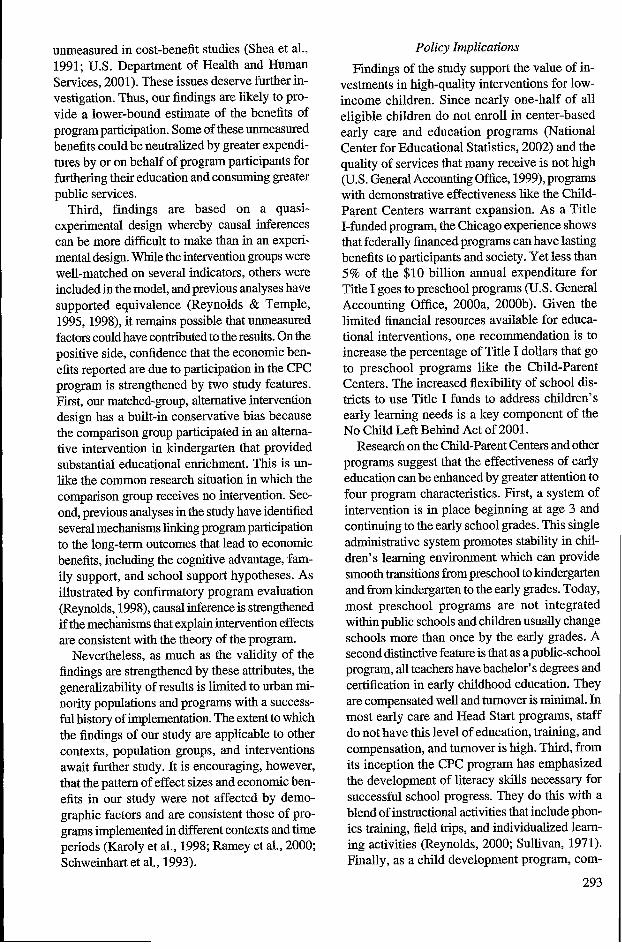
unmeasured in cost-benefit studies (Shea et al.,1991; U.S. Department of Health and HumanServices, 2001). These issues deserve further in-vestigation. Thus, our findings are likely to pro-vide a lower-bound estimate of the benefits ofprogram participation. Some of these unmeasuredbenefits could be neutralized by greater expendi-tures by or on behalf of program participants forfurthering their education and consuming greaterpublic services.
Third, findings are based on a quasi-experimental design whereby causal inferencescan be more difficult to make than in an experi-mental design. While the intervention groups werewell-matched on several indicators, others wereincluded in the model, and previous analyses havesupported equivalence (Reynolds & Temple,1995, 1998), it remains possible that unmeasuredfactors could have contributed to the results. On thepositive side, confidence that the economic ben-efits reported are due to participation in the CPCprogram is strengthened by two study features.First, our matched-group, alternative interventiondesign has a built-in conservative bias becausethe comparison group participated in an alterna-tive intervention in kindergarten that providedsubstantial educational enrichment. This is un-like the common research situation in which thecomparison group receives no intervention. Sec-ond, previous analyses in the study have identifiedseveral mechanisms linking program participationto the long-term outcomes that lead to economicbenefits, including the cognitive advantage, fam-ily support, and school support hypotheses. Asillustrated by confirmatory program evaluation(Reynolds, 1998), causal inference is strengthenedif the mechanisms that explain intervention effectsare consistent with the theory of the program.
Nevertheless, as much as the validity of thefindings are strengthened by these attributes, thegeneralizability of results is limited to urban mi-nority populations and programs with a success-ful history of implementation. The extent to whichthe findings of our study are applicable to othercontexts, population groups, and interventionsawait further study. It is encouraging, however,that the pattern of effect sizes and economic ben-efits in our study were not affected by demo-graphic factors and are consistent those of pro-grams implemented in different contexts and timeperiods (Karoly et al., 1998; Ramey et al., 2000;Schweinhart et al., 1993).
Policy Implications
Findings of the study support the value of in-vestments in high-quality interventions for low-income children. Since nearly one-half of alleligible children do not enroll in center-basedearly care and education programs (NationalCenter for Educational Statistics, 2002) and thequality of services that many receive is not high(U.S. General Accounting Office, 1999), programswith demonstrative effectiveness like the Child-Parent Centers warrant expansion. As a TitleI-funded program, the Chicago experience showsthat federally financed programs can have lastingbenefits to participants and society. Yet less than5% of the $10 billion annual expenditure forTitle I goes to preschool programs (U.S. GeneralAccounting Office, 2000a, 2000b). Given thelimited financial resources available for educa-tional interventions, one recommendation is toincrease the percentage of Title I dollars that goto preschool programs like the Child-ParentCenters. The increased flexibility of school dis-tricts to use Title I funds to address children'searly learning needs is a key component of theNo Child Left Behind Act of 2001.
Research on the Child-Parent Centers and otherprograms suggest that the effectiveness of earlyeducation can be enhanced by greater attention tofour program characteristics. First, a system ofintervention is in place beginning at age 3 andcontinuing to the early school grades. This singleadministrative system promotes stability in chil-dren's learning environment which can providesmooth transitions from preschool to kindergartenand from kindergarten to the early grades. Today,most preschool programs are not integratedwithin public schools and children usually changeschools more than once by the early grades. Asecond distinctive feature is that as a public-schoolprogram, all teachers have bachelor's degrees andcertification in early childhood education. Theyare compensated well and turnover is minimal. Inmost early care and Head Start programs, staffdo not have this level of education, training, andcompensation, and turnover is high. Third, fromits inception the CPC program has emphasizedthe development of literacy skills necessary forsuccessful school progress. They do this with ablend of instructional activities that include phon-ics training, field trips, and individualized leam-ing activities (Reynolds, 2000; Sullivan, 1971).Finally, as a child development program, com-
293

Reynolds, Temple, Robertson, and Mann
prehensive family services provide many op-portunities for positive learning experiences inschool and at home (Comer, 1980; Zigler &Styfco, 1993). Because each center has a staffedparent resource room, parental involvement ismore intensive than in other programs (Miedel &Reynolds, 1999). Thus, the centers show that lit-eracy education and comprehensive services canbe integrated successfully. An impediment to ex-pansion is that the program requires more physi-cal space and financial resources for staffing.
In conclusion, findings of the cost-benefit analy-sis show that a comprehensive child-developmentintervention has substantial long-term benefits tosociety through increased economic well-beingand reduced expenditures for remediation andtreatment. Unlike many social programs, theChicago Child-Parent Centers provide benefitsto society that far exceed costs and are routinelyfinanced by and implemented in public schools.Other educational interventions do not show thislevel of cost effectiveness. As states and locali-ties increase access to early childhood care andeducation programs, public schools appear to bea location of choice for these initiatives. Thefindings of this study show the long-term payoffsthat public programs can provide.
Notes
I Some children in the comparison group enrolled inseparate classrooms in the centers and did not receivethe breadth and intensity of services reserved for otherchildren. Estimates of effects were unchanged whenthese 176 children were excluded. Similarly, exclusionfrom the comparison group of the 85 children withHead Start experience did not alter program estimates.This exclusion would have weakened the conceptual-ization of the program contrast of the effects of CPCintervention versus "treatment as usual" for childrenin high poverty settings. Indeed, Head Start childrenare the closest match to CPC in economic disadvan-tage. They were not a representative sample of HeadStart participants, however.
2 Sample recovery rates of the program and com-parison groups were, respectively, 92.1% and 89.6%for juvenile arrest, 86.8% and 82.9% for age 21 highschool completion, 84.6% and 80.7% for age 20 highschool completion, and 92.3% and 90% for childmaltreatment.
3 These comparisons are based the 1,286 childrenwith available data for school remedial services at age20. Comparisons using the available sample for otheroutcomes were nearly identical.
294
Instructional staff had the largest share of costs.In 1986, the average teacher salary was $29,787 peryear over 10.25 months. This translates to an averagesalary of $44,299 per year in 1998 dollars. The fringebenefit rate was 19.1%. Head teachers earned highersalaries.
5 This time cost was based on 10 hours of participa-tion per month at the minimum wage of $3.35 per hour.
6 Before applying the 3% annual discount rate, theprojected lifetime earnings/compensation of highschool completers would exceed noncompleters by anaverage of $285,393. This much larger value showsthe effect of discount rates on earnings estimates. Val-ues are based on earnings in 1999 and thus do not takeinto account the increasing economic return of highereducational attainment in the future. Estimates basedon earnings data from 1998 and 1998/1999 combined(Bureau of Census, 1999) yielded similar results. Allestimates include high school graduates and GEDgraduates. The proportion of high school completersin our sample that earned a GED was 8% at age 20 and15% at age 21. Since the age 25-29 interval in theCensus is close to that of the CLS sample, we used asingle age cohort to predict lifetime earnings. Barnett(1996) used cross sectional data for Blacks of differ-ent ages to predict lifetime earnings. It can be arguedthat the current earnings of a 60 year old man or womanis not the most accurate predictor of future earnings ofa young adult.
7 Based on this overall rate, our estimated rates ofparticipation in residential treatment, community treat-ment or parole, and release without treatment were,respectively, 19%, 39%, and 42%. These rates aresimilar to those in Chicago.
8 According to the Ilinois Department of Correc-tions (1999), the average length of stay for delinquentsis 10.1 months with court evaluations averaging1.9 months.
9 This is based on rates of participation in in-homeservices (70%) and out-of-home placement (i.e., fostercare; 30%), with respective costs per child of $2,891and $23,435 in 1998 dollars, exclusive of investiga-tions (American Humane Association, 1994; Courtney,1998).
'° For example, using the age 8 risk index and theother covariates, the adjusted preschool group differ-ence was 10.6 points for age 21 high school comple-tion (61.8% vs. 51.2%) and 9.1 points for juvenilearrest (13.1% vs. 22.2%). Respective group differ-ences for age 20 high school completion, age 21 highschool completion, andjuvenile arrest were 10.2, 9.0,and 8.2 points using parent education, free lunch sta-tus, single-parent status, school poverty, and numberof siblings instead of the risk index. All estimatesremained significant. Effects for school-age and ex-tended intervention followed a similar pattern. More-

Age 21 Cost-Benefit Analysis of the Title I Chicago Child-Parent Centers
over, Reynolds and Temple (1995) found that programeffects on school achievement differed by less than 10%
using latent-variable structural modeling and ordinaryregression analysis. After accounting for possible attri-tion bias, both Temple et al. (2000) and Reynolds and
Temple (1998) found that the effects of preschool andextended intervention on school achievement, graderetention, and dropout were larger than for effectsbased on ordinary regression.
11 This value was based on an adjusted group dif-
ference of 11.2 points in high school completion at age20 (Reynolds et al., 2001). Using the group differenceof 10.5 points at age 21 would have resulted in a nearly
identical earnings benefit ($19,234). Correspondingtax savings also were similar ($6,791).
12 Using Labor Department data on Black workerswith "any work experience," for example, the presentvalue of completing high school was $211,062 perparticipantinstead of the $183,183 reported inthe text.The former estimate is associated with increased taxrevenues of $77,094 as compared to $64,673 reportedin the text. Thus, these alternative estimates wouldhave increased the economic returns of program par-ticipation. Alternative estimates for averted justicesystem and crime victim costs also were consistentwith those reported in the tables.
295

Reynolds, Temple, Robertson, and Mann
Appendix A
Year
20 Child-Parent Centers Serving1983-85 3-5 Year Olds in Low-income
14 Sites with Preschool 6 Sites withand Half/Full-day Preschool and Full-Kindergarten dsy Kindergarten
674 Children Began at | 325 Children Began 176No PreschoiolAge3 or4 atAge 3 or4 l
989 Children in Original CPC 159Cide1985-86 Intervention Group
1986 684 Children Attended CPC 305 Children did notI School-age Program in Attend CPC School-
1989 Grades 1 to 3 age Program
1989l 141 Children LostI During Intervening
l ~~~~Years1999
1999-2001 841 Youth were 1286 Yoi
FIGURE Al. Flowchart of study sites and participants in the Chicago Longitudinal Study: Preschool to age 20.
296

Nl - 0 0 NOC 0 00 07(0a C0 - t (00 \-0 (I~ 0* \0 0~ 0- (In
4 00 cl~ = -Z Cq -Z
N (-0
It oCq
N Cl
cl 0 N-cO\ 00 -(-0 - W)
It Cl
6)'to
00 0\ ~ I-Cl C
(0)
- 0.~m
2!
05
00 C) V)00 0\N 0n Cn tj) NCl
Cl- _
C'n 00Cl~ 000\7,It 00 M~
Ul~ n c~ \ r-Nl Otld l Cn CCl
C l 00 00 't Z z
I~t = '*0l. N- 00,It o0 -
.1i lr. C-~00
=- r- Cx*
00Clq
C,) It (CN ON m in
"d e-~ cxf li -d(- -C') - C
0D00
00 O\o= cr\'Do
C\0 Int00 t0p. -~
* N
00 N N
Cl t vD
0 0 ~t
Cl- In
\C 00 in
t _0 r-
o~ o~ t
-6 C;
CS (-&o o ' 4
(- In 00 00 00o C, 00C cIn in IC\ 0 \ C\ 0\ O\ C\ \ all ,0\ 00
C\ OC O\ O C\C\ OC\ O C7 C\
0 0.
o c Cceo OXS3
0
0jE ° ° I A000 , CZ
'2.-. 0~ "' -, - 0)) 0.' 0000 20 to 00 C),' ,4 ,
C)0)')-' 0 >0,-
00 06) ~ 0)0. /~ 0 , 0) 6)0 . 0toAO O a) g ) bQ .) 2
0 0 0 CO0
CO *~~ 0 00~~ ,~~*, 0 )0< E E E 2 g E 2E E a2 ,,5 E b o
E 0r 2 Z.°i- 2')2;@ Ei3E E 3 20 ¢
.b- ', 0 P ,a
0 ~~~u U u
a) C
s
n 00
g -.
00=
,
Cd
0 0 -V.) Q
4)00
0WU
00 CCOU
t
A0)
6)
0).
t,50
[J .:q0
Co -O0C
U
QC0
6)
04
'.0
CC-Z
-20~0z
CIO
LEC.-.I
C.,
C.,
'El0
C.,
C)
C..
297

0)o
o00
, , %O0~~ T' ~~~z z zzz
.0 0OCC
U 00
zt OZ
C.)
0
0) 0 -
0)
8 C~ 0 0 0 0 CO
C . C
t )
BS oDO C O CD O
ON 5 o oo C) x o 0 cs ct v C)
t ° c c c00 00 \o \ \ c
O~~~~~; (4 -, ON: C, C,>>
C)
3 ca ~M
~~~~~~ C ~ ~ ~ ~ ~ ~~C
0 b0 \ 00 i C)
00 ~ ~ ~ ~ ~ t'.0~~-c .r~ 0 0\:
U o) j09 -l{)coa d c=O ° I v
b '.000 OCI 000 C V 0 a) CD 0
E0) o g X E ia Oc ¢ = Oc ¢ = ¢ H ¢
4. 000 000 00 0
C~~~~~~~oC
0)~~~~~~~~~~~~~
0 C~~~0 )
4- - '-CI 4?u
CQ '-4 '-4 1

* *
I* *
*
* * * *00 - c
-I
,-4 N
I I o -Ci C4 'too It c C
** * * * * ** * * * * * * ** * * * * * * 0Ci q C, -00
- -- ~~~~~~~~~~~~~~~I
4O\N a ocN N 00
\ in 00 r D N It 910 C, It DS
cq ON C9 C' ON
_~~~~~el
~~~\00\~~~~~~00
0~~~~0q m
0) o
00>0b
0 C 0
C0 0 CD S 8>p. > O 2 @r C D = 8 n00
.= t CCZrU - ZD
cn~~~~~~~~~~~~0
C)0 0 5 00)v o b to 00-' = 0c )
cn 00~~~00
o -o 000 .0o
0 0 - 01 1
C0 o t =
\ 0 CD0 C'S
'0 t : - i)
CS
00~c'
00
C)
000
00)
0-
O t
0)
00
'.0
'-.i
0)-0)
C-)t
Nl C\ (= i
- OC i O) '0 0
* * ** * N
II I
* * * ** cn * ltIf) c ,o .00 0 CO C)
O W > C~~N I bt
C l ot
nO t O 000m 00
in; 00
000 00 i0
ro-'ot'oj DolCC
.0)O O O ~~~~~~~~n CS
cl a) C 9 C)l
0)
4z-
0)0
= ~ ~~ =C
u
Oc
00 4 0) Q2 o D i M 0.i
" '-C -a
'.;: -2* . ' u .~-
> 0> '- C
oR
Cn
0-8
'.r0*
0.)*0.*a)
0-)-q4 o.
II *-
toO.
0
0
43
0
0~
0)p
0)00
0004
CIl0
0.
0
)-L
00
004.
0)P.
0
CC
02
C
0.0)0
0)00
toto
000-to0)to0.0)2
toto-0)0
0)
to
to
0
to
toC.-
toC..
to
0)C..0)
0)0)C..-0)k
to
0)00)0)C..0)
to-0)toC..
c-to
- 0)
p�0)
to
299
I
Ir
I
I
iI
i�iii
I
I
I

** * * ** * * ** * * N-xo Il 0 . . .
-II
Cl
Bc r- r c
C 000
xo 00 0 0
** * 0c9 Cn C
I I I I
* ** * ** It * c0 C') O mo CD r
> o on o o- r- o)'D¼O C cn-\ C N;;Oxt
C14 - oooon o
N - "'Ij 00
~~t N000 in0co
0 1t m ON _-- 0_ _ o 000 o00 00 x -NN t rN \O¼C\ 00 00 00 ONONON C 0 00C
4)
4) C
a))
Ca
a) 4)0
O ro >0 0
0 o z .4
00
00 .. ol
° -t 4) -m -g z
V: 04
000
cd
4',4)
0
4)
oO01a) m
-~ 4) 0 0
4 ) 04
4' 4) .4) 44
0 I -u o 2 0 6Q 4 C.)z
.- -4)
0
CZ
4)
4)
.4)
~~0
-4)
S
U
c-
04)4)toi
0
e >.0 to0.44-
00 0 4- C)0t
4)0. 4)I
44-Sa >
'r 0 00 0 .J z -Z *w
.*4)>4) 92
C Cn ON 00ON ON O ON
cq as o
l o R o4)
C 0 o4
C.) 4) C) 4
f)~~~~~~~~~~~~~~~1
4))i )
* * ** * *
r- CIO, St 'IN
0 No ~t 1-
Q~
a4)
4)CD
0
0r.
~0
z24)-
C:0
0,04)
a)
'0wo
121
0Cd
I0
.O
4)1:)
4)-0C-
4)
4)4)'-4
.4)4)
.4)
4)
4)4)0
4).4)4)
.4)4)4)
4)
C.)
4)
0C..
4)4-4)4�)4)4)
4)4)4-
.4)k4-
0
4)C.)4)4)C..4)
0.4)0C..
Q.4)
Cl.�
rJ��4)<4)
-d
4)
ed3)
.C8
C.
.4)o)
4)
0l4)4)
'8c
4,)O
4)V0.*C *
4)
O *0
300

References
American Humane Association. (1994). Twenty yearsafter CAPTA: A portrait of the child protective ser-vices system. Englewood, CO: Author.
Avruch, S., & Cackley, A. P. (1995). Savings achievedby giving WIC benefits to women prenatally. PublicHealth Reports, 110, 27-34.
Barnett, W. S. (1993). Benefit-cost analysis of pre-school education: Findings from a 25-year follow-up. American Journal of Orthopsychiatry, 63(4)500-508.
Barnett, W. S. (1995). Long-term effects of early child-hood programs on cognitive and school outcomes.The Future of Children, 5, 25-50.
Barnett, W. S. (1996). Lives in the balance: Age 27benefit-cost analysis of the High/Scope Perry Pre-school Program. Ypsilanti, MI: High/Scope Press.
Bendersky, M., & Lewis, M. (1994). Environmentalrisk, biological risk, and developmental outcome.Developmental Psychology, 30, 484-494.
Bureau of the Census. (1999). Current PopulationReports, detailed personal income (P-60 Package).Table Pinc-06a. Annual demographic survey, edu-cational attainment: People 18 years old and overby total money earnings in 1998. Washington, DC:Bureau of Labor Statistics.
Bureau of the Census. (2000). Current population re-ports, March supplement. Annual demographicsurvey, educational attainment: People 18 years oldand over by total money earnings in 1999. Wash-ington, DC: Bureau of Statistics. Retrieved fromhttp://ferret/bls/census/gov/marco/032000/perinc/newO4_000/htm.
Bureau of Justice Statistics. (1997). Sourcebook forcriminal justice statistics. Washington, DC: USDepartment of Justice.
Campbell, F. A., & Ramey, C. T. (1995). Cognitiveand school outcomes for high risk African-Americanstudents at middle adolescence: Positive effects ofearly intervention. American Educational ResearchJournal, 32, 743-772.
Chicago Board of Education. (1984). Chicago effectiveschools project. Chicago, IL: Office of Equal Edu-cational Opportunity.
Chicago Board of Education. (1988). Chicago EARLY:Instructional activities for ages 3 to 6. Vernon Hills,IL: ETA.
Chicago Board of Education. (2001). Property list-ing. Chicago, IL: Bureau of Risk and BenefitManagement.
Chicago Longitudinal Study. (1999). A study of chil-dren in the Chicago public schools: User's guide(Version 6). Madison, WI: University of Wisconsin.
Chicago Public Schools. (1986a). ECIA Chapter Iapplication: Fiscal 1986. Chicago, IL: ChicagoDepartment of Government Funded Programs.
Chicago Public Schools. (1986b). Child-Parent Cen-ters Adaptation/Expansion Activity (FY 1987). Allo-cation. Chicago, IL: Office of Instruction Services,Bureau of Early Childhood Programs.
Chicago Public Schools. (1995). Special educationpupil claims: 1994-1995. Chicago, IL: Departmentof Special Services, Board of Education.
Cohen, M. A. (1988). Pain, suffering, andjury awards:A study of the cost of crime to victims. Law andSociety, 22, 538-555.
Cohen, M. A. (1998). The monetary value of saving ahigh-risk youth. Journal of Quantitative Criminol-ogy, 14, 5-33.
Comer, J. P. (1980). Schoolpower: Implications of anintervention project. New York: Free Press.
Committee for Economic Development. (2002). Pre-schoolfor all: Investing in a productive and justsociety. New York: Research and Policy Committee.
Conrad, K. J., & Eash, M. J. (1983). Measuring imple-mentation and multiple outcomes in a child parentcenter compensatory education program. AmericanEducational Research Journal, 20, 221-236.
Consortium for Longitudinal Studies. (1983). As thetwig is bent: Lasting effects of preschool programs.Hillsdale, NJ: L. Lawrence Erlbaum.
Council of Economic Advisers. (1997). Thefirst threeyears: Investments that pay. Washington, DC: Ex-ecutive Office of the President.
Courtney, M. E. (1998). The costs of child protectionin the context of welfare reform. The Future of Chil-dren, 8(1), 88-103.
Currie, J. (2001). Early childhood education programs.Journal of Economic Perspectives, 15, 213-238.
Currie, J., & Thomas, D. (2000). School quality andthe longer-term effects of Head Start. Journal ofHuman Resources, 35, 755-774.
Durlak, J. A., & Wells, A. M. (1997). Primary preven-tion of mental health programs for children and ado-lescents: A meta-analytic review. American Journalof Community Psychology, 25, 115-152.
Fuerst, J. S., & Fuerst, D. (1993). Chicago experi-ence with an early childhood program: The specialcase of the Child Parent Center program. UrbanEducation, 28, 69-96.
Garces, E., Currie, J., & Thomas, D. (2000). Longer termeffects of Head Start. Santa Monica, CA: RAND.
Greene, W. H. (1995). LIMDEP: User's guide, ver-sion 7 [computer program]. Bellport, NY: Econo-metric Software, Inc.
Greenwood, P. W., Model, K. E., Rydell, C. P., &Chiesa, J. (1998). Diverting children from a life ofcrime: Measuring costs and Benefits. Santa Monica,CA: RAND.
Haveman, R., & Wolfe, B. (1994). Succeeding gener-ations: On the effects of investments in children.New York: Russell Sage Foundation.
301

Reynolds, Temple, Robertson, and Mann
Illinois Department of Corrections. (1999). Departmentdata. Springfield, IL: Author. Retrieved June30,2002from www.idoc.state.il.us/news/1999_data.pdf.
Illinois State Board of Education. (1997). Spending onelementary and secondary schools in Illinois: Fiscalyear 1995-1996. Springfield, IL. Author
Karoly, L. A., Greenwood, P. W., Everingham, S. S.Hoube, J., Kilburn, M. R., & Rydell, C. P. (1998).Investing in our children: What we know and don'tknow about the costs and benefits of early childhoodinterventions. Santa Monica, CA: RAND.
Larner, M. B., Stevenson, C. S., & Behrman, R. E.(1998). Protecting children from abuse and neglect:Analysis and recommendations. The Future of Chil-dren, 8(1), 4-22.
Levin, H. M., & McEwan, P. J. (2001). Cost-effectiveness analysis: Methods and applications(2nd ed). Thousand Oak, CA: Sage.
Lipscomb, J., Weinstein, M. C., & Torrance, G. W.(1996). Time preference. In M. R. Gold, L. B. Rus-sell, J. E. Siegel, & M. C. Weinstein (Eds.), Cost-effectiveness in health and medicine (pp. 214-246).New York: Oxford University Press.
Miedel, W. T., & Reynolds, A. J. (1999). Parent in-volvement in early intervention for disadvantagedchildren: Does it matter? Journal of School Psy-chology, 37, 379-402.
Miller, T. R., Cohen, M. A., & Wiersema, B. (1996).Victim costs and consequences: A new look.Rockville, MD: National Institute of Justice Re-search Report
National Center for Educational Statistics. (2002).Digest of educational statistics, 2001 (Chapter 2,Table 46). Washington, DC: U.S. Department ofEducation.
National Science and Technology Council, Office ofScience and Technology Policy. (1997). Investingin our Future: A national research initiative forAmerica's children for the 21st Century. Washing-ton, DC: Executive Office of the President, NationalScience and Technology Council.
Oden, S., Schweinhart, L. J., Weikart, D., Marcus,S., & Xie, Y. (2000). Into adulthood: A study ofthe effects of Head Start. Ypsilanti, MI: High/Scope Press.
Olds, D. L., Eckenrode, J., Henderson, & C. R. (1997).Long-term effects of home visitation on maternallife course and child abuse and neglect: Fifteen-year follow-up of a randomized trial. JAMA, 278,637-643.
Ramey, C. T., Campbell, F. A., Burchinal, M., Skin-ner, M. L., Gardner, D. M., & Ramey, S. L. (2000).Persistent effects of early childhood education onhigh-risk children and their mothers. Applied De-velopmental Science, 4, 2-14.
Reynolds, A. J. (1994). Effects of a preschool plusfollow-on intervention for children at risk. Devel-opmental Psychology, 30, 787-804.
302
Reynolds, A. J. (1995). One year of preschool or two:Does it matter? Early Childhood Research. Quar-terly, 10, 1-31.
Reynolds, A. J. (1998). Confirmatory program eval-uation: A method for strengthening causal infer-ence. American Journal of Evaluation, 19(2),203-221.
Reynolds, A. J. (1999). Educational success in high-risk settings: Contributions of the Chicago Longi-tudinal Study. Journal of School Psychology, 37,345-354.
Reynolds, A. J. (2000). Success in early intervention:The Chicago Child-Parent Centers. Lincoln, NE:University of Nebraska Press.
Reynolds, A. J., Chang, H. & Temple, J. A. (1998).Early childhood intervention and juvenile delin-quency: An exploratory analysis of the ChicagoChild-Parent Centers. Evaluation Review, 22,341-372.
Reynolds, A. J., & Robertson, D. L. (in press). School-based early intervention and later child maltreat-ment in the Chicago Longitudinal Study. ChildDevelopment.
Reynolds, A. J., & Temple, J. A. (1995). Quasi-experimental estimates of the effects of a preschoolintervention: Psychometric and econometric com-parisons. Evaluation Review, 19, 347-373.
Reynolds, A. J., & Temple, J. A. (1998). Extendedearly childhood intervention and school achieve-ment: Age thirteen findings from the Chicago Lon-gitudinal Study. Child Development, 69, 231-246.
Reynolds, A. J., Ou, S., & Topitzes. J. W. (2002).Paths of effects of early childhood intervention oneducational attainment and delinquency: A confir-matory analysis of the Chicago Child-Parent Cen-ters. Unpublished manuscript.
Reynolds, A. J., Temple, J. A., Robertson, D. L., &Mann, E. A. (2001). Long-term effects of an earlychildhood intervention on educational achievementand juvenile arrest: A 15-year follow-up of low-income children in public schools. JAMA, 285,2339-2346.
Rhine, W. R. (Ed.). (1981). Making schools more ef-fective: New directionsfrom Follow Through. NewYork: Academic Press.
Sampson, R. J., & Laub, J. H. (1993). Crime in themaking: Pathways and turning points through life.Cambridge, MA: Harvard University Press.
Schweinhart, L. J., Barnes, H. V., & Weikart, D. P.(1993). Significant benefits: The High-Scope PerryPreschool Study through Age 27. Ypsilanti, MI:High/Scope Press.
Shea, S., Stein, A. D., & Basch, C. E. (1991). Inde-pendent associations of educational attainment andethnicity with behavioral risk factors for cardio-vascular disease. American Journal of Epidemiol-ogy, 134, 567-582.
Age 21 Cost-Benefit Analysis of the Title I Chicago Child-Parent Centers
Stahl, A. L., Sickmund, M., Finnegan, T. A., Snyder,H. N., Poole, R. S., & Tierny, N. (1999). JuvenileCourt Statistics: 1996. Washington, DC: Office ofJuvenile Justice and Delinquency Prevention.
Sullivan, L. M. (1971). Let us not underestimatethe children. Glenview, IL: Scott, Foreman andCompany.
Temple, J. A., & Reynolds, A. J. (2002). Estimationof costs and benefits in the Child-Parent CenterProgram: Technical report. Madison, WI: Univer-sity of Wisconsin
Temple, J. A., Reynolds, A. J., & Miedel, W. T.(2000). Can early intervention prevent high schooldropout? Evidence from the Chicago Child-ParentCenters. Urban Education, 35, 31-56.
U.S. Department of Health and Human Services, Na-tional Center on Child Abuse and Neglect. (1997).Child maltreatment 1995: Reports from the states tothe National Center on Child Abuse and Neglect.Washington, DC: Government Printing Office.
U.S. Department of Health and Human Services, Of-fice of Disease Prevention and Health Promotion,Office of Public Health and Science. (2001). Healthypeople in healthy communities: A community plan-ning guide using Healthy People 2010. Washington,DC: GPO.
U.S. General Accounting Office. (1992). Early inter-vention: Federal investments like WIC can producesavings (HRD Report No. 92-18). Washington, DC:Author.
U.S. General Accounting Office. (1999). Educationand care: Early childhood programs and servicesfor low-income families (HEHS Report No. 00-11).Washington, DC: Author.
U.S. General Accounting Office. (2000a). Preschooleducation: Federal investmentfor low-income chil-dren significant but effectiveness unclear (T-HEHSReport No. 00-83). Washington, DC: Author.
U.S. General Accounting Office. (2000b). Title Ipreschool education: More children served but
gauging effect on school readiness unclear (HEHSReport No. 00-171). Washington, DC: Author.
Wilson, W. J. (1996). When work disappears: Theworld of the new urban poor. New York: Knopf.
Wolfe, B. L. (1995). External benefits of education.In M. Carnoy (Ed.), International encyclopedia ofeconomics of education, (2nd ed.). (pp. 159-163).Oxford, UK: Pergamon.
Zigler, E., & Styfco, S. J. (1993). Head Start andbeyond: A national plan for extended childhoodintervention. New Haven, CT: Yale UniversityPress.
Zigler, E., Taussig, C., & Black, K. (1992). Earlychildhood intervention. A promising preventativefor juvenile delinquency. American Psychologist,47, 997-1006.
Authors
ARTHUR J. REYNOLDS is Professor of SocialWork, Educational Psychology, and Human Develop-ment at the Waisman Center, University of Wisconsin-Madison, 1500 Highland Avenue, Madison, WI 53705;cls @waisman.wisc.edu or areynolds @ waisman.wisc.edu. He specializes in child development, social pol-icy prevention science and evaluation research.
JUDY A. TEMPLE is Associate Professor, De-partment of Economics, Northern Illinois University,Dekalb, IL, 60115; [email protected]. She specializesin public economics, cost-benefit analysis and edu-cational policy.
DYLAN L. ROBERTSON is a Research Assis-tant at the Waisman Center and School of SocialWork, University of Wisconsin-Madison, 1500 High-land Avenue, Madison, WI 53705; drobertson@[email protected].
EMILY A. MANN is a Research Assistant at theWaisman Center and School of Social Work, Uni-versity of Wisconsin-Madison, 1500 Highland Av-enue, Madison, WI 53705; [email protected].
303