
especially can induce T24 apoptotic and necroptotic cell ...
Upload
neven-jakopovicCategory
view
215download
1
Agarikon.1 and Agarikon Plus Affect Cell Cycle and Induce Apoptosis in Human Tumor Cell Lines
Boris Jakopovich, Ivan Jakopovich, Neven Jakopovich
Dr Myko San – Health from Mushrooms Miramarska c. 109, Zagreb, Croatia

INDEX
• Introduction • Materials and Methods • Results • Conclusions
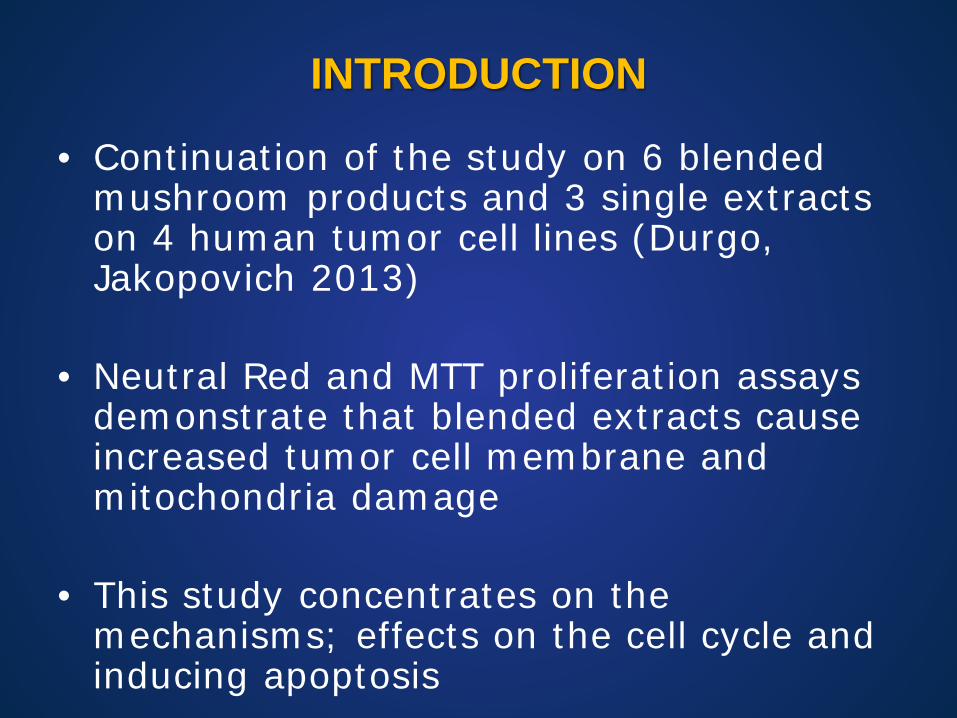
INTRODUCTION
• Continuation of the study on 6 blended mushroom products and 3 single extracts on 4 human tumor cell lines (Durgo, Jakopovich 2013)
• Neutral Red and MTT proliferation assays demonstrate that blended extracts cause increased tumor cell membrane and mitochondria damage
• This study concentrates on the mechanisms; effects on the cell cycle and inducing apoptosis
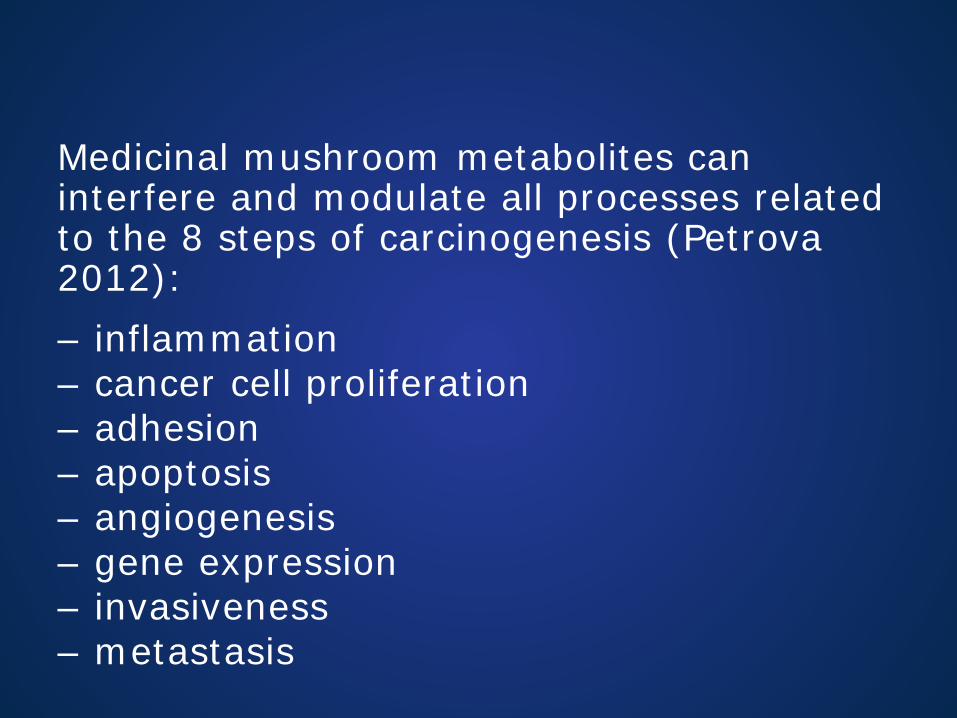
Medicinal mushroom metabolites can interfere and modulate all processes related to the 8 steps of carcinogenesis (Petrova 2012):
– inflammation – cancer cell proliferation – adhesion – apoptosis – angiogenesis – gene expression – invasiveness – metastasis
Apoptosis - programmed cell death - is a crucial tumor suppression mechanism
‒ eliminates cells with extensive DNA damage (potentially leading to cancer)
• differentiation - cell growth – apoptosis balance
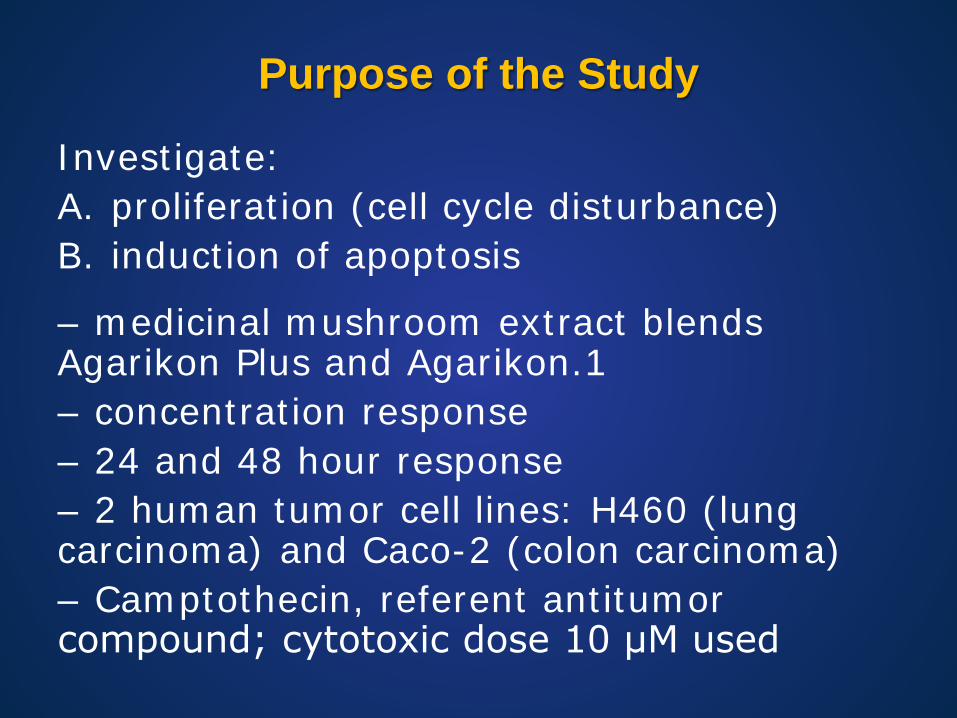
Purpose of the Study
Investigate: A. proliferation (cell cycle disturbance) B. induction of apoptosis
– medicinal mushroom extract blends Agarikon Plus and Agarikon.1 – concentration response – 24 and 48 hour response – 2 human tumor cell lines: H460 (lung carcinoma) and Caco-2 (colon carcinoma) – Camptothecin, referent antitumor compound; cytotoxic dose 10 μM used
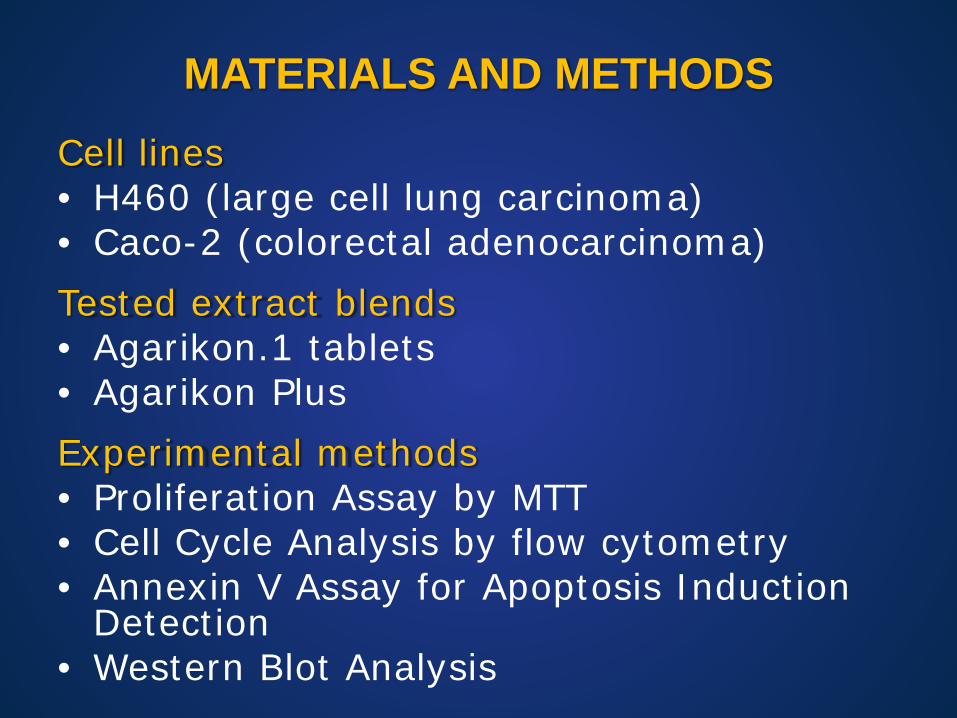
MATERIALS AND METHODS
Cell lines • H460 (large cell lung carcinoma) • Caco-2 (colorectal adenocarcinoma)
Tested extract blends • Agarikon.1 tablets • Agarikon Plus
Experimental methods • Proliferation Assay by MTT • Cell Cycle Analysis by flow cytometry • Annexin V Assay for Apoptosis Induction
Detection • Western Blot Analysis
TESTED PRODUCTS
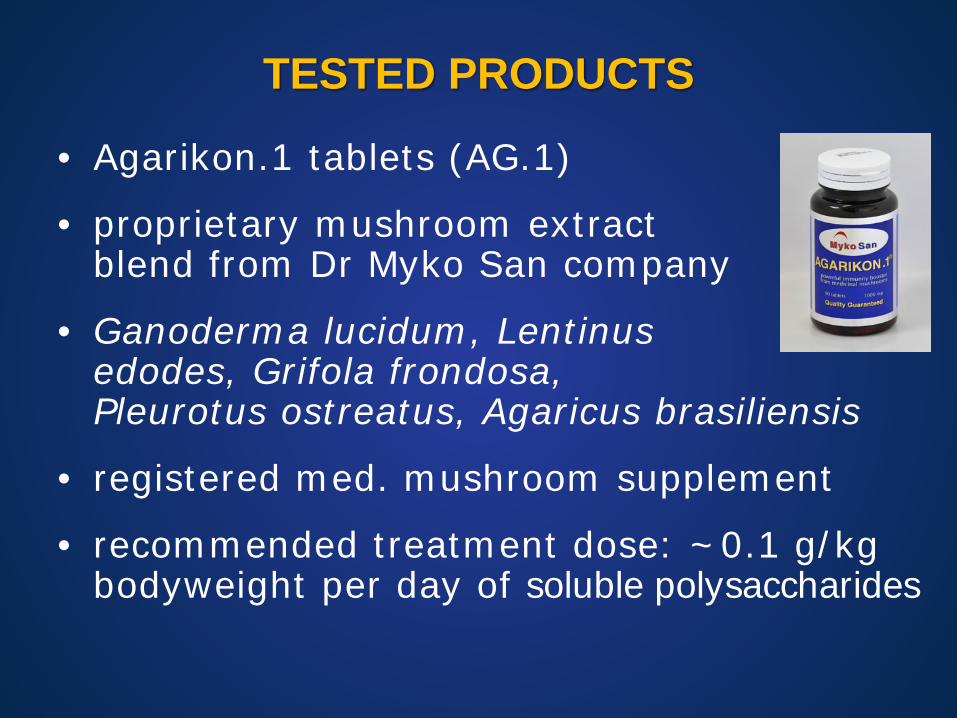
• Agarikon.1 tablets (AG.1)
• proprietary mushroom extract blend from Dr Myko San company
• Ganoderma lucidum, Lentinus edodes, Grifola frondosa, Pleurotus ostreatus, Agaricus brasiliensis
• registered med. mushroom supplement
• recommended treatment dose: ~0.1 g/kg bodyweight per day of soluble polysaccharides
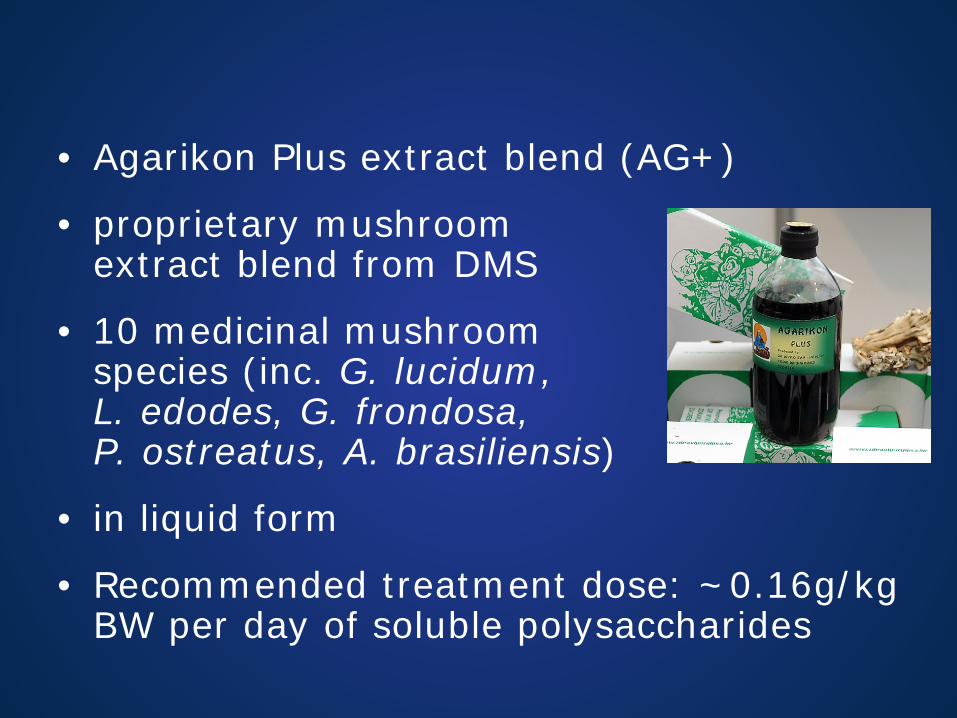
• Agarikon Plus extract blend (AG+)
• proprietary mushroom extract blend from DMS
• 10 medicinal mushroom species (inc. G. lucidum, L. edodes, G. frondosa, P. ostreatus, A. brasiliensis)
• in liquid form
• Recommended treatment dose: ~0.16g/kg BW per day of soluble polysaccharides
1 Proliferation Assay
• Cells cultured as monolayers, plated in parallel on day 0, at 3 x 10³ cells/well (H460) and 7 x 10³ cells/well (Caco-2), depending on doubling times
• AG.1 and AG+ added at 0.001, 0.01, 0.1, 1 and 10 mg/ml concentrations (stock solution for both 40 mg/ml, and 4 x 10⁻³ M/DMSO for camptothecin)
• We used MTT assay to evaluate cell growth rate after 72 hours (absorbance was measured at 570 nm)
2 Cell Cycle Analysis
• seeded at 1x10⁵ cells/well (H460) and 2x10⁵ cells/well (Caco-2), depending on the doubling times
• After 24 hours, AG.1 and AG+ applied at concentrations 0.1 mg/ml and 1 mg/ml; camptothecin (10 μM) for positive control
• After the incubation period, cells were trypsinized, washed with Phosphate Buffer Saline (PBS); stained with propidium iodide (PI) and analyzed on FACScalibur flow cytometer
• Ratio of cells in each cell cycle phase was determined by analyzing the DNA histograms using ModFit LTTM software
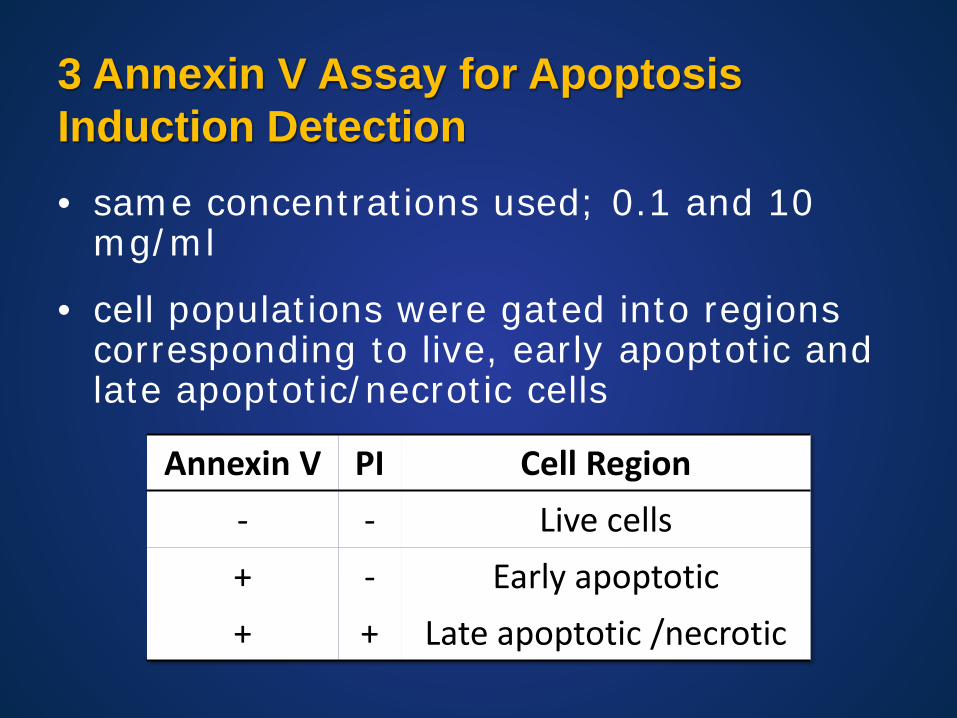
3 Annexin V Assay for Apoptosis Induction Detection • same concentrations used; 0.1 and 10
mg/ml
• cell populations were gated into regions corresponding to live, early apoptotic and late apoptotic/necrotic cells
Annexin V PI Cell Region - - Live cells + - Early apoptotic + + Late apoptotic /necrotic
4 Western Blot Analysis
• mushroom extracts (0.1 and 1 mg/ml) were added to well plates after 24 hours
• total proteins were measured using BCA Protein Assay Reagent, separated by SDS-polyacrylamid gel electrophoresis and transferred to PVDF membrane probing with anticaspase 3, anti-p53, and anti-p21 primary antibodies
• equal loading confirmed using anti-tubulin primary antibody
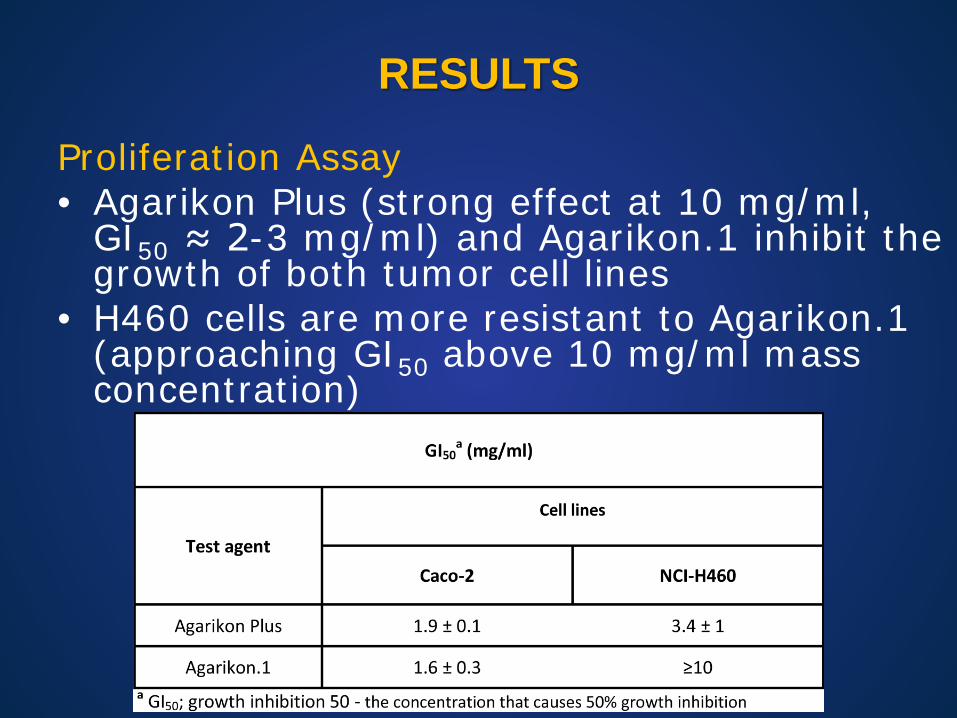
RESULTS
Proliferation Assay • Agarikon Plus (strong effect at 10 mg/ml,
GI50 ≈ 2-3 mg/ml) and Agarikon.1 inhibit the growth of both tumor cell lines
• H460 cells are more resistant to Agarikon.1 (approaching GI50 above 10 mg/ml mass concentration)
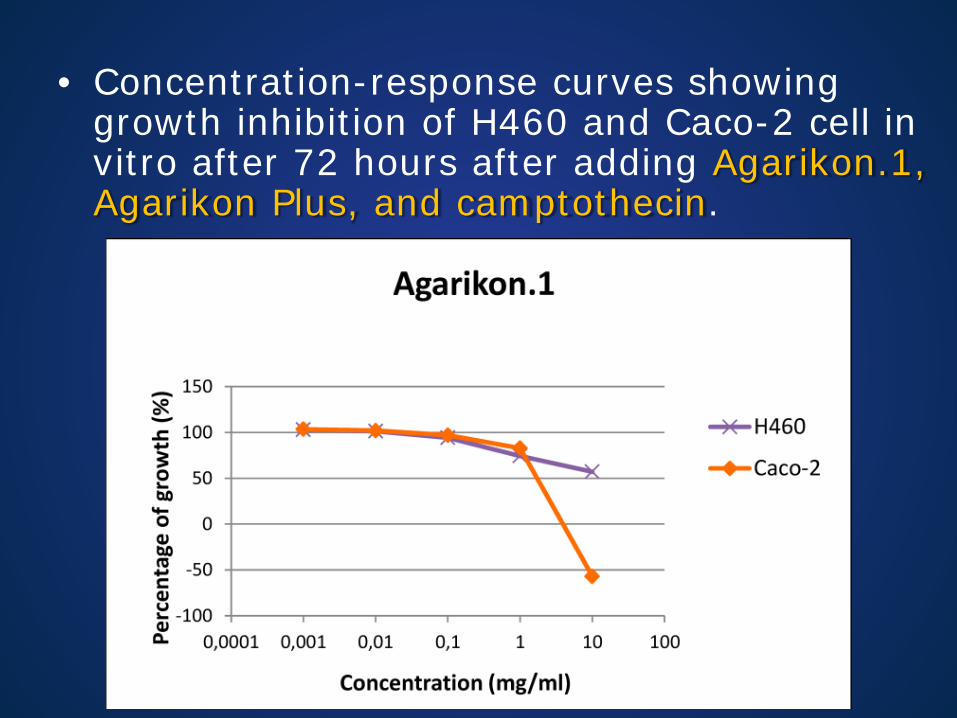
• Concentration-response curves showing growth inhibition of H460 and Caco-2 cell in vitro after 72 hours after adding Agarikon.1, Agarikon Plus, and camptothecin.
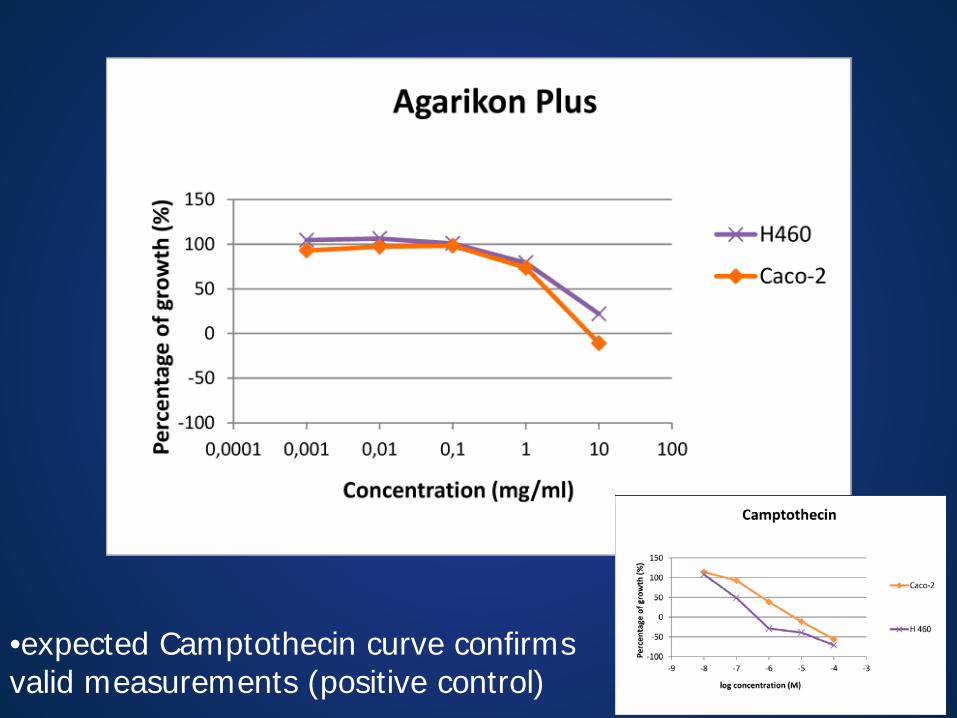
•expected Camptothecin curve confirms valid measurements (positive control)

Cell Cycle Analysis
• Distribution of H460 cells by cell cycle phase: G0/G1, S, G2/M; and sub G1 (dead/apoptotic cells)
• treated with Agarikon Plus, Agarikon.1 (at 0.1 and 10 mg/ml), camptothecin at 10 μM.
• measured by flow cytometry at 24 and 48 hours
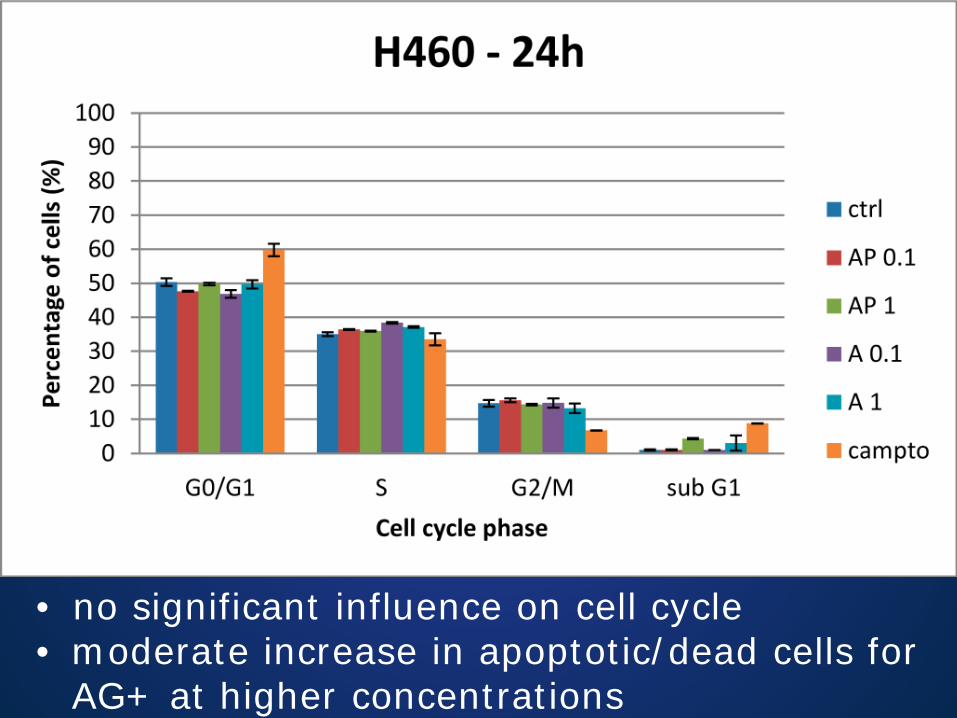
• no significant influence on cell cycle • moderate increase in apoptotic/dead cells for
AG+ at higher concentrations
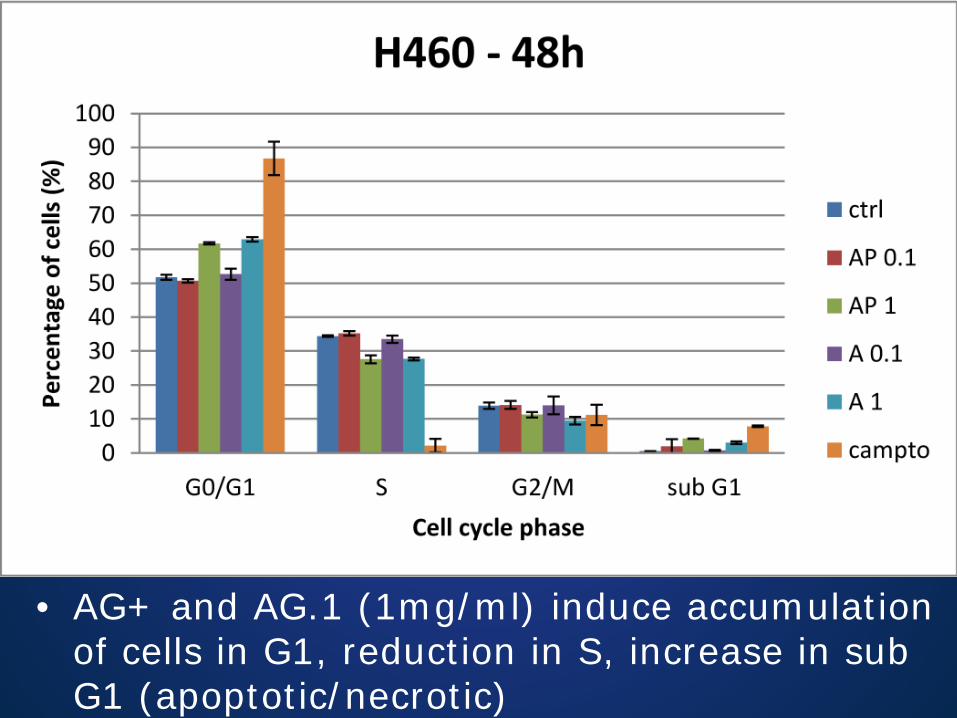
• AG+ and AG.1 (1mg/ml) induce accumulation of cells in G1, reduction in S, increase in sub G1 (apoptotic/necrotic)
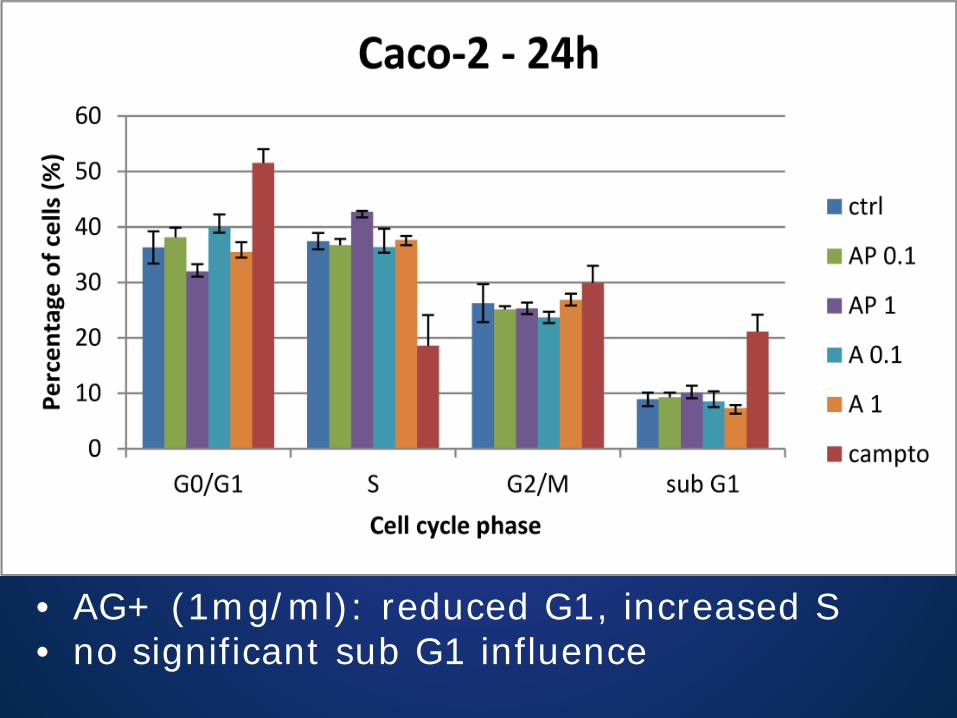
• AG+ (1mg/ml): reduced G1, increased S • no significant sub G1 influence
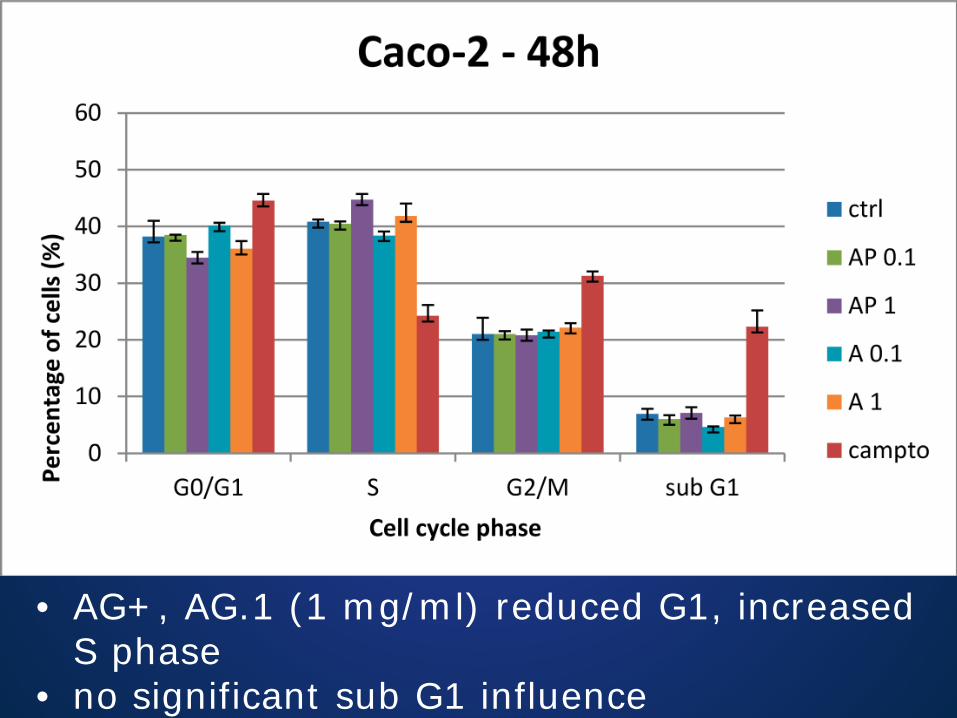
• AG+, AG.1 (1 mg/ml) reduced G1, increased S phase
• no significant sub G1 influence

Apoptosis Induction Detection by Annexin V Assay • Ratio of H460 cells in early or late
apoptosis, obtained by co-staining with FITC-labeled annexin V and propidium iodide (PI) and analyzed by flow cytometry.
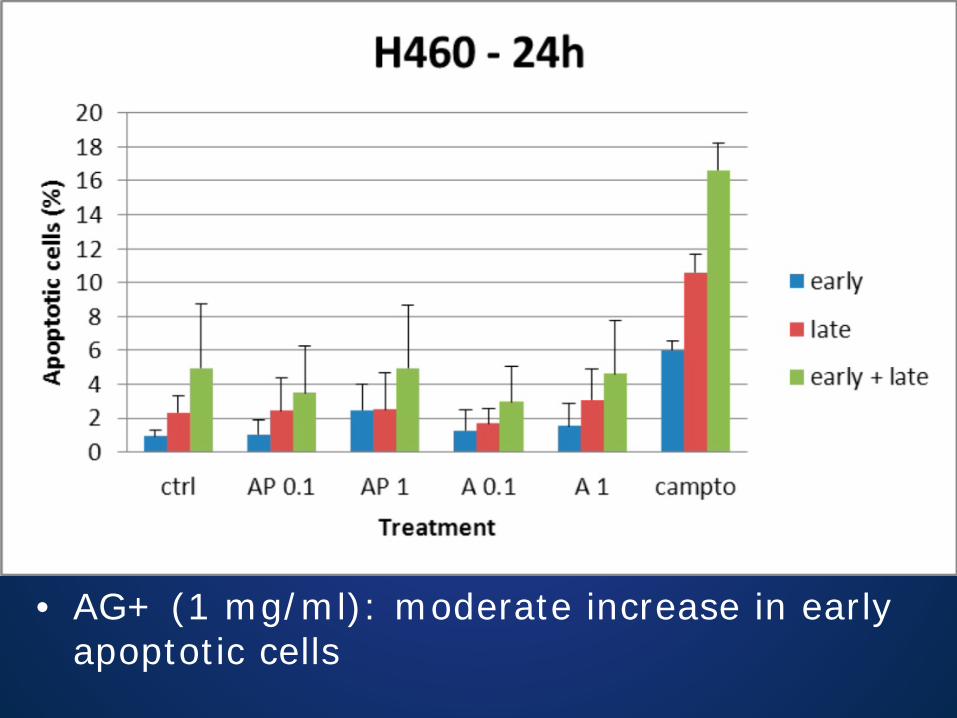
• AG+ (1 mg/ml): moderate increase in early apoptotic cells
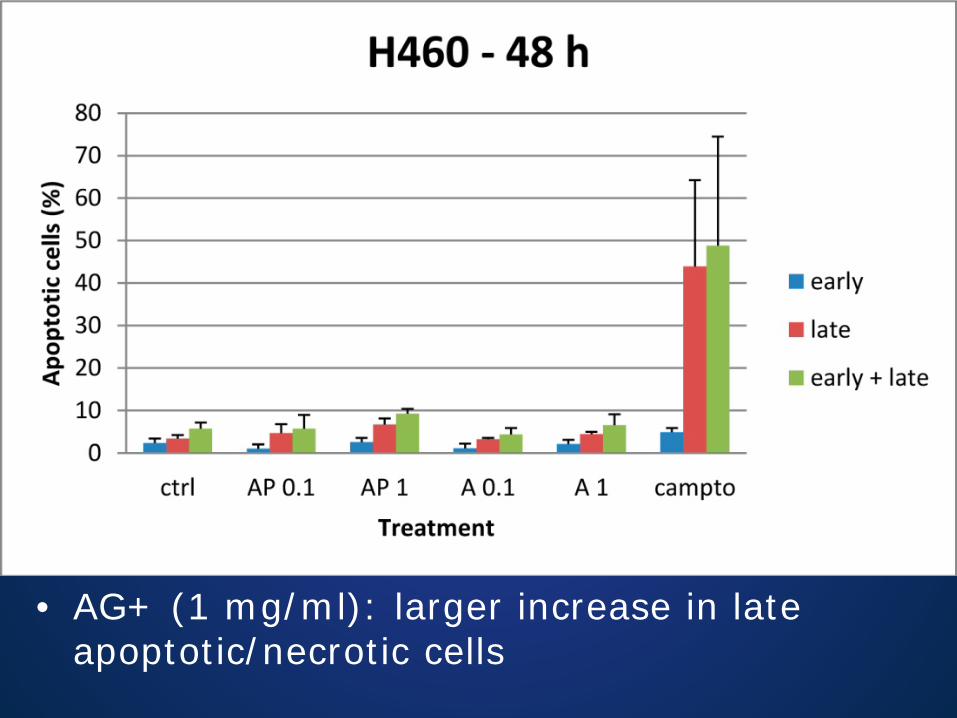
• AG+ (1 mg/ml): larger increase in late apoptotic/necrotic cells
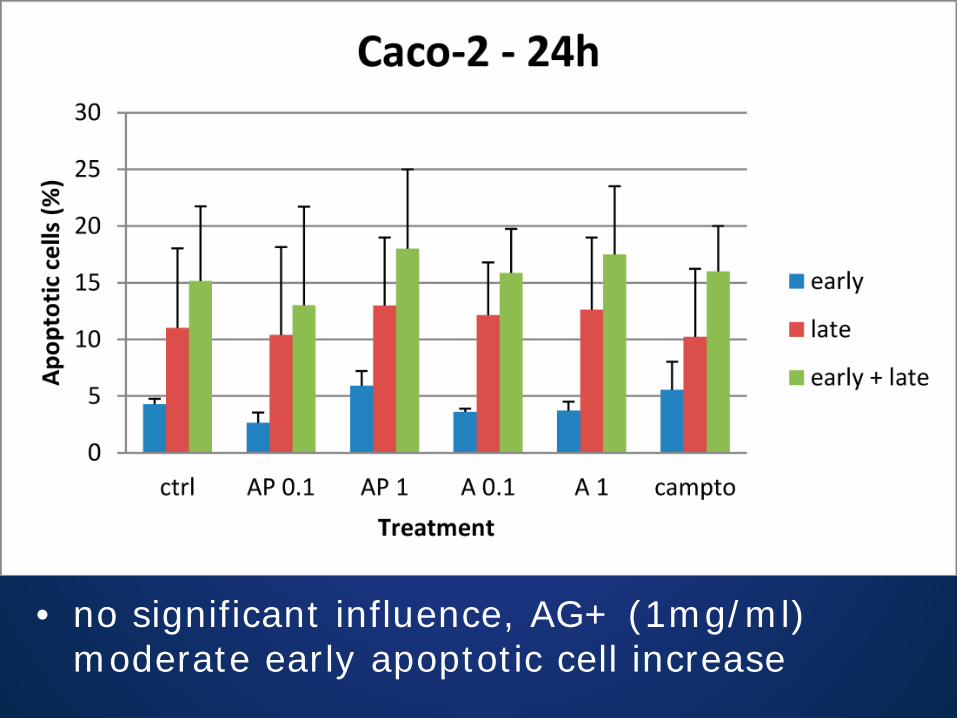
• no significant influence, AG+ (1mg/ml) moderate early apoptotic cell increase
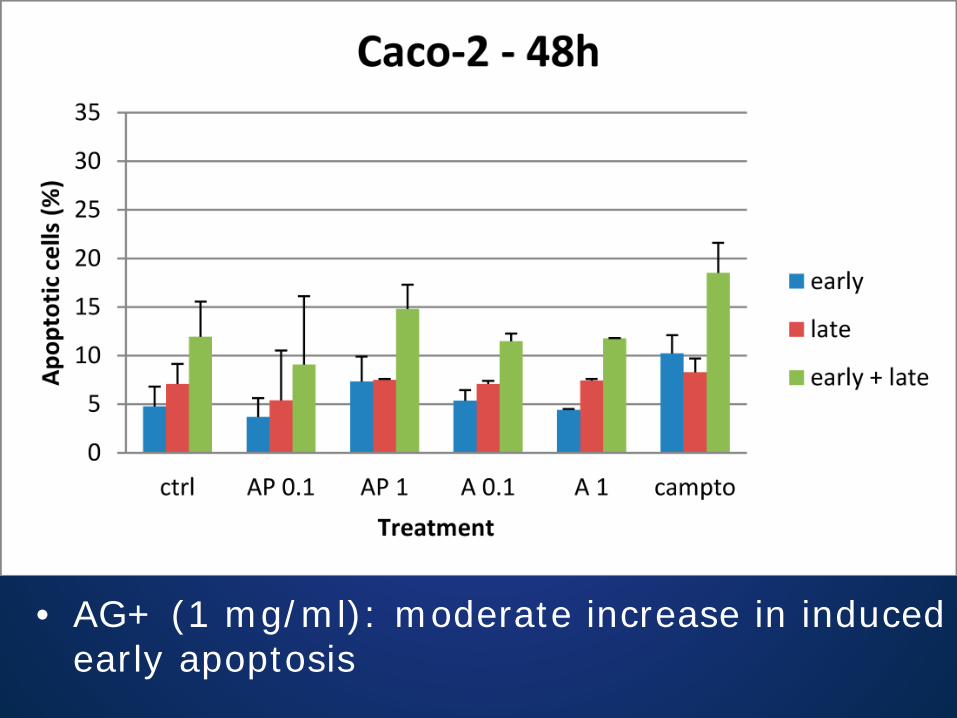
• AG+ (1 mg/ml): moderate increase in induced early apoptosis

Apoptosis induction detection by caspase-3 cleavage assessment • Appearance of the 17-kDa subunit (caspase-3
p17) – a major cleaved product of the 32-kDa zymogen procaspase-3 - confirms caspase-3 activation which marks the induction of apoptosis.

The effect of AG+ and AG.1 on cleavage of procaspase-3 in H460 cells (24; 48 hours)
A. AG+ at 0.1 mg/ml(lanes 1;6), 1 mg/ml (lanes 2;7).
B. AG.1 at 0.1 mg/ml (lanes 3;8), 1 mg/ml (lanes 4;9)
C. Camptothecin at 10μM (lanes 5;10)
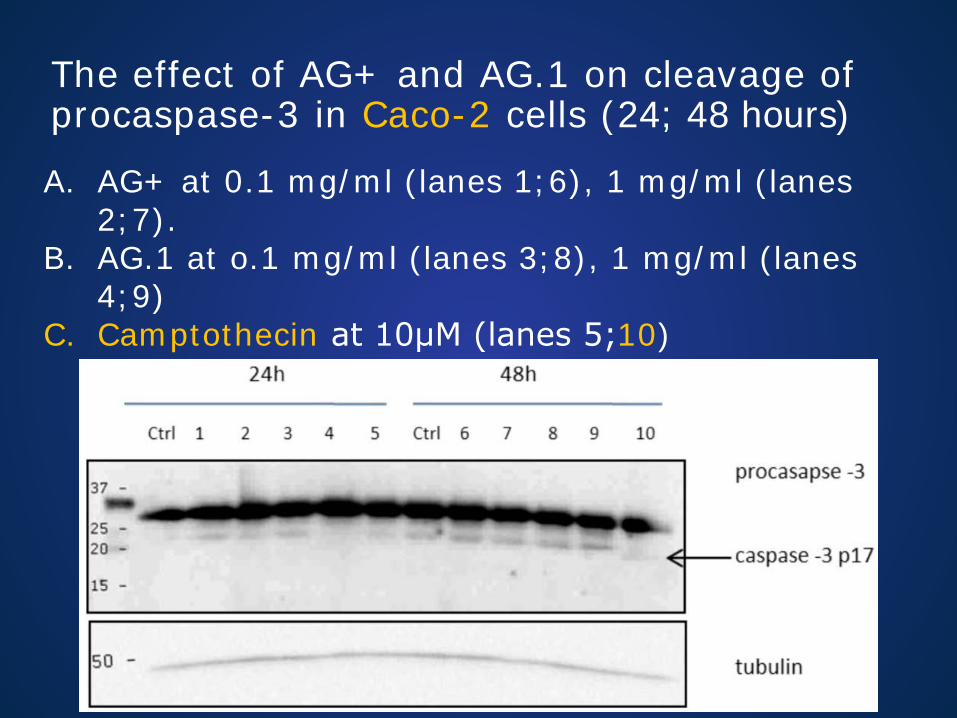
The effect of AG+ and AG.1 on cleavage of procaspase-3 in Caco-2 cells (24; 48 hours)
A. AG+ at 0.1 mg/ml (lanes 1;6), 1 mg/ml (lanes 2;7).
B. AG.1 at o.1 mg/ml (lanes 3;8), 1 mg/ml (lanes 4;9)
C. Camptothecin at 10μM (lanes 5;10)

Influence of AG+ and AG.1 on p53 and p21 protein expression • Agarikon.1, in both concentrations,
induced mild p53 protein expression in H460 after 24 hours (A; lanes 3 and 4)
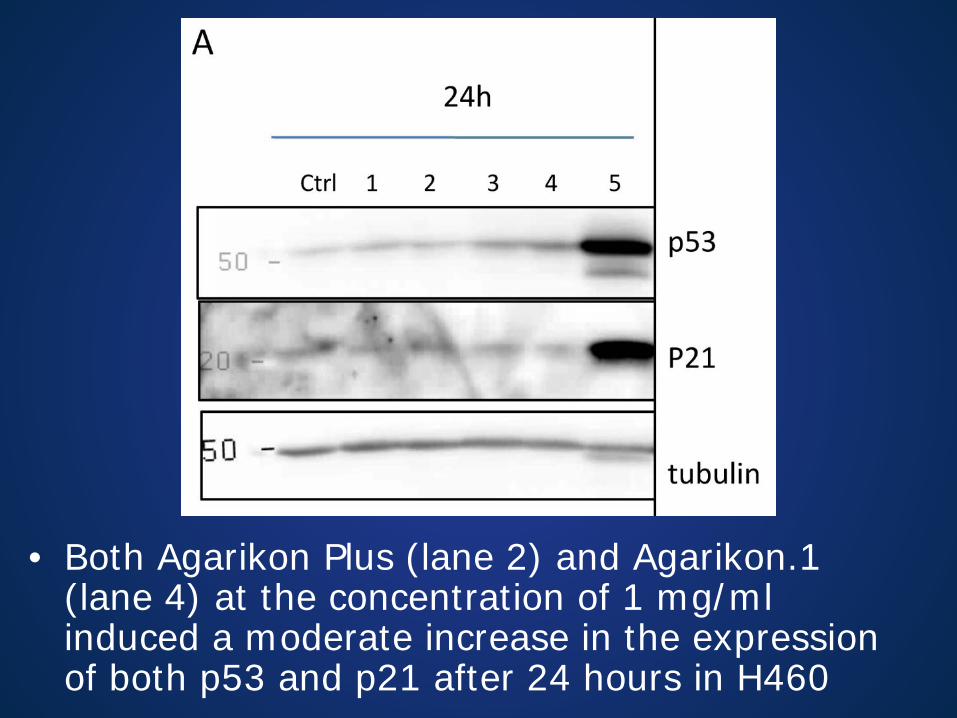
• Both Agarikon Plus (lane 2) and Agarikon.1 (lane 4) at the concentration of 1 mg/ml induced a moderate increase in the expression of both p53 and p21 after 24 hours in H460
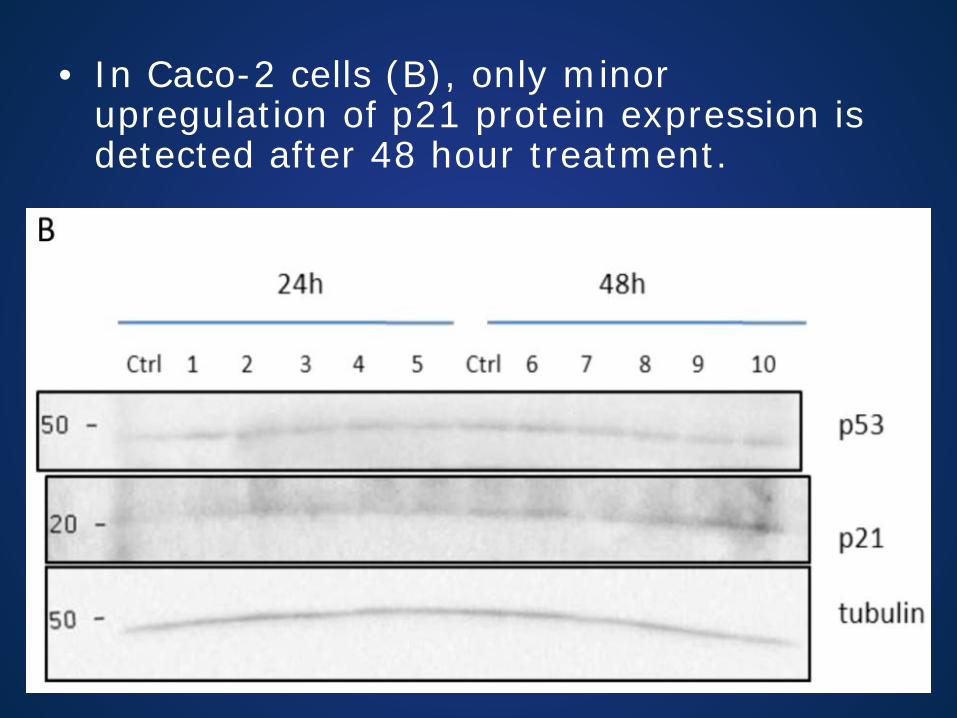
• In Caco-2 cells (B), only minor upregulation of p21 protein expression is detected after 48 hour treatment.
CONCLUSIONS
• Agarikon Plus and Agarikon.1 possess antiproliferative, mainly cytostatic activity, on H460 and Caco-2 cells, in the concentration range 1-10 mg/ml
• Both induce cell cycle perturbations, by delaying the progress through the G1 and S phase
• This points to disturbances occurring before or during DNA replication (confirmed by increase in both p53 and p21 protein expression)
CONCLUSIONS (II)
• Although a modest induction of early (after 24 hours) and late (48 hours) apoptosis was noticed by annexin V test, no processing (cleavage) of caspase-3 was detected
• More-pronounced antiproliferative activity (MTT) of tested agents towards Caco-2 line at maximal concentration (10 mg/ml) points to a non-specific cytotoxic effect

Acknowledgements
Dr. Marijeta Kralj Dr. Ana-Matea Mikecin Biozyne, Bijenicka c. 54, 10000 Zagreb,
Rudjer Boskovic Institute

APPENDIX
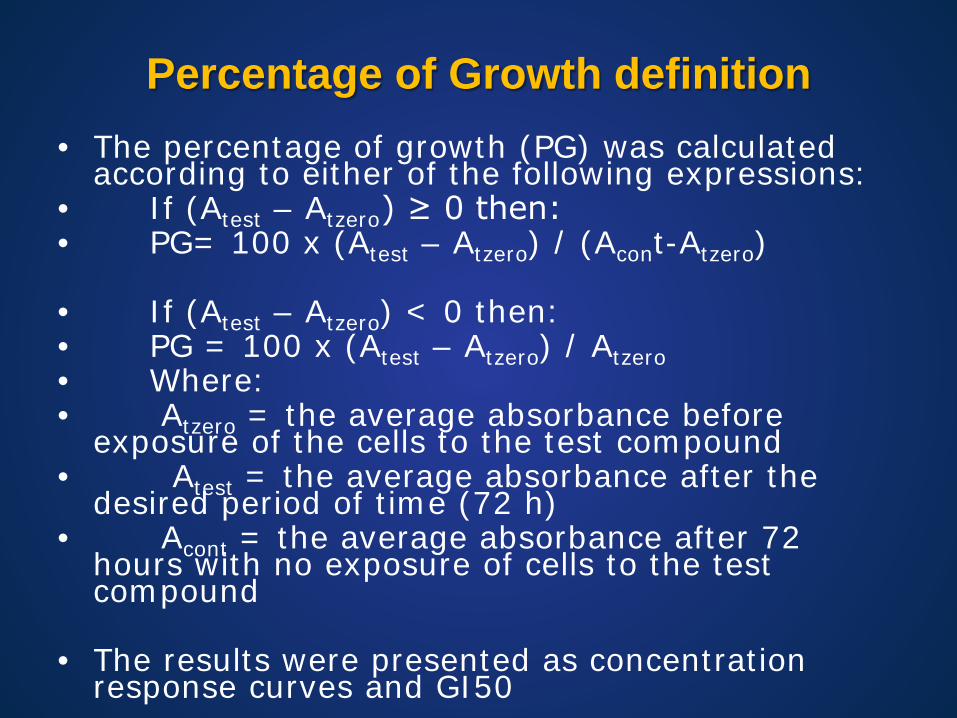
Percentage of Growth definition • The percentage of growth (PG) was calculated
according to either of the following expressions: • If (Atest – Atzero) ≥ 0 then: • PG= 100 x (Atest – Atzero) / (Acont-Atzero)
• If (Atest – Atzero) < 0 then: • PG = 100 x (Atest – Atzero) / Atzero • Where: • Atzero = the average absorbance before
exposure of the cells to the test compound • Atest = the average absorbance after the
desired period of time (72 h) • Acont = the average absorbance after 72
hours with no exposure of cells to the test compound
• The results were presented as concentration response curves and GI50

Camptothecin Proliferation Assay