ag127e02
Transcript of ag127e02

8/11/2019 ag127e02
http://slidepdf.com/reader/full/ag127e02 1/23
14
Plate 1.6 Trees were uprooted by a huge tsunami and becamefloating debris that destroyed houses
2.4 Tsunami Impact on vegetation
The impacts of the 2004 tsunami on natural vegetation were reported by several agencies and
institutes, including the European Commission Joint Research Centre (ECJRC, 2005). ECJRC
analysed satellite imagery of 11 000 kilometers along the affected coastal areas in the Indian Ocean
before and after the event. Roughly, 80 795 hectares were mapped as severely damaged. Changes
included the destruction of standing crops, removal of topsoil, uprooting and snapping of trees and
complete levelling of the land. Preliminary estimates indicated that 10 960 hectares of forest and
woodland (palm trees, broadleaf evergreen species and mangrove), 4 393 hectares of beach, 56 249hectares of mixed agriculture and villages, and 9 193 hectares of urban land had been severely
damaged. Long-term damage to mangrove forest because of silting may become apparent only
later. The loss of mangrove forest and other coastal vegetation will have important implications
regarding protection from future tsunamis, as evidence from 2004 tsunami showed that regions
which once had extensive mangroves were relatively more damaged than regions where they
remain intact (ECJRC, 2005).
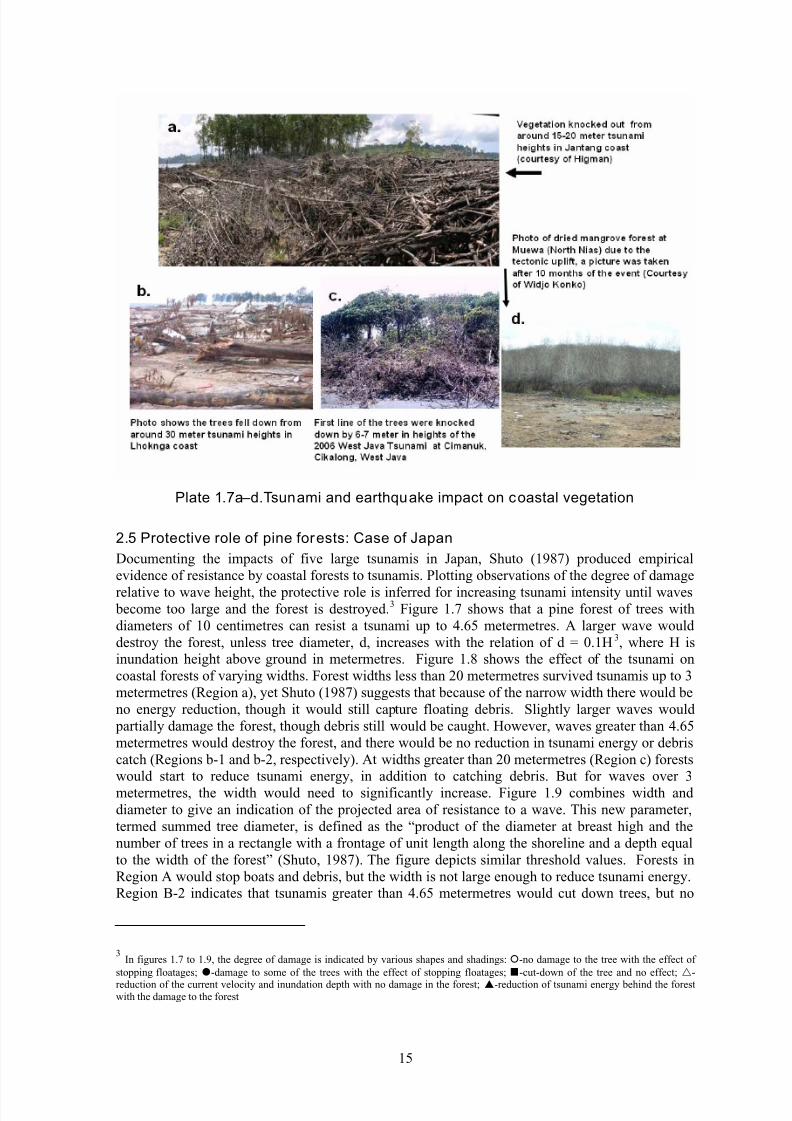
The photographs (a–d) in Plate 1.7 concur with the ECJRC (2005) reports. Plate 1.7a shows
mangrove flattened by a 15–20 metermetre tsunami at Jantang, Aceh. Large trees of 50 centimetres
in diameter were uprooted or snapped by a 30-metre tsunami along Lhoknga coast, Aceh (Plate
1.7b). The implication is that the coastal vegetation, which had an average height of 8–12metermetres, was unable to withstand a tsunami exceeding 10 metermetres, the maximum as
suggested by Mani and Parthasarathy (2006). Some literature, however, suggests that the
maximum tsunami height vegetation can withstand and still be effective in mitigating a tsunami is
much less at 6 metermetres, depending on the tree type, forest density and width (J.B. Hinwood,
pers. comm.). On the other hand, a field survey in West Java found that the forest did indeed resist
a 6–7 metermetre tsunami, with only the first line of trees collapsing, as shown in Plate 1.7c. The
final image, Plate 1.7d, documents the damage to mangroves by wave forces, deposition excessive
sediment, and impact of tectonic uplift that can occur near the earthquake epicenter. Here a rise of
two metermetres deprives the mangrove of daily tides, with the result vegetation is beginning to
dieback.
8/11/2019 ag127e02
http://slidepdf.com/reader/full/ag127e02 2/23
15
Plate 1.7a–d.Tsunami and earthquake impact on coastal vegetation
2.5 Protective role of pine forests: Case of Japan
Documenting the impacts of five large tsunamis in Japan, Shuto (1987) produced empirical
evidence of resistance by coastal forests to tsunamis. Plotting observations of the degree of damage
relative to wave height, the protective role is inferred for increasing tsunami intensity until waves become too large and the forest is destroyed.
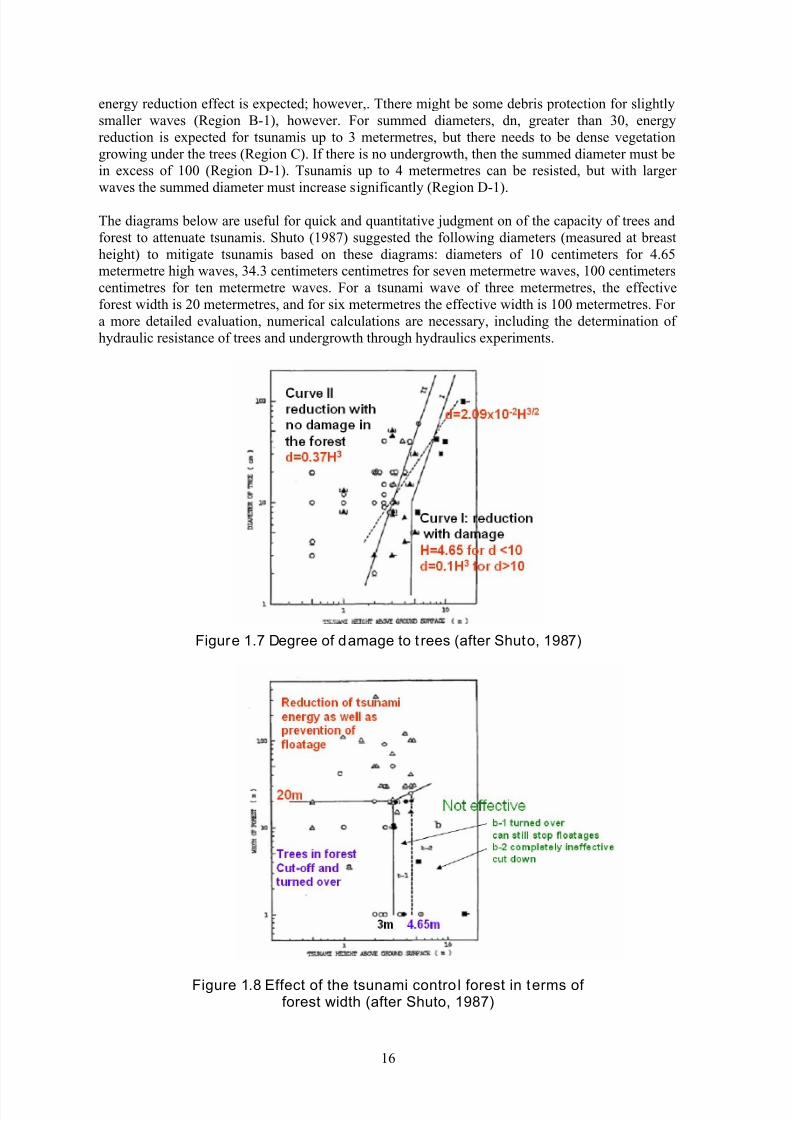
3 Figure 1.7 shows that a pine forest of trees with
diameters of 10 centimetres can resist a tsunami up to 4.65 metermetres. A larger wave would
destroy the forest, unless tree diameter, d, increases with the relation of d = 0.1H3, where H is
inundation height above ground in metermetres. Figure 1.8 shows the effect of the tsunami on
coastal forests of varying widths. Forest widths less than 20 metermetres survived tsunamis up to 3
metermetres (Region a), yet Shuto (1987) suggests that because of the narrow width there would be
no energy reduction, though it would still capture floating debris. Slightly larger waves would
partially damage the forest, though debris still would be caught. However, waves greater than 4.65
metermetres would destroy the forest, and there would be no reduction in tsunami energy or debris
catch (Regions b-1 and b-2, respectively). At widths greater than 20 metermetres (Region c) forests
would start to reduce tsunami energy, in addition to catching debris. But for waves over 3
metermetres, the width would need to significantly increase. Figure 1.9 combines width and
diameter to give an indication of the projected area of resistance to a wave. This new parameter,
termed summed tree diameter, is defined as the “product of the diameter at breast high and the
number of trees in a rectangle with a frontage of unit length along the shoreline and a depth equal
to the width of the forest” (Shuto, 1987). The figure depicts similar threshold values. Forests in
Region A would stop boats and debris, but the width is not large enough to reduce tsunami energy.
Region B-2 indicates that tsunamis greater than 4.65 metermetres would cut down trees, but no
3 In figures 1.7 to 1.9, the degree of damage is indicated by various shapes and shadings: -no damage to the tree with the effect of
stopping floatages; -damage to some of the trees with the effect of stopping floatages; -cut-down of the tree and no effect; -
reduction of the current velocity and inundation depth with no damage in the forest; -reduction of tsunami energy behind the forestwith the damage to the forest
8/11/2019 ag127e02
http://slidepdf.com/reader/full/ag127e02 3/23
16
energy reduction effect is expected; however,. Tthere might be some debris protection for slightly
smaller waves (Region B-1), however. For summed diameters, dn, greater than 30, energy
reduction is expected for tsunamis up to 3 metermetres, but there needs to be dense vegetation
growing under the trees (Region C). If there is no undergrowth, then the summed diameter must be
in excess of 100 (Region D-1). Tsunamis up to 4 metermetres can be resisted, but with larger
waves the summed diameter must increase significantly (Region D-1).
The diagrams below are useful for quick and quantitative judgment on of the capacity of trees and
forest to attenuate tsunamis. Shuto (1987) suggested the following diameters (measured at breast
height) to mitigate tsunamis based on these diagrams: diameters of 10 centimeters for 4.65
metermetre high waves, 34.3 centimeters centimetres for seven metermetre waves, 100 centimeters
centimetres for ten metermetre waves. For a tsunami wave of three metermetres, the effective
forest width is 20 metermetres, and for six metermetres the effective width is 100 metermetres. For
a more detailed evaluation, numerical calculations are necessary, including the determination of
hydraulic resistance of trees and undergrowth through hydraulics experiments.
Figure 1.7 Degree of damage to t rees (after Shuto, 1987)
Figure 1.8 Effect of the tsunami contro l forest in terms offorest width (after Shuto, 1987)

8/11/2019 ag127e02
http://slidepdf.com/reader/full/ag127e02 4/23
17
Figure 1.9 Effect o f, and damage to, the tsunami cont rol forestin terms of the summed tree diameter (after Shuto, 1987)
3 Modeling coastal forest mit igation effects on tsunamis
3.1 Fluid dynamics
The capacity of forests to mitigate the impacts of a tsunami can be estimated by fluid dynamics
models. These models, that examine the hydrodynamic relationship of a fluid moving through
vegetation, require various parameters and associated coefficients to estimate forest resistance to
tsunamis of different heights and pressures. The most important numbers to obtain are volumetric
occupancy, drag coefficient, inertia coefficient and Manning’s coefficient of roughness. These are
estimated from measurements of the diameter and height of tree trunks, height and density of thecanopy, and tree density. If the effective projection area is known, one can convert this to
volumetric occupancy, and then the Manning coefficient, drag coefficient and inertia coefficient
can be determined (Latief, 2000; Latief and Imamura, 2000; Harada et al., 2000; Harada et al.,
2002). Figure 1.10 illustrates some of the key concepts related to the hydraulic model. It shows
that volumetric occupancy is a function of the volume of water relative to the volume of
submerged trees. A stream of water striking a tree trunk and imparting impact and frictional forces,
along with the associated coefficients of inertia, Cm, and drag, Cd , is also portrayed in the figure. A
full description of the technical aspects of modeling as applied to the Pancer Bay, East Java, case
study is provided in Appendix A.

8/11/2019 ag127e02
http://slidepdf.com/reader/full/ag127e02 5/23
18
Figure 1.10 Vegetation model: Volume of submerged obstacles,volume of water and volumetric occupancy
3.2 Case of Pancer Bay, Indonesia
Located on the southern coast of East Java, Pancer Bay suffered considerable damage from the
1994 East Java tsunami. It claimed more than 121 lives or 3.8 percent of population, and destroyed
seventy percent of the houses. Approximately 250 houses were heavily damaged and 450 houses
were completely swept away. In order to gauge the mitigation effects of a coastal forest to protect
the people of Pancer village from future tsunami hazards, a simulation model was developed. The
study provides an example of application of the fluid dynamics model discussed in section 3.1
(also see Appendix A). A numerical simulation of the extent of inundation on land gives an
indication of damage reduction by coastal forest in the context of actual coastal landform and
topography of Pancer Bay.
Pancer Bay is a typical narrow bay facing directly offshore (see Figure 1.11). The bay mouth is
around 3.8 kilometres wide and there are several small islands at the front of the bay. The lowland
stretch, approximately 4.5 kilometres in length and 500 to 700 metermetres in width, is surrounded
by hills. The sand covered beach, with numerous sand dunes, has a topographical elevation of two
to eight metermetres and slopes range from five to eight percent. There is a small river behind the
village, the mouth of which is located at the western part of the bay. Daily activities are mostly
concentrated at and near the river mouth due to the presence of a fishing port and market.
8/11/2019 ag127e02
http://slidepdf.com/reader/full/ag127e02 6/23
19
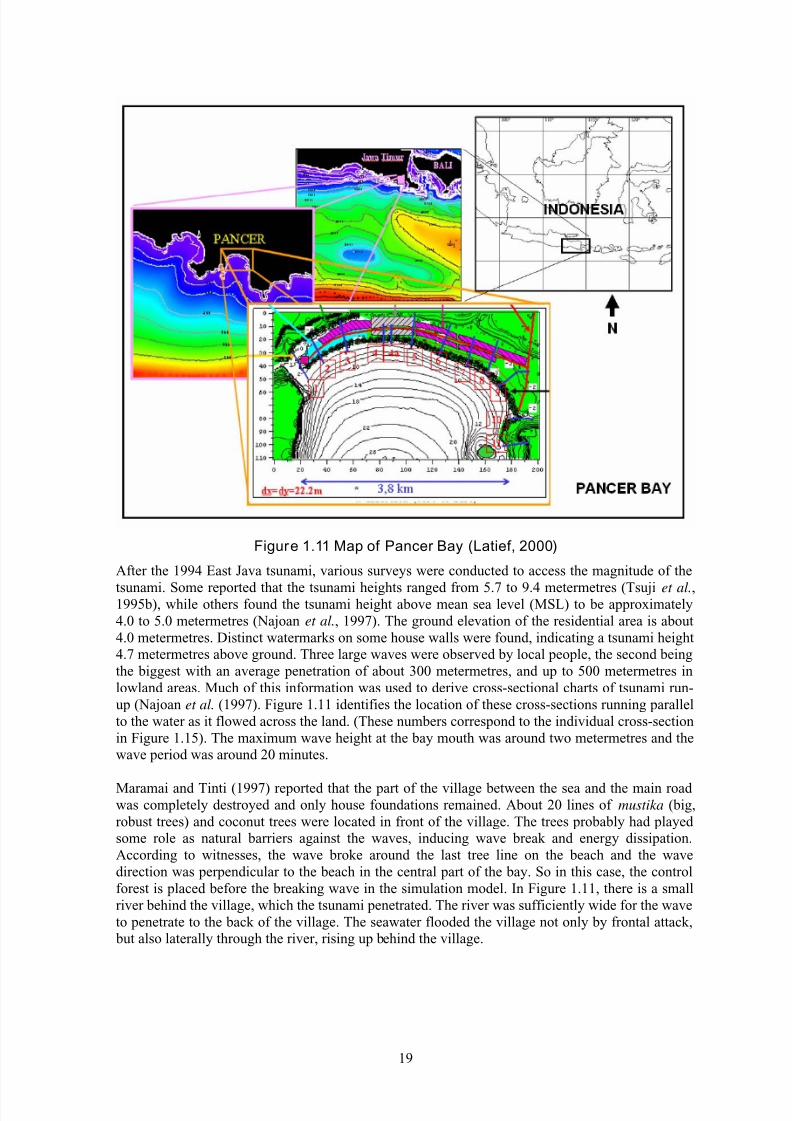
Figure 1.11 Map of Pancer Bay (Latief, 2000)
After the 1994 East Java tsunami, various surveys were conducted to access the magnitude of the
tsunami. Some reported that the tsunami heights ranged from 5.7 to 9.4 metermetres (Tsuji et al.,1995b), while others found the tsunami height above mean sea level (MSL) to be approximately
4.0 to 5.0 metermetres (Najoan et al., 1997). The ground elevation of the residential area is about
4.0 metermetres. Distinct watermarks on some house walls were found, indicating a tsunami height
4.7 metermetres above ground. Three large waves were observed by local people, the second being
the biggest with an average penetration of about 300 metermetres, and up to 500 metermetres in
lowland areas. Much of this information was used to derive cross-sectional charts of tsunami run-
up (Najoan et al. (1997). Figure 1.11 identifies the location of these cross-sections running parallel
to the water as it flowed across the land. (These numbers correspond to the individual cross-section
in Figure 1.15). The maximum wave height at the bay mouth was around two metermetres and the
wave period was around 20 minutes.
Maramai and Tinti (1997) reported that the part of the village between the sea and the main roadwas completely destroyed and only house foundations remained. About 20 lines of mustika (big,
robust trees) and coconut trees were located in front of the village. The trees probably had played
some role as natural barriers against the waves, inducing wave break and energy dissipation.
According to witnesses, the wave broke around the last tree line on the beach and the wave
direction was perpendicular to the beach in the central part of the bay. So in this case, the control
forest is placed before the breaking wave in the simulation model. In Figure 1.11, there is a small
river behind the village, which the tsunami penetrated. The river was sufficiently wide for the wave
to penetrate to the back of the village. The seawater flooded the village not only by frontal attack,
but also laterally through the river, rising up behind the village.
8/11/2019 ag127e02
http://slidepdf.com/reader/full/ag127e02 7/23
20
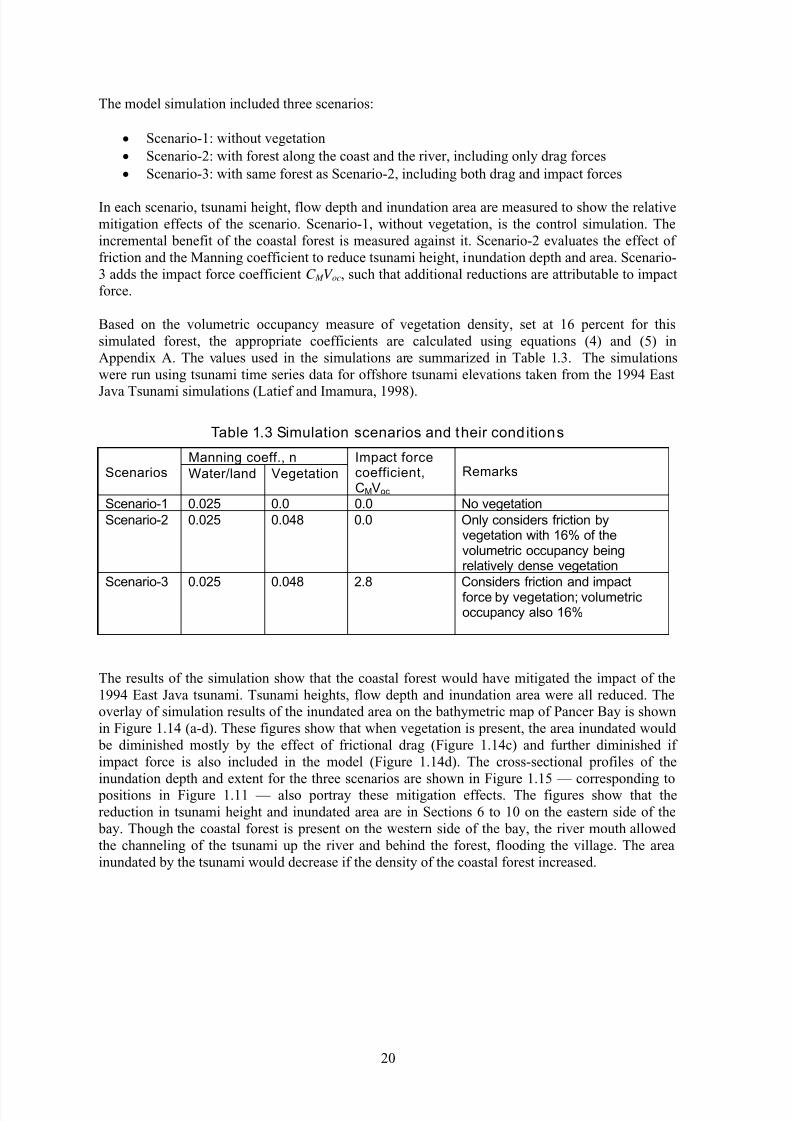
The model simulation included three scenarios:
• Scenario-1: without vegetation
• Scenario-2: with forest along the coast and the river, including only drag forces
• Scenario-3: with same forest as Scenario-2, including both drag and impact forces
In each scenario, tsunami height, flow depth and inundation area are measured to show the relative
mitigation effects of the scenario. Scenario-1, without vegetation, is the control simulation. The
incremental benefit of the coastal forest is measured against it. Scenario-2 evaluates the effect of
friction and the Manning coefficient to reduce tsunami height, inundation depth and area. Scenario-
3 adds the impact force coefficient C M V oc, such that additional reductions are attributable to impact
force.
Based on the volumetric occupancy measure of vegetation density, set at 16 percent for this
simulated forest, the appropriate coefficients are calculated using equations (4) and (5) in
Appendix A. The values used in the simulations are summarized in Table 1.3. The simulations
were run using tsunami time series data for offshore tsunami elevations taken from the 1994 East
Java Tsunami simulations (Latief and Imamura, 1998).
Table 1.3 Simulation scenarios and their conditions
Manning coeff., n Scenarios Water/land Vegetation
Impact forcecoefficient,CMVoc
Remarks
Scenario-1 0.025 0.0 0.0 No vegetation
Scenario-2 0.025 0.048 0.0 Only considers friction byvegetation with 16% of thevolumetric occupancy beingrelatively dense vegetation
Scenario-3 0.025 0.048 2.8 Considers friction and impactforce by vegetation; volumetricoccupancy also 16%
The results of the simulation show that the coastal forest would have mitigated the impact of the
1994 East Java tsunami. Tsunami heights, flow depth and inundation area were all reduced. The
overlay of simulation results of the inundated area on the bathymetric map of Pancer Bay is shown
in Figure 1.14 (a-d). These figures show that when vegetation is present, the area inundated would
be diminished mostly by the effect of frictional drag (Figure 1.14c) and further diminished if
impact force is also included in the model (Figure 1.14d). The cross-sectional profiles of the
inundation depth and extent for the three scenarios are shown in Figure 1.15 — corresponding to positions in Figure 1.11 — also portray these mitigation effects. The figures show that the
reduction in tsunami height and inundated area are in Sections 6 to 10 on the eastern side of the
bay. Though the coastal forest is present on the western side of the bay, the river mouth allowed
the channeling of the tsunami up the river and behind the forest, flooding the village. The area
inundated by the tsunami would decrease if the density of the coastal forest increased.

8/11/2019 ag127e02
http://slidepdf.com/reader/full/ag127e02 8/23
21
Figure 1.14 (a) Bathymetr ic and topography map (b) tsunami-inundated areawithout vegetation (c) with vegetation only, considering Manning’s coeffic ient
(d) with vegetation considering Manning’s roughness and impactforce coefficients (Latief, 2000)
Figure 1.15 Comparison between computed inundation heights and measuredrunup (the locations of each cross-section can be seen in Figure 1.11) (Latief, 2000)

8/11/2019 ag127e02
http://slidepdf.com/reader/full/ag127e02 9/23
22
4 Conclusions
The Indonesian and Philippine archipelagoes are vulnerable to tsunami threats because they are
located near active earthquake faults and arrival times for a tsunami can be as little as a few
minutes. In the case of the 2004 Sumatra tsunami, countries such as Thailand, Malaysia,
Bangladesh, India and Sri Lanka were further away from the epicenter and arrival time varied from
one to ten hours, allowing time for evacuation. Historical patterns of tsunami events indicate thatsooner or later a major earthquake and tsunami are likely to strike again in the Indian Ocean
region.
Though tsunami height on shore depends on the tsunami source (earthquake magnitude, distance to
source), bathymetry and coastal morphology, coastal forests have a role in mitigating the impacts
of a tsunami, within limits. The effectiveness of a forest depends on the width, density and
structure of the forest and the tree characteristics (height and diametermeter at breast height). Shuto
(1987) suggested the following diameters (measured at breast height) to mitigate tsunamis: ten
centimeters centimetres for 4.65 metermetre high waves, 34.3 centimetreres for seven meter waves,
100 centimetres centimetres for ten metermetre waves. For a tsunami wave of three metermetres,
the effective forest width is 20 metermetres and for six-metermetre high tsunami waveseight the,
effective width is 100 metermetres. These numbers apply to Japanese coastal forests, but may givean indication of mitigation for similar forests.
For other forests, such as mangroves, the effectiveness of vegetation in mitigating the effect of
tsunamis can be estimated from numerical simulations utilizing resistance coefficients such as
Manning’s roughness, drag force and inertia. In the case study reported in this paper, the authors
proposed that these coefficients can be derived from the function of the volumetric occupancy of
vegetation, V oc, which can be estimated by measuring the diametermeters of roots and trunks, tree
height and foliage via ribbon measures or digital cameras. The simulation results of the inundated
area show that vegetation can reduce tsunami wave height and current pressures up to a certain
degree. The inundated area and tsunami run-up will be decreased when the density of the coastal
forest increases.
Acknowledgements
We express sincere thanks to Prof. Fumihiko Imamura, Tsunami Engineering Laboratory, Disaster
Control Research Center, Graduate School of Engineering, Tohoku University, Japan, for his
suggestion to study the effectiveness of vegetation in mitigating tsunami force. We also express
thanks to Dr. Kenji Harada for helping us to carry out the hydraulics experiment, and Mr. Haris
Sunendar and Mr. Aditya Riadi Gusman for helping us to prepare numerical simulations. Members
of the Tsunami Research Group, Center for Marine and Coastal Development, Bandung Institute of
Technology (ITB), and Staff of Department Oceanography, Faculty of Geosciences and
Technology Mineral, ITB are acknowledged for their support. Last but not least, we wish to thank
to FAO and the Government of Finland via the OSRO/GLO/502/FIN Forestry Programme for
Early Rehabilitation in Asian Tsunami Affected Countries for their financial support to this paper.
Bibliography
Aida, I. 1977. Numerical experiment for inundation of tsunamis. Susaki and Usa, in the Kochi
Prefecture. Bulletin of Earthquake Research Institute, University of Tokyo, 52: 441–460. (In
Japanese)
Asano, T., Deguchi, H & N. Kobayashi., N. 1992. Interaction between water waves and
vegetation. In: Proc. 23th coastal eng. conf., vol. 3., pp. 2710–2723.
Dahdouh-Guebas, F & N. Koedam., N. 2006. Coastal vegetation and the Asian tsunami. Letters,
Science, 311: 37.

8/11/2019 ag127e02
http://slidepdf.com/reader/full/ag127e02 10/23
23
Danielsen, F., Sorensen, M.K., Olwig, M.F., Selvam, V., Parish, F., Burgess, N.D., Jorgensen,
E.T., Hiraishi, T., Karunagaran, V.M., Rasmussen, M.S., Hansen, L.B., Quarto, A. & N.
Suryadiputra, N. 2006. Response of the coastal vegetation and the Asian tsunami (F.
Dahdouh-Guebas and N. Koedam, 2006). Letters, Science, 311: 37–38.
European Commission Joint Research Centre (ECJRC). 2005. Mapping severe damage to S.E.
Asia’s land cover following the tsunami. FAO Web site, 8 pp.
Geist, E.L., Bilek, S.L., Arcas, D. & V.V. Titov., V.V. 2005. Differences in tsunami generation
between the December 26, 2004 and March 28, 2005 Sumatra earthquakes . Earth Planets
Space, 17 February 2006.
Goto, C. & N. Shuto., N. 1983. Effect of large obstacles on tsunami inundation, tsunamis their
science and engineering. K. Iida & T. Iwasaki, eds. Tokyo, Terra Sc. Publs. Comp. pp. 511–
525.
Goto, C. & Y. Ogawa,. Y. 1992. Numerical method of tsunami simulation with the leap-frog
scheme. Tokyo, Disaster Control Research Center, Faculty of Engineering, Tohoku University.
Hanley, R. (In preparation). Technical guidelines for reforestation of mangroves and coastal
forest in Aceh Province.
Harada, K., Latief, H. & F. Imamura,. F. 2000. Study on the mangrove control forest to reduce
tsunami impact. In: Proceedings of 12th congress of the IAHR-APD. Bangkok.Harada, K. & F. Imamura,. F. 2001. Experimental study on the resistance by mangrove under
unsteady flow. In Proc. of first Asian and Pacific coastal engineering workshop, Delian,
China, Vol. 2. pp. 975–984.
Harada, K., Latief, H. & F. Imamura., F. 2002. Effect on reducing tsunami by the green belt and
coastal permeable structure. In: International workshop on tsunami risk and its reduction in
the Asia-Pacific. ITB, 18–19 March 2002.
Hiraishi, T. & K. Harada., K. 2003. Greenbelt tsunami prevention in South Pacific region.
Report of the Port and Airport Research Institute, Vol. 42 No. 2 (June 2003).
Imamura, F. 1995. Tsunami numerical simulation with the staggered leap-frog scheme
(numerical code of TUNAMI-N1 and N2). Disaster Control Research Center, Tohoku
University, 33 pp.
ITDB/WRL. 2005. Integrated tsunami database for the world ocean., Version 5.15 of 31 July2005, CD-ROM, Tsunami Laboratory, ICMMG SD, RAS, Novosibirks, Russia.
Kanazawa, N. & Y. Mazda., Y. 1994. Tidal flow asymmetry in mangroves estuaries. Ocean
Research, 3(1): 1–11. (In Japanese)
Kotani, M., Imamura F. & N. Shuto., N. 1998. Tsunami run-up simulation and damage
estimation by using GIS. In: Proc. of coastal eng., JSCE, vol. 45 (1), pp. 356–360. (In
Japanese)
Latief, H. & F. Imamura,. F. 1998. Numerical simulation of the 1994 East Java tsunami,
Indonesia. In: Proceedings. of 11th congress of the IAHR-APD. Yogyakarta, Indonesia.
Latief, H., Harada, K. & F. Imamura. F. 1998. Hydraulic experiment for the effect of mangrove
forest to reduce tsunami force. Seminar of the 1998 Natural Disaster in Tohoku Area, Akita,
Japan.
Latief, H., Harada, K. & F. Imamura., F. 1999. Experimental and numerical studies of the effectof mangrove forest to reduce tsunami. In: Proceedings of 1999 congress of Japan Society of
Civil Eng. Tohoku Area, Sendai, Japan.
Latief, H. & F. Imamura., F. 2000. Tsunamis mitigation by using a green belt in Indonesia:
case study: Pancer Bay, East Java. In: Proceedings of 2000 congress of Japan Society of
Civil Eng. Tohoku Area, Moriyoka, Japan.
Latief, H. 2000. Study on tsunamis and their mitigation by using a green belt in Indonesia.
Tohoku University, Sendai, Japan. (Ph.D. thesis)
Latief, H., Puspito, N.T. & F. Imamura., F. 2000. Tsunami catalog and zoning in Indonesia.
Journal of Natural Disaster, Japan.
Latief, H., Natawidjaya, D.H., Sunendar, H., Gusman, A.R. & Y. Tanioka., Y. 2006. Accounts
and modeling the old and modern Sumatran tsunamis for mitigation in the future. In:
Proceedings third international conference on urban earthquake engineering, pp. 259–266.
Japan, Tokyo Institute of Technology, CUEE.
8/11/2019 ag127e02
http://slidepdf.com/reader/full/ag127e02 11/23
24
Mazda, Y., Kanazawaand, N. & E. Wolanski., E. 1995. Tidal asymmetry in mangrove creeks.
Hydrobiologia, 295: 51–58.
Mazda, Y., Mag, M., Kogo, M. & P.N. Hong., P.N. 1997a. Mangrove as a coastal protection
from waves in Tongking Delta, Viet Nam. Mangroves and Salt Marshes, 1(2): 127–135.
Mazda, Y., Wolanski, E., King, B., Sase, A. & D. Ohtsuka., D. 1997b. Drag force due to
vegetation in mangrove swamp. Mangroves and Salt Marshes, 1(3): 193–199.
Mani, S. & N. Parthasarathy., N. 2006. Tree diversity and stand structure in inland and coastal
tropical dry evergreen forests of peninsular India. Current Science, 90 (9)9: 1238–1246.
Maramai, A. & S. Tinti,. S. 1997. Coastal effect and damage due to the 3rd
June, 1994 Java
tsunami, in the prospective on tsunami hazard reduction. Advances in Natural and
Technological Hazards Research, 1–20.
Millenium Ecosystem Assessment. 2005. Ecosystems and human well-being: synthesis.
Washington, DC, Island Press. 137 pp.
Natawidjaja, D.H. 2002. Neotectonics of Sumatran fault and paleogeodesy of the Sumatran
subduction zone. Pasadena, California, California Institute of Technology. (Ph.D. thesis)
Najoan, T.F., Syamsuddin & Kardana. 1997. Penelitian Tipe Bangunan Air Tahan Gelombang
Bencana Tsunami pada Pantai Kawasan Barat Indonesia., Puslitbang Air, Dep. Pekerjaan
Umum, Bandung, Indonesia No. 20/LIT-04/1997. (In Indonesian) Noji, M., Imamura, F. & N. Shuto., N. 1993. Numerical simulation of movement of large rocks
transported by tsunamis. In: Proc. Of IUGG/IOC international symposium, Wakayama,
Japan, pp. 189–197.
Petryk, S. & G. Bosmijian., G. 1975. Analysis of flow through vegetation. Journal of Hydraulics
Div., ASCE: 871–884.
Shia-gai, H. & T. Maruyama., T. 1988. Measurement of wind drag forces on trees. Journal of
Natural Disaster Science, 10 (2): 25–33.
Shuto, N. 1987. The effectiveness and limit of tsunami control forest. Coastal Engineering in
Japan, 30 (1): 143–153.
Sieh, K., Natawidjaja, D.H., Chlieh, M., Galetzka, J., Avouac, J.-P., Suwargadi, B. & R.L.
Edwards., R.L. 2004. The giant subduction earthquakes of 1797 and 1833, West Sumatra:
characteristic couplets, uncharacteristic slip. Eos Trans. AGU, 85(47) Fall Meet. Suppl.,Abstract T12B-04.
Synolakis, C.E., Imamura, F., Tsuji, Y., Matsutomi, H., Tinti, S., Cook, B., Chandra, Y.P. & M.
Usman., M. 1995. Damage conditions of East Java tsunami of 1994 analyzed. EOS Trans.
AGU, 76(26): 257 & 261–262.
Tsuji, Y., Imamura, F., Matsutomi, H., Synolakis, C.E., Nanang, T.P., Jumadi, Harada, S., Han,
S.S., Arai, K. & B. Cook., B. 1995b. Field survey of the East Java earthquake and tsunami
at 3 June, 1994. Topical Issues of Tsunami 1992–94, Pure and Applied Geophysics, 144(3/4):
839–854.
UNEP–WCMC. 2006. In the front line: shoreline protection and other ecosystem services
from mangroves and coral reefs. Cambridge, UNEP–WCMC. pp. 33.
Wolanski, E, Jones, M. & J.S. Bunt., J.S. 1980. Hydrodynamics of a tidal creek-mangrove
swamp system. Australian Journal of Marine and Freshwater Research, 31: 431–450.Wolanski, E., Mazda, Y. & P. Ridd., P. 1992. Mangrove hydrodynamics. In: A.I. Robertson &
D.M. Alongi, (eds.) Tropical mangrove ecosystems, pp. 43–62. American Geophysical Union.

8/11/2019 ag127e02
http://slidepdf.com/reader/full/ag127e02 12/23
25
Appendix A Technical notes on model ing coastal forestmitigation effects on tsunamis
The following is a technical presentation on the modeling of mitigation effect by coastal forests on
tsunamis. Part A.1 outlines the necessary coefficients for the numerical simulation of the
hydrodynamic impact of vegetative barrier to flow of tsunami wave. Typically, these coefficients
are difficult to determine in the field, so that the hydraulics experiments are conducted in
laboratory wave tanks to estimate the coefficient values. Part A.2 chronicles the current research in
this area, and presents a new approach based on the concept of volumetric occupancy. The final
part, A.3, presents the derivation of momentum used to simulate the tsunami inundation on land
and through vegetation. The set up for the numerical simulation in the Pancer Bay case study is
also presented.
A.1 Estimation of model coefficients
Manning’s coefficients of roughness (n)
Various Manning’s coefficients of roughness have been estimated through experiments over the
years. Table A.1 provides a select list of Manning coefficients typically used for calculating water
flow through different types of vegetation and residential areas.
Table A.1 Manning’s coeffic ient of roughness for forest and housing
Aida (1977)
Kotani et al. (1998)
Categories Roughness CategoriesEstimatedcoefficients
Dense vegetation 0.07High densityresidential area
0.08
Relatively densevegetation 0.05 Middle densityresidential area 0.06
Nearshore,including trees
0.04Low densityresidential area
0.04
Others 0.02 Forest 0.03
Rice field 0.02
Water area,rivers and trees 0.025
Drag coeffic ient (CD)
Petryk and Bosmajian (1975) introduced a method of hydraulic force balance to estimate
Manning’s coefficient due to vegetation and boundary roughness. They suggested that a flow is
resisted mainly due to the drag force exerted by vegetation. Because a stand of trees projects anarea of resistance to the flow of water through it, vegetation density can be inferred from the ratio
between the projection area and water flow through the vegetation. They also proposed a
relationship between Manning’s coefficients of roughness, n, and drag coefficient, C D as follows:
43
2
2
D iC A R
ng AL
∑⎛ ⎞= ⎜ ⎟
⎝ ⎠ (1)
where( ) AL Ai /∑
is vegetation density in the channel, R is the hydraulics radius, A is the cross-
section area of flow, L is the length of channel reach being considered, C D is the drag coefficient
for vegetation, Ai is the projected area of ith plant and g is the gravitational acceleration.

8/11/2019 ag127e02
http://slidepdf.com/reader/full/ag127e02 13/23
26
To estimate the drag coefficient, CD , Mazda et al. (1997a) introduced vegetation length, L E as a
parameter related to the projected area of the vegetation, A, and the volume of the submerged
vegetation, V M . The vegetation value length depends on mangrove species and water depth. They
proposed for tidal and wind-induced waves,
E D Lu
gI C 2
2
= (2)
where I is water surface slope, u is flow velocity and g is gravity acceleration. C D can be calculated
if L E , I and u are measured. For a tsunami equation (2) can be re-written as follows:
⎟ ⎠
⎞⎜⎝
⎛ +
∂+
∂
∂= gI
dx
uu
t
u L
uC
E D 2
2
(3)
Inertia coeffic ient (CM)
As a tsunami has transient waves, the inertia coefficient should be considered. Noji et al. (1993)
carried out experiments and numerical analyseis on the movement of rocks by tsunamis. Theydisaggregated them into the drag force and the impact force, of which the impact force is inertia
force due to a tsunami wave striking. The drag coefficient, C D, was evaluated to be in the order of 2
to 6 and the inertia coefficient, C M , in the order of 2 (when the rock model was completely
submerged). Latief (2000) proposed C M as a function of volumetric occupancy of vegetation (see
equation 5) and Hiraishi and Harada (2003) proposed an inertia coefficient C M of about 1.7 for
flow through vegetation.
A.2 Hydraul ics experiments
Hydraulic experiments are designed to understand the dynamics and unsteady behaviour of a
tsunami passing through a mangrove forest and the effectiveness of the forest in reducing tsunami
impact. The mangrove model consists of three components: leaves, trunks and roots. Hydraulicresistances due to both boundary and vegetation roughness (Manning’s roughness coefficient, n,
and drag coefficient, C D, and the inertia coefficient, C M ) have been evaluated by Latief and Harada
at the Tsunami Engineering Laboratory, DCRC Tohoku University. A similar experiment was also
conducted by Harada and Hiraishi in the Port and Airport Research Institute, Japan. The results of
the hydraulic experiment on the effect of mangrove forest in mitigating tsunami force are described
by Latief et al. (1998), while Latief et al. (1999) elaborate on experimental and numerical studies
on the effect of mangrove forest in mitigating tsunami force. Other notable hydraulic experiments
of a similar nature include:
• Latief and Imamura (2000) studied tsunami mitigation via green belts in a case study of
Pancer Bay, East Java, Indonesia.
• Latief (2000) studied tsunamis and their mitigation by a green belt in Indonesia.
• Harada et al. (2000) and Harada and Imamura (2001) studied a mangrove control forest to
reduce tsunami impact and conducted an experimental study on mangrove resistance under
unsteady flow.
• Harada et al . (2002) described tsunami force mitigation by green belts and permeable
coastal structures.
• Hiraishi and Harada (2003) described green belts for tsunami attenuation in the South
Pacific.
All these experiments were conducted to determine the hydraulic resistance due to boundary
roughness and vegetation. Common to each is the measurement of water elevation and velocity,
which are measured at points before, at and behind model forest. Measurements are captured as atime series as the wave is generated and first strikes, and passes through the vegetation. Figure A.1
8/11/2019 ag127e02
http://slidepdf.com/reader/full/ag127e02 14/23
27
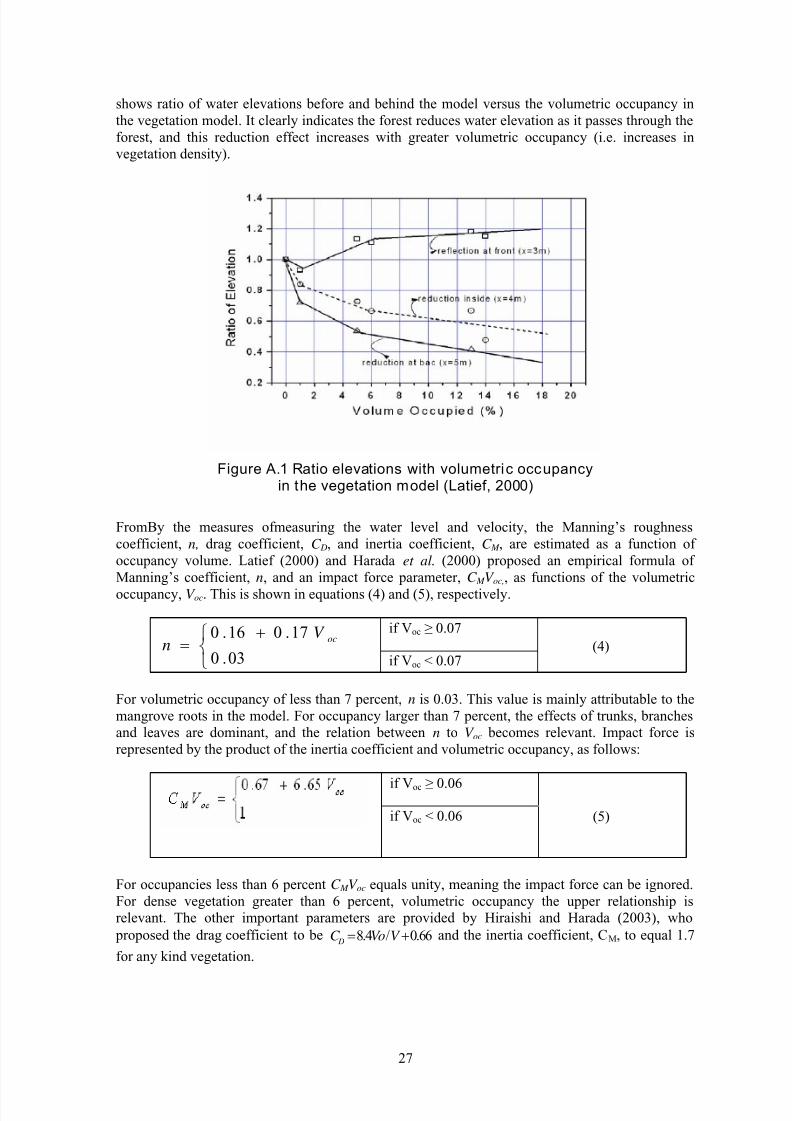
shows ratio of water elevations before and behind the model versus the volumetric occupancy in
the vegetation model. It clearly indicates the forest reduces water elevation as it passes through the
forest, and this reduction effect increases with greater volumetric occupancy (i.e. increases in
vegetation density).
Figure A.1 Ratio elevations with volumetric occupancyin the vegetation model (Latief, 2000)
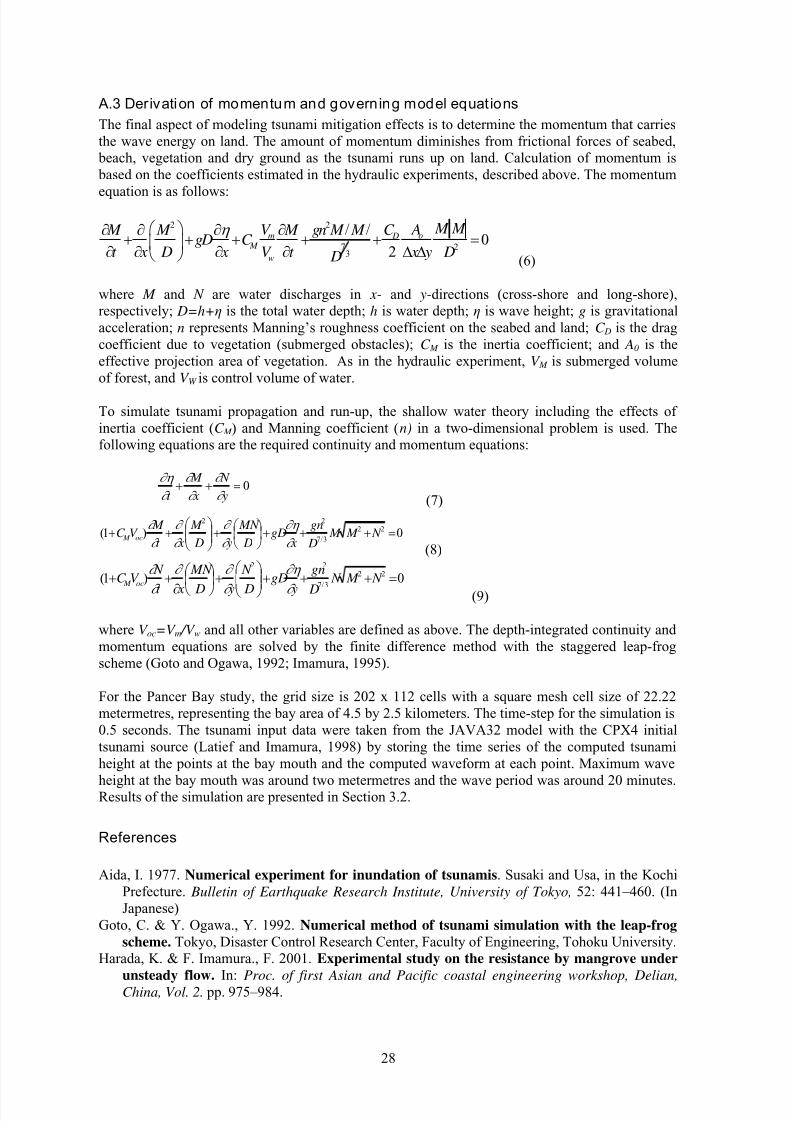
FromBy the measures ofmeasuring the water level and velocity, the Manning’s roughness
coefficient, n, drag coefficient, C D, and inertia coefficient, C M , are estimated as a function of
occupancy volume. Latief (2000) and Harada et al. (2000) proposed an empirical formula of
Manning’s coefficient, n, and an impact force parameter, C M V oc,, as functions of the volumetric
occupancy, V oc. This is shown in equations (4) and (5), respectively.
if Voc ≥ 0.07
⎩⎨⎧ +
=03.0
17.016.0 ocV n
if Voc < 0.07
(4)
For volumetric occupancy of less than 7 percent, n is 0.03. This value is mainly attributable to the
mangrove roots in the model. For occupancy larger than 7 percent, the effects of trunks, branches
and leaves are dominant, and the relation between n to V oc becomes relevant. Impact force is
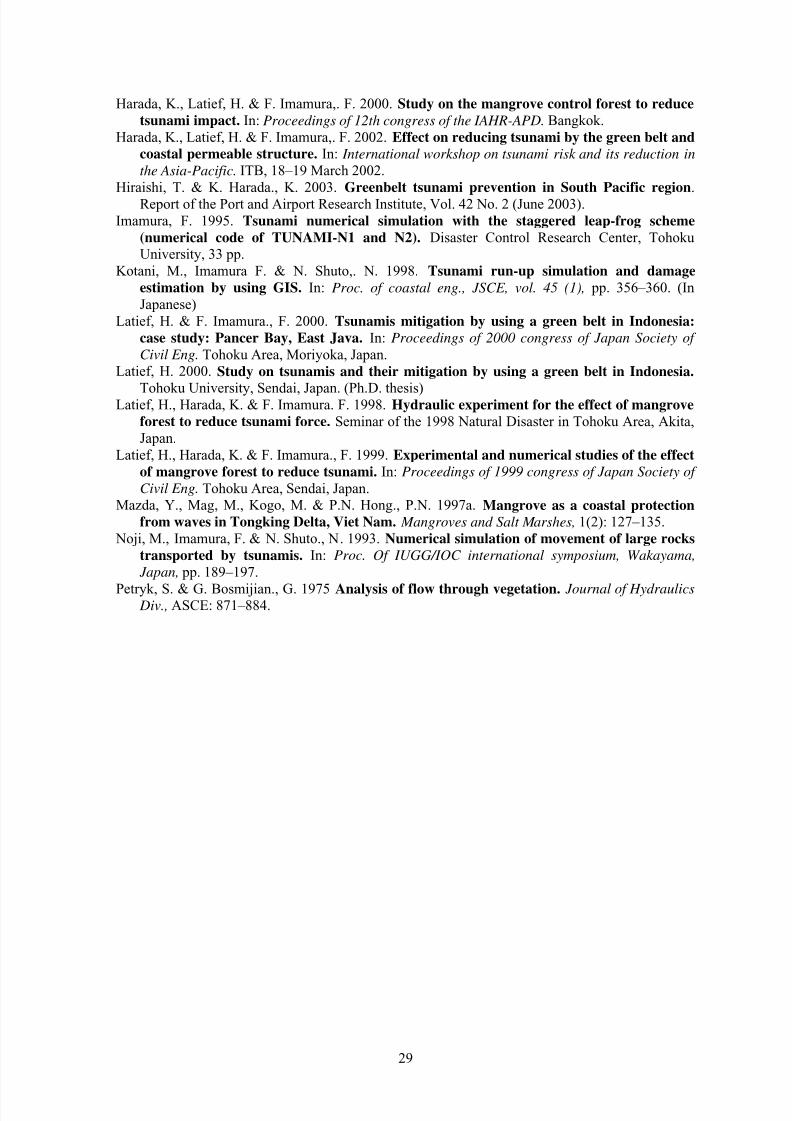
represented by the product of the inertia coefficient and volumetric occupancy, as follows:
if Voc ≥ 0.06
if Voc < 0.06 (5)
For occupancies less than 6 percent C M V oc equals unity, meaning the impact force can be ignored.
For dense vegetation greater than 6 percent, volumetric occupancy the upper relationship is
relevant. The other important parameters are provided by Hiraishi and Harada (2003), who
proposed the drag coefficient to be 8.4 / 0.66 D
C Vo V = + and the inertia coefficient, CM, to equal 1.7
for any kind vegetation.
8/11/2019 ag127e02
http://slidepdf.com/reader/full/ag127e02 15/23
28
A.3 Derivation of momentum and governing model equations
The final aspect of modeling tsunami mitigation effects is to determine the momentum that carries
the wave energy on land. The amount of momentum diminishes from frictional forces of seabed,
beach, vegetation and dry ground as the tsunami runs up on land. Calculation of momentum is
based on the coefficients estimated in the hydraulic experiments, described above. The momentum
equation is as follows:
2 2
7 23
/ /0
2
m o D M
w
M M V AC M M M gn M M gD C
t x D x V t x y D D
η ⎛ ⎞∂ ∂ ∂ ∂+ + + + + =⎜ ⎟
∂ ∂ ∂ ∂ Δ Δ⎝ ⎠ (6)
where M and N are water discharges in x- and y-directions (cross-shore and long-shore),
respectively; D=h+η is the total water depth; h is water depth; η is wave height; g is gravitational
acceleration; n represents Manning’s roughness coefficient on the seabed and land; C D is the drag
coefficient due to vegetation (submerged obstacles); C M is the inertia coefficient; and A0 is the
effective projection area of vegetation. As in the hydraulic experiment, V M is submerged volume
of forest, and V W is control volume of water.
To simulate tsunami propagation and run-up, the shallow water theory including the effects of
inertia coefficient (C M ) and Manning coefficient (n) in a two-dimensional problem is used. The
following equations are the required continuity and momentum equations:
∂η
∂
∂
∂
∂
∂ t
M
x
N
y+ + = 0
(7)
0)1( 22
3/7
22
=+++⎟ ⎠
⎞⎜⎝
⎛ +⎟⎟
⎠
⎞⎜⎜⎝
⎛ ++ N M M
D
gn
xgD
D
MN
y D
M
xt
M V C oc M
∂
∂η
∂
∂
∂
∂
∂
∂
(8)
0)1( 22
3/7
22
=+++⎟⎟
⎠
⎞⎜⎜
⎝
⎛ +⎟
⎠
⎞⎜
⎝
⎛
∂
++ N M N
D
gn
y
gD
D
N
y D
MN
xt
N V C
oc M
∂
∂η
∂
∂ ∂
∂
∂
(9)
where V oc=V m /V w and all other variables are defined as above. The depth-integrated continuity and
momentum equations are solved by the finite difference method with the staggered leap-frog
scheme (Goto and Ogawa, 1992; Imamura, 1995).
For the Pancer Bay study, the grid size is 202 x 112 cells with a square mesh cell size of 22.22
metermetres, representing the bay area of 4.5 by 2.5 kilometers. The time-step for the simulation is
0.5 seconds. The tsunami input data were taken from the JAVA32 model with the CPX4 initial
tsunami source (Latief and Imamura, 1998) by storing the time series of the computed tsunami
height at the points at the bay mouth and the computed waveform at each point. Maximum wave
height at the bay mouth was around two metermetres and the wave period was around 20 minutes.Results of the simulation are presented in Section 3.2.
References
Aida, I. 1977. Numerical experiment for inundation of tsunamis. Susaki and Usa, in the Kochi
Prefecture. Bulletin of Earthquake Research Institute, University of Tokyo, 52: 441–460. (In
Japanese)
Goto, C. & Y. Ogawa., Y. 1992. Numerical method of tsunami simulation with the leap-frog
scheme. Tokyo, Disaster Control Research Center, Faculty of Engineering, Tohoku University.
Harada, K. & F. Imamura., F. 2001. Experimental study on the resistance by mangrove under
unsteady flow. In: Proc. of first Asian and Pacific coastal engineering workshop, Delian,China, Vol. 2. pp. 975–984.
8/11/2019 ag127e02
http://slidepdf.com/reader/full/ag127e02 16/23
29
Harada, K., Latief, H. & F. Imamura,. F. 2000. Study on the mangrove control forest to reduce
tsunami impact. In: Proceedings of 12th congress of the IAHR-APD. Bangkok.
Harada, K., Latief, H. & F. Imamura,. F. 2002. Effect on reducing tsunami by the green belt and
coastal permeable structure. In: International workshop on tsunami risk and its reduction in
the Asia-Pacific. ITB, 18–19 March 2002.
Hiraishi, T. & K. Harada., K. 2003. Greenbelt tsunami prevention in South Pacific region.
Report of the Port and Airport Research Institute, Vol. 42 No. 2 (June 2003).
Imamura, F. 1995. Tsunami numerical simulation with the staggered leap-frog scheme
(numerical code of TUNAMI-N1 and N2). Disaster Control Research Center, Tohoku
University, 33 pp.
Kotani, M., Imamura F. & N. Shuto,. N. 1998. Tsunami run-up simulation and damage
estimation by using GIS. In: Proc. of coastal eng., JSCE, vol. 45 (1), pp. 356–360. (In
Japanese)
Latief, H. & F. Imamura., F. 2000. Tsunamis mitigation by using a green belt in Indonesia:
case study: Pancer Bay, East Java. In: Proceedings of 2000 congress of Japan Society of
Civil Eng. Tohoku Area, Moriyoka, Japan.
Latief, H. 2000. Study on tsunamis and their mitigation by using a green belt in Indonesia.
Tohoku University, Sendai, Japan. (Ph.D. thesis)Latief, H., Harada, K. & F. Imamura. F. 1998. Hydraulic experiment for the effect of mangrove
forest to reduce tsunami force. Seminar of the 1998 Natural Disaster in Tohoku Area, Akita,
Japan.
Latief, H., Harada, K. & F. Imamura., F. 1999. Experimental and numerical studies of the effect
of mangrove forest to reduce tsunami. In: Proceedings of 1999 congress of Japan Society of
Civil Eng. Tohoku Area, Sendai, Japan.
Mazda, Y., Mag, M., Kogo, M. & P.N. Hong., P.N. 1997a. Mangrove as a coastal protection
from waves in Tongking Delta, Viet Nam. Mangroves and Salt Marshes, 1(2): 127–135.
Noji, M., Imamura, F. & N. Shuto., N. 1993. Numerical simulation of movement of large rocks
transported by tsunamis. In: Proc. Of IUGG/IOC international symposium, Wakayama,
Japan, pp. 189–197.
Petryk, S. & G. Bosmijian., G. 1975 Analysis of flow through vegetation. Journal of Hydraulics Div., ASCE: 871–884.

8/11/2019 ag127e02
http://slidepdf.com/reader/full/ag127e02 17/23

8/11/2019 ag127e02
http://slidepdf.com/reader/full/ag127e02 18/23
31
Appendix B Glossary of Technical Terms
Tsunami
Arrival time: Time of arrival, usually of the first wave, of the first wave of the tsunami at a
particular location.
Crust: The outer layer of the earth's surface.Earthquake: Shaking of the earth caused by a sudden movement of rock beneath its surface.
Epicenter: That point on the earth's surface directly above the hypocenter of an earthquake.
Fault: A weak point in the earth's crust where the rock layers have ruptured and slipped.
Horizontal inundation distance: The distance that a tsunami wave penetrates onto the shore,
measured horizontally from the mean sea-level position of the water's edge. Usually measured as
the maximum distance for a particular segment of the coast.
Intensity: A measure of the effects of an earthquake at a particular place on humans and/or
structures. The intensity at a point depends not only upon the strength of the earthquake
(magnitude), but also upon the distance from the earthquake to the epicenter and the local geology
at that point.
Inundation: The depth, relative to a stated reference level, to which a particular location is
covered by water.
Inundation area: An area that is flooded with water.
Inundation line (limit): The inland limit of wetting measured horizontally from the edge of the
coast defined by mean sea level.
Local/regional tsunami: Source of the tsunami within 1 000 kilometres of the area of interest.
Local or near-field tsunami waves have a very short travel time (30 minutes or less), mid-field or
regional tsunami waves have travel times on the order of 30 minutes to two hours. Note: " Local"
tsunami is sometimes used to refer to a tsunami of landslide origin.
Ms (Surface Wave Magnitude): Magnitude of an earthquake as measured from the amplitude of
seismic surface waves. Often referred to by the media as "Richter" magnitude.
Mw (Moment Magnitude): Magnitude based on the size and characteristics of the fault rupture,
and determined from long-period seismic waves. It is a better measure of earthquake size thansurface wave magnitude.
Magnitude: A quantitative measure of the strength of an earthquake.
Major earthquake: An earthquake having a magnitude of 7 or greater on the Richter scale.
Period: The length of time between two successive peaks or troughs. May vary due to complex
interference of waves. Tsunami periods generally range from five to 60 minutes.
Plate: Pieces of crust and brittle uppermost mantle, perhaps 100 kilometres thick and hundreds or
thousands of kilometres wide, that cover the earth's surface. The plates move very slowly over, or
possibly with, a viscous layer in the mantle at rates of a few centimetres per year.
Plate tectonics: A widely accepted theory that relates most of the geologic features near the earth's
surface to the movement and interaction of relatively thin rock plates. The theory predicts that most
earthquakes occur when plates move past each other.
Recurrence interval: The approximate average length of time between earthquakes in a specificseismically active area.
Richter magnitude scale: The system used to measure the strength or magnitude of an
earthquake. The Richter magnitude scale was developed in 1935 by Charles F. Richter of the
California Institute of Technology.
Runup: Maximum height of the water onshore observed above a reference sea level. Usually
measured at the horizontal inundation limit.
Rupture zone: The area of the earth through which faulting occurred during an earthquake. For
very small earthquakes, this zone could be the size of a pinhead, but in the case of a great
earthquake, the rupture zone may extend several hundred kilometres in length and tens of
kilometres in width.
Seismic: Pertaining to earthquakes.
Seismicity: Earthquake activity.Seismic zone: A region in which earthquakes are known to occur.
8/11/2019 ag127e02
http://slidepdf.com/reader/full/ag127e02 19/23
32
Subduction: The process in which one lithospheric plate collides with and is forced down under
another plate and is drawn back into the earth's mantle.
Subduction zone: The zone of convergence of two tectonic plates, one of which is subducted
beneath the other. An elongated region along which a plate descends relative to another plate.
Tectonic: Pertaining to the forces involved in the deformation of the earth's crust, or the structures
or features produced by such deformation.
Teletsunami: Source of the tsunami more than 1 000 kilometres away from the area of interest.
Also called a distant-source or far-field tsunami.
Tidal wave: Common term for tsunami used in older literature, historical descriptions and popular
accounts. Tides, caused by the gravitational attractions of the sun and moon, may increase or
decrease the impact of a tsunami, but have nothing to do with their generation or propagation.
Travel time: Time (usually measured in hours and tenths of hours) that it took the tsunami to
travel from the source to a particular location.
Tsunami: A Japanese term derived from the characters "tsu" meaning harbour and "nami"
meaning wave. Now generally accepted by the international scientific community to describe a
series of traveling waves in water produced by the displacement of the sea floor associated with
submarine earthquakes, volcanic eruptions, or landslides.
Tsunami height: The vertical distance between a tsunami crest and mean sea level (MSL) at theshoreline.
Tsunami magnitude: A number which characterizes the strength of a tsunami based on the
tsunami wave amplitudes. Several different tsunami magnitude determination methods have been
proposed.
Hydraulics
Drag force: resistance to the movement of a solid object through a fluid. Drag is made up of
friction forces, which act in a direction parallel to the object's surface, plus pressure forces, which
act in a direction perpendicular to the object's surface.
Drag coefficient (CD): A dimensionless quantity that describes a characteristic amount of
aerodynamic drag caused by fluid flow, used in the drag equation. Two objects of the same frontalarea moving at the same speed through a fluid will experience a drag force proportional to their C d
numbers.
Friction: The force that resists the (sliding) motion of two surfaces in contact. The force of friction
is present everywhere two objects are in contact. It is easily observed when one attempts to
displace a block sitting atop a table.
Friction coefficient: A material property, defined as the ratio of the Friction force (F) to the
Normal (N) force.
Friction force: The product of the coefficient of friction and the Normal force. The coefficient of
friction can be static or kinetic, and varies according to the material properties; its value is
determined experimentally.
Green belt: Land use designation used in land-use planning to retain areas of largely undeveloped,
wild, or agricultural land surrounding or neighbouring urban areas.Inertia (physics): The tendency of a body to maintain its state of rest or uniform motion unless
acted upon by an external force.
Inertia coefficient: A dimensionless quantity that describes a characteristic of a body to maintain
its state of rest upon contact with an external force, i.e. a high velocity collision (an impact).
Inertia force: In simple terms "In an isolated system, a body at rest will remain at rest and a body
moving with constant velocity will continue to do so, unless disturbed by an unbalanced force".
Impact force: A high velocity collision (an impact) does not provide sufficient time for these
deformations and vibrations to occur.
Roughness or rugosity: A measurement of the small-scale variations in the height of a physical
surface as it causes friction, wear, drag and fatigue.
Volumetric occupancy: A volume of water passing through trees or forest occupied by submerged
roots and tree trunks.
8/11/2019 ag127e02
http://slidepdf.com/reader/full/ag127e02 20/23
33
Field study presentation: The role of coastal vegetation in protecting theThai coast against the 2004 tsunami
Absornsuda Siripong, Chulalongkorn University, Thailand
The main impacts of the tsunami on coastal wetlands included loss or degradation of mangroveand seagrass beds, siltation of the coastal ecosystem and major changes to coastal features and
land productivity. The mangroves diminished wave energy and so afforded some measure of
protection to the infrastructure behind them. Damage from the tsunami could have been mitigated
if more coastal areas had maintained their protective shields of mangrove swamps, beach forest
and coral reefs. Erosion and sedimentation properties from the tsunami’s runup and rundown were
analysed for implementing coastal rehabilitation activities. There was less damage to the
mangrove coast compared to the sandy beach at Prathong Island. Erosion and sediment transport
from tsunami wave and wind wave action were studied at Ban Thao Bay, Phuket. Rehabilitation
for coastal protection was recommended.
Green belt effects vary according to coastal topography. In some areas, mangroves can prevent
people or properties from being washed out to sea by a powerful tsunami wave. They form a protective buffer, stabilize sediments, reduce shoreline and riverbank erosion, regulate flooding
and recycle nutrients.
It can be concluded that coastal forests provided significant protection where there was sufficient
density of intact forest. Degraded forest or widely spaced trees afforded little protection. The
situation varied significantly between sites and was influenced by different factors. There is strong
justification for protection of remaining coastal forests and for immediate support for
rehabilitation. In-depth experience must be available in the region for rehabilitation techniques —
but information is scattered and not available to many of the affected communities.
Field study presentation: Outcomes of the project “In-depth assessment ofmangroves and other coastal forests affected by the tsunami in SouthernThailand”
Chongrak Wachrinrat, Kasetsart University, Thailand
The study assessed the impact of the 2004 Indian Ocean tsunami on mangroves and other coastal
forests in Thailand. Large trees of Casuarina equisetifolia were uprooted and some mangrove trees
(for example Avicennia alba and Xylocarpus sp.) were damaged. Conversely, trees of Rhizophora
sp. were left undamaged, presumably due to their sizeable and stable stilt roots and the high tree
density in the forest.
The study revealed that the dominant species of beach forests were Casuarina equisetifolia ,
Barringtonia asiatica, Terminalia catappa, Syzygium sp., Pouteria obovata, Derris indica and
Callophyllum inophyllum. Dominant species of mangroves were Rhizophora apiculata, R.
mucronata, Avicennia alba and Sonneratia ovata. The regeneration of the beach forest after the
tsunami was low, particularly for the dominant species. Casuarina sp. and Derris indica succeeded
in competing with other pioneer species, while remaining pioneer species (including Gloriosa
superba, Ipomoea pescaprae and Chromolaena odoratum) rapidly occupied the gaps left in the
area. With regard to mangroves, few seedlings were found in the sample plots and regeneration
was very difficult owing to accumulated sand from the tsunami runup and rundown and the high
percentage of mud on the forest soil. The sole exception was Rhizophora apiculata , the seedlings of
which were found in relatively high numbers.
8/11/2019 ag127e02
http://slidepdf.com/reader/full/ag127e02 21/23
34
Field study presentation: Understanding tsunami impacts f rom reef is landperspectives — experience from the Maldives
Mohamed Al i, Ministry of Environment, Energy and Water, the Maldives
The Maldives comprise various types of islands and atolls and host six main ecosystems, i.e.
coastal vegetation, evergreen moist forests, mangroves, “pond” ecosystems, coral reefs andseagrass beds. The evergreen moist forests house more that 490 different species, some of which
are endemic, rare, threatened, or endangered. Mangroves grow along the coast of 150 islands; the
13 mangrove species are often associated with enclosed or semi-enclosed brackish waterbodies
(kulhi), or with marshes (chasbin), but no estuarine mangroves exist in the country. Coastal
erosion and other damage induced by the impact of the Indian Ocean tsunami in 2004 were studied
in different islands; the degree of damage generated by the hazard was related to the size,
orientation and location of the islands.
Results indicated that the following factors had a relevant importance in affecting the impact of the
tsunami on the islands: (1) proportion of passages (open/closed); (2) orientation (east–west,
north–south); (3) reef type (faro , patch); (4) island form (ridge, bowl-shaped); (5) island shape
(circular, elongated); (6) size (small, medium, large); and (7) modifications (harbour,
reclamation). The shape of coral reefs, the height of the island and the development of beach
ridges were significant factors for reducing damage.
8/11/2019 ag127e02
http://slidepdf.com/reader/full/ag127e02 22/23
35
Key points and observations emphasized in the discussions
The technical paper, field study presentations and discussions undertaken during this session
highlighted that mangroves and other coastal forests may afford protection to lives and resources
against a tsunami strike, but several factors influence the severity of tsunami damage; these include
inter alia the steepness of the beach, the configuration of the coastline, topography,
geomorphology, direction of the tsunami and the properties of the existing coastal vegetation.
The following factors were identified:
1. Tsunami characteristics are very different from normal waves; they are, in effect, “walls of
water” of great width and with sustained force and velocity that cannot easily be reduced.
2. Trees and coastal forests can help in mitigating the impacts of tsunamis; however, whether
they are effective and the degree of their effectiveness depend on many variables. Coastal
forests and trees will not help in the case of very large tsunamis.
3. The effectiveness of trees and forests in reducing tsunami impacts depends on the width,
density and structure of the vegetation (e.g. the threshold of effective hydraulic resistance for a
tsunami of 4.65-metre height appears to be approximately 10 centimetres in diametre.4. Narrow strips of coastal trees can exacerbate the damage if trees collapse and add to the
floating debris carried inland by the tsunami.
5. According to the numerical models described, coconuts provide little or no protection against
tsunamis owing to their tall and slender profile and superficial rooting system. Similarly,
mangrove forests, if not dense, wide and healthy, can provide only little protection.
6. Most human mortality from the 2004 tsunami occurred in areas where the original natural
vegetation was beach forest, often modified by human development, rather than areas where
the original vegetation was mangrove forests; this was probably because beach forest areas
provide more attractive areas for human habitation and tourist development.
7. The impacts of tsunamis on reef islands are very different than in other areas and coastalvegetation may have very little influence on these islands relative to other factors such as reef
type, island form and size, orientation, coastal slope and human modifications.
During the session, the experts emphasized and recommended that:
1. Communication between research modellers, biologists, botanists and foresters should be
initiated or strengthened; this collaboration is urgent to ensure that realistic biophysical
characteristics and parametres are incorporated into models.
2. Studies of tsunami impacts need to consider both the runup and rundown effects of waves
(both of which are important and may have differing impacts).
3. There is a need for greater clarity and definition of the terms that are used in describing
tsunami characteristics and their impacts in research and literature.
4. Studies of tsunami impacts and mitigation need to assess the numerous factors and
complexities that influence tsunami damage rather than individual factors in isolation.
5. Effective early warning systems and evacuation plans are essential for saving lives from the
impact of a tsunami.
6. The value of peatlands and wetlands in mitigating the impacts of tsunamis should receive
greater recognition.

8/11/2019 ag127e02
http://slidepdf.com/reader/full/ag127e02 23/23