Africa’s Project Pipeline for -...
26
Africa’s Project Pipeline for Infrastructure in the Context of the Global Financial Crisis INFRA Platform Partners Forum Brussels, July 2009
Transcript of Africa’s Project Pipeline for -...

Africa’s Project Pipeline for
Infrastructure in the Context of the
Global Financial Crisis
INFRA Platform Partners Forum
Brussels, July 2009
Impact of global crisis
on Africa
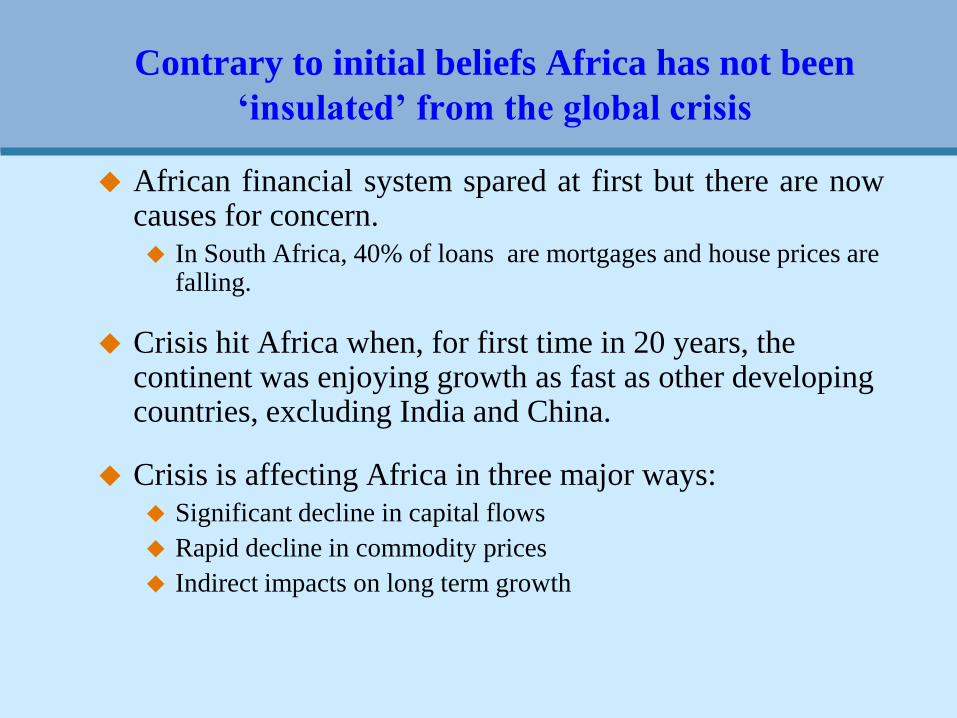
Contrary to initial beliefs Africa has not been
‘insulated’ from the global crisis
African financial system spared at first but there are nowcauses for concern.
In South Africa, 40% of loans are mortgages and house prices are falling.
Crisis hit Africa when, for first time in 20 years, the continent was enjoying growth as fast as other developing countries, excluding India and China.
Crisis is affecting Africa in three major ways:
Significant decline in capital flows
Rapid decline in commodity prices
Indirect impacts on long term growth
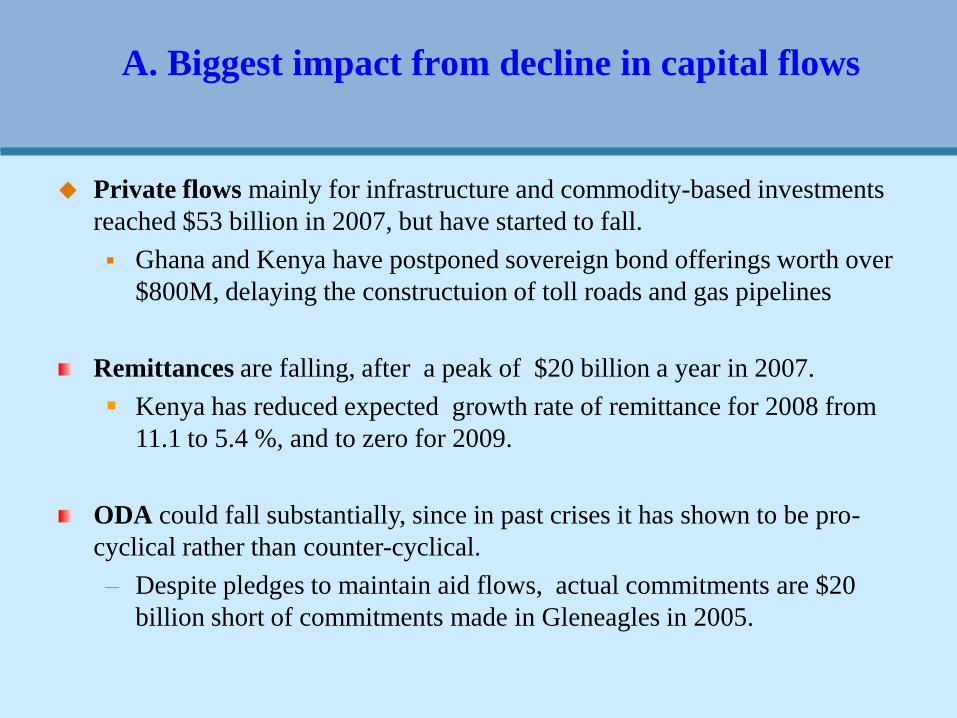
A. Biggest impact from decline in capital flows
Private flows mainly for infrastructure and commodity-based investments
reached $53 billion in 2007, but have started to fall.
Ghana and Kenya have postponed sovereign bond offerings worth over
$800M, delaying the constructuion of toll roads and gas pipelines
Remittances are falling, after a peak of $20 billion a year in 2007.
Kenya has reduced expected growth rate of remittance for 2008 from
11.1 to 5.4 %, and to zero for 2009.
ODA could fall substantially, since in past crises it has shown to be pro-
cyclical rather than counter-cyclical.
– Despite pledges to maintain aid flows, actual commitments are $20
billion short of commitments made in Gleneagles in 2005.
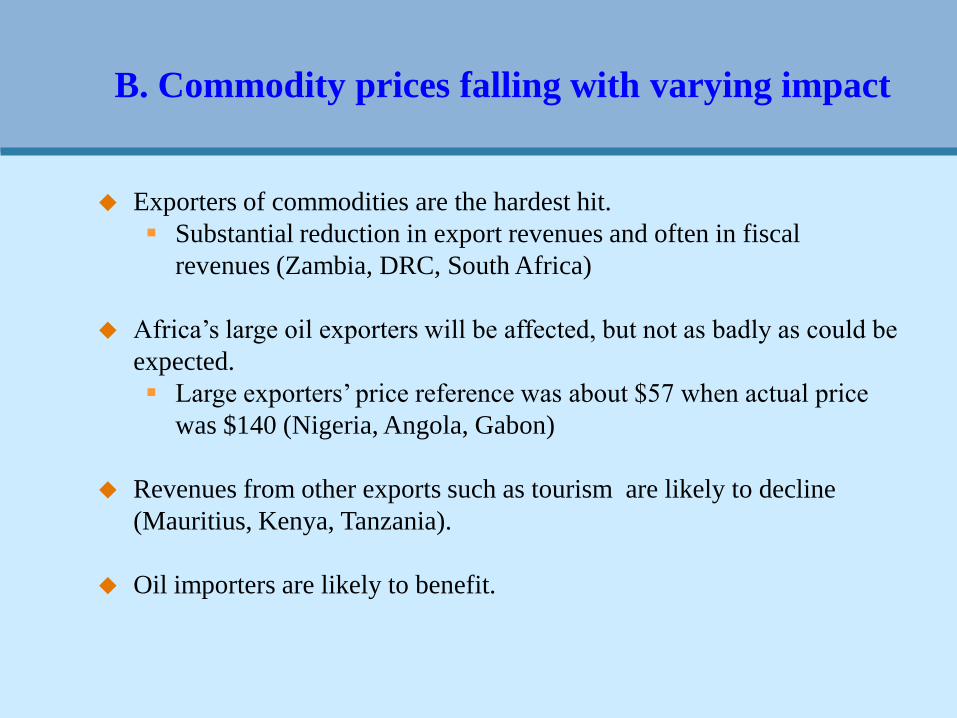
B. Commodity prices falling with varying impact
Exporters of commodities are the hardest hit.
Substantial reduction in export revenues and often in fiscal
revenues (Zambia, DRC, South Africa)
Africa’s large oil exporters will be affected, but not as badly as could be
expected.
Large exporters’ price reference was about $57 when actual price
was $140 (Nigeria, Angola, Gabon)
Revenues from other exports such as tourism are likely to decline
(Mauritius, Kenya, Tanzania).
Oil importers are likely to benefit.
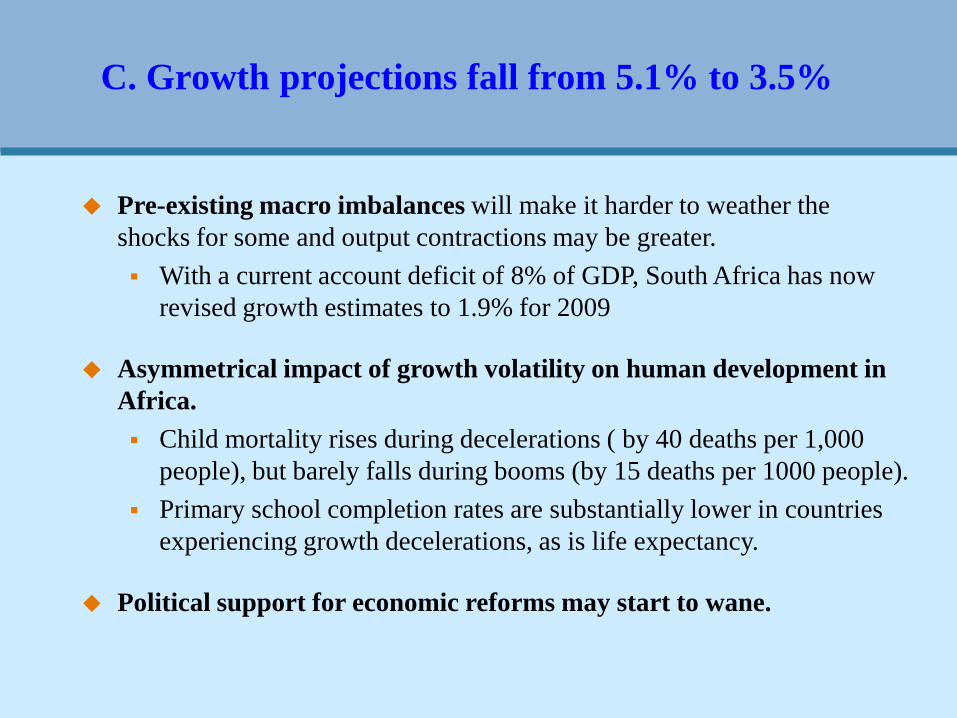
C. Growth projections fall from 5.1% to 3.5%
Pre-existing macro imbalances will make it harder to weather the
shocks for some and output contractions may be greater.
With a current account deficit of 8% of GDP, South Africa has now
revised growth estimates to 1.9% for 2009
Asymmetrical impact of growth volatility on human development in
Africa.
Child mortality rises during decelerations ( by 40 deaths per 1,000
people), but barely falls during booms (by 15 deaths per 1000 people).
Primary school completion rates are substantially lower in countries
experiencing growth decelerations, as is life expectancy.
Political support for economic reforms may start to wane.

Magnitude and speed of impact
varies across countries
Initial Conditions
Weak Moderate to Strong
Impact
Immediate Comoros, DR Congo,
Ghana, Guinea,
Kenya, Seychelles,
South Africa, Sudan
Malawi, Mauritius, Sao Tome
and Principe, Zambia
Short term Burundi, CAR, Cote
d’Ivoire, Ethiopia,
Guinea-Bissau,
Liberia, Senegal,
Sierra Leone
Benin, Botswana, Burkina
Faso, Cape Verde,
Cameroon, Lesotho,
Madagascar, Mozambique,
Nigeria, Swaziland, Uganda
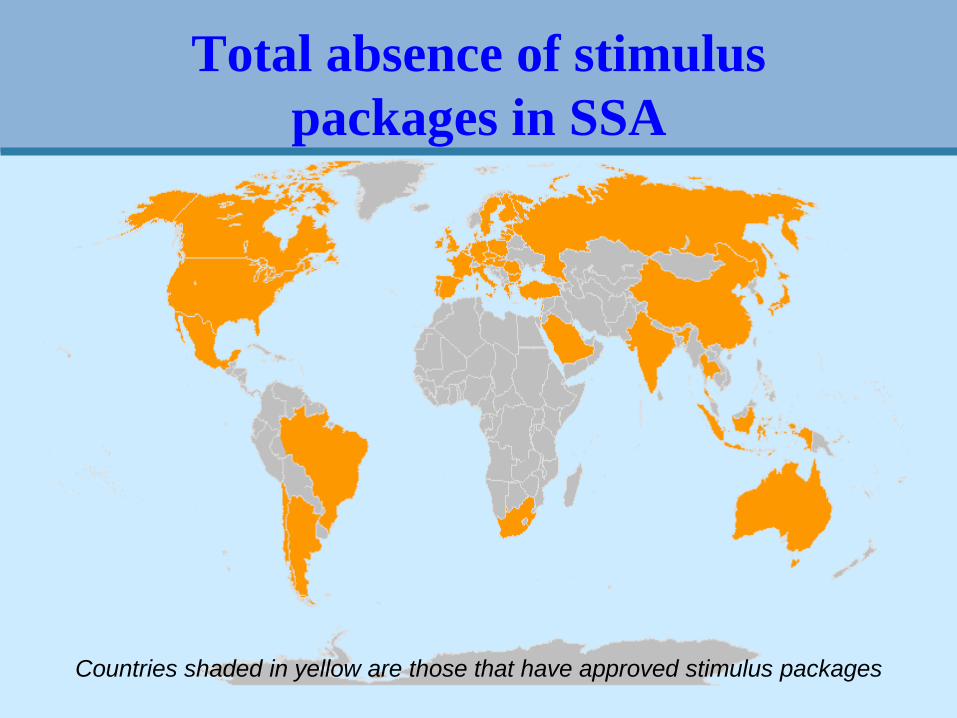
Total absence of stimulus
packages in SSA
Countries shaded in yellow are those that have approved stimulus packages

Implications for African
infrastructure
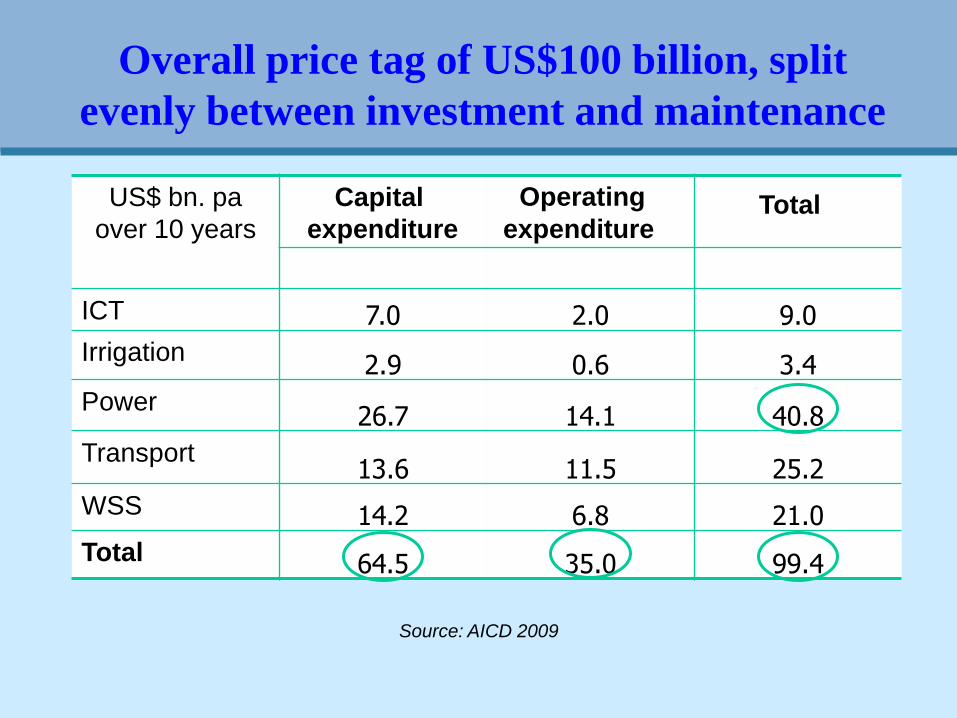
Overall price tag of US$100 billion, split
evenly between investment and maintenance
US$ bn. pa
over 10 years
ICT 7.0 2.0 9.0
Irrigation2.9 0.6 3.4
Power26.7 14.1 40.8
Transport13.6 11.5 25.2
WSS 14.2 6.8 21.0
Total 64.5 35.0 99.4
Capital
expenditure
Operating
expenditureTotal
Source: AICD 2009
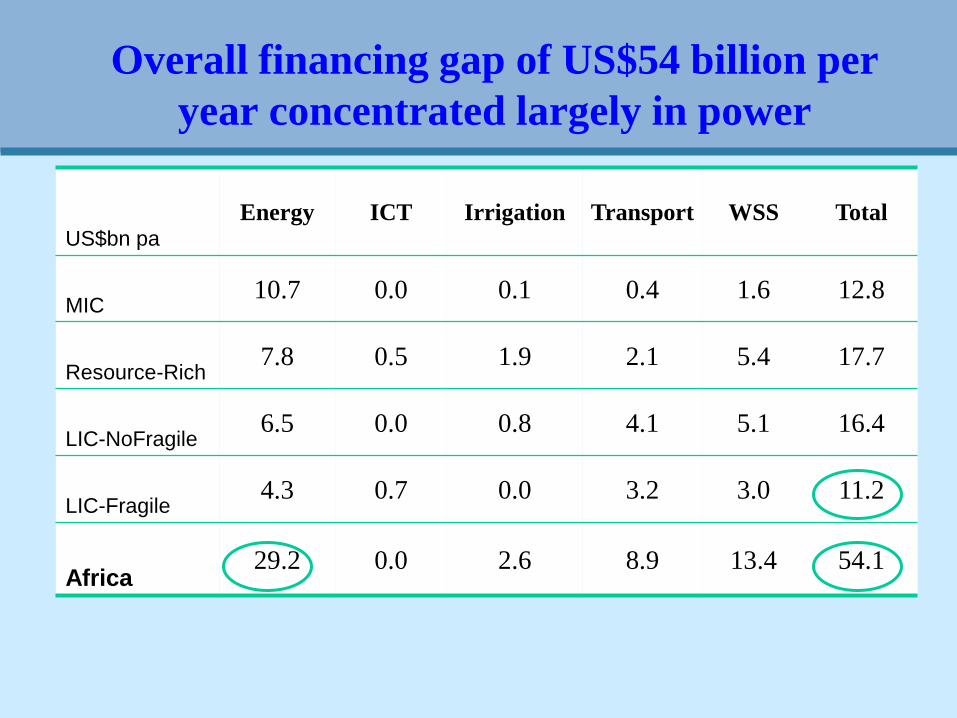
Overall financing gap of US$54 billion per
year concentrated largely in power
US$bn pa
Energy ICT Irrigation Transport WSS Total
MIC10.7 0.0 0.1 0.4 1.6 12.8
Resource-Rich7.8 0.5 1.9 2.1 5.4 17.7
LIC-NoFragile6.5 0.0 0.8 4.1 5.1 16.4
LIC-Fragile4.3 0.7 0.0 3.2 3.0 11.2
Africa29.2 0.0 2.6 8.9 13.4 54.1

Foreseeable negative impacts of the crisis
Public expenditures cuts
Could be particularly harmful – public expenditure represent 2/3 of financing.
Every dollar cut from road maintenance leads to four dollar liability for rehabilitation.
Drying up external finances
Reduced availability of debt finance already in ITC, constraining new deals and restricting debt roll-over on existing investments
Ghana and Kenya postponed sovereign bond offering over 800 million, delaying construction of toll roads and gas pipelines.
Donors Funds could slow down as fiscal pressures are mounting at home, despite the claims to the contrary.
Weaker sector revenues
For utilities that already operate in the red.
For Road Funds due to lower traffic declining exchange rates.

And also possible opportunities
Increasing the bang for the buck
Opportunity to correct inefficiencies that riddle current spending
Regulatory reforms can have highest returns
Tight budgets may provide incentives to go for efficiency
Falling unit costs of construction
Recent boom led to spike in unit costs and project cost over-runs
Key reasons: high commodity prices pushed up cost of materials & transport, & tight construction market reduced competition
Both inflationary pressures should be easing as a result of the crisis
Using of infrastructure in stimulus packages
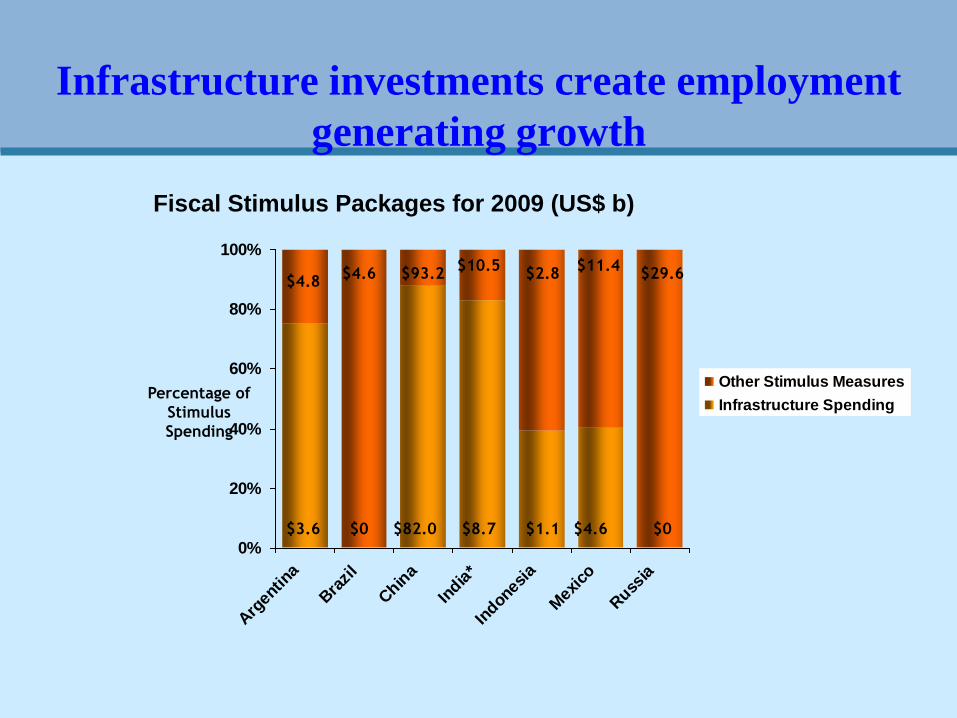
Infrastructure investments create employment
generating growth
0%
20%
40%
60%
80%
100%
Arg
entin
a
Bra
zil
Chin
a
India
*
Indon
esia
Mex
ico
Russ
ia
Other Stimulus Measures
Infrastructure Spending
$4.8$10.5
$93.2$4.6 $2.8$11.4
$29.6
$3.6 $8.7 $1.1 $4.6 $0$82.0$0
Percentage of
Stimulus
Spending
Fiscal Stimulus Packages for 2009 (US$ b)

Potential operational responses

How should we adapt our approach
in the light of the crisis?
• Build-up project pipeline – to ensure that there is no tailing-off of investments
• Address key constraints to growth – to pave the way for longer term economic recovery
• Undertake asset preservation – to avoid losing the ground gained in recent years
• Promote employment creation – to provide short-term financial relief
•Continue to deepen collaboration – to leverage scarce resources

What can be done to strengthen
the project pipeline?
• Strong growth in project pipeline from
US$0.6bn in FY01 to US$3.5bn in FY10
• This has been achieved by cleaning out
project pipeline
• Concern that medium-term pipeline is
dwindling and requires additional effort
– Pipeline for FY10/12 average US$1.9bn pa
– Deliveries for FY07/09 average US$2.5bn
Can we move faster on addressing key
growth bottlenecks?
• Stimulus packages of around US$2 trillion have been approved globally
– Between 40-80% of these linked to infrastructure
• ODI estimates Africa needs stimulus of US$50bn, and focusing this on infrastructure gives largest growth boost
– Short-run impact - 2010 growth of 4% versus 1.7%
– Long-run impact - permanent GDP increase 2.5%
• Regional integration projects good to address growth bottlenecks and currently under-funded

Regional integration pipeline
exceeds available resources
Regional IDA for
FY09-FY11 is over
programmed by
$3billion
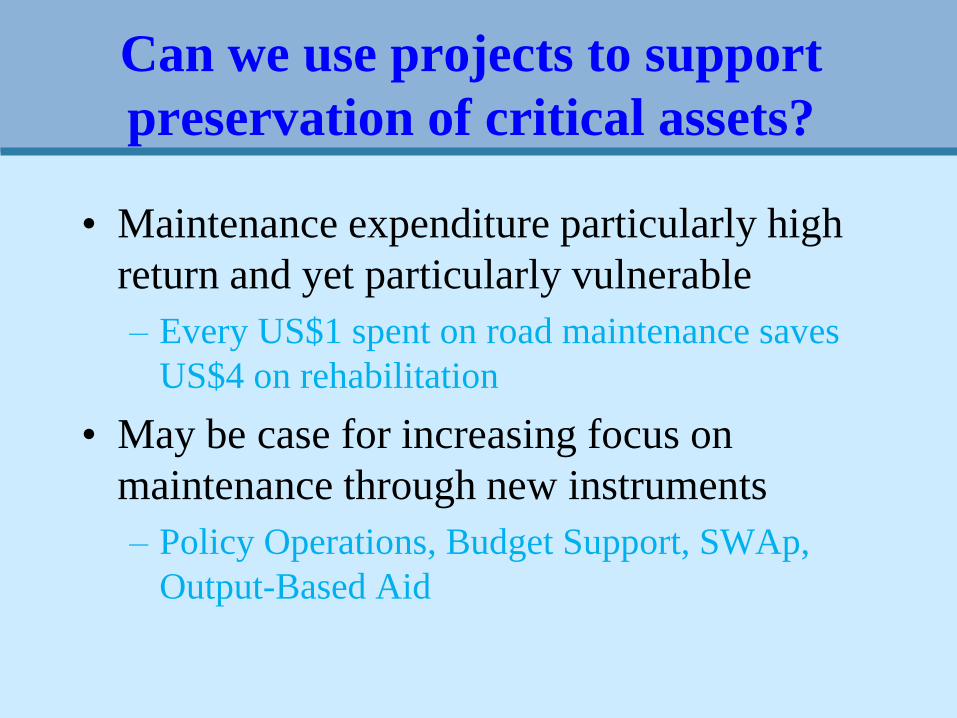
Can we use projects to support
preservation of critical assets?
• Maintenance expenditure particularly high
return and yet particularly vulnerable
– Every US$1 spent on road maintenance saves
US$4 on rehabilitation
• May be case for increasing focus on
maintenance through new instruments
– Policy Operations, Budget Support, SWAp,
Output-Based Aid
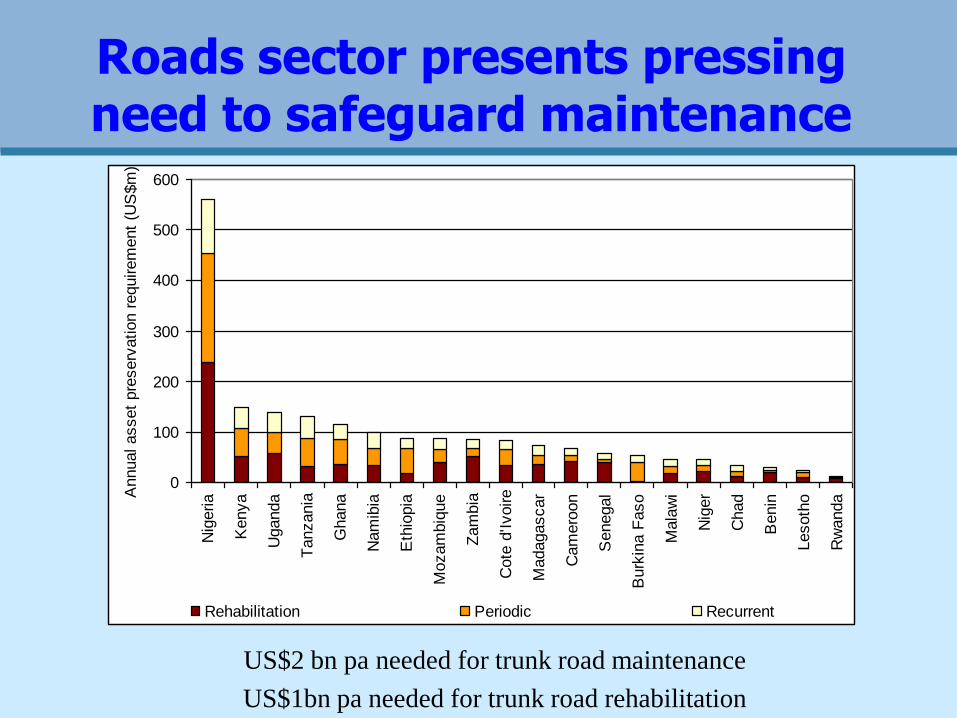
Roads sector presents pressing need to safeguard maintenance
US$2 bn pa needed for trunk road maintenance
US$1bn pa needed for trunk road rehabilitation
0
100
200
300
400
500
600
Nig
eria
Kenya
Uganda
Tanzania
Ghana
Nam
ibia
Eth
iopia
Mozam
biq
ue
Zam
bia
Cote
d'Ivoire
Madagascar
Cam
ero
on
Senegal
Burk
ina F
aso
Mala
wi
Nig
er
Chad
Benin
Lesoth
o
Rw
andaA
nnual asset
pre
serv
ation r
equirem
ent
(US
$m
)
Rehabilitation Periodic Recurrent

Can we use public works to
promote job creation?
• Potential to use labor intensive public works
• Based on last 10 years experience in SSA
– 25% of public works go on local wages
– Labor costs US$750 per man-year in LICs
– Multiplier of two for indirect jobs created
Every US$1m spent employs >600 man-years
• Most promising sectors for job creation
– Rolling out basic urban networks (e.g. WSS)
– Maintenance of rural/unpaved roads
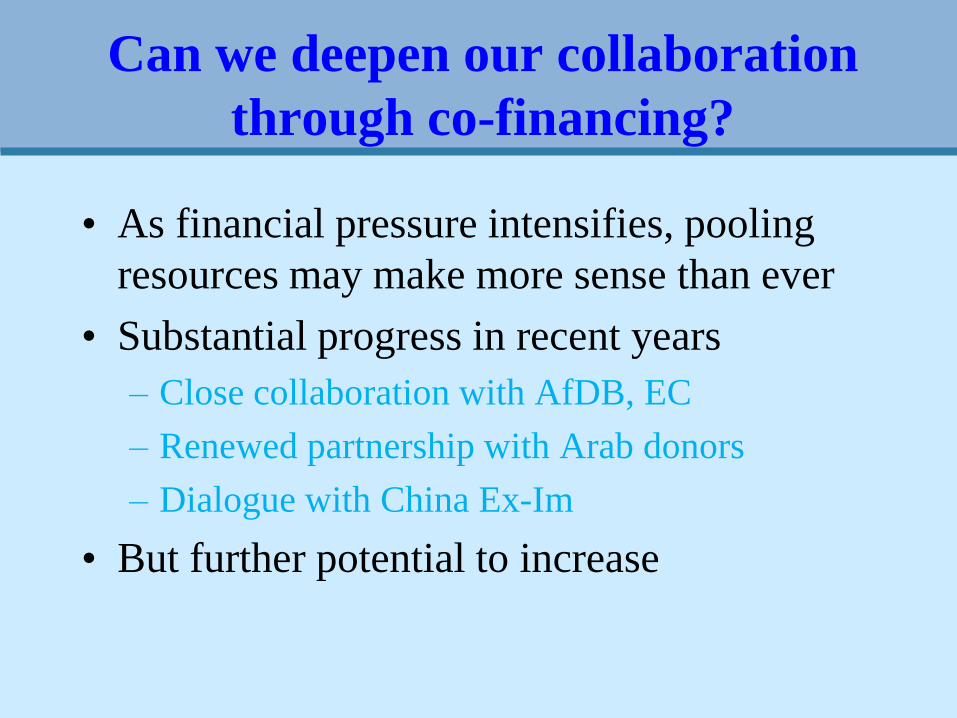
Can we deepen our collaboration
through co-financing?
• As financial pressure intensifies, pooling
resources may make more sense than ever
• Substantial progress in recent years
– Close collaboration with AfDB, EC
– Renewed partnership with Arab donors
– Dialogue with China Ex-Im
• But further potential to increase
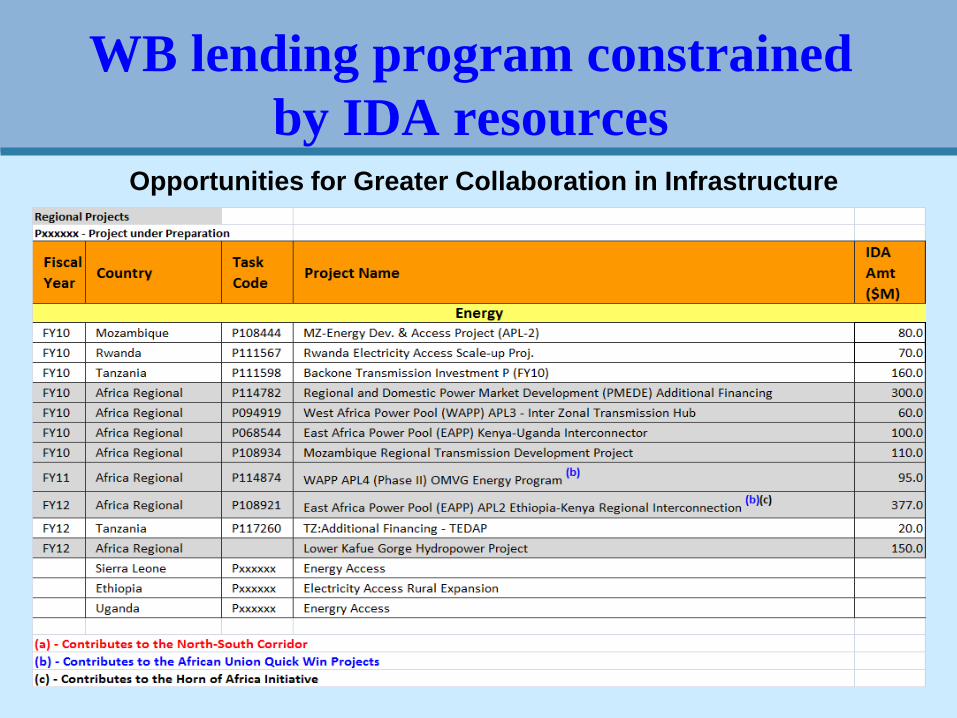
WB lending program constrained
by IDA resourcesOpportunities for Greater Collaboration in Infrastructure
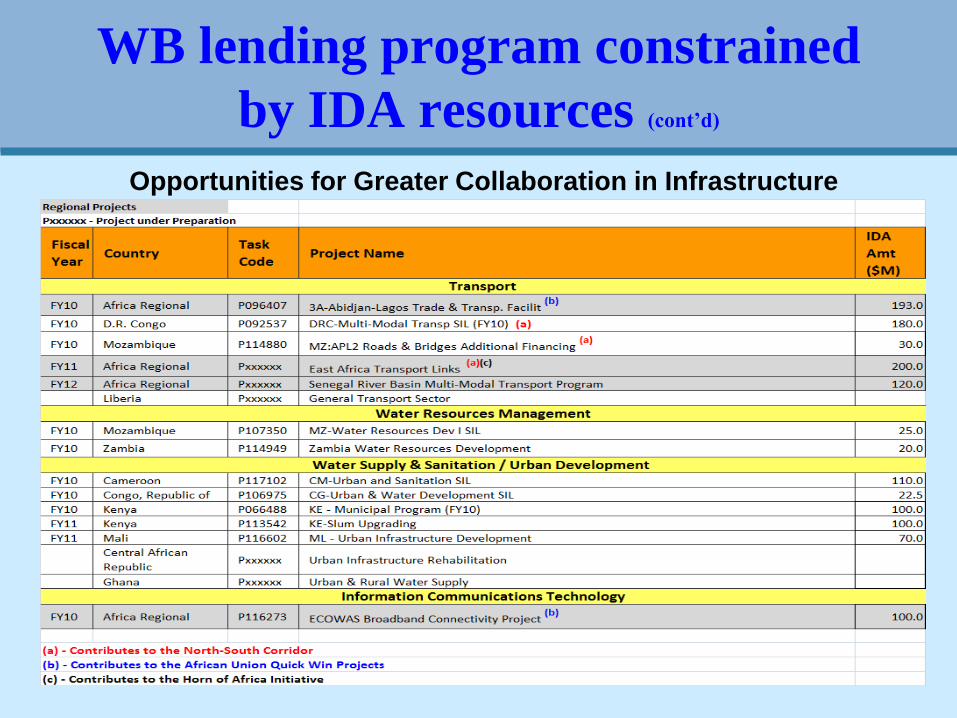
WB lending program constrained
by IDA resources (cont’d)
Opportunities for Greater Collaboration in Infrastructure

Thank you!