African Single Currency
192
Towards a Single African Currency 2-4 March | mars 2009 Nairobi, Kenya Vers la Création d’une Monnaie Unique Africaine Volume 2 Proceedings of the First Congress of African Economists Les Actes du Premier Congrès des Économistes Africains
Transcript of African Single Currency

8/15/2019 African Single Currency
http://slidepdf.com/reader/full/african-single-currency 1/192
Towards aSingle African
Currency
2-4 March| mars 2009Nairobi, Kenya
Vers la Création
d’une MonnaieUnique Africaine
Volume 2Proceedings of the First Congress of African EconomistsLes Actes du Premier Congrès des Économistes Africains
8/15/2019 African Single Currency
http://slidepdf.com/reader/full/african-single-currency 2/192
Towards aSingle African
Currency
2-4 March| Mars2009Nairobi, Kenya
Vers la Créationd’une Monnaie
Unique Africaine
Vol2Proceedingsof the First Congressof African Economists
LesActes du Premier Congrèsdes Économiste
A grant from the European Union to support this project is gratefully acknowledged.Nous remercions l’Union Européenne de son soutien nancier pour la réalisation de ce projet.
ISSN number : 1993-6177
© African Union Commission (AUC), December/décembre 2010
All rights are reserved. No part of this publication may be reproduced or utilised in any formby any means, electronic or mechanical, including photocopying and recording, or by anyinformation or storage and retrieval system, without permission in writing from the publisher.Opinions expressed are the responsibility of the individual authors and not of the AUC.
Tous droits réservés. Aucune partie de cette publication ne peut être reproduite ou utilisée sousaucunes formes ou par quelque procédé que ce soit, électronique ou mécanique, y comprisdes photocopies et des rapports, ou par aucun moyen de mise en mémoire d’information etde système de récupération sans la permission écrite de l’éditeur. Les opinions exprimées sontde la responsabilité des auteurs et non de celle de AUC.
Volume 2Proceedings of the First Congress of African EconomistsTowards a Single African Currency
Les Actes du Premier Congrès des Économistes AfricainsVers la Création d’une Monnaie Unique Africaine
Editorial BoardDr Maxwell Mkwezalamba,
Executive Editor,Commissioner for Economic Affairs,
AUC
Dr René N’Guettia Kouassi,Director of Economic Affairs,
AUC
Mr. Dossina Yeo,Senior Statiscian and Researcher,Department of Economic Affairs,
AUC
Mr Djimadoum Mandekor,
Senior Economist,Department of EconomicAffairs,AUC
Mr. Thiekoro Doumbia,Economist - Statistician,
Department of EconomicAffairs,AUC
Mr. Rodolphe Missinhoun,Statistician - Economist, Department
of Economic Affairs,AUC
Ms Fetun Getahun,Editorial Assistant,
Department of Economic Affairs,AUC
African Union Commission

8/15/2019 African Single Currency
http://slidepdf.com/reader/full/african-single-currency 3/192
Towards aSingle African
Currency
2-4 March| mars 2009Nairobi, Kenya
Vers la Créationd’une Monnaie
Unique Africaine
Volume 2Proceedings of the First Congress of African EconomistsLes Actes du Premier Congrès des Économistes Africains
Economic Affairs DepartmentAfrican Union Commission
Département des Affaires économiquesCommission de l’Union africaine

8/15/2019 African Single Currency
http://slidepdf.com/reader/full/african-single-currency 4/192
TOWARDS SINGLE AFRICAN CURRENCY: A Necessity of PriorConvergence of AfricanRegional EconomiesBy Ndubuisi Ekekwe, Johns Hopkins University

8/15/2019 African Single Currency
http://slidepdf.com/reader/full/african-single-currency 5/192
C o
n t e n t s
15PRIOR CONVERGENCEOF AFRICAN REGIONAL
ECONOMIES
16TOWARDS A SINGLE AFRICANCURRENCY
17CONCLUSION
18REFERENCES
8EXECUTIVESUMMARY AND
RECOMMENDATIONS
9INTRODUCTION
10THE BENEFITS OF
A SINGLE AFRICANCURRENCY
12STRENGTHENINGAFRICAN REGIONAL
ECONOMICCOMMUNITIES

8/15/2019 African Single Currency
http://slidepdf.com/reader/full/african-single-currency 6/192
6
EXECUTIVE SUMMARY ANDRECOMMENDATIONS
About half a century ago, African leaders established theOrganization of African Unity (OAU) to promote socio-economic structures aimed at improving the welfare ofthe citizens of member states and general integration ofthe continent. Many institutions were established on thisvision, but owing to ideological differences and convolutednancial infrastructures, the goals have not materialized.The success of the single European currency, Euro, which
has become very central to many recent economic progressin Europe by offering more efcient means of transactingbusinesses and using the human and institutional capabilitiesof the continent to foster more prosperity has shown the
power of integrated monetary structure in a globalizeworld (Ekekwe, 2008). As the world moves towardsknowledge-based economic structures and information
societies, which comprise networks of individuals, rms andnations that are linked electronically and in interdependent
global relationships, the power of a single African currencyhas become very important. A single African currency, ifrealized, would radically redene Africa’s social, politicaland economic landscape and position the continent on a
solid footing to tackle the enormous challenges of the 21stcentury (Ekekwe, 2002).
Since the inception of OAU, the founding fathers of many African nations have believed on a more united Africancontinent. The idea of a single African currency becameclearer when OAU member states in 2001 agreed totransform the intergovernmental organization into the
African Union (AU) towards positioning the continent forthe challenges of globalization (Masson, 2004) throughbetter economic policies, growth and good governance.
AU, which has become the successor of the OAU, hasretained the original vision of the founders of OAU- a
greater regional integration in both political and economicaffairs (Siddiqi, 2006). Shortly afterwards, in August2003, the Association of African Central Bank Governorsagreed to develop plans to establish a common centralbank that would manage a single continental currency
by 2021 (Masson, 2004). This plan is poised to offer an African market with no internal frontiers in which thefree movement of goods, persons, services and capital
is ensured. This push for a single currency stands for an Africa of unity, integration and strength. However, there isa huge possibility of potential failure of a single currencyif implemented haphazardly with enormous consequencesto not only Africa’s global image but also for individualcountries’ economies and, ultimately, the people.
A single African currency has many promises in terms ofboosting trade across the continent and benets for all
member states through synergy and symbiosis. It has thecapacity to increase economic cooperation among member AU nations and stimulate faster development efforts acrossthe continent (Debrun, 2002). Many African nations are stilloriented in trade toward former colonizers in Europe thanimmediate neighbors and across African capitals; there isan understanding that currency unication could be a keycatalyst to transforming the continent. The major challengeis how the continent could develop the plan to have thisunied monetary union considering the lopsided economic
structures among the nations, which can affect response strategy during economic crises. This is fundamental as ifmajor regional economic powers stay out of this unicationfor fear of being net losers, it could have adverse effects torealizing the continental goal. According to Siddiqi (2006),the technicalities of stronger monetary integration, xedexchange rates, central control over monetary/scal policies
and the eventual creation of a single African Central Bankare important issues that require strong institutions at bothdomestic and regional levels.
To date, insufcient research has been available on thefeasibility and desirability of a united African currencyunion. Paul Masson and Catherine Pattillo [2004, 2006]
show that not all the ve regional economic blocs would gain on average from a single currency. COMESA withheavy funding needs in proportion to their GDP willbenet while on average, SADC region boasting betterscal policies would lose. Within SADC, South Africa (thelargest economy), would face large welfare losses. Intra-SADC trade accounts for 50% of its trade (exports) in
8/15/2019 African Single Currency
http://slidepdf.com/reader/full/african-single-currency 7/192
7
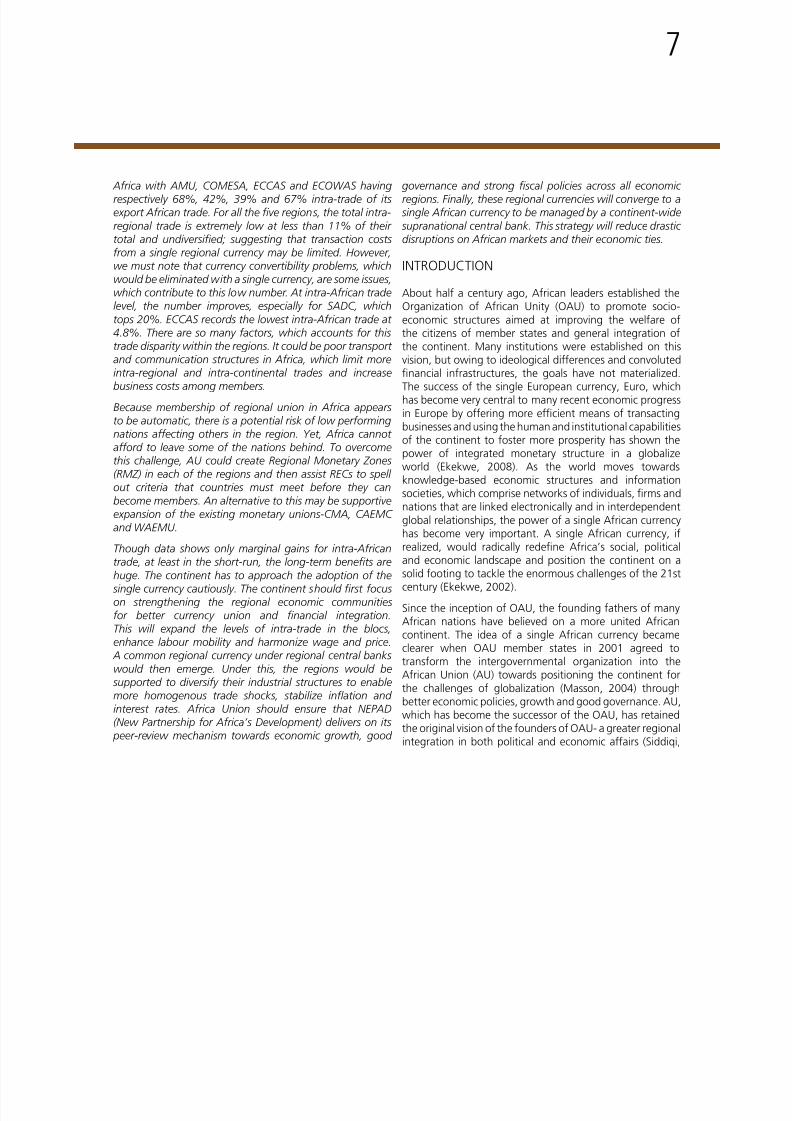
Africa with AMU, COMESA, ECCAS and ECOWAS havingrespectively 68%, 42%, 39% and 67% intra-trade of itsexport African trade. For all the ve regions, the total intra-
regional trade is extremely low at less than 11% of theirtotal and undiversied; suggesting that transaction costsfrom a single regional currency may be limited. However,we must note that currency convertibility problems, whichwould be eliminated with a single currency, are some issues,which contribute to this low number. At intra-African tradelevel, the number improves, especially for SADC, whichtops 20%. ECCAS records the lowest intra-African trade at4.8%. There are so many factors, which accounts for thistrade disparity within the regions. It could be poor transportand communication structures in Africa, which limit moreintra-regional and intra-continental trades and increasebusiness costs among members.
Because membership of regional union in Africa appearsto be automatic, there is a potential risk of low performingnations affecting others in the region. Yet, Africa cannotafford to leave some of the nations behind. To overcomethis challenge, AU could create Regional Monetary Zones(RMZ) in each of the regions and then assist RECs to spellout criteria that countries must meet before they canbecome members. An alternative to this may be supportiveexpansion of the existing monetary unions-CMA, CAEMCand WAEMU.
Though data shows only marginal gains for intra-Africantrade, at least in the short-run, the long-term benets arehuge. The continent has to approach the adoption of the
single currency cautiously. The continent should rst focuson strengthening the regional economic communitiesfor better currency union and nancial integration.This will expand the levels of intra-trade in the blocs,enhance labour mobility and harmonize wage and price.
A common regional currency under regional central bankswould then emerge. Under this, the regions would be
supported to diversify their industrial structures to enablemore homogenous trade shocks, stabilize ination andinterest rates. Africa Union should ensure that NEPAD(New Partnership for Africa’s Development) delivers on its
peer-review mechanism towards economic growth, good
governance and strong scal policies across all economicregions. Finally, these regional currencies will converge to a
single African currency to be managed by a continent-wide
supranational central bank. This strategy will reduce drasticdisruptions on African markets and their economic ties.
INTRODUCTION
About half a century ago, African leaders established theOrganization of African Unity (OAU) to promote socio-economic structures aimed at improving the welfare ofthe citizens of member states and general integration ofthe continent. Many institutions were established on thisvision, but owing to ideological differences and convolutednancial infrastructures, the goals have not materialized.The success of the single European currency, Euro, whichhas become very central to many recent economic progressin Europe by offering more efcient means of transactingbusinesses and using the human and institutional capabilitiesof the continent to foster more prosperity has shown the
power of integrated monetary structure in a globalizeworld (Ekekwe, 2008). As the world moves towardsknowledge-based economic structures and informationsocieties, which comprise networks of individuals, rms andnations that are linked electronically and in interdependentglobal relationships, the power of a single African currencyhas become very important. A single African currency, ifrealized, would radically redene Africa’s social, politicaland economic landscape and position the continent on asolid footing to tackle the enormous challenges of the 21stcentury (Ekekwe, 2002).
Since the inception of OAU, the founding fathers of manyAfrican nations have believed on a more united Africancontinent. The idea of a single African currency becameclearer when OAU member states in 2001 agreed totransform the intergovernmental organization into theAfrican Union (AU) towards positioning the continent forthe challenges of globalization (Masson, 2004) throughbetter economic policies, growth and good governance. AU,which has become the successor of the OAU, has retainedthe original vision of the founders of OAU- a greater regionalintegration in both political and economic affairs (Siddiqi,

8/15/2019 African Single Currency
http://slidepdf.com/reader/full/african-single-currency 8/192
8
2006). Shortly afterwards, in August 2003, the Associationof African Central Bank Governors agreed to develop plansto establish a common central bank that would manage a
single continental currency by 2021 (Masson, 2004). Thisplan is poised to offer an African market with no internalfrontiers in which the free movement of goods, persons,services and capital is ensured. This push for a singlecurrency stands for an Africa of unity, integration andstrength. However, there is a huge possibility of potentialfailure of a single currency if implemented haphazardly withenormous consequences to not only Africa’s global imagebut also for individual countries’ economies and, ultimately,the people.A single African currency has many promises in terms ofboosting trade across the continent and benets for allmember states through synergy and symbiosis. It has thecapacity to increase economic cooperation among memberAU nations and stimulate faster development efforts acrossthe continent (Debrun, 2002). Many African nations are stilloriented in trade toward former colonizers in Europe thanimmediate neighbors and across African capitals, there isan understanding that currency unication could be a keycatalyst to transforming the continent. The major challengeis how the continent could develop the plan to have thisunied monetary union considering the lopsided economicstructures among the nations, which can affect responsestrategy during economic crises. This is fundamental as ifmajor regional economic powers stay out of this unication
for fear of being net losers, it could have adverse effects torealizing the continental goal. According to Siddiqi (2006),the technicalities of stronger monetary integration, xedexchange rates, central control over monetary/scal policiesand the eventual creation of a single African Central Bankare important issues that require strong institutions at bothdomestic and regional levels.
In the continent, there exist low institutional capacities in
nearly all the regional economic communities with obstaclesto realizing economic and monetary integrations. Excludingthe franc zone, many of the sovereign central banks (exceptthe South African Reserve Bank and the Bank of Botswana)are not independent, and several Anglophone countries
have often suffered from spiraling ination because thecentral banks are politically forced to nance budget decitsand annual subsidies paid to parastatals. Independence in
monetary policies, which offers the exibilities to adjustexchange rates to handle ination by member states toovercome both endogenous and exogenous shocks, wouldbe taken over by a common central bank. This new bankwill then have to coordinate scal policies in member statesand act directly to inuence matters of political sovereigntyand control over taxation and public spending (Siddiqi,2006). Available data shows that many African economicregions as well as the nations within them are not ready forthis central control.
THE BENEFITS OF A SINGLE AFRICAN CURRE
First, let us examine briey some of the benets of a singleAfrican currency:
A wider regional integration could help Africa in negotiatingfavourable trading terms either bilaterally (with the USand the EU) or globally (the World Trade Organizationcontext) (Masson, 2004). This integration offers a broaderopportunity for African producers, traders, and consumerswithin a globalizing world, which favors larger tradingblocs, to compete effectively for inward investment andforeign trade.
A bigger African market under one currency couldstimulate more foreign direct investments (FDI) in Africa.Over the years, many African economies have been unableto attract them due to the size of their economies. Infew cases, where FDI exists, they are largely in mineralmining and petroleum. A single African market couldopen the continent to FDI opportunities in the areas ofsemiconductors, nanotechnology, and robotics, amongothers. More FDI will spur industrializations across Africa,as more transnational corporations will seek more businessopportunities in a larger homogenous African marketthat offers scope for economies of scale and productionefciency.
Under a unication currency, regional nations could benetby pooling resources and enjoy the economies of scale and

8/15/2019 African Single Currency
http://slidepdf.com/reader/full/african-single-currency 9/192
8/15/2019 African Single Currency
http://slidepdf.com/reader/full/african-single-currency 10/192
10
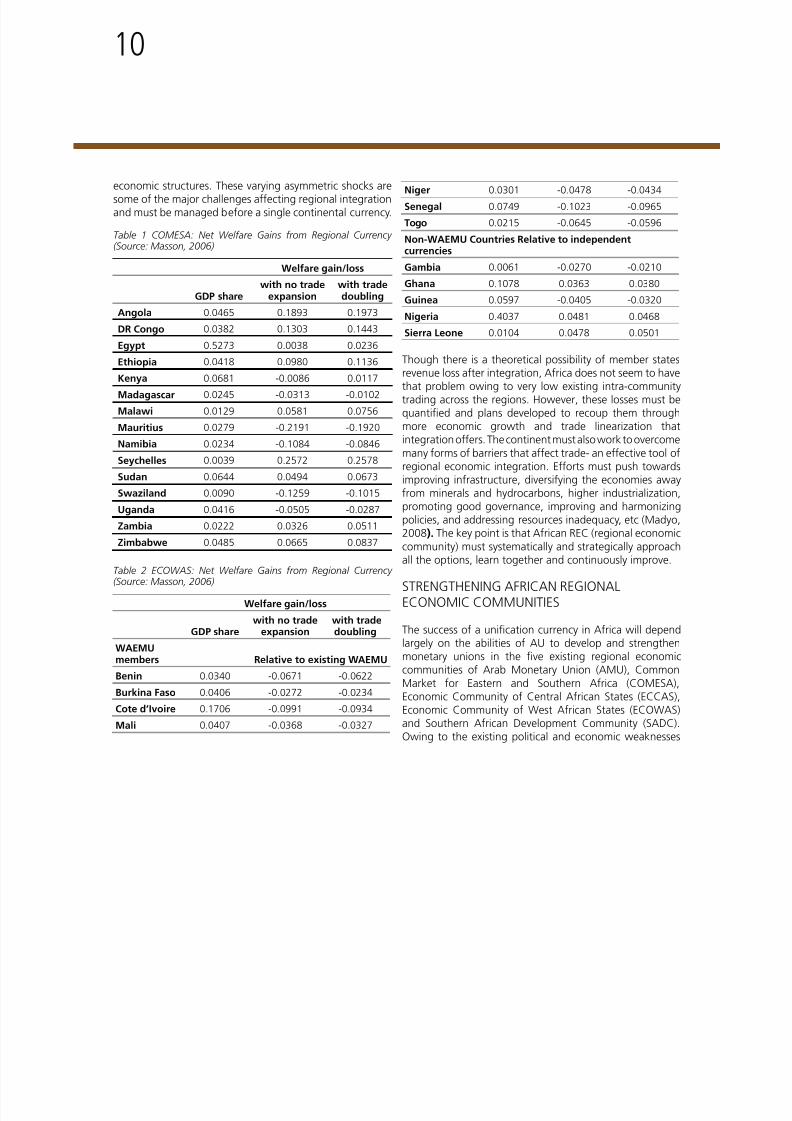
economic structures. These varying asymmetric shocks aresome of the major challenges affecting regional integrationand must be managed before a single continental currency.
Table 1 COMESA: Net Welfare Gains from Regional Currency(Source: Masson, 2006)
Welfare gain/loss
GDP sharewith no trade
expansionwith tradedoubling
Angola 0.0465 0.1893 0.1973DR Congo 0.0382 0.1303 0.1443
Egypt 0.5273 0.0038 0.0236Ethiopia 0.0418 0.0980 0.1136Kenya 0.0681 -0.0086 0.0117Madagascar 0.0245 -0.0313 -0.0102Malawi 0.0129 0.0581 0.0756Mauritius 0.0279 -0.2191 -0.1920Namibia 0.0234 -0.1084 -0.0846Seychelles 0.0039 0.2572 0.2578Sudan 0.0644 0.0494 0.0673Swaziland 0.0090 -0.1259 -0.1015Uganda 0.0416 -0.0505 -0.0287Zambia 0.0222 0.0326 0.0511Zimbabwe 0.0485 0.0665 0.0837
Table 2 ECOWAS: Net Welfare Gains from Regional Currency(Source: Masson, 2006)
Welfare gain/loss
GDP sharewith no trade
expansion with tradedoubling
WAEMUmembers Relative to existing WAEMUBenin 0.0340 -0.0671 -0.0622Burkina Faso 0.0406 -0.0272 -0.0234Cote d’Ivoire 0.1706 -0.0991 -0.0934Mali 0.0407 -0.0368 -0.0327
Niger 0.0301 -0.0478 -0.0434Senegal 0.0749 -0.1023 -0.0965Togo 0.0215 -0.0645 -0.0596Non-WAEMU Countries Relative to independentcurrencies
Gambia 0.0061 -0.0270 -0.0210Ghana 0.1078 0.0363 0.0380Guinea 0.0597 -0.0405 -0.0320Nigeria 0.4037 0.0481 0.0468Sierra Leone 0.0104 0.0478 0.0501
Though there is a theoretical possibility of member statesrevenue loss after integration, Africa does not seem to havethat problem owing to very low existing intra-communitytrading across the regions. However, these losses must bequantied and plans developed to recoup them throughmore economic growth and trade linearization thatintegration offers. The continent must also work to overcome
many forms of barriers that affect trade- an effective tool ofregional economic integration. Efforts must push towardsimproving infrastructure, diversifying the economies awayfrom minerals and hydrocarbons, higher industrialization,promoting good governance, improving and harmonizingpolicies, and addressing resources inadequacy, etc (Madyo,2008). The key point is that African REC (regional economiccommunity) must systematically and strategically approachall the options, learn together and continuously improve.
STRENGTHENING AFRICAN REGIONALECONOMIC COMMUNITIES
The success of a unication currency in Africa will dependlargely on the abilities of AU to develop and strengthenmonetary unions in the ve existing regional economiccommunities of Arab Monetary Union (AMU), CommonMarket for Eastern and Southern Africa (COMESA),Economic Community of Central African States (ECCAS),Economic Community of West African States (ECOWAS)and Southern African Development Community (SADC).Owing to the existing political and economic weaknesses

8/15/2019 African Single Currency
http://slidepdf.com/reader/full/african-single-currency 11/192
11
in terms of trade, human and economic infrastructure, andpoverty, regional economic integration looks challenging.A successful regional integration is a necessary precedent
to an integrated Africa under one monetary union. Thechallenges of expanding markets and diversifying exportswould be better served under a well-managed singlecurrency. From banking to energy, a single currency willfacilitate mutual trade and business climate and reducesome of the barriers, which have impeded some Africannations into playing at the global level. This is becausea single currency could leverage some African nationsinto better international trade positions than what theirsovereign currency presently offers.For the single currency to succeed, the regional communitiesmust each develop a strong monetary union in theirrespective regions. This is very important as Africa doesnot have the infrastructural capabilities to cement a singlemonetary at the continental level without rst developingthe regional monetary unions. Central to this is the need forregional nations to have stable macro-economic policies.Each regional community must work to establish a strongregional market with zero tariffs and non-tariff barriers, acommon market, including free movement of labour andcapital and a single currency and central bank. For this tosucceed the nations must agree on parameters and as in theEuropean Union, disputes and non-compliance would bematters for a regional court with hefty nes for governmentswho fail to adhere (Siddiqi, 2006). Nonetheless, Africa is
not Europe and it has to be extremely selective in choosingthe European ideas it would like to replicate. Africa’s majorgoals towards a single currency would be to improveeconomic growth and lower ination while overcomingpoor infrastructure and low investment. As evident in EU,stronger regional nations like Nigeria (in ECOWAS) andSouth Africa (in SADC), which are economically strongerthan many in their regions must have the capacity to carrythe weaker ones since monetary and scal decisions wouldaffect all the member states. Implementing such plans atthe continental level without rst trying their effects atthe regional level would be catastrophic. Unlike in Europewhere many of the economies are stable, Africa has seriouseconomic challenges, which could make managing varying
economic gaps difcult. A typical example is how AU willreact to Zimbabwean economic crises considering thatmany of the member states are struggling. Tackling the
Zimbabwean problem, for example, at SADC level andstabilizing the regional markets must come rst before asingle African currency.
Stabilizing the REC and then merging them together offer abetter paradigm than introducing a single currency continent-wide immediately. This will reduce market disruption, whichhas a potential impact of weakening African standing inthe world. A poorly managed monetary union with rapidly
depreciating currency could seriously harm the continentand diminish the economic developments of memberstates. Also, member states would face tougher challengesat reacting to asymmetric shocks since exibility at statelevel to overcoming economic problems have been given upfor a common monetary union at the continental level. Thatis why a regional experiment will offer the opportunitiesto appropriately evaluate and understand the best lines ofresponse to the challenges.
Africa Union must not copy the EU model verbatim sincethere are many disparities between the nations in these twocontinents. The EU nations have advanced in the deploymentof information and communication technologies withbetter transportation links enabling them to reducebusiness costs and maximize the benets of economies ofscale. Also, EU has cooperated for more than half a centuryand these nations have stabled scal policies with crediblemonetary institutions. On the other hand, Africa regionslack good transportation and communication networks.So while the unied monetary union could offer a vistaof low transaction costs, the other benets arising fromeconomies of scale may not be attainable. Many Africaneconomies are not yet knowledge economies (Ekekwe,2008), and as such are affected by trade shocks in differentways. Owing to the specialized individual market and highly
economically diversied exports, the economies of memberstates do not move alike and this could be a potential issuewith a united monetary union. Some states would reactdifferently seasonally and AU must have solutions to curtainthe disruptions that can emanate from this. An example is

8/15/2019 African Single Currency
http://slidepdf.com/reader/full/african-single-currency 12/192
12
in West Africa, where Nigeria’s oil-based economy differsmarkedly from its neighbors, which export non-fuel primarycommodities (notably cocoa, cotton and gold) and are,
therefore subject to different price adjustments (Siddiqi,2006). In this case, convergence of their national policiesand harmonization of banking regulations and institutionswould become crucial. Even at regional levels, nothingdemonstrates that there are mechanisms and systems,which can manage these shocks for economic stabilityand prosperity. The best the AU can do is to continue tostrengthen regional scal transfers and afterwards developa continental level scal homogeneity.
Since membership of regional union in Africa appears tobe automatic, there is a potential risk of low performingnations affecting others in the region. Yet, Africa cannotafford to leave some of the nations behind. To overcomethis challenge, AU could create Regional Monetary Zones(RMZ) in each of the regions and then assist RECs tospell out criteria that countries must met before they canbecome members. An alternative to this may be supportiveexpansion of the existing monetary unions-CommonMonetary Area (CMA), Economic and Monetary Communityfor Central Africa (CAEMC), and West Africa Economicand Monetary Union (WAEMU). Cautionary, selective andexpansive strategy, similar to EU model, is needed andmembership criteria well spelt out. These criteria should benon-negotiable and ensure that member states harmonizetheir policies including commitment and adherence to the
aims of a political, economic and monetary union before joining the zone. There is a need for more pragmatic androbust agenda than is currently dened in Abuja Treaty andREC agenda must be selective and exible and hence aneed for a review of the Treaty (Madyo, 2008).
It is important that a process to strengthen these regionalcommunities will examine and analyse the key determinantsof intra-African trade. While many African nations have
signicant trade, statistics show that intra-African tradeis a small fraction of each nation’s total trade and hasremained largely constant over many decades (see Table3). Other policies like infrastructure, ethnic, cultural andlinguistic diversify and political structures must be managed
alongside trade policy and currency unication. In the lastfew years, Africa has made progress in the areas of trade,transport, telecommunications, energy, labour mobility, and
peace. Improving growth rates in many of the economiesshow that. The continent had growth in 2007 (Fig 1) and isexpected to continue this trend in future despite the currentglobal economic crises, which can momentarily slow downthe world economy. It is evident that insufcient progressin unifying the regional market has affected trade creationand expansion, especially the intra-REC and intra-Africantrades (Madyo, 2006). Olubomehin and Kwawonishe(2004) noted that lack of export diversication of manyAfrica nations and the lure to continue to trade with formerEU colonial rulers instead of one another accounts for thislow result as shown in Table 3.
Table 3 Exports of Regional Economic Communities Averages1995-2000 (In percent of each REC’s total exports) (Source:Masson, 2006)
Destination of Exports
REC
A M U
C O M E S A
E C C A S
E C O W A S
S A D C
E u r o p e a n
U n i o n
R e s t o f
W o r l d
AMU 2.74 0.67 0.11 0.45 0.06 71.78 24.19COMESA 0.77 5.47 0.74 0.19 5.94 41.25 45.64ECCAS 0.61 0.67 1.89 0.68 0.95 43.76 51.45ECOWAS 1.01 0.56 1.61 9.08 1.25 37.15 49.34SADC 0.19 8.28 0.83 0.79 10.28 36.87 42.76
Strengthening the RECs is fundamental owing to varyingscal disciplines, terms of trade shocks, which wouldalienate some RECs (especially ECCAS and SADC) in joininga single currency, at least in the short–run. Certainly, iftrade should increase, the RECs would benet, but at theshort-run, many could be net losers (see Table 4). This table
would certainly improve if Africa invests in infrastructure,stimulate growth, have better scal discipline, which willenhance macroeconomic stability and trade, and reducethe barriers to trade liberalization.

8/15/2019 African Single Currency
http://slidepdf.com/reader/full/african-single-currency 13/192
13
Table 4 A Single African Currency: Average Net Welfare GainRelative to Hypothetical Regional Currencies [10]
REC No tradeexpansion
With tradedoubling
AMU -0.0011 0.0104COMESA 0.0395 0.0484ECCAS -0.0128 -0.0012ECOWAS 0.1125 0.1062SADC -0.0739 -0.0778
Fig.1 Regional growth performance 2005-2007 (%)
0
1
2
3
4
5
6
7
AfricaCentral AfricaNorth AfricaWest AfricaSouthern AfricaEast Africa
Figure 1: Regional Growth Performance, 2005-2007 (%) 2005 2006 2007
Sources: ECA 2008, Thesis
PRIOR CONVERGENCE OF AFRICAN REGIONALECONOMIES
Balassa (1961) had identied and distinguished betweenve stages or degrees of economic integration: stage1-free trade area; stage 2-customs union; stage 3-commonmarket; stage 4-economic union; and stage 5-completeregional integration. The nal stage involves a monetaryunion and harmonization of monetary and scal policiesadministered within one supranational authority. Successfulregional integrations like EU have followed a model similarto this one. It would be the duties of the AU to assist regions
develop strengthened economic blocs. All the RECs needsupport as nearly all of them are falling behind in terms ofthe six stages towards the African Economic Community, as
set up in Abuja Treaty. The Treaty might need revision basedon realities and efforts must be geared to push nationalgovernments to demonstrate more support to the Treaty.
The continent must establish, develop and stabilizeregional monetary unions and consequently integratethem. Certainly, waiting for the maturity of the regionalunions would cause further delay as many of the regionalintegrations have progressed slowly with poor results. The
institutional structures in Africa are poor when comparedwith EU, which recently achieved a single currency, whichAU hopes to realize. The immediate challenge would beestablishing a central bank that is more independent andexerts greater discipline over scal policies than nationalcentral banks in the regions (Masson, 2006). It is evidentthat nations would not want to join monetary unionswhere there exist divergent external and asymmetric shockswith key members of the union, which can affect themunfavorably. EU nations have more common shocks thanAfrican, which has more specialized economies. The impactsof joining a union with nations which have consistentlyhad undisciplined scal policies resulting to ination in theregion is huge. Many of the member nations will benet,while some will be losers in this union. For some Africantop currencies like South African rand, a poorly managedsingle currency with high ination or unstable exchange
rate could be inferior to them and that would harm theprogress and development of the nation. At the same time,some nations could see the new currency as improvementsin their currencies.
A cursory study of establishment of Euro shows that it tookmany decades to realize the Treaty of Rome with the goals ofregional integration. Painstaking efforts by member stateswhich involved incremental expansion of the communities,
consolidating exchange rates margins in the regions,creation of foreign exchange reserves, active coordinationof short and medium-term economic and budgetarypolicies; creation of the European Monetary CooperationFund and Regional Development Fund and harmonization

8/15/2019 African Single Currency
http://slidepdf.com/reader/full/african-single-currency 14/192
14
of taxes (Siddiqi , 2006). The Euro was nally introduced on1 January 1999. It does mean that a single African currencywill be extremely challenging if the process of forming
the Euro was challenging and time-consuming within acontinent with stable political and sound bureaucracies.This EU experiences buttresses the paradigm that regionaleconomic communities should be used as building blocksfor a single African currency.
TOWARDS A SINGLE AFRICAN CURRENCY
The AU should focus on building stable and mature monetaryunions in the continent’s ve existing regional communities.These regional trading communities will crystallize into theeconomic and monetary union, similar to the EU’s singlemarker in 1992. Mergers of the ve regional unions and asingle African currency under one central bank will followthis. The result will be a single market that will symbolizethe achievement of true regional integration.
To date, insufcient research has been available on thefeasibility and desirability of a united African currencyunion. Paul Masson and Catherine Pattillo (2004, 2006)show that not all the ve regional economic blocs wouldgain on average from a single currency. As shown in Table4, COMESA with heavy funding needs in proportion to theirGDP will benet while on average, SADC region boastingbetter scal policies would loose. Within SADC, South Africa(the largest economy), would face large welfare losses. Intra-
SADC trade accounts for 50% of its trade (exports) in Africa(see Table 5). AMU, COMESA, ECCAS and ECOWAS haverespectively 68%, 42%, 39% and 67% intra-trade of itsexport African trade. For all the ve regions, the total intra-regional trade is extremely low at less than 11% of theirtotal and undiversied; suggesting that transaction costsfrom a single regional currency may be limited. However,we must note that currency convertibility problems, whichwould be eliminated with a single currency, are some issues,which contribute to this low number. At intra-African tradelevel, the number improves, especially for SADC, whichtops 20% (Table 5). ECCAS records the lowest intra-Africantrade at 4.8%. There are so many factors, which accountsfor this trade disparity within the regions. It could be poor
transport and communication structures in Africa, whichlimit more intra-regional and intra-continental trades andincrease business costs among members.
Table 5 Exports of Regional Economic Communities Averages1995-2000 (In percent of each REC’s total exports) [Sources: ECA2004; Masson 2004]]
REC Intra-trade Africa Rest ofWorld
AMU 2.74 4.03 95.97COMESA 5.47 13.11 86.89
ECCAS 1.89 4.8 95.21ECOWAS 9.08 13.51 86.49SADC 10.28 20.37 79.63
Focusing on only Africa, data from Economic Commissionfor Africa (see Table 6) clearly shows that SADC accounts forthe largest intra-REC trade in Africa with 31% for exportsand 30% for imports. ECCAS is the smallest with 1.3% for
both export and imports. This Table shows the low level ofintra-Africa trade and the necessity for integration.
Table 6: Shares of RECs in intra-REC trade, 1994-2000 for Exports/ Imports [Source ECA 2004]*
REC Shares of exports Shares of importsAMU 8.6 8.8COMESA 9.3 9.5
ECCAS 1.3 1.3ECOWAS 19.8 20.9SADC 31.1 30.2
The shares percentages are completed by otherintergovernmental institutions, which are not recognizedby AU as REC.

8/15/2019 African Single Currency
http://slidepdf.com/reader/full/african-single-currency 15/192
15
CONCLUSION
Owing to the success of the Euro, there is a global consensus
among economists that regional economic integrationoffers a good paradigm for responding to the challenges ofglobalization. For Africa, there are enormous benets not
just for economic growth and development to economicallyintegrate and potentially have one currency. These includeviable market size with lower transaction costs, morecapacity to negotiate better trade agreements, more FDI,gains of economies of scale, improved productivity throughhigher competition, regional macroeconomic coordination,export diversication and industrialization.However, the continent must overcome many years ofinfrastructural negligence, poor governance and politicalinstability to offer a harmonized and streamlined economicintegration that will improve the welfare of the citizens.Member states must show political willingness and sheercommitment to implement agreed plans and programswhile ceding some form of economic sovereignty tosupranational institutions. If possible, the AU may needa review of the Abuja Treaty towards adopting a moreambitious and robust agenda, which can offer moreexibility and selectivity at the REC level. The continent mustalso see integration as one of the catalysts among otherstowards Africa’s development, growth and sustainability.
Because membership of regional union in Africa appearsto be automatic, there is a potential risk of low performingnations affecting others in the region. Yet, Africa cannotafford to leave some of the nations behind. To overcomethis challenge, AU could create Regional Monetary Zones(RMZ) in each of the regions and then assist RECs tospell out criteria that countries must met before they canbecome members. An alternative to this may be supportiveexpansion of the existing monetary unions-CMA, CAEMCand WAEMU. From these unions, AU will assist in cautionary,
selective and expansive strategy until all the nations areintegrated.
Though data shows only marginal gains for intra-Africantrade, at least at the short-run, the long-term benets arehuge. The continent has to approach the adoption of the
single currency cautiously. The continent should rst focuson strengthening the regional economic communitiesfor better currency union and nancial integration.
This will expand the levels of intra-trade in the blocs,enhance labour mobility and harmonize wage and price.A common regional currency under regional central bankswould then emerge. Under this, the regions would besupported to diversify their industrial structures to enablemore homogenous trade shocks, stabilize ination andinterest rates. Africa Union should ensure that NEPAD(New Partnership for Africa’s Development) delivers on itspeer-review mechanism towards economic growth, goodgovernance and strong scal policies across all economicregions. Finally, these regional currencies will converge to asingle African currency to be managed by a continent-widesupranational central bank. This strategy will reduce drasticdisruptions on African markets and their economic ties.

8/15/2019 African Single Currency
http://slidepdf.com/reader/full/african-single-currency 16/192
16
REFERENCESBalassa B, 1961, The theory of economic integration,London, Goerge Allen and UnwinCollier, Paul, 1991, “Africa’s External Economic Relations,1960–90,”African Affairs, Vol. 90, pp. 339–56Economic Commision for Africa (ECA), 2004, “Assessingregional integration in Africa 1, United Nations EconomicCommission on Africa, Addis AbabaDebrun, Xavier, Paul Masson, and Catherine Pattillo,2002, “Monetary Unions in West Africa: Who Might Gain,Who Might Lose and Why?” IMF Working Paper 02/226(Washington: International Monetary Fund)Ekekwe, Ndubuisi, 2002, “Information Technology as aBanking Competitive Strategy: A case study of DiamondBank Limited”, Doctor of Management Dissertation, SydneyEkekwe, Ndubuisi, 2008, “Our Mission and Introduction”,Neocircuit Publications, available at www.neocircuit.org,October 27, 2008Ekekwe, Ndubuisi, 2008, “A look into Nigeria’s futurewithout oil”, Nigerian Tribune, Oct 28, 2008Frankel, Jeffrey A. and Rose, Andrew K.,“Estimating theEffect of Currency Unions on Trade and Output” (August2000), NBER Working Paper No. W7857.Madyo, Manone Regina, “The importance of regionaleconomic integration in Africa”, University of South Africa,
July 2008Masson, Paul, and Catherine Pattillo, 2004, “A SingleCurrency for Africa?”, Finance and Development Magazine,December 2004, Volume 41, Number 4Masson, Paul, and Catherine Pattillo, 2004, The MonetaryGeography of Africa (Washington:Brookings Institution)Masson, Paul, 2006, TRADE AND CURRENCY UNIONS INAFRICA, available athttps://www.gtap.agecon.purdue.edu/ events/Conferences/2006/documents/Masson_PPT.ppt Siddiqi, Moin, 2006, “A single African currency in ourtime?”, Africa Business Publications, May 1, 2006Olubomehin, D, and Kwamonishe, D, 2004, “The African
Union and the challenges of Regional Integration in Africa”,Department of History and Diplomatic Studies, OlabisiOnabanjo University, Ago-Iwoye, Nigeria

8/15/2019 African Single Currency
http://slidepdf.com/reader/full/african-single-currency 17/192
17

8/15/2019 African Single Currency
http://slidepdf.com/reader/full/african-single-currency 18/192
REAL AND NOMINAL CONVERGENCE FOR
AFRICA’S COMMON CURRENCY:Getting the basics rightBy Olivia Muza

8/15/2019 African Single Currency
http://slidepdf.com/reader/full/african-single-currency 19/192
00INTRODUCTION
00CURRENCY STABILITY
00ENCOURAGE INWARDS
INVESTMENT
00DEVELOPMENT OF INTERNALCAPITAL MARKETS
00AFRICAN ECONOMICPERFORMANCE
00STABLE LEGAL SYSTEM AND“THE RULE OF LAW”
00AN END TO MENDICANCY
00CONTRIBUTORY CROSS BORDERMONETARY AND FISCAL POLICY
00THE ROLE OF CENTRAL BANKS
00ENCOURAGEMENT OFENTREPRENEURIAL CULTURE
00CONCLUSION
00THE GLOBAL FINANCIAL CRISIS
00RECOMMENDATIONS
C on t e n t s
25THE CURRENT PLAN: THEAFRICAN UNION-FREE TRADE
AGREEMENT (AU-FTA)
27STAGE AND OVERALLPROGRESS: TOWARDS AN FTA
AND A MONETARY UNION
28THE EUROPEAN MONETARYUNION (EMU) AS A MODEL FOR
CONVERGENCE IN AFRICA
30INTRA-REGIONALCONVERGENCE: SADC REGION
22EXECUTIVE SUMMARY ANDRECOMMENDATIONS
23INTRODUCTION
23BACKGROUND TO THE
RESURGENCE OF INTEREST INAN AMU
24REGIONAL ECONOMIC
COOPERATION ANDEMERGING ISSUES
20
8/15/2019 African Single Currency
http://slidepdf.com/reader/full/african-single-currency 20/192
20
EXECUTIVE SUMMARY ANDRECOMMENDATIONS
Imagine the same currency being traded from Cape toCairo if the vision of the African Union is realized! A singlecurrency (unitary or common) for Africa signies completemonetary union. This comprises one currency, one bank,and one monetary policy. Achieving this similarity acrossthe region involves convergence of the different RegionalEconomic Communities (RECS): their countries, policies and
systems. This further includes political, economic, socio-cultural and technological convergence. In essence the
proposal for a single currency for Africa calls for regionalharmonization in its profundity and extensiveness. Theconditions necessary to have only one common currencyare demanding. To start with, the AEC initiative is targetedfor 2028, on condition that the currencies of the three mainRECS (COMESA in 2018, ECOWAS in 2009 and SADC in2016) are harmonized.
In 1999, the European Monetary Union (EMU) became therst common currency community when 11 signatoriesadopted the Euro (Greece followed in 2001). Many studieson monetary union in Europe have underlined a high levelof real and nominal convergence as a prerequisite factor, iteffects economic and productivity growth (see for examplePacic Basic Notes, 2005; Scnabl and Grauwe, 2004McDonald and Ricc, 2001; Hein and Truger, 2005; Bora andBoutes, 2007). Convergence is dened as a high degree of
homogeneity between economies in what corresponds to principal characteristics. Real convergence is equalization ofthe standards of living (unemployment rate, the structureof the balance of payments and per capita revenue and
government expenditure). On the other hand, nominalconvergence expresses the degree of homogeneity of theeconomies (ination, type of interest rates, public decitand exchange rates). Yet, the fulllment of these variableswithin the established margins does not imply that a realconvergence has occurred, that is to say the one which isreected through the gures of unemployment per capitarevenue and government expenditure. Tensions betweenreal and nominal convergence, low ination and a stable
nominal exchange rate may arise due to the Balassa-Samuelson effect (B-S effect). On the other hand theadoption of a common currency depends on the natureof shocks across a potential currency area (Hargreavesand Mcdermont, 1999; Horvath and Komarek, 2002).If the shocks are symmetrical the cost of or the need forindependent monetary policy control is high. The oppositeis equally true if shocks are asymmetrical. This can createbig problems for policy makers if they are trying to set amacroeconomic policy that works for both the area affectedby the shock as well as the unaffected area.
In the African common currency context, one factor thatreduces the likelihood of different shocks is high tradeintegration among member countries. Other considerations
such as high labour mobility and a system of intraregionalscal transfers also lessen the cost. Four criticalconsiderations include the compatibility of convergencewhich is measured by the RER (Holden and Mbonigaba,2005) or GDP per capita, GDP per worker or labour
productivity in the manufacturing sector. In particular,the role of the distribution sector in inuencing the realexchange sector, the relationship between the exchangeand the change in per capita GDP, the relationship in growthterms, the relationship between relative price of non-tradedand traded goods.
In the SADC region for instance, macro-economicconvergence goals have been set as: ination rates around3%, budget decit over GDP less than 3%, public debtless than 60% and a current account balance over GDPof 9%. However, the existence of a converging group anda non-converging group has derailed the convergenceefforts, with the project being dubbed as highly unlikelyor an ambitious project. Divergence is perpetrated by:asymmetrical shocks, groupings and intra-regional policydivergence, uctuations of the real exchange rate andrelative prices for each non-CMA country relative to CMA’s.
Despite all these impediments theoretical and empiricalevidence from elsewhere convergence in the region in theregion may see the light of the day.
21

8/15/2019 African Single Currency
http://slidepdf.com/reader/full/african-single-currency 21/192
21
The following are policy recommendations:i. The existence of asymmetrical shocks should not
deter integration. Countries with a strong B-S
effect may receive a waiver.ii. To create a sound and stability oriented environment
for sustainable growth and convergence, an openmarket, stable prices, sound public finances,budgetary and structural policies and reforms andwage developments need to be monitored.
iii. Strategic wage setting by non-atomistic unionsmay render equilibrium employment sensitive tovarious characteristics of the monetary regime.
iv. Promotion of labour and capital mobility.v. Fiscal transfers between member states should be
promoted whenever asymmetrical shocks occur.For instance, the fiscal federalism-supranationalfiscal mechanism is important to create insurance.
vi. Political integration is key to economic integration
vii. The views, perceptions of the users of the common should be flighted in all policy documents to keeptrack of the reality of the situation on the ground.
viii.The reality of the socio-economic standing of thevarious countries of the continent should be closelymirrored in policy particularly the level of poverty in
Africa. This is because a common currency will not single-handedly solve Africa’s perennial problems
deep-rooted in poor governance and corruption.INTRODUCTION
Imagine the same currency being traded from Cape toCairo, if the vision of the 26 member states of the AfricanEconomic Community (AEC) is realised! The conditionsnecessary to have only one common currency (unitary orsingle) are demanding. However, should African economiesnecessarily converge before the adoption of a singlecurrency? A single currency for Africa means completemonetary union: one money, one bank and one monetarypolicy. Achieving this similarity across the region requiresconvergence of the Regional Economic Communities
(RECs); their countries, policies and systems. This furtherinvolves political, economic, socio-cultural and technologicalcohesion. In essence, the proposal for a single currency forAfrica calls for regional harmonisation in its profundityand extensiveness. This paper motivates the need forconvergence, harmonisation and cohesion as preconditionsfor a successful African Monetary Union (AMU).
BACKGROUND TO THE RESURGENCE OFINTEREST IN AN AMU
Africa, a continent of contradictions is at the crossroadseconomically, politically and demographically. Rich inresources, its people are becoming poorer by the day(Adepoju, 2001). Africa continues to be marginalisedby globalisation and liberalisation (increased integrationamong countries of markets for goods, services and capital,removal of cross-border impediments to the ow of nancialservices, trade, transportation and communication) eventhough tariff regimes have been lowered and free trade
promoted (Adepoju, 2001).According to Adepoju (2001), despite the overlappingmembership, wavering political support, a poor transportnetwork, border disputes and expulsions, [these] subregional organisations are crucial for the region’s collectiveintegration in the global economy. On a positive note,recently, the approval of expeditious establishment of a FreeTrade Area (FTA) encompassing the member/partner states
of the RECs with the ultimate goal of establishing a singlecustom union is one step towards complete liberalisation.1 The FTA will span 26 countries from the north in Egypt tothe south in South Africa. The 26 member countries ofthe groups have a total population of 527 million peopleand a gross domestic product (GDP) of US$624bn.2 Table 1provides evidence of the RECs membership, regional bloc,demographics and performance as of 2007 statistics.
22

8/15/2019 African Single Currency
http://slidepdf.com/reader/full/african-single-currency 22/192
22
Table 1: African Economic Community (AEC)
Pillars/ Regionalblocs (REC)
Area (km²) Population GDP (PPP) ($US) Member states
in millions per capitaAEC 29,910,442 853,520,010 2,053,706 2,406 53ECOWAS 5,112,903 251,646,263 342,519 1,361 15ECCAS 6,667,421 121,245,958 175,928 1,451 11SADC 9,882,959 233,944,179 737,335 3,152 15EAC 1,817,945 124,858,568 104,239 1,065 5COMESA 12,873,957 406,102,471 735,599 1,811 20IGAD 5,233,604 187,969,775 225,049 1,197 7Western Sahara 266,000 273,008 N/AOther Africanblocs
Area (km²) Population GDP (PPP) ($US) Member states
in millions per capitaCEMAC 3,020,142 34,970,529 85,136 2,435 6SACU 2,693,418 51,055,878 541,433 10,605 5UEMOA 3 3,505,375 80,865,222 101,640 1,257 8UMA 5,782,140 84,185,073 491,276 5,836 5GAFTA 5,876,960 166,259,603 635,450 3,822 5
Source: Economy of the African Union3
The AU is responding to regional challenges byrationalising and consolidating the RECs, acceleration ofthe establishment of the institutions provided for in theConstitutive Act, including the African Central Bank, asingle African currency, an African Monetary Fund and anAfrican Bank.
The AMU is the culmination of the Pan-Africanism agendainscribed by Nkwame Nkrumah as far back as 1963.4 Theadvantages of a monetary union include stability for internaland international trade, prohibiting predatory speculation
on a national currency, and disallowing one nation fromarticially manipulating its currency for unfair tradeadvantage.5 On the other hand, by delegating authority formonetary policy to a central bank, an individual country’scentral bank loses independent monetary policy control
and therefore, the ability to stabilise the economy when itis hit by a shock (Pacic Basic Notes, 2005).
REGIONAL ECONOMIC COOPERATION ANDEMERGING ISSUES
What took us so long? The case of sub-regionaldivergence and cooperation constraints
The quest for regional liberalisation is hampered by variousfactors at the inter-regional and intra-regional levels. Thefollowing factors are reported to jeopardise economicconvergence in the AU (Adepoju, 2001).
• Overlapping membership and institutionalarrangements have constrained efforts at integration.Member of states of ECOWAS, COMESA and SADCbelong to more than one union with differentideologies, aims and objectives.
23

8/15/2019 African Single Currency
http://slidepdf.com/reader/full/african-single-currency 23/192
23
• Economic Unions are often dominated by theeconomies of a single country and movement ofpersons have been directed to a limited number ofcountries within these unions-SA and Botswana inSADC, Gabon in UDEAC, Cote de Ivoire in CEAO,Nigerian in ECOWAS and Congo in CEPAL.
• Persistent economic downturn has crippled theability of states to pursue consistent macro-economicpolicies, resulting in part to poor funding of theseunions.
• The non-convertibility of currencies, especially in
ECOWAS, hinders nancial and harmonisation ofmacro economic policies and procedures. Ubiquitousroadblocks across frontiers, especially ECOWAS,lengthy and costly formalities at border posts, andthe corruption of ofcials make intra-communitymovement a difcult endeavour.
• COMESA’s protocol on free movement and SADC’shalf-hearted attempt to facilitate intra-communitymovement of nationals are still largely on thedrawing board.
• ECOWAS’s protocol on Establishment and Residencehas not been implemented, in spite of the close linkto right of free movement, integration of trade, tariffregimes and promotion of labour mobility in the subregion.
• The weak inter-country infrastructure facility as
illustrated in the case of railways which have differenttrack systems as well as rules and regulations thatchanges across frontiers.
• The share of intra-regional trade is often cited asa measure for success of an integration groupingusing, this index, and the share of inter-African traderemains miniscule. 5-8% of export trade over thelast two decades compared with over 60% in theEU. Africa’s markets are fractured, while scal andmonetary policies are distorted (Bach, 1999).
• Community citizens have been expelled by mostmember states in spite of the protocol on freemovement of persons.
• Wrong political support, political instability, andthe reluctance of countries to surrender nationalsovereignty to a sub regional organ have renderedthe economic groupings ineffective.
At the Conference on Security, Stability, Development andCooperation in Africa6, regional divergence was reported tobe perpetuated by the following factors:
• Lack of political will• Lack of adequate nancial arrangement• Absence of key sub-regional/regional promoters• Weak inter-country infrastructural facilities• Emergence of economic crisis in the 1980s• Political instability• Interstate border disputes and wars
THE CURRENT PLAN: THE AFRICAN UNION-FTRADE AGREEMENT (AU-FTA)
The Tripartite Summit, which sat in Kampala recently (25thof October, 2008), proposed an FTA plan to guide and chatthe way forward, towards regionalisation. The followingstrategic plan was agreed:
• A task force comprising members of the three blocsto formulate a strategy for establishing the free tradearea within six months
•
Tripartite Task Force of the three secretariats todevelop a roadmap for the implementation of thismerger for consideration at its next meeting
• The summit directed the three blocs to undertakea study incorporating, among other things; thedevelopment of a roadmap, within six months.The study would take into account the principleof variable geometry; the legal and institutional
framework to underpin the FTA and measures tofacilitate the movement of business persons acrossthe RECs. The study will be presented at a TripartiteCouncil of Ministers for consideration within thenext 12 months. The study will determine among
24

8/15/2019 African Single Currency
http://slidepdf.com/reader/full/african-single-currency 24/192
24
other things the time frame for the establishment ofa single FTA encompassing the three RECs.
• Chairpersons of the council of ministers of the three
bodies to ensure that joint programmes that enhanceco-operation and deepening of co-ordination inindustrial and competition policies, nancial andpayment systems, development of capital marketsand commodity exchanges are speeded up. Theministers have also been tasked with ensuringthat the secretariats participate, coordinate andharmonise positions on the EPA negotiations andother multilateral negotiations including the WTODoha negotiations.
• In the area of infrastructure development, the summitlaunched the joint competition authority (JCA) on airtransport liberalisation which will oversee the fullimplementation of the Yamoussoukro decision onair transport in the three RECs commencing January2009.
• The three RECs to put in place, within one year; a joint programme for the implementation of a singleseamless upper airspace; a joint programme for theimplementation of an accelerated, seamless inter-regional ICT broadband infrastructure network.
• A joint programme for implementation of aharmonised policy and regulatory framework thatwill govern ICT and infrastructural development inthe three RECs.
• The summit directed the three blocs to effectivelycoordinate and harmonise within one year: theregional transport master plans, energy priorityinvestment plans and the energy master plans. Italso called for joint nancing and implementationmechanisms for infrastructure development withinone year.
• With regard to the legal and institutional framework,the summit directed the council of ministers of thethree bodies to, within six months, consider andapprove an MoU on inter regional cooperation andintegration.
• The summit established a Tripartite Summit of Headsof State and/or government which shall sit onceevery two years.
25

8/15/2019 African Single Currency
http://slidepdf.com/reader/full/african-single-currency 25/192
25
STAGE AND OVERALL PROGRESS: TOWARDS ANFTA AND A MONETARY UNION
Table 2 and 3, illustrates the progress (stage and overall) ofthe FTA.
Table 2: Stages progress7
Regional blocs - pillars of the African Economic Community (AEC) 8
Activity
C E N - S A
D
C O M
E S A
E A C
ECCAS ECOWAS
I G A D
SADC
U M A
C E M
A C
C o m
m o n
U E M
O A
W A M Z
C o m
m o n
S A C U
C o m
m o n
FreeTradeArea
stalled progress-ing 1
fully inforce
fully inforce
proposedfor 2007?
fully inforce proposed stalled fully in
forceproposedfor 2008 stalled
CustomsUnion stalled proposed
for 2008fully inforce
fully inforce
proposedfor 2011?
fully inforce
proposedfor 2007 stalled fully in
forceproposedfor 2010 stalled
Source: African Economic Community 9
26

8/15/2019 African Single Currency
http://slidepdf.com/reader/full/african-single-currency 26/192
26
Table 3: Overall progress of the Region’s blocs10
Activities
Regional blocFree Trade
AreaCustoms
Union
Economic andmonetary union Free Travel
Politicalpact
Defencepact
SingleMarket
CurrencyUnion Visa-free Border-less
AEC proposed for2019
proposed for2019
proposedfor 2023
proposed for2028
proposedfor 2028 ?
CEN-SAD proposed for2010
COMESA in force1 proposed for
2008 ?proposed for
2018EAC in force in force proposed
for 2009proposed for
2009 proposed ? proposedfor 2010
ECCASCEMAC in force in force ? in force
Common proposed for2007?
proposed for2011? proposed proposed proposed ? in force
ECOWAS
UEMOA in force in force ? in force
WAMZ ?proposed for
2009
Common proposed2 proposed for2007 ? proposed in force1 proposed proposed in force
IGAD
SADCSACU in force in force de-facto in
force 1 ?
Common 2 proposed for2008 3
proposed for2010
proposedfor 2015
proposed for2016
UMA
Source: African Economic Community 1
A critical review of the current state of affairs, the proposedplan of action can provide us with the answer to the criticalquestions. We seek to understand the nature, timing,mechanism and model of convergence to be adopted inthe current case. This is what the next section turns.
THE EUROPEAN MONETARY UNION (EMU) ASMODEL FOR CONVERGENCE IN AFRICA
According to the EMU model monetary integration isachieved through the introduction of a single currency,common policy managed by common institutions anda high degree of convergence by the partners as aprerequisite. Convergence is dened in the EMU context as‘a high degree of homogeneity between economies in what
27

8/15/2019 African Single Currency
http://slidepdf.com/reader/full/african-single-currency 27/192
27
corresponds to the principal characteristics’. Integration inthe model depends on the fullment of nominal and legalconvergence criteria and the free will of countries.12 Thevariables that serve to express the degree of homogeneityof the economies are listed as:
Nominal convergence
These are all variables that serve to sufciently express thedegree of homogeneity of the economies, even though itsfullment within the established margins does not implythat a real convergence has occurred, that is to say the onewhich is reected through the gures of unemploymentrates, per capita revenue, government expenditure
• Ination• Types of interest• Public decit• Public debt• Exchange rates
Legal convergence
The adjustment of the national legislations and the Bylaws ofthe central banks of the member countries of the EU so thatthey are compatibles with the ESCB. In a general sense, thisconvergence includes questions such as the independenceof the national central banks and the integration of these
banks in the ESCB.Real Convergence
The equalisation of the standards of living, what thecommission calls ‘economic and social cohesion’. In orderto achieve an equalisation in these areas much more timeis required than the minimum variables, whose fullmentaffects in a benecial way the real variables. Therefore with
the installation of the Euro and the existence of a commonmonetary policy in the Union, the revenue should beevening out. Its variables would be
• The unemployment rate• The structure of the BOP
• The per capita revenue and governmentexpenditure
Monetary integration in the EMU occurred in threeimportant phases which include:
• Diagnostic stage (1990-1993)-economic and mone-tary convergence was assessed while member stateswere to adopt appropriate measures to comply withcertain prohibitions in the Treaty on the EuropeanUnion (signed in 1991)
• Convergence stage (1994-1998)-member stateswere to prepare towards adopting the euro andwere expected to make signicant progress towardseconomic convergence.
• The period of implementation (1999-2002) Conver-sion rates between the Euro and national currencyunits were irrevocably xed, and the Euro was to be-come the currency of the participating countries andwas to be used in the foreign exchange markets.
Compatibility of convergence and the Balassa-SamuelsonEffect-theoretical and empirical evidence
The post Euro results show that compatibility of convergenceis important. Firstly, openness has had a negative impact onproductivity growth and a positive one on the price andresurgence with respect to the Euro area (Lein-Rapprechtet al. 2007). Secondly, the mechanism of real convergencehighlights that if economic growth is accelerated by virtue
of closing a technological gap, the process of nominal andreal convergence can indeed be compatible (Smidkova,2001). Thirdly, growth and convergence of prosperityacross a currency union rather depend on the appropriatemacroeconomic policy institutions (Hein and Truger, 2003).
Fourthly, new member states are required to have a highlevel of real and nominal convergence prior to adoptinga common currency (Gaspar, 2004). However, tensions
between real convergence, low ination and a stablenominal exchange rate may arise due to the Balassa-Samuelson Effect. The Balassa-Samuelson mechanism isessentially interpreted as reecting long-term steady-stateeffects. The Balassa-Samuelson paradigm is useful tointerpret current events when intertemporal relative price
28

8/15/2019 African Single Currency
http://slidepdf.com/reader/full/african-single-currency 28/192
8
and allocation effects are a critical part of the economicresponse to productivity shocks.
The existence and nature of optimal macro-economic
adjustments is an important factor for policy makers toconsider:• Wealth effects lead to changes in optimal demand
behaviour on impact and in transition to new steady-state trajectory that are signicant
• There is a potential for great changes in demand wellbefore the full extent of productivity changes is feltby the economy
• Demand effects are outside the scope of the standardBalassa-Samuelson paradigm.
Fifth and nally, according to the optimum currency theory,the cost, or the need for independent monetary policycontrol, is greater when member countries are exposed todifferent shocks and lesser when they are exposed to thesame or similar shocks (Pacic Basin Notes, 2005).
INTRA-REGIONAL CONVERGENCE: SADCREGION
The Balassa-Samuelson Effect suggests that nominal and realconvergence in a divergent block like the AEC is a complexprocess which calls for a case by case analysis taking intoaccount all information. This complication quiz whetherthe convergence should be inward or outward oriented.An outward oriented approach focuses on inter-regionalregion convergence whereas intra-regional convergencedenotes an inward oriented approach. From Table 1 andTable 2 provided earlier, it is evident that regional blocks aremore related in terms of economic activities, (macro andmicro targets) for convergence over time. Africa is a ddlycase for the simple reason that political leaders wield moreauthority over economic concerns. Undoubtedly, economic
and political convergence in the region goes hand in hand.To eliminate inter-regional differences this study proposesa case by analysis of the regional blocks. The SADC case isdiscussed in the next section.
Regionalisation in SADC
The Southern African Development Community
(SADC) may introduce a single Southern African currency by 2016, to be managedby a single central bank. SADC plans forfurther economic integration are far advanced.
A common Southern African market -following the European Union (EU) model - isto be established by 2016. The SADC block willunite the markets of Angola, Botswana, CongoKinshasa (DRC), Lesotho, Malawi, Mauritius,Mozambique, Namibia, South Africa, Swaziland,Tanzania, Zambia and Zimbabwe. Madagascaris joining SADC later this year. The plan fora
single market calls for the abolition of tariffsand non-tariff barriers by 2008; aSADC-widecustoms union by 2010; a common market ,including free movement of labour and capital,by 2015; and a single currency and central
bank by 2016.13
.Source: afrol News, 11 March, 2008
The above press release shows that the public discoursealso carries a cogent message for the region’s convergenceefforts. However, these public discourses are not supportedby the reality and actions on the ground. There is a cleardivergence of issues between rhetoric and practice. The
plan looks good on paper but the ‘will and way’ seems tobe elusive.
Before one can even consider deeper economic integrationin the SADC, liberalisation of the region is a critical point.However, some SADC members still belong to other regionalbodies, whose ‘ideologies, aims and objectives’ showsconicting interests in practice. For instance the relationshipbetween SADC and Southern Africa Customs Union (SACU)SACU and the Common Monetary Agreement question thededication of member states to these two regional bodiesand stakeholders which take precedence.
29

8/15/2019 African Single Currency
http://slidepdf.com/reader/full/african-single-currency 29/192
Economic integration itself goes beyond liberalisation ofborder trade.
• Yet member states of SADC still have free travel (visa
free and borderless) limitations, for instance SouthAfrica and Zimbabwe still hold travel inhibitions.• Quotas, prohibitions and licensing applying to imports
from one member country. Zimbabwean buyers fromSouth Africa are only allowed to import goods thathave a maximum value of R2000. Importation of carsin Zimbabwe for instance, “payments of customsduty and value-added tax on the importation of anyitem of goods designated as luxury items shall bepayable in US dollars, euros, or any other currencydenominated under the exchange control,”13 Thegeneral rate of duty for cars ranges between 60%and 80%.
• Technical barriers due to industrial, environmentaland other standards, other regulations whichdiscriminate against foreign goods and differencesin tax treatment
• Restriction of ows of services and of capitaland labour across national borders-Zimbabweannationals still have to carry a valid visa for SouthAfrica. Recently South Africa has opened the labourmarkets by announcing a scarce skill work permit forforeign nationals who have these skills and wish towork in South Africa.
The lack of a free market in region has led to discriminationbetween borders. The lack of a regional Law of One Pricewhich holds for all goods, services and factors derails thefree ow of goods and services and goods across SADC.
The call for a common currency in the SADC region is basedon the realisation that a single market requires a commoncurrency. A common currency eliminates transaction costsand exchange rate risk, thus price differentials.
The objective of the common market, the timetable for theachievement of the common market as well as the choice ofthe modalities is all in place. Also the targets and deadlinesfor the different countries of the region are not clearly
spelt out. What modalities are going to be adopted by thedifferent countries? Countries like Zimbabwe, which is in adeep economic and political crisis might require more timeto achieve a policy change, as compared to more stableSouth Africa. Zimbabwe might therefore require a longerimplementation period and a more attenuated time table.
There are sectors within the countries that will requiresector based modalities to achieve the same regional goal.The institutions of the region further require support so thatthey reach the timeline goals.
When this kind of regional integration has occurred, thena common currency for SADC can be adopted. The currentstructure of the macro-economies, the extent of bilateraltrade, the sophistication of their nancial sectors and otherrelevant features are important considerations. Howeverfor countries to have a single unit of currency there has tobe one goal. With the treaty of Maastricht, the communityclearly went beyond its original economic objective and itspolitical ambitions came to the fore.
•
Strengthen the democratic legitimacy of theinstitutions• Improve the effectiveness of institutions• Establish economic and monetary union• Develop the community social dimension• Establish a common and foreign and security policy
As for ASEAN the crisis had its origins in commonweaknesses in the nancial and corporate sectors amongseveral countries, and so cross-country cooperation onnancial reform issues would be benecial to all.
• Regional information exchange and surveillance• Regional resources pooling• Financial sector development• Exchange rate coordination
Challenges for regional convergence in SADC• Low trade interdependencies-countries do not
trade a lot with each other with a current 7% inter-regional effort. Furthermore most of the African
30

8/15/2019 African Single Currency
http://slidepdf.com/reader/full/african-single-currency 30/192
countries depend on raw materials which still haveto be transported out of the region for processing.This leaves out little gain for the regional tradingpartners.
• Lack of democracy, rare acceptance of basic politicaland social values-there is currently no apparent desirefor political integration, political systems and culture.Some countries still hold on to their historical pathswhich makes difcult for any other member state tochallenge such ideology.
• Fairly uneven economic development and comparableliving standards, and divergences amongst itspoorest economies-Generally standards within SADCcountries and between regional blocks is astounding.The smaller fear that surrendering power is betrayalto their sovereignty to the big powers of the region.
• Lack of commitment to solidarity• Fear of surrendering power to a central autonomy
with leaders hooding on to power.• The timing of a common currency also is a signicantaspect of future debate. Should countries focus on
self development until such a time when they cancompete with partners at the regional level? Willsuch a time ever come? Perhaps the best thing isto start now so that weaker nations will eventuallycatch up with the old partners.
31
8/15/2019 African Single Currency
http://slidepdf.com/reader/full/african-single-currency 31/192
1 Report available on http://www.busiweek.com/index.php?option=com_content&task=view&id=561&Itemid=1 [last accessed on 29 October 2008]
2 ibid3 Statistics available on http://en.wikipedia.org/wiki/Economy_of_the_African_Union
[last accessed on 24 September, 2008]
4 The vision for Africa he inscribed is inclusive of 10 objectives which are: a commoneconomic and industrial programme, an African common market, a commonAfrican currency, an African monetary zone, an African central bank, a continentalcommunication system, a common foreign system and diplomacy, a commonsystem of defence, a common African citizenship, a common African army withan African high command.
5 Hardy, A. (1999).6 Report available on http://www.iss.co.za/Pubs/Books/Unesco/Aderinwale.html [Last
accessed on 20 August, 2008]7 Members not yet participating: Angola, DR Congo (in talks to join), Eritrea, Ethiopia,
Seychelles (in talks to join), Swaziland (on derogation until SACU gives permissionfor Swaziland to join the FTA), Uganda (to join very soon)[1]
8 Stage 1: Completed, only UMA members and Sahrawi Republic not participating.Somalia is participating, but no practical implementation as of yet, Stage 2: Steadyprogress, nothing factual to check, Stage 3: no progress yet, Stage 4: no progressyet, Stage 5: no progress yet, Stage 6: no progress yet
9 [http://en.wikipedia.org/wiki/African_Economic_Community]10 Not all members participating yet2 Telecommunications, transport and energy -
proposed 3 Sensitive goods to be covered from 201211 Available on http://en.wikipedia.org/wiki/African_Economic_Community [last
accessed on 23 August 2009]12 The ECT included the designated exclusion clause, for which certain countries
could remain outside of the EMU if they so decided in spite of their compliancewith the convergence criteria.
13 Information released by the government of Lesotho Report available on http:// www.afrol.com/articles/15869 [last accessed on 25 August, 2008]
14 Mumbengegwi the current Minister of Finance in Zimbabwe, 18 June 2008
End Note

8/15/2019 African Single Currency
http://slidepdf.com/reader/full/african-single-currency 32/192
An Alternative Reconsiderationof Macroeconomic ConvergenceCriteria for West AfricanMonetary ZoneBy E. D. Balogun, Department of Economics, University of Lagos
8/15/2019 African Single Currency
http://slidepdf.com/reader/full/african-single-currency 33/192
C on t e n t s
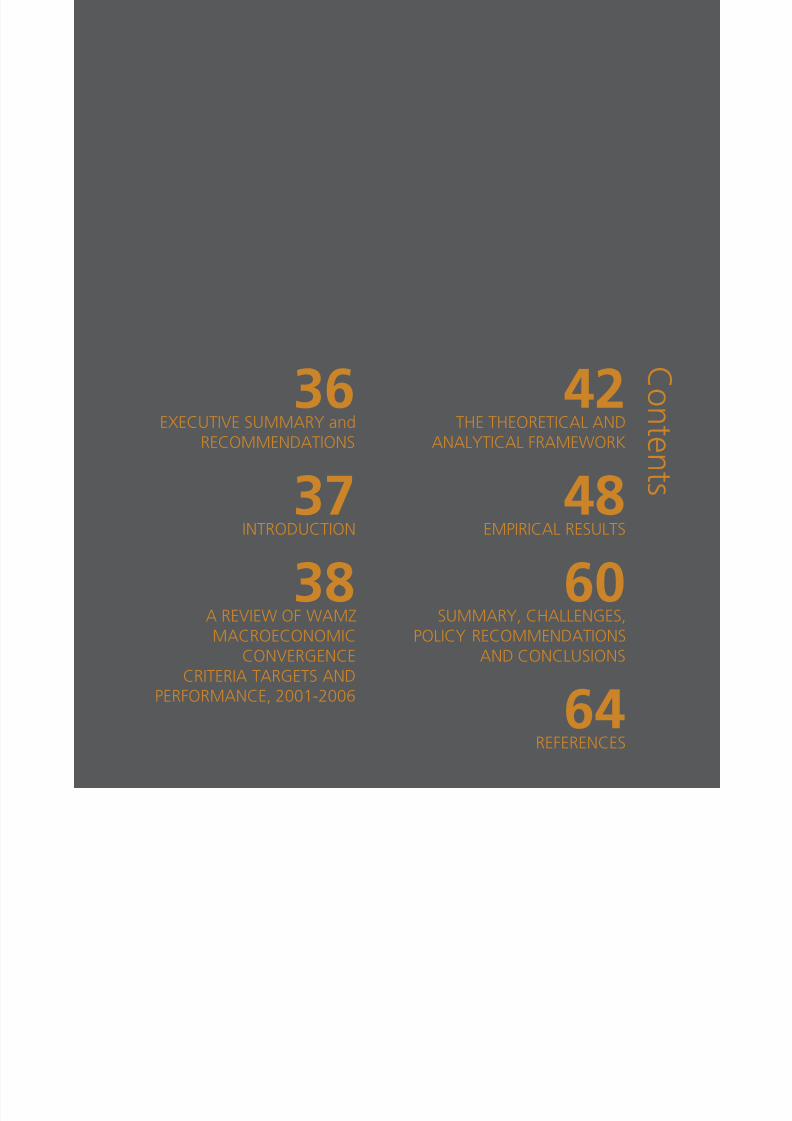
42THE THEORETICAL AND
ANALYTICAL FRAMEWORK
48EMPIRICAL RESULTS
60SUMMARY, CHALLENGES,POLICY RECOMMENDATIONS
AND CONCLUSIONS
64REFERENCES
36EXECUTIVE SUMMARY and
RECOMMENDATIONS
37INTRODUCTION
38A REVIEW OF WAMZMACROECONOMIC
CONVERGENCECRITERIA TARGETS AND
PERFORMANCE, 2001-2006
34
8/15/2019 African Single Currency
http://slidepdf.com/reader/full/african-single-currency 34/192
EXECUTIVE SUMMARY ANDRECOMMENDATIONS
This study presents an alternative reconsideration oftraditional Optimum Currency Areas (OCA) macroeconomicconvergence criteria as options for West African Monetary
Zone (WAMZ) commencement, in the light of recentadvancements in monetary theory. It presents micro-founded models, rooted in New Keynesian traditions to
show that tests conrming widespread divergence fromideal macroeconomic benchmarks with unsustainableindependent monetary and exchange rates pursuits andtrade gravity models offer a more appropriate evaluatingcriterion for WAMZ than the current one, if the ultimateobjective is a merger with West African Economic andMonetary Union (WAEMU). Using econometrics methods,especially pooled single equation models applied to nationalmacroeconomic data which span 1991Q1 to 2007Q4,I evaluate the roles of past unsustainable independentnational monetary and exchange rates policy pursuits as
determinants of macroeconomic stabilizations (reected bythe ination differential and output gaps/performance vis-à-vis the WAMZ area targets) and inter/intra-regional export
performance. This was accompanied by the estimation of atrade gravity model. The strong convergence of aggregateoutput/demand pattern between WAMZ countries basedon trade gravity models thus emerges as a possible positiveattribute of countries participating in efcient currencyareas.
The WAEMU can be studied further to identify the optimal policy and institutional framework for the WAMZ.
i. A vertical integration option similar to that of
WAEMU should be adopted for integrating thenational central banks, common monetary policyand currency managements so as to make thefuture merger of WAMZ with it easy to accomplishfor the region-wide ECOWAS common currency.This means that WAMZ should consider fusingtogether their existing central banks into oneregional central bank, instead of the proposedmaintenance of a system of national centralbanks (similar to the EU) which requires the needfor the attainment of ex ante macroeconomicconvergence.
ii. A complimentary political and over-sightinstitutional arrangements similar to that of theWAEMU, meaning that WAMZ would be headed byConference of Heads of States, while the commoncentral bank would be headed by a Council of
Ministers that should include Finance Ministers ofmember countries. However, unlike WAEMU, thisbody should be expanded to include the Governorof each of the participating central banks (the
promoters of the union) as executive members ofthe West African Central Bank governing board.
iii. An adoption of institutional and administrativeoptions for the supra-national central bank that
is modeled along the lines of the BCEAO, thecommon central bank of the WAEMU.iv. An adoption of a monetary policy option that is
consistent with the integration model chosen. Inthis wise, the West African Central Bank should
possess instruments autonomy to set ultimateobjectives, intermediate targets and operating
procedures for the implementation of union-
wide monetary policies without interference fromany participating country’s government within oroutside the sub-region.
v. An adoption of a payment systems frameworkthat takes into account the current habit and
35

8/15/2019 African Single Currency
http://slidepdf.com/reader/full/african-single-currency 35/192
preference of the people in the region to transactin cash as against cheques, credit cards or otherbank instruments. This requires making adequate
provisions for cash dispensing machines. This should also be accompanied with the developmentof region-wide payment systems.
vi. The adoption of an exchange rate mechanismand convertibility arrangements such that theinitial parity rate is one that is optimal and sociallyacceptable by all stakeholders. It is recommendedthat this should be determined as a weightedaverage (using either stock of external reservesor any other criteria as weights) of the exchangerates of the existing national currencies of
participating countries to the US Dollar at the timeof commencement of the common currency. It isalso recommended that the Euro and not the USDollar should be adopted as the main reservescurrency of the WAMZ given the dominance of theEU countries as trading partners.
INTRODUCTION
The evaluation of WAMZ feasibility has been guided byboth the general and “shocking” studies criteria (Ojo2005; Nnanna 2007). This approach insists onex ante pursuit of macroeconomic policy convergence that leads tosimilarity of shocks and minimizes the costs of unionization(Mundell 1961, Kenen 1969) as a necessary preconditionfor the optimal operations of the OCAex post . However,several such convergence reports to the WAMZ authoritiesby the West African Monetary Institute (WAMI) returneda verdict that WAMZ was unripe for commencement in
2003 but suggested 2005 that was ultimately deferredto 2009. Nnanna (2007) also relied on macroeconomicconvergence criteria to ask if a third postponement of theEco Currency introduction for the WAMZ is unavoidable.A few number of other studies used a VAR model toanalyze asymmetric shocks in West Africa following thestandard techniques applied in industrialized countries, aspioneered by Blanchard and Quah (1989) and Bayoumi andEichengreen (1992). Among them are Fielding and Shields(2001 & 2003), Houssa and Leuven (2004), Ogunkola(2005) and Masson and Pattillo (2004) studies based onthe optimum currency area literature, which focuses onasymmetries of shocks and scal distortions associated withindependent monetary policy pursuits in the region. Theyshow that countries that were very different with respectto scal distortion would be unattractive partners for amonetary union, because the central bank would produce
undesirable outcomes for one or both of them. In mostof these studies, Nigeria was identied as an unattractivepartner for the WAMZ monetary union, while suggestingselective accession to existing monetary union by intendingmembers of this union to the WAEMU.
Indeed, these traditional evaluation criteria tests providedby several studies on the desirability of the EMU wereappropriate as the underlying basic assumptions of the
model apply to market economies that are competitive,organized, developed and respond quickly to policystimuli. However the application of this model to Africanand ECOWAS countries characterized by less developedregimented markets tended to produce indeterminate andundesirable results.
36

8/15/2019 African Single Currency
http://slidepdf.com/reader/full/african-single-currency 36/192
There have emerged new literatures which show thatreal economic convergence which follow stronger tradeties rather than policy convergence may represent betterevaluating criteria for the WAMZ. Among them is Frankeland Rose (1998), Rose (2000), Debrun, Masson and Pattillo(2003), Anyanwu (2003), Hausman et al. (2001), Corsettiand Pisentti (2005) and Corsetti (2008) that argues thatirrespective of the stage of development and economicstructures, membership of a currency union can boost intra-regional trade and could act as a veritable instrument formacroeconomic convergenceex post . Their ndings showthat important benecial effects followex post a monetary
union through the promotion of trade and central bankcredibility induced by unionization, which acts as an ‘agencyof restraint’ for otherwise undisciplined independent scalimpetus and monetary stance. Hence tying the hands ofthe monetary authorities through a regional constrain onmonetary policy in the context of a monetary union wouldbe a good thing.
The problem this study is designed to examine revolves
around mainly the failures of traditional evaluating criteriato lead to a determinate date for the commencementof the WAMZ. In particular, there is an urgent need toexplore alternative models to macroeconomic convergencecriteria. Such alternatives should capitalize on current socio-economic and nancial structures of the WAMZ to showthat ex ante convergence is unnecessary if the ultimatetarget is unication with WAEMU. In particular there isthe need to show that current independent monetary andexchange rates policy pursuits neither served as instrumentsfor macroeconomic stabilization nor global/intra-regionaltrade stimulation and that trade gravity models mayrepresent a better test for the commencement of WAMZthan macroeconomic convergence criteria. The rest of thepaper presents a brief overview of WAMZ performancewith macroeconomic convergence criteria in part 2. Part3 reviews the theoretical and analytical models. Part 4
presents the results while Part 5 the concluding remarksand policy implications.
A REVIEW OF WAMZ MACROECONOMICCONVERGENCE CRITERIA TARGETS ANDPERFORMANCE, 2001-2006
These criteria has its origin in traditional OCA theorywhich believes that countries exposed to similar symmetricshocks and business cycles, or possessing mechanismsfor the absorption of similar asymmetric shocks may ndit optimal to adopt a common currency. Much of thisliterature focuses on four inter-relationships between themembers of a potential OCA. As observed by Frankel andRose (1998) these are: the extent of trade; the similarity ofthe shocks and cycles; the degree of labor mobility; and thesystem of scal transfers (if any). The greater the linkagesbetween the countries using any of the four criteria, themore suitable they are for a common currency. These havebeen encapsulated in a number of primary and secondaryquantitative targets that intending members of WAMZ mustcomply with prior to the commencement of the project.They include: the attainment of single digit ination that is
less than 10 per cent; a budget decit (excluding grants) toGDP ratio that must be equal to or less than 4.0 per cent;central bank nancing of the budget decit that shouldbe equal to or less than 10 percent of previous year’s taxrevenue and maintenance of external reserves to cover atleast 3 months of imports. The targets for the secondaryconvergence criteria specied to compliment the primaryones are: that the level of domestic arrears should be equalto, or less than zero; tax revenue to GDP ratio must beequal to or greater than 20 percent; government wage billto tax revenue ratio to be equal to or less than 35 percent;public sector investment to tax revenue ratio to be equalto or more than 20 percent; real interest rate to be greaterthan 0.0 percent, and lastly, the nominal exchange ratemovement to be within the band of (± 15 percent)
Tables 1 show the summary of average regional performanceof WAMZ participating countries with regard to theprimary and secondary convergence criteria. The regionalaverage performance shows that only the scal decit/ GDP ratio and maintenance of adequate foreign reservescriteria were met in 2006 on a region wide basis. However,
37

8/15/2019 African Single Currency
http://slidepdf.com/reader/full/african-single-currency 37/192
when analyzed from the perspective of the number ofparticipating countries that met the criteria, Figure 1 showthat two countries, The Gambia and Nigeria met all the fourprimary criteria in 2006; Guinea and Sierra Leone met 2 outof the 4 primary criteria, while Ghana met 1. The graphicalanalysis of the extent of compliance with convergencecriteria is as shown in Figures 2 and 3. Two inter-twinedpreconditions were set for the commencement of WAMZ.The rst relates to participating countries eligibility criteria,which demands that they meet 4 primary and at least 6secondary convergence criteria. The second relates to thecommencement date of the WAMZ which stipulates that
an optimal date would be one in which at least 3 countriesmeet a minimum of 3 primary and 3 secondary criteriaimmediately prior to the commencement of the union.While the rst requires conscious effort of each participatingcountry scal and monetary authorities towards adoptingsustainable policies, the second requires the need forsynchronization of such policies with the regional target setfor the collective endeavors.
Table 1: Status of WAMZ Region-Wide Primary and SecondaryConvergence Criteria Performance
PrimaryConvergenceCriteriaPerformance T a r g e
t
2 0 0 1 2 0 0 2
2 0 0 3 2 0 0 4
2 0 0 5 2 0 0 6
Ination Rate(end Period) <10% 15.2 11.6 22.1 11.5 13.4 11.5
Fiscal Decit/ Surplus/GDP (%)excl. grants
4 –5%** -4.2 -4.5 -2.8 -2.0 -1.7 -1.3
Central Bank
Fincg. Of scaldecit as % ofPrev. Yr’s tax rev.
<10% 17.9 12.3 27.7 4.6 0.0 13.5
Gross ExternalReserves (Monthsof Imports) (*)
3months 7.4 5.5 4.8 9.7 13.2 20.3
Numberof CriteriaSatised
4 1 1 2 3 3 2
SecondaryconvergenceCriteriaPerformance T a r g e t
Change in arrears ≤ 0 n.a. n.a. n.a. n.a. n.a. n.a.Tax revenue/GDPratio > 20% 14.70 10.70 12.10 15.20 19.40 15
Salary mass/Total
tax revenue≤35% 30.8 48.1 30.8 25.6 21.2 23.2
Domesticallynancedinvestment/Rev
>20% 31.0 69.5 48.4 28.4 38.2 39.0
Real interest rate >0 -2.4 -1.3 -11.6 -6.3 -6.5 -5.9Exchange rateDep/App. (-/+)against WAMZERMII
+/-15% 3.8 11.3 7.1 0.7 7.9 9.2
Number ofCriteria satised 6 3 2 3 3 3 3
(*) in months of imports CI: ** 5% IN 2001-20002 and 4% in 2003-2006Source: Derived from data obtained from west African andMonetary Institute Website: wami-imao.org
38

8/15/2019 African Single Currency
http://slidepdf.com/reader/full/african-single-currency 38/192
0.0
0.5
1.0
1.5
2.0
2.5
3.0
3.5
4.0
4.5
200620052004200320022001 200620052004200320022001
Figure 1: Number of Primary ConvergenceCriteria met by Wamz, 2001 - 2006
Guinea
Ghana
Gambia
Target
WAMZ
Sierra Leone
Nigeria
With regard to the rst, the trend reected in Figure 1 showthat in 2004 to 2006, only two countries, the Gambia andNigeria, progressed towards attaining the primary criteria.Both met the primary criteria in 2006. While Guineaprogressively deteriorated in performance, Ghana and SierraLeone met only two criteria during the period. The situationis most precarious with regard to meeting the secondaryconvergence criteria. While Nigeria met 4 of the secondarycriteria, Gambia and Ghana met 3 out of the recommended6 convergence criteria. What this translates to is that only
two countries met the prequalication criteria for themembership of the union as the score card for Guinea andSierra Leone has not been encouraging enough.
0
1
2
3
4
5
6
7
Figure 2: Number of Secondary ConvergenceCrieria met by WAMZ, 2001- 2006
Guinea
Ghana
Gambia
Target
WAMZ
Sierra Leone
Nigeria
With regard to the second criteria, Figure 2 shows that sinceinception, the number of countries that met the primaryconvergence so far were 2, namely Gambia and Nigeria in2006. However, the precondition for takeoff requires that aminimum of 3 countries must satisfy at least 3 primary and 3secondary convergence criteria. The best attainment so faris that while three countries met 3 secondary convergencecriteria, only 2 of them met the primary criteria which areconsidered a sine qua non for the commencement of theprogramme. The most worrisome aspect of this situation isthat there is no likelihood that up to 3 countries would meetthese criteria given the didactic actions and apparent lackof policy coordination among them. This would therefore
tend to suggest the inevitability of another postponementat the end of the terminal period of the third phase of theWAMZ project. It also tends to portend a gloomy prospectfor the commencement of WAMZ within the foreseeablefuture.
39

8/15/2019 African Single Currency
http://slidepdf.com/reader/full/african-single-currency 39/192
0
0.5
1.0
1.5
2.0
2.5
3.0
3.5
200620052004200320022001
Figure 3: Performance with Meeting MinimumCriteria for Commecement of WAMZ, 2001-2006 Secondary Primary Target
Table 2: WAMZ Country Share in Total WAMZ Trade
The Gambia 2001 2002 2003 2004 2005 Avg.
Ghana 0.41 0.29 0.29 0.37 0.38 0.37Guinea 10.32 11.87 11.87 7.67 9.73 10.71Nigeria 0.25 0.35 0.35 0.76 0.34 0.42Sierra Leone 0.20 0.19 0.19 0.36 0.36 0.28Total: WAMZintra-trade
4.16 2.96 2.96 0.94 0.94 2.03
To total trade 3.07 3.13 3.22 2.05 2.35 2.76
Source: derived from data compiled from ECOWAS
The prospect for macroeconomic convergence remain slim,given the fact that trade relations among WAMZ membercountries remain very small. Table 2 show the the averageshare of WAMZ intra-trade in total ECOWAS trade whichstood at 2.76 percent in the period 2001 to 2005, with apeak of 3.22 per cent in 2003. Perhaps, the main reasons forthis low level of trade relations include the use of multipleinconvertible currencies within the Zone, the narrowness oftradable products in member countries, existence of tariffand non-tariff barriers to trade, multiple borders among thecountries, and poor regional transportation infrastructure.These fundamental reasons had very little to do withmacroeconomic convergence as it cannot stimulate trade
relations exceptex ante actions are taken in that directionthrough regional integration which includes ultimately amonetary union. One of the main objectives of creatingthe WAMZ is to promote trade among the members. Apartfrom the single currency agenda, other important elementsof the program include the removal of tariff and non-tariff barriers to trade through the implementation of theECOWAS Trade Liberalization Scheme (ETLS), the adoptionof a Common External Tariff (CET), and the implementationof the Interstate Road Transit Convention by the memberstates.
0
20
40
60
80
100
200520042003
Figure 4: Share of WAMZ in Intra-ECOWASTotal Trade, 2003-2006 ECOWAS WAMAZ WAEMU
The implementation of the above measures, together withthe creation of a single economic space in the Zone throughthe monetary union and single currency, are expected tosignicantly increase the volume of intra-trade in the Zone.Table 2 show the total value of intra-ECOWAS total trade byall the countries according to sub regional groupings withinthe region. A comparison of the level of intra- ECOWAStrade shows that WAMZ countries trade less with otherECOWAS countries as it accounts for an average of 11%annually of total intra-regional trade in 2003-2005 (Figure
2.11). While WAEMU has other advantages over WAMZ,including the better contiguity of its states, the singlecurrency of WAEMU is about the most important factor inthe higher trade relations among its member states and hasbeen credited as one major factor which fostered relative
40
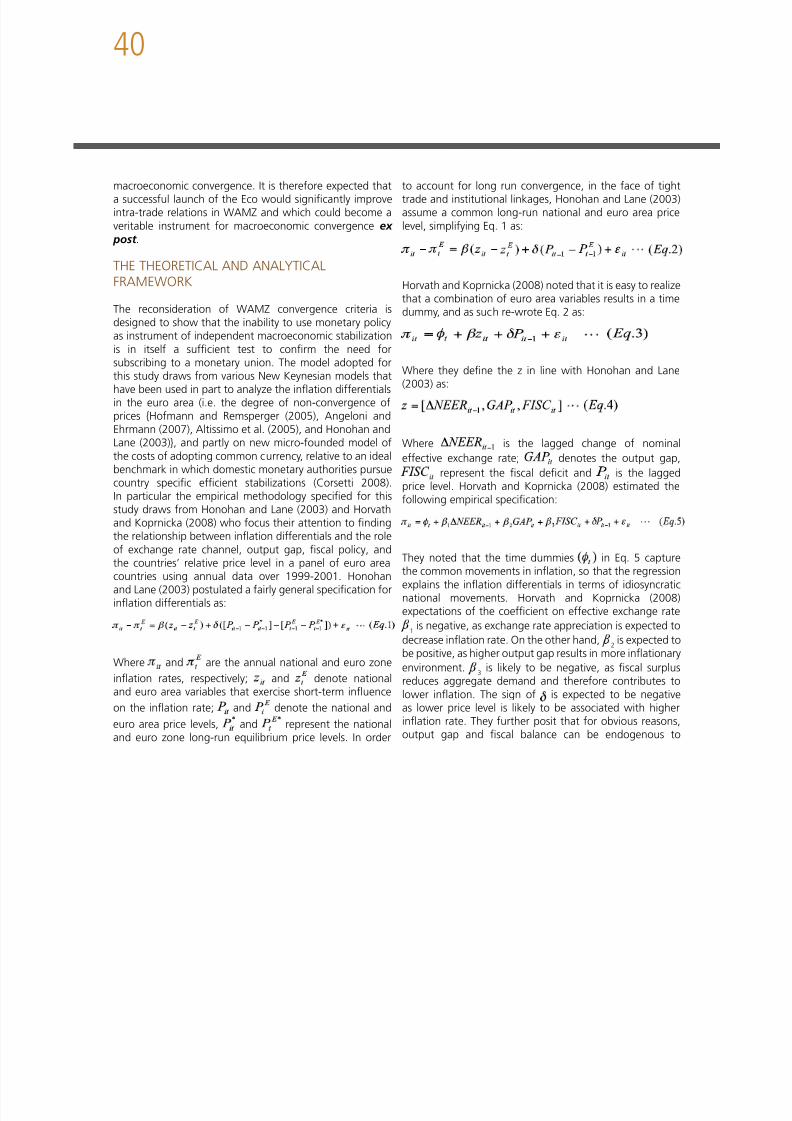
8/15/2019 African Single Currency
http://slidepdf.com/reader/full/african-single-currency 40/192
macroeconomic convergence. It is therefore expected thata successful launch of the Eco would signicantly improveintra-trade relations in WAMZ and which could become averitable instrument for macroeconomic convergenceex
post .
THE THEORETICAL AND ANALYTICALFRAMEWORK
The reconsideration of WAMZ convergence criteria isdesigned to show that the inability to use monetary policyas instrument of independent macroeconomic stabilization
is in itself a sufcient test to conrm the need forsubscribing to a monetary union. The model adopted forthis study draws from various New Keynesian models thathave been used in part to analyze the ination differentialsin the euro area (i.e. the degree of non-convergence ofprices {Hofmann and Remsperger (2005), Angeloni andEhrmann (2007), Altissimo et al. (2005), and Honohan andLane (2003)}, and partly on new micro-founded model ofthe costs of adopting common currency, relative to an idealbenchmark in which domestic monetary authorities pursuecountry specic efcient stabilizations (Corsetti 2008).In particular the empirical methodology specied for thisstudy draws from Honohan and Lane (2003) and Horvathand Koprnicka (2008) who focus their attention to ndingthe relationship between ination differentials and the roleof exchange rate channel, output gap, scal policy, andthe countries’ relative price level in a panel of euro area
countries using annual data over 1999-2001. Honohanand Lane (2003) postulated a fairly general specication forination differentials as:
Where and are the annual national and euro zoneination rates, respectively; and denote nationaland euro area variables that exercise short-term inuenceon the ination rate; and denote the national andeuro area price levels, and represent the nationaland euro zone long-run equilibrium price levels. In order
to account for long run convergence, in the face of tighttrade and institutional linkages, Honohan and Lane (2003)assume a common long-run national and euro area pricelevel, simplifying Eq. 1 as:
Horvath and Koprnicka (2008) noted that it is easy to realizethat a combination of euro area variables results in a timedummy, and as such re-wrote Eq. 2 as:
Where they dene the z in line with Honohan and Lane(2003) as:
Where is the lagged change of nominaleffective exchange rate; denotes the output gap,
represent the scal decit and is the laggedprice level. Horvath and Koprnicka (2008) estimated thefollowing empirical specication:
They noted that the time dummies in Eq. 5 capturethe common movements in ination, so that the regressionexplains the ination differentials in terms of idiosyncraticnational movements. Horvath and Koprnicka (2008)expectations of the coefcient on effective exchange rate
1 is negative, as exchange rate appreciation is expected todecrease ination rate. On the other hand, 2 is expected tobe positive, as higher output gap results in more inationaryenvironment. 3 is likely to be negative, as scal surplusreduces aggregate demand and therefore contributes tolower ination. The sign of is expected to be negativeas lower price level is likely to be associated with higherination rate. They further posit that for obvious reasons,output gap and scal balance can be endogenous to
41

8/15/2019 African Single Currency
http://slidepdf.com/reader/full/african-single-currency 41/192
ination and therefore estimated Eq. 5 by the generalizedmethod of moments (GMM), where endogenous variableswere instrumented by lagged values.
This model appears adequate for analyzing EU Euro areas,especially so since ination targeting is a central objective ofmonetary policy. For the purpose of this study, I lean furthertowards Corsetti (2008) that analyzed monetary stabilizationpolicies from a Neo-Keynesian perspective. Corsetti (2008)uses a new micro-founded model of the costs of adoptingcommon currency, relative to an ideal benchmark in whichdomestic monetary authorities pursue country specicefcient stabilizations that encompass both demand andsupply stabilization. The analytical framework is premisedon the assumption of a closed economy populated byidentical households, who derive utility from consumptionof goods and leisure, i.e. their utility is decreasing in laboureffort. In the tradition of macroeconomic models, especiallyas in many modern contributions to monetary theory, heposits that aggregate demand coincides with consumptionexpenditure, i.e. abstract from investment and government
spending. From the demand side, Corsetti (2008) argues thatif C denote aggregate consumption, and P its price (or CPI),then nominal aggregate demand is thus given by PC, andreal domestic output YH coincides with real consumptionexpenditure, i.e. C = YH. Corsetti (2008) therefore relatedaggregate demand PC to a variable , which indexes thestance of monetary policy: a higher means that monetaryauthorities pursue expansionary policies, raising aggregatedemand and thus nominal consumption. Corsetti (2008)therefore hypothesize that the dynamic aggregate demandin nominal terms which reects optimal consumption andsavings decisions by households can be written as follows:
Where is the discount factor reecting consumers’impatience, E denotes expectations of future variables andthe equation makes it clear that, for given expectations of
future prices and future real demand, current spending(corresponding to the current monetary stance) isdecreasing in the nominal interest.
From the supply side, Corsetti (2008) assumes that outputis produced in many varieties by specialized small rmswith monopoly power and characterized by productionfunction such that: where denotes thelevel of productivity, identical across rms, denotesemployment under the assumption that vary randomlyat business cycle frequency. He further assumes that ifrms face demand for output that is constant price elasticand preset prices which maximizes their market value,such that it results from charging the equilibrium markupover expected marginal costs, the following equilibriumconditions obtains:
P H = mkp E [ MC H ] = mkp E
wage Z H
( Eq.7)
Where the marginal costs , the nominal wagedivide by productivity and the equilibrium markupmkp isa decreasing function of the elasticity of substitution. Asthe price is xed over the production period, the (ex-post)realized markup will vary inversely with marginal costs.Corsetti (2008) assumes that labour market is competitiveand varies proportionally with the monetary stance andlinking both
Abstracting from Eq. 7, Corsetti (2008) characterized thenatural rate of employment (output) if all prices were exible(i.e. in the absence of nominal rigidities) by assuming thateach rm would maximize current prot by charging theequilibrium markup over current marginal costs:
42

8/15/2019 African Single Currency
http://slidepdf.com/reader/full/african-single-currency 42/192
Substituting the denition of , the production functionand re-arranging, yields the result that thenatural level of employment (output), , is constant:
In the long run, is a decreasing function given themonopoly of domestic rms and as goods become bettersubstitutes, or regulation and competition policy reducesthe average markups in the economy, the natural rate ofemployment and output rise. At business cycle frequencies,the natural rate of output uctuates with productivity, i. e.
.
For an efcient monetary stabilization, Corsetti (2008)examined the macroeconomic implications of randomuctuations in current and future productivity, and optimalpolicy response to stabilize the economy (demand shocks).He therefore argued that holding monetary stance(hence nominal wages) xed, a positive productivity shock(an increase in ) lowers marginal costex post . But ifprices are preset, rms cannot take advantage of higherproductivity to lower prices and raise output: a xedimplies that aggregate demand is also xed in nominal andreal terms. As a result rms satisfy current demand usingless productive inputs, while the positive productivity shocksopens a positive output gap: employment and output fallshort of their natural rate, i.e., their equilibrium value in aexible price allocation.
In response to an unexpected increase in productivity,monetary authorities can improve welfare by expandingaggregate demand via expansionary stance (in the case ofpositive shocks (and contracting it in response to a negativeshock, as to rule out over-heating and excess employment).This it can do by setting monetary policy such that nominalmarginal costs are constant during the period:
If the above holds, i.e. if private agents expect the centralbank to credibly pursue rules such that , optimalprices would remain constant in nominal terms also inthe absence of nominal rigidities as there would be nodifference between the Eq. 7 and Eq. 9. Thus, a monetaryrule that satises this condition make nominal rigiditiesinconsequential, in that the sticky price allocation coincideswith the ex-price allocation and the economy operates ata natural rate. Corsetti (2008) observed that Eq. 11 requiresa central bank to commit to (a) align aggregate demandand (b) keep the price level along the predetermined path,indexed by .
With regard to interest rates and demand stabilization,Corsetti (2008) noted that traditional models of stabilizationwould require central banks to pursue interest ratespolicy corresponding to the optimal stabilization policy by
substituting Eq. 11 into the dynamic demand equation,that is:
He then derived the interest rate corresponding to theimplementation of the optimal stabilization policy as:
Corsetti (2008) concludes from this expression that giventhe path of price levels to which a central bank commitswhen it denes ination targets at different horizon, andholding expectation of future productivity constant, thenatural rate of interest falls with current productivity gains– which, in the absence of a contingent optimal reactionby monetary authorities, would open a positive output gap
43

8/15/2019 African Single Currency
http://slidepdf.com/reader/full/african-single-currency 43/192
that rises with anticipated productivity growth. He furthermaintains that the need to promote a non-inationarygrowth as in the condition in Eq. 11 would requirethat monetary authorities not only respond to currentproductivity shocks, but also to current aggregate demanddisturbances.
Against this framework, Corsetti (2008) analyzed andcompared the costs of losing monetary autonomy when ittranslates into insufcient stabilization of national businesscycles to the apparent noise generated by subscribingto a common monetary policy rules. He characterizedthe main inefciencies from insufcient stabilization interms of relative price distortions, which translates intosuboptimal level of output and consumption. He thereforeargued that if the central bank does not stabilize marginalcosts completely, demand does not fall optimally whenproductivity is low. With preset prices, these turn out to betoo high relative to factor costs, and rms supply too muchrelative to the ex-price level of output, and vice versa.He therefore concludes that a highly unstable monetary
policy could potentially produce large welfare losses, up todwarng the costs of insufcient stabilization.
Corsetti (2008) introduced trade and internationalinterdependence into the model via nominal exchangerates under the assumption that growth rates of marginalutilities are equalized across countries in Purchasing PowerParity. He argues that if the two countries involved in tradeare perfectly symmetricex ante , it means that wealth
and consumption are always equalized in nominal termsacross countries. This implies that exchange rate dependson both home and foreign monetary stance. He concludesthat a commitment to a monetary union (in which thetwo countries adopt a common currency or irrevocablypegged exchange rates offer a least cost than two nationalmonetary authorities acting independently or even underan international monetary policy coordination but whichyields undesirable results.
Empirical Models
The empirical models to be estimated rely very stronglyon the theoretical foundations of these New Keynesianmodels. Two fundamental equations would be estimatedin line with neo-Keynesian framework that independentmonetary policies target both ination and output as thecentral theme of macroeconomic stabilization.
With regard to aggregate price stabilization around apreset target or benchmark, I adopt Horvath and Koprnicka(2008), i.e. Eq. 3:
but with signicant modications. Whereas they denethe vector z of Eq. 3 as: where is the lagged change of nominaleffective exchange rate; denotes the outputgap, represent the scal decit and isthe lagged price level, I redene the vector z as:
where isthe lagged change in nominal exchange rate of the nationalcurrencies to the US $, their dominant reserve currency;denotes the real output while is money supply, whichis an important component of independent monetarypolicy targets of WAMZ countries, in the light of pursuitsof multiple objectives of macroeconomic stabilizationpolicy; and represents banking sector credit toprivate and government sectors respectively, to capture theloose stand of monetary policy with regard to governmentborrowing and the extent of bias it implies for private sectorcredit; and nally, denotes the overall interest rate policystance of the monetary authorities, represented in thismodel by the monetary policy rate or minimum rediscountrates. This gives us the following empirical specication:
Whereby is the net ination differential of eachparticipating country from optimal targets; represents
44

8/15/2019 African Single Currency
http://slidepdf.com/reader/full/african-single-currency 44/192
cross-sectional xed effects constants of independentmovements in ination differentials within the panel;s are regression coefcients of the included explanatoryvariables, the regression coefcient of past trends inaggregate price level.The expectation of the coefcient of nominal exchangerate 1 is negative, as exchange rate appreciation isexpected to decrease ination rate. On the other hand,2 is expected to be positive, as higher output gap results inmore inationary environment. 3 is likely to be negative,as expansion in credit to the private sector is expected tolead to output expansion (a positive shock) and thereforecontributes to lower ination. 4 is likely to be positive , asexpansion in credit to government is expected to lead toexpansion in aggregate demand and therefore contributesto higher ination. 5 is likely to be positive, as expansion inin aggregate money supply is expected to lead to expansionin aggregate demand and therefore contributes to higherination. 6 is likely to be negative, as lower interest ratesis expected to lead to output expansion (a positive shock)and therefore contributes to lower ination. The sign ofis expected to be negative as lower price level is likely to beassociated with higher ination rate.
This specication presupposes that the only ultimateobjective of independent monetary policy is the need tostabilize local currency prices via interest rates operatingprocedures that supports low ination and an exchangerates management (via expenditure switching transmissionmechanisms) that minimizes demand for foreign goods.However, price stabilization around the optimal path is notthe only objective of monetary policy of the WAMZ countriesas a number of rigidities exist which inhibits the capacityof factor prices such as interest and exchange rates fromperforming effectively expenditure switching transmissionmechanism. Indeed, these economies are characterizedby large non-tradable sector which tends to compromiseefforts at domestic and foreign price stabilization. In linewith Corsetti (2008), monetary policy stance can also giverise to welfare losses due to insufcient stabilization derivedfrom the case in which domestic productivity shocks are
purely idiosyncratic. This suggests a reformulation of Eq.3.13 to reect the effect of monetary policy stance onproductivity shocks or output gaps:
Where both the dependent and explanatory variablesare as dened earlier, while refers to the xed effectsconstants of the pooled regression equation. All the s arethe coefcients of the explanatory variables of the model,while represents the coefcient of the lagged value ofoutput gap.
The expectation of the coefcient of nominal exchange ratein Eq. 3.14 is neutral since a home nominal depreciationfollowing a home monetary expansion has no expenditureswitching effects, but can potentially worsens terms oftrade in favour of the foreign partner in trade. It can bepotentially harmful if the foreign exchange content ofdomestic production is very high. On the other hand,is expected to be negative, since higher widening gap ofination from desired level could lead to higher costs ofproduction and consequently lower output. is likely tobe positive, as expansion in credit to the private sector isexpected to lead to output expansion (a positive shock)and therefore contributes to higher growth in output. islikely to be negative, if the potential goal of macroeconomicstabilization is to reduce the gap between consumptionand its efcient level, which may vary with time dependingon the state of the economy. Credit to government andespecially monetary authorities borrowing from the publicthrough public debt instruments as part of monetarycontrol measures can critically stie credit to the privatesector, with a crowding out effect and adverse effecton output. is likely to be negative if an expansionarymonetary stance originates from scal indiscipline, weakmonetary authorities that lacks autonomy to restrain scalauthorities or from inability of the monetary authority toadopt an appropriate monetary framework in the face ofdeep internal economic distortions. This would generallyhave adverse effects on output. is expected to benegative, in line with Corsetti’s (2008) argument that given
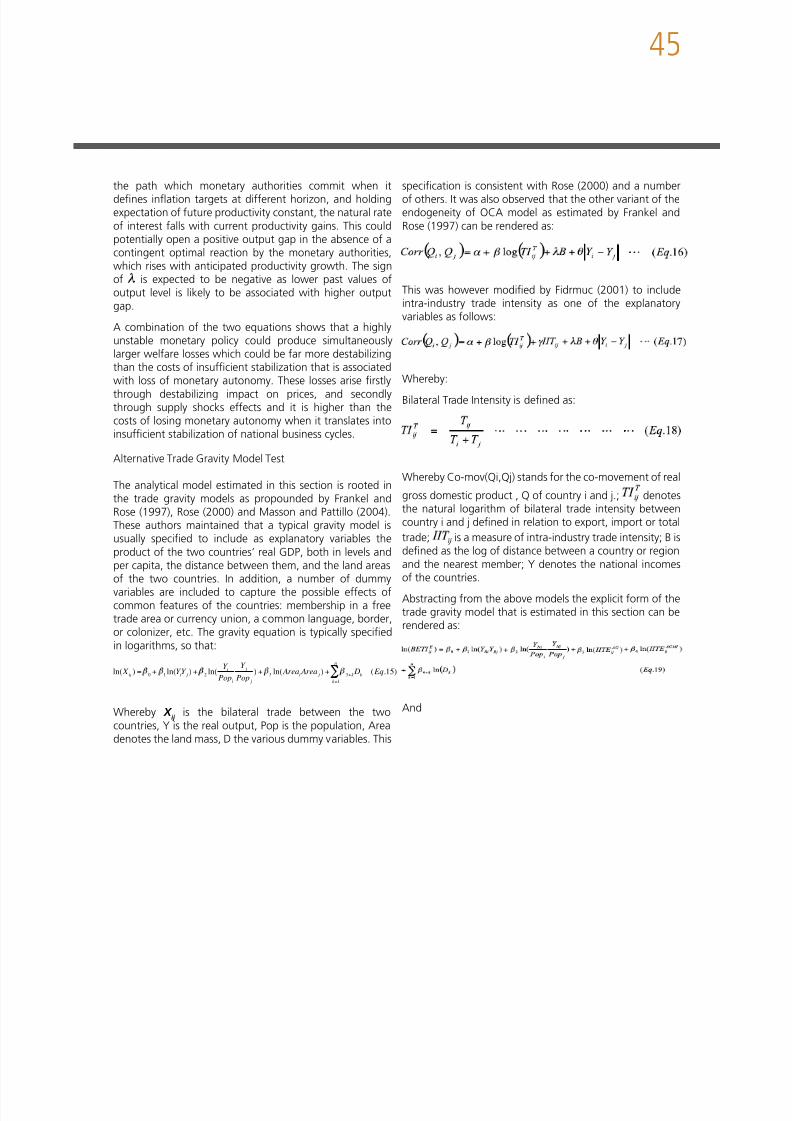
8/15/2019 African Single Currency
http://slidepdf.com/reader/full/african-single-currency 45/192
46

8/15/2019 African Single Currency
http://slidepdf.com/reader/full/african-single-currency 46/192
Whereby the variables are dened as follows:
And , , BTEi and BTEj BTMEi and BTMEjTTMEi and TTMEj denotes the bilateral export and totaltrade; YRi YRj, YNi and YNj are the real and nominal GDP ofcountries i and j. is the ratio of the agricultural (intra-
industry) trade intensity of both countries; is theratio of the agricultural and mining (intra-industry) tradeintensity of both countries; D1 is a dummy for adjacency orcommon border; D2 is a dummy for common language; D3is a dummy for common currency and D4 is a dummy forcommon colonial ties
EMPIRICAL RESULTS
The specic models estimated in this section are Eq. 13 ,14, 19 and 20.
The estimate of Eq. 13 is reported in Table 3 and it providesthe pooled regression estimation of the monetary policyinstruments determinant of ination divergence in theWAMZ region. The regression results of Eq. 14 is reportedin Table 4 which show rstly, the implication of independentmonetary policy pursuits on business cycles divergence orshocks (output gaps); and secondly the determinants of
aggregate output performance given the national monetarypolicy stance of WAMZ participants. These results would bediscussed and inferences drawn under two sub headings:(i) “Partial Effects of National Monetary and Exchange RatePolicy on Ination Divergence” which analyses the singlepooled equation estimate for Eq. 13 and (ii) “Partial Effectsof National Monetary and Exchange Rate Policy on OutputPerformance” which analyses the pooled single equationestimate for Eq. 14.
(i) Partial Effects of Independent National Monetary andExchange Rate Policy on WAMZ Ination Divergence
Table 3: Pooled Single Equation Regression Results
π it for the partial Effects of Monetary and ExchangeRate Policy on WAMZ ination Divergence (Equation 3.12)Dep. Variable: ination Differential:Method: Pooled EGLS (Cross-section SUR)Sample (adjusted) : 1991 Q 32007 Q 4Included observations : 66 after adjustments
Cross – sections included : 5Total pool (balanced) observations : 330Linear estimation after one step weighting matrixVariables Coefcient StatisticsName Symbol Name Value t-stat. Prob.Constant Ø1 .2.07 -1.2 0.23Nom. ERAPP/Dep.? NERit-1 1
0.021 1.6 0.11Real Out Put
Shock
Yit 2
Credit to pr. Sect. CPit(-1)3
-0.000012 -3.7 0.00Credit to Govt. CGit(-2)
4-0.000001 -0.8 0.43
Money Supply: M2(-1)5
0.00001 4.3 0.00Monetary PolicyRate
LOG iit 62.25 4.0 0.00
Lagged Aggr.price (Cpl)
Pit -1 -0.011 -2.5 0.01
Fixed Effects(Cross)• GAM -- C -1.40• GHA -- C 0.90• GUI -- C -2.40
47

8/15/2019 African Single Currency
http://slidepdf.com/reader/full/african-single-currency 47/192
• NIG -- C 2.71• SLN -- C 0.19
Weighted StatisticsR Squared 0.47 Main Dependent Var 0.96Adjusted RSquared
0.45 S D Dependent Var 1.29
S E of regression 0.97 SUM Squared resid 298.4F Statistics 28.41 Durbin – Watson stat 1.47Pro F Statistics 0.00Source Estimated Using Eviews 6.1
Table 3 presents the regression results of the effectsof independent monetary policy stance on inationconvergence around the less than 10 per cent target setfor the commencement of WAMZ. The adjusted R2 value,which measures the overall goodness of t of the regression,show that independent monetary policy stance variablescould only account for about 45 per cent of inationdivergence from set targets. It can be inferred that efforts atmacroeconomic (price) stabilization around a desired target
was not attained. Over the sample period, the un-weightedaverage regional ination rates were most often above asingle digit target and vary widely among the countries. Thesummary of the descriptive statistics associated with theinationary pattern displayed in Figure 5 is as shown in Table4. This table shows that except for Gambia, all the WAMZcountries have had astonishing records of double digitination. The country that recorded the minimum inationrate during the study period is Gambia at an average of5.6 per cent while Sierra Leone recorded the maximumaverage ination rate of 29.3. The table also shows thatfor more than half the period under review, both Gambiaand Guinea recorded single digit ination with the medianstatistics estimated at 3.3 and 7.0 per cent, respectively.These two countries can be described as the low inationgroup among WAMZ while Nigeria and Ghana are thehighly ination group, with Sierra Leone joining the club
after a protracted period of political crisis and instability.
Figure 5: Ination Trends in WAMZ, 1991-2007
Gambia Ination Rate (%)
Ghana Ination Rate (%)
Guinea Ination Rate (%)
Nigeria Ination Rate (%)
Sierra Leone Ination Rate (%)
-40
-20
0
20
40
60
80
20062004200220001998199619941992
Table 4: WAMZ Ination Descriptive Statistics 1991 Q 1 to 2007Q 4
Gambia Ghana Guinea Nigeria S/Leone
Mean 5.6 23.1 12.2 25.3 29.3Median 3.3 16.4 7.0 16.9 14.1Maximum 29.9 102.3 38.7 123.7 588.2Minimum -9.2 -13.8 -9.6 -17.5 -66.3Std. Dev. 8.3 21.1 11.2 30.2 78.6Skewness 0.7 1.2 1.0 1.3 5.6Kurtosis 3.2 4.9 3.0 4.6 39.6
Jarque -Bera 5.4 26.1 11.2 26.8 4083.5Probability 0.1 0.0 0.0 0.0 0.0
Sum 378.1 1550.4 817.5 1693.5 1966.0Sum Sq. Dev. 4518.9 29260.6 8280.8 60079.2 408136.0
Observation 67.0 67.0 67.0 67.0 67.0Source : Estimated With Eviews 6.1 from the Regression Data
The overall estimate of the xed effects constant, , showsignicant variation in its value across the participatingcountries in WAMZ. Whereas, it exhibited a negative spread
48

8/15/2019 African Single Currency
http://slidepdf.com/reader/full/african-single-currency 48/192
from the regional average in the case of the Gambia andGuinea, the countries with low records of ination, it ispositive for Nigeria, Ghana and Sierra Leone that have poorrecords of ination control. This nding tends to conrm
that there is a wide divergence among the participantswith regard to the average outcomes of price stabilizationefforts, with very slim hope for attaining convergencewith independent monetary policy pursuits. The trends innational consumer prices displayed in Figure 6 shows thedivergent growth path of prices in these countries. Theregression result also shows that the major monetary policyinstruments determinants of inationary divergence are thepursuit of distorted interest rates and expansionary monetarypolicies, which penalized credit and accentuated outputsupply/demand gaps, and exchange rates overvaluation.
With regard to interest rates policy stance, the result showsthat a 1% rise in interest rates generates about 2.25%rise in ination rates. This means that high monetarypolicy rates translated into high lending rates in virtuallyall the countries within the region. Two fundamental issuesbelie the independent interest rate policies of WAMZcountries: rstly, is the lack of clear cut policy rules foran objective determination of optimal interest rates. Theindependent monetary authorities seem to set interestrates arbitrarily, neither following Taylor’s rules or the NeoKeynesian framework as the pass-through mechanism toinationary control. The experience in Ghana and Nigeriais that monetary authorities were more concern with theadverse implication of cheap funds for foreign exchangemanagement. This was with a view to fostering both internaland external balance within a Mundellian frameworkof balancing the use of monetary policy representedby interest rate/reserve money control and scal policyrepresented by government expenditure. This attempt wasa colossal failure because monetary policy rates hike meantfor stemming excess national demand could not restrainscal borrowing via ways and means, as well as throughpublic debt instruments.
Figure 6A: Trends in Nigeria’s Interest Rates, 1991-2007 MPRSRLR
0
5
10
15
20
25
30
35
200720052003200119991997199519931991
Figure 6B: Trends in Ghana’s Interest Rates, 1991-2006 MPRSRLR
0
20
40
60
80
100
120
200720052003200119991997199519931991
Figure 6C: Trends in Gambia Interest Rates, 1991-2007 MPRSRLR
0
5
10
15
20
25
30
35
40
200720052003200119991997199519931991
49

8/15/2019 African Single Currency
http://slidepdf.com/reader/full/african-single-currency 49/192
The second is the pervasive internal economic distortionwhich accompanied the interest rates policy stance,especially the widened divergence between low savingsrate which inhibits savings mobilization and high lending
rates which resulted in credit apathy by both lenders andborrowers. Financial market operators, especially thebanking system capitalized on the distortions to diversifytheir portfolios from lending to speculations in moneymarkets, in the face of a wide spread margin betweensavings and treasury bills rates which moved in tandemwith the monetary policy rates. Figures 6a and 6b showthat both Nigeria and Ghana kept monetary policy rateshigh, even when savings rates suggest lower costs of funds,while the Gambia aligned her monetary policy rates tosavings rates which eliminated speculations.
The coefcient of the change in nominal exchange ratevariable is not signicant, contrary to the expectationthat devaluations drive the inationary pressures of thesecountries. It is however positively signed implying that itcould potentially be a cause of ination. This result isexpected, since the currencies of these countries are non-traded put pegged to a basket of currencies dominatedby the US $. The availability of the US Dollar quantitativelybecomes the issue, while the effects of devaluation translateto imported ination on a narrow basket of importedconsumer and capital goods. The experience, in most of thecountries is that consumers resorted to local alternatives,while the signicant efforts at foreign exchange controlsthrough restrictive tariffs and quantitative controls accruedas rents to protected industries and traders. This ndingre-enforces the assertion that devaluation as an instrumentof demand management approach to macroeconomicstabilization is rather ineffective to cope with economiesthat suffer from deep structural maladjustments.
The coefcient of the past trends in national aggregateprices on inationary convergence is signicant and rightlysigned. The result showed that a 100% decline in aggregateprice level would reduce the ination gap by about 1.1%.This natural growth path suggests that indeed ination isnot a monetary phenomenon and that macroeconomiclosses which emanated from inadequate stabilization would
be far greater than the noise generated from subscriptionto a convergence stance rooted in common monetaryand exchange rates stance. Also, credit to private sectorexhibited the expected right and signicant but inelastic
relationship to ination while credit to government variableturned out to be insignicant. This also conrms that it maynot be very correct to blame scal indiscipline reectedin public sector borrowing from the banking system forspiraling ination as the monetary authorities of thesecountries had often claimed.
(ii) Partial Effects of Independent National Monetary andExchange Rate Policy on WAMZ Output Performance
The regression results of the estimates of the partialeffects of national monetary and exchange rate policyon production shocks asymmetry among participatingcountries in WAMZ is presented in Table 5. Two sets ofequations were estimated. The rst estimated the effectof monetary policy instruments on output gap, measuredby the extent of divergence between the national growth
targets and attainment, denoted by . The secondevaluated the relative effectiveness of independentmonetary and exchange rates policy on national economicperformance, measured by the real Gross Domestic Productdenoted by . The adjusted R-squared of the regressionresults of dependent equation (see table 5a) is verylow, suggesting that independent monetary and exchangerate policy pursuits explained less than 15 per cent of thepervasive output shocks within the WAMZ in the studyperiod. A plot of the growth rates in a Figure 7: Trends inReal GDP Growth Rate (%) of WAMZ Countries stackedgraph as shown by Figure 7 suggests very strong businesscycles asymmetry. Aggregate economic performancevacillated very widely around stagnation, with a goodnumber of the countries recording declining growths, whilemost had never attained up to 5 per cent growth rates. Thedescriptive statistics associated with this graph is as shown
in Table 6. The statistics shows that mean average growthrates ranged from as low as 2.2 per cent for Sierra Leone toabout 6.6 per cent for Guinea. Gambia, Ghana and SierraLeone had records of minimum growth rates that were
50
8/15/2019 African Single Currency
http://slidepdf.com/reader/full/african-single-currency 50/192
negative, while Guinea output was most volatile rangingfrom a minimum of 0.9 per cent to a maximum of 190.4percent. In general, these countries are characterized byslow growth rates. Another important source of asymmetry
is the relative size of participating countries in the realaggregate demand of the region.
51

8/15/2019 African Single Currency
http://slidepdf.com/reader/full/african-single-currency 51/192
Table 5: polled single Equation Regression Results for the partial Effects of Monetary and ExchangeRate policy on WAMZ Output (Equation 3.14)
Dep. Variable: real GDP, y it
Method Pooled EGLs (Cross. Section SUR)Sample (adjusted ): 1991 Q 3 2007 Q 4Include observations: 66 after adjustmentsCross .sections included: 5Total pools (balanced) observations: 330Lines at estimation after one-step weighting matrixDep. Variables a. ? y it b. y it
Independent variables Coeff. Statistics Coeff. Statistics
Name Symbol Coeff. Value t. stat Prob. Value t. stat P rob.Constant ℓt 3.47 1.2 0.24 426.08 0.5 0.65Nom. ER App/ Dep. ? NERit-1 á1 -0.00093 -0.4 0.66 -4.7 -1.9 0.6In ation Divergence πit á2 -0.296 3.3 0.00 -7.6 -1.4 0.16Credit to pr. Sect. CPit(-1) á3
Credit to Govt. CGit(-2) á4 6.69E - 07 3.8 0.00 -0.0024 -14.8 0.00Money Supply: M2(-1) á5 5.21 E - 07 4.7 0.00 0.0030 19.5 0.00
Monetary Policy Rate Log iit á6 -0.268 -2.3 0.02 -268.6 -4.0 0.00Lagged Aggr. Output (GDP)yit-1(-2) -0.873 -2.4 0.02 1058.3 9.9 0.00Fixed Effects (Cross)
• GAM -- C -1.72 -5471.1• GHA -- C 0.2 -3244.0• GU I-- C -0.09 -6874.4• NIG -- C 1.96 -20942.2•
SLN -- C -1.08 -5352.6Weighted StatisticsR Squared 0.157 0.988Adjusted R Squared 0.131 0.987S .E. of regression 0.987 0.803F Statistics 0.954 2568.9Pro F Statistics 0.000 0
Mean dependent var -2.6 5.6S. D dependent var 3.1 4.5Sum Squared reside 310.5 205.7Durbin W- aston Stat 1.1 0.3
Source : Estimated Using Eviesw s 6.1
52

8/15/2019 African Single Currency
http://slidepdf.com/reader/full/african-single-currency 52/192
Figure 7: Trends in Real GDP Growth Rate (%) of WAMZ Countries
igure 7: Trends in Real GDP Growth Rate%) of WAMZ Countries
@PC (RGDP_GAM)
@PC (RGDP_GUI)
@PC (RGDP_SLN)
@PC (RGDP_GHA)
@PC (RGDP_NIG)
-2
-1
0
1
2
3
20062004200220001998199619941992
0
4
8
12
16
20
24
28
32
20062004200220001998199619941992
-6
-4
-2
0
2
4
6
8
20062004200220001998199619941992
-1.5
-1.0
-0.5
0
0.5
1.0
1.5
2.0
20062004200220001998199619941992
0
1
2
3
4
5
6
7
20062004200220001998199619941992
53

8/15/2019 African Single Currency
http://slidepdf.com/reader/full/african-single-currency 53/192
Table 6: WAMZ Real GDP Growth descriptive Statistics 1991 Q 1to 2007 Q 4%)
Gambia Ghana Guinea Nigeria S/Leone
Mean 4.0 3.8 6.6 4.1 2.2Median 4.7 4.3 4.2 3.7 3.7Maximum 9.3 7.0 190.4 26.9 30.4Minimum -4.2 -4.3 0.9 0.0 -20.3Std. Dev 2.9 2.7 22.8 3.3 11.4Skewness -1.2 -1.5 7.9 5.1 0.1Kurtosis 4.8 5.1 64.4 36.5 3.2
Jarque - Bera 24.9 37.2 11217.4 3435.2 0.2Probability 0.0 0.0 0.0 0.0 0.9
Sum 266.4 251.4 444.5 275.0 147.6Sum Sq. Dev. 537.2 473.8 34445.1 702.8 8515.2
Observations 67 67 67 67 67Source: Estimated with Eviews 6.1 from the Regression Data
Figure 8 shows that Nigeria accounts for a signicantproportion of the output WAMZ (approximately 80 percent).
0
10,000
20,000
30,000
40,000
50,000
60,000
70,000
20062004200220001998199619941992
Figure 8: Real GDP of WAMZ Countriesat 2001 Constant Prices, 1991 - 2007 (US $ Million)
@PC (RGDP_GAM)
@PC (RGDP_GUI)
@PC (RGDP_SLN)
@PC (RGDP_GHA)
@PC (RGDP_NIG)
The overall estimate of the xed effects constant, , forboth equations of Table 5 are not signicant, but alsoreects very signicant variation in its value across the
participating countries in WAMZ. Whereas, it exhibited anegative spread from the regional average in all the othercountries, it posted a positive average for Nigeria. Thisnding tends to conrm that there is a wide divergence
among the participants with regard to the averageoutcomes of macroeconomic stabilization efforts, with ahigher disproportionate weight in favour of Nigeria that isobviously an outlier of the proposed convergence club. Thisimplies that pursuits of a less than optimal macroeconomicstabilization policy could have very negative spillover effectson efforts towards convergence. The trend in National RealGDP displayed in Figure 5.5 shows the divergent growthpath which tended to accentuate these asymmetries.
The coefcient, , of exchange rate devaluation, ,is not signicant as a determinant of demand/output shockswithin WAMZ in equation 5a, but exhibited an inverserelationship to aggregate output at about 6% condencelevel. This result tends to suggest that the production andasymmetric shocks experienced by these countries is notcaused by exchange rate devaluation. This is expected, sinceas a group of small countries, with non-tradable currencies,both export and import prices are preset in foreign tradedcurrencies. As such, exchange rates movements do notnecessarily perform the expenditure switching stabilizationroles envisioned by traditional theory. Instead, exchangerate devaluation translates into higher costs of importedinputs and consumer goods. The magnitude of thesecosts can be very high if the foreign resource content ofdomestic production and consumption is also very high,and economic activity is dominated by non-tradable andprimary commodities export. This assertion is consistentwith regression results of Table 5b, which shows that 1%devaluation can potentially lead to about 4.7% decline inoutput.
On the other hand, the coefcient, , of inationdivergence variable, is negative and signicant in theregression results of Table 5a, conrming the expectationthat higher widening gap of ination from desired levelcould lead to higher costs of production and consequentlylower output. Although the t-statistics of 5b results showthat ination is not a signicant determinant of aggregate
54
8/15/2019 African Single Currency
http://slidepdf.com/reader/full/african-single-currency 54/192
output in WAMZ, it exhibited a negative relationshipconrming the earlier assertion.
The performance of credit to the private sector variable,, in the estimated equations was poor, and had to
be eliminated from the regression, while the estimateof the coefcient, , of the credit to government,, is signicant and correctly signed but inelastic in bothequations. The positive sign of this coefcient in 5asuggests that credit to government, especially through theissue of public debt instruments as part of monetary controlmeasures can critically stie credit to private sector via acrowding out effect with adverse consequence on outputperformance.The coefcient, , of the money supply variable, , issignicant, positive but inelastic, in line with New Keynesianstance that expansionary monetary stance can spurlimited growth when economies operate at less than fullemployment capacity. This is most likely the case, given theslow growth rates, and inelastic supply which characterizethese countries. However, the inelastic outcome of thiscoefcient points to the weakness of using reserve controlvia monetary targets as an instrument for promotinggrowth.
The coefcient, , of monetary policy rate, , is signicantand exhibit the correct sign. This is consistent with theliterature (Corsetti, 2008) that given the path whichmonetary authorities commit when it denes inationtargets at different horizon, and holding expectation offuture productivity constant, the natural rate of interestfalls with current productivity gains. This could potentiallyopen a positive output gap in the absence of a contingentoptimal reaction by the monetary authorities, which riseswith anticipated productivity growth.
The coefcient estimate, , of lagged aggregate outputvariable, is signicant and have the right signs inboth equations. The negative sign of this coefcient in5a is consistent with theoretical expectation that lowerpast values of output level is likely to be associated withhigher output gap. The nding that past trends in outputis the major determinant of current output performance
is remarkable. This implies that monetary policy pursuits,in the face of nominal and structural rigidities playinsignicant role in demand/output stimulation. Instead,trend in business cycles and output tended to follow the
natural rate path which uctuates with productivity alongthe production possibility frontiers.
This study examined three alternative options tomacroeconomic convergence criteria and policy available toWAMZ countries for entering into monetary union. The rsttests the hypothesis that ex ante independent monetaryand exchange rate policies of each participating countryin WAMZ have been relatively ineffective as instruments
of national macroeconomic stabilization and thereforesuggests that they could be better off surrendering suchin favour of regionally coordinated policies. The secondtests the hypothesis that ex ante independent exchangerates policies of participating countries in WAMZ weregenerally ineffective as instruments of aggregate globalexport stimulation of each of the country and in particular,bilateral trade between member countries, suggestingthat they could be eliminated among them, while taking acommon stand with regard to trade with third parties. Thethird model tested the hypothesis that there are signicantex ante similarities in business cycles induced by intensebilateral trade and other elements of its “gravity” sufcientenough to make the intending members of WAMZ anoptimum currency areaex post . The summary of ndingsand conclusions with regard to these tests are as follows
(iii) Trade Gravity Models ResultsUsing pooled equation regression models, equations 19and 20 are estimated for the WAMZ countries. In general,I adopted the 5 x 2 cross sectional panel data to capturethe entire bilateral relationships of Gambia-Ghana,Gambia-Guinea, Gambia-Nigeria, Gambia-Sierra Leone,Ghana-Guinea, Ghana-Nigeria, Ghana-Sierra Leone,Guinea-Nigeria, Guinea-Sierra Leone and Nigeria-SierraLeone. These results are as shown in Table 7. Equation 7arepresents the regression results for the bilateral export tradedependent variable, while that of 7b is for the total bilateraltrade dependent variable. The independent variables can be
55

8/15/2019 African Single Currency
http://slidepdf.com/reader/full/african-single-currency 55/192
grouped into economic or quantitative variables presumedto be the determinants of endogeneity and qualitativevariables captured by the dummies. The equations wereestimated using seemingly unrelated regression models
from a quarterly sample 1996:1 to 2004:4 amounting to36 numbers of observations for 10 cross-sections making abalanced panel of 360.
Table 7: Regression Results on Intra-WAMZ Trade Gravity Models
a. BILAT. EXPORTS b. BILAT. TOT.TRADE
Dep. Variable LOG(BTELJ) LOG (TTMELJ)
Indepent Variable Coef. T-Stat. Prob. Coef. T-Stat. Prob.LOG (YRI *YRJ) 0.172 3.8 0.00 0.632 19.1 0.00LOG {(Yi /popi)*(YJ/ POPj)}
-0.370 -8.3 0.00 0.082 4.2 0.00
LOG (IITAGi /IITAG j) 0.064 4.1 0.00 -0.007 -3.6 0.00
LOG (IITAGMII /IITAGMI j) -0.635 -11.4 0.00 0.019 4.8 0.00
Fixed Effects•
GAMGHA-C 1.940 0.203• GAMGUI-C 0.573 -1.123• GAMNIG-C 0.779 1.985• GAMSLN-C -0.115 -1.713• GHAGUI-C 0.787 0.202• GHANIG-C 7.578 2.151• GHASLN-C -0.661 0.266•
GUINIG-C 4.098 1.853• GUISLN-C 1.705 -1.071• NIGSLN-C 2.230 1.978
R-Squared 0.856 0.978Adjusted R-squared 0.851 0.977S.E. of regression 0.980 0.203Durbin-Watson stat 0.274 0.371
Log Likelihood 502Mean dependentvar
-0.51 0.479
S.D. dependentVar
2.534 1.351
Sum Squaredresid
316.8 14.31
Estimated Using Seemingly Unrelated regression methods
The log linear regression models were estimated andthe results are summarized into a table for analyticalconvenience. A review of the estimated equations showsthat their goodness of t is high with adjusted R2 as highas 85% for both equations. It is worthy to mention thatthree groups of the relationship of interest in this regression
analysis are: (i) the effect of output covariability on tradeintensity (which is proxied by the log of the product ofthe bilateral real as well as per capita GDP of the twocountries; (ii) the effect of intra-industry trade on bilateraltrade intensity (which is captured in this model by theagricultural and primary commodities intra-industry trade);and (iii) the effects of common features of the countriessuch as membership in a free trade area or currency union,a common language, border, or colonizer, etc. on bilateraltrade.
Bilateral Trade and Real and Per Capita GDP Relatives
As indicated in the theoretical framework, the OCA theorysuggests that if there are similarities in the co-variation orcorrelation of outputs, it is expected to be positively relatedto the bilateral trade intensity between the two countries.
Two measures of output correlations in our model are:(a) log of the product of Real GDP of country i and j inthe bilateral trade relations denoted byand (b) the log of the product of their per capita income
respectively which is denoted by .
This specication is consistent with Rose (2000). Thesecoefcients are signicant especially that of the intra-WAMZtotal trade model. However, while the sign of the log ofthe product of real GDP variable is positive, conrming
56

8/15/2019 African Single Currency
http://slidepdf.com/reader/full/african-single-currency 56/192
that similarities in business cycles have positive effects onbilateral trade among the countries, the coefcients of theproduct of the per capita GDP is negative.
This is consistent with the results of similar gravity modelstests by Masson and Pattillo (2004) which seems to capturewell the determinants of bilateral trade between countries.The positive sign of the real GDP variable coefcientestimate agrees with their ndings that larger countriesexert a greater gravitational pull on imports and push toexports. This is most likely to be true with respect to tradeows intra-WAMZ given the fact that Nigeria accountsfor approximately 60 per cent of the GDP, land mass
and population of the group. Her pull on imports is verydominant especially so given her buoyant foreign exchangereserves derived from exports of crude oil. She also seems toserve as a base for re-exports of food and other consumerproducts via informal trade within the ECOWAS sub region.
The negative sign of the coefcient of the per capitaGDP variable is also consistent with Masson and Pattillo’s(2003) ndings that richer countries (in per capita terms)
also tend to have higher trade and by implication poorercountries tend to have lesser trade. This is largely truesince a priori information on per capita incomes of thecountries indicated that they are all classied among lowincome and somewhat below the poverty lines. One istherefore not surprise that the sign of the coefcient ofthis variable is negative. The result can therefore be said tobe salutary as it portends that improvements in per capitalincomes of WAMZ countries could invariably be associatedwith greater trade in the absence of trade barriers andif supported with common currency. This assertion isconsistent with the per capita incomeex post convergencetheorists who maintains that regional integration especiallythe one advanced by creating a monetary union, may leadto convergence of income levels by stimulating growth inthe poorer countries through increased trade (Masson andPattillo (2004)). They further argue that related initiatives
to liberalize factor movements would also favor growth ofpoorer countries by allowing capital and labor to move tothe locations where they are most productive. In general,this is consistent with the assertion by Jenkins and Thomas
(1996) that “there is a growing consensus that ‘convergenceclubs’ exist, where countries with a lower GNP per capitagrow more rapidly because they are members of a tradegroup, or because domestic policy gains credibility by
being tied to the domestic policy of a country with a bettereconomic reputation”. Although for now, there are doubtswith regard to scal credibility of the intending membersof WAMZ, especially Nigeria, she can certainly gain fromallowing her domestic monetary and exchange rate policyto be tied to a regional convergence benchmark if for noother reason but scal discipline effects.
Bilateral Trade and Intra-Industry Trade Intensity
You would recall that from the point of view of endogeneityof OCA theory, if intra-industry trade accounts for a highshare in trade, then, ceteris paribus , business cycles areexpected to become more similar across countries. Bycontrast, increased bilateral trade intensity may lead todivergence of business cycles if the increase in trade isdue mainly to increased specialization as predicted by the
alternative OCA view (the Krugman’s specialization theory).In order to reect both theories in our model, I includedas explanatory variables and determinants of bilateral tradetwo variants of intra-industry trade variables: the rst isdened as the log of the ratio of intra-industry trade in
agriculture of both countries, , designed to
capture endogeneity of OCA theory, asa priori informationsuggests very strong similarities in structure of agriculturaltrade. The second is dened as the log of the ratio of intra-industry trade in primary commodities (agriculture and
mineral resources), , designed to captureKrugman’s specialization theory effects, given the sharpdifferences in this variable between Nigeria and the restmembers of WAMZ. This stems from the fact that Nigeriais a major exporter of crude oil and a member of OPEC,a marketing cartel that was able over time to guaranteebetter terms of trade for her members, as against the
57
8/15/2019 African Single Currency
http://slidepdf.com/reader/full/african-single-currency 57/192
deteriorating terms of trade faced by the other WAMZmembers with regard to exports of solid minerals.
From the Table, it can be seen that the coefcient estimatesof both variables are signicant suggesting that intra-industry trade intensity have signicant effects on bilateraltrade. However, while the sign of the parameter estimate ofintra-industry trade in agricultural commodities is positive,that of bilateral primary commodities trade intensity isnegative.
The positive sign of the agricultural trade intensity variablessuggest that the positive bilateral co-movements can,ceteris
paribus , lead to trade creation within the region. This isplausible, given the structure of agricultural trade within theregion, which are mostly in staple foods especially grains,tubers, vegetable oils and livestock products (live animals,poultry and eggs). Sufcient pockets of decit in supply ofthese products exist within the region, especially in Nigeria,enough to pull imports towards her. This fact is evidencedby the large food imports of these countries from the restof the world which accounts for a signicant proportion
of their foreign exchange spending annually. Also, thereare strong similarities in agricultural export baskets to therest of the world, made up of cocoa, coffee, palm produce,groundnut and ginger, and they indeed face the sameterms of trade. This similarity is therefore supportive of thefact that opportunities exist to negotiate for better termsof trade as a regional group or trade bloc, an action thatcould lead toex post convergence of business cycles andultimately trade creation within the sub region.
The negative sign of the parameter estimate of thecoefcient of the intra-industry trade in primarycommodities is to be expected given the divergence inthe structure of commodities trade basket. While oilexports account for about 95 percent of Nigeria’s primarycommodity exports, the other member countries of WAMZrelied entirely on agricultural and solid mineral exports.Thus, increased dominance of a specialized product likepetroleum in the export basket of Nigeria portends the factthat opportunities exist for trade expansion in the face ofother endogenous factors such as proximity, adjacency andcommon currency. While Nigeria’s exports of petroleum
products to the other WAMZ member countries is expectedto increase, a reciprocal increase in agricultural exports ofthese countries to Nigeria may also take place. Thus, in theevent of the emergence of a monetary union, opportunities
exist to internalizeex post a greater fraction of theregion’s trade, given this signicant and indeed negativedivergence of these variables between Nigeria and the restothers.
Bilateral Trade and Qualitative Trade Gravity Indicators
You would recall that the third interest of the estimatedgravity model is to measure the effects of common featuresof the countries such as membership in a free tradearea or currency union, a common language, border, orcolonizer, etc… on bilateral trade. Consequent on this, fourdummy variables were included in the regression analysis,viz.: adjacency, , common language,
, common currency, , andcommon colonizer. .
58

8/15/2019 African Single Currency
http://slidepdf.com/reader/full/african-single-currency 58/192
Table 8 : regression Results of Intra-WAMZ Trade Gravity Modelswhich Include Trade Dummies
a. BILAT. EXPORTS b. BILAT. TOT. TRADE.
Dep. Variable LOG<BTEIJ> LOG<TTMEIJ>Independentvariable
Coef. t-Stat. Prob. Coef. t-Stat. Prob.
C -10.036 -7.9 0.00 -4.702 -14.3 0.00LOG«GDPI?> *<GDPJ?»
-0.262 -2.3 0.02 0.363 12.2 0.00
LOG«NGDPI?/ POPI?>*<N
1.112 11.4 0.00 0.878 31.8 0.00
LOG<XAGI? /XAGJ?>
0.238 15.4 0.00 0.00012 0.1 0.96
LOG<XAGMII? /XAGMIJ?>
-0.819 -14.9 0.00 -0.122 -14.3 0.00
DCUR? -3.329 -6.9 0.00 -2.746 -34.4 0.00LOG<DADJ?> 0.184 0.9 0.37 0.095 3.3 0.00DCOL? -1.100 -8.0 0.00 -0.481 -13.7 0.00
R-Squared 0.376 0.752AdjustedR-Squared
0.362 0.747
S.E. of regression2.153 0.680Durbin-Watsonstat
0.080 0.032
Log Likelihood 206.7MeandependentVar
-1.44 7.479
S.D.dependentVar
2.696 1.351
Sum Squaredresid
1502 162.5
The regression result is as shown in table 7.2. In general,the coefcient estimates of these dummies were signicantfor the bilateral total trade but not signicant for the
bilateral export trade functions. This result shows that intra-WAMZ total trade was signicantly inuenced by thesevariables. While adjacency had positive effects, differencesin currency and language had signicant negative effects.
These tended to conrm the Rose effects of currency uniondummies on trade expansion and/or contraction for theWAMZ. A widely cited recent paper (Rose, 2000), usinga global sample, nds that currency unions increase tradeby about a factor of 3 from cross-sectional results whiletime-series analysis with xed effects give somewhat lowerestimates of around 1.7 (Glike and Rose, 2002). Althougha simulation to estimate the effects of trade gravity modelson the extent of trade creation has not been carried out,it is most likely that the outcome will compare favorablywith these results. This would be subject to particularitieswhich Masson and Pattillo (2004) pointed out. In particular,they note that “while it is useful to have the widest samplepossible if that sample is homogeneous, it may also be thecase that there are particularities in a region that make itnot comparable to others”. Perhaps the non-signicance ofthese dummies with regard to the bilateral trade coefcients
could be attributed to these “particularities” such as lackof common borders and common currency, while thedummies for common language and common colonizer arenot strikingly distinguishing enough to make a difference.Lack of common border becomes much more important, inthe face of weak transportation links within the ECOWASsub region and between many African countries. The Roseeffect could also have been compromised by poor data onregional trade, as there seems to be a consensus amongpolicy analysts that an appreciable unrecorded trade takesplace within the sub region.
SUMMARY, CHALLENGES, POLICYRECOMMENDATIONS AND CONCLUSIONS
This study presents an alternative reconsideration oftraditional Optimum Currency Areas (OCA) macroeconomic
convergence criteria as options for WAMZ commencement,in the light of recent advancements in monetary theory. Itpresents micro-founded models, rooted in New Keynesiantraditions to show that tests conrming widespread
59

8/15/2019 African Single Currency
http://slidepdf.com/reader/full/african-single-currency 59/192
divergence from ideal macroeconomic benchmarks withunsustainable independent monetary and exchange ratespursuits and trade gravity models offer a more appropriateevaluating criterion for WAMZ than the current one, if the
ultimate objective is a merger with WAEMU.The results show that: (i) substantial macroeconomic costshave been associated with monetary autonomy reectedin the wide divergence of outcomes from set benchmarks,with very little prospect for moving towards macroeconomicconvergence in the absence of internationally bindingmonetary policy coordination framework; (ii) that exchangerates do not perform the stabilizing role envisioned
by traditional OCA theory, as it is an inconsequentialdeterminant of intra-WAMZ exports, but translates intohigher domestic inations; (iii) a common monetary policygiven the signicance of trade gravity dummies in theregression, conrms that it can be more efcient thannationally differentiated policies, even when shocks arestrongly asymmetric, provided that the composition ofaggregate spending tends to be symmetric at union-widelevel. The strong convergence of aggregate output/demandpattern between WAMZ countries based on trade gravitymodels thus emerges as a possible positive attribute ofcountries participating in efcient currency areas.
Alternative Perspectives on the Challenges and PolicyOptions for WAMZ
This study presents a new perspective of the challenges which
confronts the WAMZ projects by debunking the traditionaltheories of inevitability of macroeconomic convergenceas the sole criteria for determining its commencement. Itnoted that the pitfall of such arguments is the erroneousassumptions that ex ante policy environment is a goodmirror ofex post outcomes with monetary unionization ashas been the case with the EU (characterized by advanceeconomic and nancial market structures) experience.However, the review of the background to this study showthat participating countries in WAMZ are characterizedby weak economic and nancial structures and unduescal impetus which compromises independent monetaryand exchange rates policies that have kept participating
countries from attaining macroeconomic convergence in theforeseeable future. The only comparable monetary union tothe WAMZ is that of WAEMU (with similar economic andnancial structure to WAMZ) whose experience show that
their union was not preceded by insistence on attainmentof macroeconomic convergence, but that unionizationhad served as a veritable instrument for the attainmentof macroeconomic convergenceex post . This furtherlends support to the ndings of the trade gravity modelsas viable alternative tests to macroeconomic convergencecriteria tests, with the conclusion that new perspectivesof the real challenge to WAMZ union be identied. In thelight of these ndings, this study agree with Ojo (2005)and Nnanna (2007) that the real challenge to WAMZcommencement is not macroeconomic non-convergence,but lack of political will and commitment on the part of allstakeholders towards full implementation of the schemesalong the path taken by WAEMU (the rst monetary zonewith which WAMZ must be merged to obtain the ECOWASmonetary union). Among these challenges are:
i. Inadequate political commitment on the part ofthe participating countries that have continuedto draw up their independent annual economicprogrammes without taking into consideration theregionally agreed benchmarks or matching samewith adequate nancial support.
ii. Political instability characterized by militarydictatorships, poor governance practices and civilconicts which have been part of the history of
these participating countries in WAMZ. Thesenot only prevent these countries from pursuingsustainable independent scal, monetary andexchange rates policies, but accentuated thedegree of non-convergence as well as alienatescrisis aficted members of the Zone from the muchneeded technical and nancial support by externalpartners and foreign investors.
iii. Poor sustainability of policy actions towards theprocess of monetary unionization, especially by themajor economies of WAMZ (Nigeria and Ghana)and their failure to provide the desired leadership
60

8/15/2019 African Single Currency
http://slidepdf.com/reader/full/african-single-currency 60/192
and role similar to that which Germany andFrance played in the European Union integrationprogrammes.
iv. Poor Communication and sensitization strategyreected in:
• apparent lack of clearly dened communicationstrategy for winning the support of the governmentand people of participating countries;
• weak dissemination of information on progressmade and the relative inability to stimulate andencourage the necessary complimentary technicalpreparations by all stakeholders;
• Doubts, uncertainty and lack of information ofwhat the transition to a single currency wouldinvolve
• Doubts about the gains and benets of the projectsamong inuential elites and major stakeholders.
Recommended Policy Options
The lesson to be learned so far from the review of theconstraints and challenges to the WAMZ projects is the needto adopt a credible and feasible integration model that iscapable of addressing these constraints. In this context, thechoice of model should be guided by the overriding needto curtail scal impetus and indiscipline that hamperedthe effectiveness of erstwhile independent monetary andexchange policies. It should also be one which capitalize
on and exploit the ex ante strong endogenous factorsand the results of the trade gravity tests to proceed onestablishing the monetary union in anticipation that it couldact as instruments for the achievement of macroeconomicconvergence of WAMZex post . The WAEMU can be studiedfurther to identify the optimal policy and institutionalframework for the WAMZ. In particular, the core strategicelements of the integration model to be adopted shouldbe compatible with the enabling environment, the existingstate of nancial infrastructure and human capacities.Above all, it should be a model that can garner supportand assure all stakeholders that the gains from the projectfar outweigh the costs in addition to eliminating implicit
doubts and fear associated with the anticipated changes.In the light of these, this study recommends the followingpolicy options:
a. A vertical integration options similar to that ofWAEMU should be adopted for integrating thenational central banks, common monetary policyand currency managements so as to make thefuture merger of WAMZ with it easy to accomplishfor the region-wide ECOWAS common currency.This means that WAMZ should consider fusingtogether their existing central banks into oneregional central bank, instead of the proposedmaintenance of a system of national centralbanks (similar to the EU) which requires the needfor the attainment of ex ante macroeconomicconvergence.
b. A complimentary political and over-sightinstitutional arrangements similar to that of theWAEMU, meaning that WAMZ would be headed byConference of Heads of States, while the commoncentral bank would be headed by a Council ofMinisters that should include Finance Minister ofmember countries. However, unlike WAEMU, thisbody should be expanded to include the Governorof each of the participating central banks (the
promoters of the union) as executive members ofthe West African Central Bank governing board. Itis recommended that they be designated as VicePresident and Head of Country Operations of the
proposed regional bank as a way of garneringtheir support instead of relegation to the positionof Branch Managers which is the current situationunder the WAEMU arrangements.
c. An adoption of institutional and administrativeoptions for the supra-national central bankthat is modeled along the lines of the BCEAO,the common central bank of the WAEMU. This
suggests the creation of a single regional monetaryauthority for managing the internal and externalvalue of the envisaged common currency and
guaranteeing its integrity through implementationof credible management strategies.
61

8/15/2019 African Single Currency
http://slidepdf.com/reader/full/african-single-currency 61/192
d. An adoption of a monetary policy option that isconsistent with the integration model chosen. Inthis wise, the West African Central Bank should
possess instruments autonomy to set ultimate
objectives, intermediate targets and operating procedures for the implementation of union-wide monetary policies without interference fromany participating country’s government within oroutside the sub-region.
e. An adoption of a payment systems frameworkthat takes into account the current habit and
preference of the people in the region to transactin cash as against cheques, credit cards or otherbank instruments. This requires making adequate
provisions for cash dispensing machines. This should also be accompanied with the developmentof region-wide payment systems.
f. The adoption of an exchange rate mechanismand convertibility arrangements such that theinitial parity rate is one that is optimal and sociallyacceptable by all stakeholders. It is recommendedthat this should be determined as a weightedaverage (using either stock of external reservesor any other criteria as weights) of the exchangerates of the existing national currencies of
participating countries to the US Dollar at the timeof commencement of the common currency. Itis also recommended that the Euro and not theUS Dollar should be adopted as the main reserves
currency of the WAMZ given the dominance of theEU countries as trading partners.
Concluding Remarks
The overall contribution of this study to knowledge is that itdebunked the inevitability of macroeconomic convergence
criteria as the most optimal options for the commencementof the WAMZ. Indeed, it was established that given theex ante independent scal and monetary policy pursuitsof each of the participating country, there is the likelihoodthat not more than two countries can meet these criteria,suggesting that the commencement date could remainindeterminate. It also shows that there are alternativeempirical tests of OCA that offer more credible evaluatingcriteria for the WAMZ project than the macroeconomicconvergence criterion. It further reinforced the ourconviction that opportunities exist for the stakeholders toadvance the common currency project, given the tradegravity model results to commence the programme sincetheir independent monetary and exchange rate policieshave had adverse effects on economic growth and inationin WAMZ countries.
In conclusion, it is desirable to note that the relativeineffectiveness of independent monetary and exchangerates policies stemmed in part from the lack of politicalautonomy of the national monetary authorities (the centralbanks, which hitherto led to a compromising stance withrespect to its choice of instruments for monetary controls)and partly to inappropriate choice of instruments, withinherent bias against growth, but laying very strongfoundation for inationary spiral. It does appear that under
this macroeconomic environment, there is little prospect forimprovement except some alternative actions are taken toovercome the overbearing political inuence. This study hasshown that this can be found in entering into a currencyunion, with the surrender of monetary and exchange ratepolicy to a superior body.
62

8/15/2019 African Single Currency
http://slidepdf.com/reader/full/african-single-currency 62/192
REFERENCESAfrican Development Fund, 2008,Multinational: WAMZPayments Systems Development Project (The Gambia,Guinea and Sierra Leone) Appraisal Repor t. AfricanDevelopment Bank website: www.AfDB.orgAlesina, A., Barro, R. and Tenreyro, S., 2002, “OptimalCurrency Areas”,NBER Working Paper No. 9072.Altissimo, F., Benigno, P. and Palenzuela, D., R. (2005),“Long-run Determinants of Ination Differentials in aMonetary Union”,CEPR Discussion Papers, No. 5149.Anderson, James and Eric van Wincoop (2004). “Tradecosts,” Journal of Economic Perspec-tives52, 691-751.Angeloni, I. and Ehrmann, M. (2007) “Euro Area InationDifferentials”,Topics in Macroeconomics, 7(1), Article 24.Antonin Aviat and Nicolas Coeurdacier(2006,) “TheGeography of Trade in Goods and Asset Holdings”ESSEC,Centre de recherché DR 06012, www. [email protected] Anyanwu, J. C. (2003), “Does Monetary Union Affect Tradeand Output?”, West African Journal of Monetary andEconomic Integration, Vol. 3(2):1-23.Anyanwu, J. C., 2003, Estimating the MacroeconomicEffects of Monetary Unions: The Case of Trade and Output,African Development Review 15: 2 – 3, 126 - 145Appleyard, D. R. and A. J. Field, JR. 1998.InternationalEconomics.© Irwin/McGraw-Hill Boston.
Backus, D., Kehoe, P. and Kydland, F. (1992), “InternationalReal Business Cycles”, Journal of Political Economy 100,pp745-775.Balogun, E. D. (2007), “Monetary Policy and EconomicPerformance of West African Monetary Zone Countries”,West African Journal of Monetary and Economic Integration,7(1): pp 33-59.Bayoumi, T. and Barry Eichengreen (1997), “Ever Closer toHeaven? An Optimum-Currency-Area IndexBayoumi T. and Ostry, J., 1997, “Macroeconomic Shocksand Trade Flows within Sub-Saharan African: Implicationsfor Optimum Currency Areas, Journal of African Economics,
6, 69-182.Bayoumi, T. and Eichengreen, B., 1992. “Shocking Aspectsof European Monetary Unication, NBER Working PaperNo. 3949.Blanchard, O. (1999), “European unemployment: the roleof shocks and institutions” Baf Lecture, Rome.Blanchard, O. and D. Quah (1989), “Dynamic Effects ofAggregate Demand and Supply Disturbances”, AmericanEconomic Review 79, pp.655-673Bloem, Adriaan M., Robert J. Dippelsman, and Nils O.Maehle, (2001), Quarterly National Accounts Manual:Concepts, Data Sources, and Compilation. © InternationalMonetary Fund, Washington, DC.Buiter, W.H.C., C. Corsetti, and P. A. Pesenti (1995). “Acentre-periphery model of monetary coordinationand exchange rate crises. National Bureau of EconomicResearch Working paper No. 5140.Buiter, Willem H. (2000), “Optimal Currency Areas: WhyDoes the Exchange Rate Regime Matter”, Centre for
Economic Policy research (CEPR), Discussion Paper SeriesNo. 2366.Bussière, M., J. Fidrmuc and B. Schnatz (2005). “Tradeintegration of Central and Eastern European countries:Lessons from a gravity model”.European Central BankWorking Paper,545.Cobham, D. and P. Robson. 1992. “Monetary integrationin Africa: A deliberately European perspective”. In B.
Eichengreen, ed., “European Monetary Unication”. Journal of Economic Literature, 31: 1321–57.Corsetti, G. (2008), “A Modern Reconsideration of theTheory of Optimal Currency Areas”,European UniversityInstitute (EUI) Working Papers, ECO 2008/12.Corsetti, G. and Pesenti, P. (2002), “Self-Validating OptimumCurrency Areas”,NBER Working Paper , no. 8783, February,2002.
Debrun, Xavier, Paul Masson and Catherine Pattillo(2003), “West African Currency Unions: Rationale andSustainability”, CESifo Economic Studies, Vol. 49, 3/2003,381– 413
63

8/15/2019 African Single Currency
http://slidepdf.com/reader/full/african-single-currency 63/192
Debrun, Xavier, Paul Masson, and Catherine Pattillo,2002, “Monetary Unions in West Africa: Who Might Gain,Who Might Lose and Why?” IMF Working Paper 02/226(Washington: International Monetary Fund).
Devarajan, S. and J. de Melo. 1986. “Evaluating participationin African monetary unions: A statistical analysis of the CFAZones”.World Development , 15(4): 483–96.Devarajan, S. and J. de Melo. 1990. “Membership in theCFA Zone: Odyssean journey or Trojan horse?” World BankWorking Paper Series No. 482.Égert, B., Ritzberger-Grunwald, D., and Silgoner, M.A.(2003) “Ination Differentials in Europe: Past Experienceand Future Prospects”, Focus on Transition , Vol. 2,Oesterreichische Nationalbank, 47-72.Eichengreen, Barry and Tamin Bayoumi (1993) “ShockingAspects of European Monetary Unication”, in F. Torres andF. Giavazzi eds.Growth and Adjustment in the EuropeanMonetary Union, Cambridge University Press, 1993.reprinted in Eichengreenop.cit. pp.73-109.Eichengreen, Barry,European Monetary Unication: Theory,Practice, and Analysis, The MIT Press, Cambridge Mass.,1997.European Commission. (1992),One Market, One Money ,New York: Oxford University Press, 1992.Fidrmuc Jarko (2001) “The Endogeneity of OptimumCurrency Area Criteria, Intraindustry Trade and EMUEnlargement,” Bank of Finland Institute for Economies inTransition, Discussion Paper No. 8Fidrmuc, J. and I. Korhonen. 2004. A meta-analysis ofbusiness cycle correlation between the euro area andCEECs: What do we know — and who cares? BOFITDiscussion Paper 20.Fielding, D. and Shields, K., 2001, Estimating theMacroeconomic Effects of Monetary Union: The Case ofTrade and Output, African Development Review 15: 2-3,
126-145.Fielding, D. and Shields, K., 2003, Economic Integration inWest Africa: Does the CFA Make a Difference? DiscussionPaper No. 001, Department of Economics, University of
Leicester.Fielding, D. and Shields, K., 2004, Do Currency UnionsDeliver More Economic Integration than Fixed ExchangeRates? Evidence from the CFA and the ECCU, Journal of
Development Studies.Frankel, J,; Rose, A. (1998), “The Endogeneity of OptimumCurrency Areas Criteria”The Economic Journal , 421 108(449), July, 1998, pp. 1009–1025.Frankel, Jeffrey and David Romer (1999). “Does trade causegrowth?” American Economic Review89, 379-399.Frankel, Jeffrey, (1999). “No single Currency Regime isRight for all Countries or at All Times”, PrincetonEssays inInternational Finance,No. 215, August 1999.Fratianni, M. and Kang, H. (2006) Heterogeneous distance-elasticities in trade gravity models,Economics Letters,90(1) , 68--71.Fratianni, Michele and Chang Hoon Oh 2007, “Size ofRegional Trade Agreements and Regional Trade Bias”Indiana University and Università Politecnica delle Marche.
Fridmuc, J.The Endogeneity of Optimum Currency AreaCriteria, Intra-Industry Trade and EMU Enlargement , Bankof Austria, June, 2001.Friedman M. (1953), Essays in Positive Economics, Universityof Chicago Press.Glick, Reuben and Andrew Rose (2002). “Does a currencyunion affect trade? The time series evidence,”EuropeanEconomic Review46 (June), 1125-1151.Gordon, Robert and Lans Bovenberg (1996). “Why iscapital so immobile internationally? Possible explanationsand implications for capital income taxation,” AmericanEco-nomic Review86, 1057-1075.Guilaumont, P., Guilaumont, S., and Plane, P. (1988).“Participating in African monetary unions: analternative evaluation, World Development, 16:569-76.
Guillaume, D.M., and D. Stasavage (2000) “Improvingpolicy credibility: Is there a case for African MonetaryUnion” World Development, 28, pp. 1391-1407Gujarati, Damodar N. (1995). Basic Econometrics, 3rd
64
8/15/2019 African Single Currency
http://slidepdf.com/reader/full/african-single-currency 64/192
Edition, McGraw-Hill.Hargreaves, David and John McDermott (2001) “Issuesrelating to Optimal Currency Areas: Theory andImplications for New Zealand”. Reserve Bank of New
Zealand: Bulletin vol. 62 no. 3.Hausman, Roberto, Ugo Panizza, and Ernesto Stein.2001. “Original Sin, Pass through, and Fear of Floating,”Washington: Inter-American Development Bank, mimeo.Heejoon Kang and Michele Fratianni (2006), “InternationalTrade Efciency, the Gravity Equation, and the StochasticFrontier” [email protected]/[email protected], R.; Prescott, E. Post-war U.S. Business Cycles: AnEmpirical Investigation, Journal of Money , 1980 Credit andBanking, 29 (1), 1980, pp. 1–16.Hoffmaister, A. W., Roldos, J. and Wickham, P., 1998,Macroeocnomic Fluctuations in Sub-Saharan Africa, IMFStaff Paper 45, 132 – 160.Hofmann, B., Remsperger, H. (2005), “Ination Differentialsamong the Euro Area Countries: Potential Causes and
Consequences”, Journal of Asian Economics, 16(3), 403-419.Honohan, P. and Lane, P. (2003), “Divergent Ination Ratesin EMU”,Economic Policy , 358-394.Horváth, R. and Koprnická, K. (2008), “Ination Differentialsin EU New Member States: An Empirical Evidence”, IESWorking Paper: 24/2008, athttp://ies.fsv.cuni.cz.Houssa, Romain and K. U. Leuven, 2004, Monetary Union inWest Africa and Asymmetric Shocks: A Dynamic StructuralFactor Model ApproachHughes Hallett, A.; Piscitelli, L. BEMUin Reality: The Effectof a Common Monetary Policy on Economies with DifferentTransmission Mechanisms,CEPR Discussion Paper , no.2068, 1999.IMF (1999) “Guinea: Staff Report for the 1999 Article IVConsultation and Request for the Third Annual ArrangementUnder the Enhanced Structural Adjustment Facility,” IMFStaff Country Report No. 00/33.IMF (2001) “Nigeria: 2001 Article IV Consultation—Staff
Report; Staff Statement; and Public Information Notice onthe Executive Board Discussion,” IMF Staff Country ReportNo. 01/131.IMF (2001), “Ghana: 2001 Article IV Consultation and Third
Review Under the Poverty Reduction and Growth Facilityand Request for Waiver of Performance Criteria,” IMF StaffCountry Report No. 01/141.IMF (2001), “The Gambia: 2001 Article IV Consultation—Staff Report; Staff Statement; Public information Noticeon the Executive Board Discussion; and Statement by theAuthorities of The Gambia,” IMF Staff Country Report No.01/148.
IMF (2001), “The Gambia: Selected Issues,” IMF StaffCountry Reports No. 99/71.IMF (2002), “Nigeria: 2002 Article IV Consultation—StaffReport; Staff Statement; and Public Information Notice onthe Executive Board Discussion,” IMF Staff Country ReportNo. 03/3.International Financial Statistics Online Database 2003,International Monetary Fund,International Monetary Fund, “Exchange Arrangementsand Exchange Restrictions: Annual Report,” Available viathe Internet: http://www-int.imf.org/depts/mae/maeweb/ databases/AREAER/index.htm.Jenkins, Carolyn, and Lynne Thomas. 1996. “Is SouthernAfrica Ready for Regional Monetary Integration?” Centrefor the Study of African Economies Working Paper 51(November), published in Lennart Petersson, ed.,Post-
Apartheid Southern Africa: EconomicChallenges andPolicies for the Future. London, New York: Routledge,1998, pp. 145-70.Jhingan, M. L. 2003.Macroeconomic Theory, 11th RevisedEdition, © M. L. Jhingan, Vrinda Publications, New Delhi,pp. 773-787.Jhingan, M. L. 2004.Monetary Economics,6th Edition, ©
M. L. Jhingan, Vrinda Publications,New Delhi.João Silvestre, António Mendonça and José Passos 2007,TheShrinking Endogeneity of Optimum Currency Areas Criteria:Evidence from the European Monetary Union – a Beta
65

8/15/2019 African Single Currency
http://slidepdf.com/reader/full/african-single-currency 65/192
Regression Approach WP 022/2007/DE, WORKING PAPERSISSN Nº 0874-4548Kenen, P. Currency Areas (2000), “Policy Domains, andthe Institutionalization of Fixed Exchange Rates” , Centre
for Economic Performance, Discussion Papers, no. 0467,London School of Economics, 2000.Kenen, Peter, (1969) “The Theory of Optimum CurrencyAreas: An Eclectic View” in R. Mundell and A. Swobodaeds, Monetary Problems of the International Economy , TheUniversity of Chicago Press, Chicago, 1969. Pp. 41-60.Krugman, P. (1991) Is bilateralism bad?, inInternationalTrade and Trade Policy(Eds.) E. Helpman and A. Razin, MITPress, Cambridge, MA, pp.9--23.Krugman, P. 1993, Regionalism versus multilateralism:analytical notes, inNew Dimensions in Regional Integration(Eds.) J. de Melo and A. Panagariya, Cambridge U. Press,Cambridge, pp.58--78.Krugman, P. (1993), “Lessons of Massachusetts forEMU”, In: Torres, F., Giavazzi, F. Adjustment and Growthin the European Monetary Union, Cambridge: CambridgeUniversity Press, 1993.Krugman, P., and Elizondo, R. 1996. Trade Policy and theThird World Metropolis. Journal of Development Economics49: 137-150.Krugman, Paul (1993), “Lessons of Massachusetts for EMU”in F.Torres and F.Giavazzi eds. Adjustment for Growth in theEuropean Monetary Union, Cambridge University Press,New York, 1993. Pp. 241-261.Lane, P. R. (2000) “Asymetric shocks and monetary policyin the currency union” Scandinavian Journal ofEconomics, 102 pp. 585-604Lucas, Robert E., Jr., (1976), “Econometric Policy Evaluation:A Critique,” Journal of Monetary Economics,Vol. 1, No. 2,pp. 19–46.Masson, P., and C. Pattillo (2004) “A Single Currency for
Africa”. Finance & Development , December 2004.Masson, Paul, and Catherine Pattillo, 2002, “MonetaryUnion in West Africa: An Agency of Restraint forFiscal Policies?” Journal of African Economies, Vol. 11
(September), pp. 387–412.Masson, Paul, and Catherine Pattillo, 2004, The MonetaryGeography of Africa (Washington: Brookings Institution).McKinnon, Ronald I. (1996) “The Rules of the Game:International Money and Exchange Rates, MIT Press,Cambridge 1996.McKinnon, Ronald I. (2001) ”Optimum CurrencyAreas and the European Experience”. http://www.stanford.edu/~mckinnon/ McKinnon, Ronald I., Optimum Currency Areas”, AmericanEconomic Review , Vol 53, September 1963, pp. 717-724.
Mongelli, F. New Views on the Optimum Currency AreaTheory: What is EMU Telling Us?,ECB Working Paper , no.138, April, 2002.Mongelli, Francesco Paolo (2002); ““New” Views on theOptimum Currency Area Theory: What is EMU TellingUS?”. Rivista di Politica Economica, Vol. 4.Mundell, R. B.(1963) “The Theory of Optimum CurrencyAreas”, American Economic Review , 51 (4), September,
1961, pp. 657–663.Mundell, Robert A. (1963), “Capital Mobility andStabilization Policy under Fixed and Flexible ExchangeRates”, Canadian Journal of Economics and PoliticalScience,29, Nov. 1963, pp. 475-485Mundell, Robert A. (1973), “A Plan for a EuropeanCurrency”, in H.G. Johnson and A.K. Swoboda,TheEconomics of Common Currencies, Allen and Unwin, 1973.pp. 143-72.Mundell, Robert A. (1973), “Uncommon Arguments forCommon Currencies”, in H.G. Johnson and A.K. Swoboda,The Economics of Common Currencies, Allen and Unwin,1973. pp.114-32.Obaseki, P. J., (2005), “The Future of the West AfricanMonetary Zone (WAMZ) Programme”.West African Journalof Monetary and Economic Integration, Vol. 5(2):pp. 2-46.Obstfeld M., and Kenneth Rogoff (2000), “Do We ReallyNeed a New International Monetary Compact”, NBER,Working Paper Series no. 7864, August.

8/15/2019 African Single Currency
http://slidepdf.com/reader/full/african-single-currency 66/192
67

8/15/2019 African Single Currency
http://slidepdf.com/reader/full/african-single-currency 67/192

8/15/2019 African Single Currency
http://slidepdf.com/reader/full/african-single-currency 68/192
SINGLE CURRENCY IN THE ECOWAS REGION:
Is it a plausible option?By Dr. Nilanjan Banik and Dr. C A Yoonus, Institute for Financial Management and Research (India)
8/15/2019 African Single Currency
http://slidepdf.com/reader/full/african-single-currency 69/192
C on t e n t s
75METHODOLOGY
76RESULTS AND ANALYSIS
79CONCLUSION AND POLICYRECOMMENDATIONS
80REFERENCES
72EXECUTIVE SUMMARY AND
POLICY RECOMMENDATIONS
73INTRODUCTION
73WHAT IS AN OCA?
74ECONOMIC CHARACTERISTICSOF ECOWAS NATIONS
8/15/2019 African Single Currency
http://slidepdf.com/reader/full/african-single-currency 70/192
71
8/15/2019 African Single Currency
http://slidepdf.com/reader/full/african-single-currency 71/192
INTRODUCTION
Despite ongoing controversy over the hypothetical andempirical merits of regional trade agreements in and of
themselves and in relation to global trade liberalization,over the last two decades, regional trade agreementshave gained ever increased prominence. Around 200regional trade agreements, notied under the GeneralAgreement on Tariffs and Trade (GATT) and the WorldTrade Organization (WTO), are in force today. Rather thanattempting to resolve the controversy regarding the meritsof regional trade agreements, we have instead chosen toexplore whether economic characteristics of the membersof one such regional agreement, the Economic Communityof West African States (ECOWAS), predispose the successfulformation of an optimum currency area (OCA).
ECOWAS was initiated in 1975, and includes Benin, BurkinaFaso, Cape Verde, Cote d’Ivoire, Gambia, Ghana, Guinea,Guinea-Bissau, Liberia, Mali, Mauritania, Niger, Nigeria,Senegal, Sierra Leone and Togo, as members. ECOWAS isthe largest single regional trade grouping in Africa. The ideabehind ECOWAS was initially to form a Free Trade Area (FTA)among the member States before moving towards highertypes of regional integration in the form of Customs Union(CU), Common Markets (CM) and Economic Union (EU).1 Although, at present, most of the trade within ECOWASis tariff-free, indication about higher form of regionalintegration in the form of free movement of labours, arestill missing. In this aspect, the present exercise looks into
viability of forming deeper economic integration (in theform of an OCA) among ECOWAS member countries.
WHAT IS AN OCA?
The concept of an OCA was originally developed by Mundell(1961) and extended by McKinnon (1963). A currency areais an area in which exchange rates are xed or which has acommon currency. A currency area becomes optimal whenthe economic efciency (measured in terms of benets lesscosts) for forming it is maximized. Therefore, much of thedebate on the desirability of forming an OCA deals withidentication of the characteristics of member nations that
would make monetary union more (or less) benecial. Thefour categories of factors that have been identied as keydeterminants of whether members will benet from joininga monetary union are: (1) the extent of trade, (2) thesymmetry of economic activity, (3) country characteristics,and (4) labor mobility.
Criterion 1: extent of trade
The more the member countries trade among themselves,the more they will value bilateral exchange rate stability.When trading partners are on a oating exchange rate,uncertainty about future exchange rate movements can
adversely affect trade in goods, services, and capital.While forward exchange rate markets can reduce the riskof exchange rate uncertainty, such markets are not welldeveloped in the ECOWAS region. In contrast, when agroup of nations form a monetary union like the EuropeanUnion (EU), exchange rate uncertainty is eliminated.
Criterion 2: symmetry of economic activity
One objective of traditional macroeconomic policy is tomaintain internal balance, i.e., keep the economy nearfull employment and ination near zero. Expansionarymonetary policies are needed to accomplish these goalsduring a recession, while contractionary monetary policiesare prescribed as a response to heightened ination.Because members of monetary unions lose their abilityto adopt independent monetary policies, countries that
share dynamic economic trends are better candidates forforming a successful monetary union than countries withdissimilar economic dynamics. This also means that similareconomies can better afford to share a common exchangerate, an important consideration because countries withina monetary union can no longer use exchange rates as aninstrument for relative price adjustments.
Criterion 3: country characteristics
The abundant body of literature that has explored therole of economic characteristics of member nationswithin OCAs concludes that economies that are similar in
72

8/15/2019 African Single Currency
http://slidepdf.com/reader/full/african-single-currency 72/192
size, openness, and development, and are geographicalproximate, are more likely to benet from forming anOCA. McKinnon (1963) points out that the more open theeconomy, the more it will be inclined to use xed exchangerates, while exible exchange rates are more advantageousfor fairly closed economies. Lumsdaine & Prasad (2003),and Backus & Kehoe (1992) observed that countries withsimilar economic proles are better candidates for formingan OCA.
Criterion 4: labor mobility and wage exibility
The main cost of a currency union is related to the loss of
an independent monetary policy for member countries tosmooth-out business cycles. If wages are rigid and if labormobility is limited, countries that form an OCA will havemore difculty adjusting to demand shifts than countriesthat have maintained their own national currency andthat can devalue (or revalue) their currency. A high degreeof labor mobility may serve as a channel through whichadjustment to shocks can occur. Blanchard & Katz (1992)present empirical evidence that labor mobility in theUnited States has played an important role in adjustment,substituting to a large extent for price exibility.
In the light of the above literature we will now try to examineplausibility of forming an OCA in the ECOWAS region. Thereason why we choose ECOWAS is because it is the largestsingle grouping in Africa. Although we examine similarityin economic structure, trade ow and labor mobility, themain objective of the paper will be to examine symmetry ineconomic activity as a preliminary guide to form a monetaryunion in the ECOWAS region. The rest of the paper isstructured as follows. Section 3 examines ECOWAS membereconomies on the basis of their economic structure, tradeows and labor mobility. Section 4 deals with the empiricalmethodology and analyzes whether external economicshocks have similar or dissimilar economic consequenceson the member countries. Section 5 interprets the results
while discussing the potential of forming an OCA withinECOWAS region. Section 6 concludes.
ECONOMIC CHARACTERISTICS OF ECOWASNATIONS
When compared in terms of their economic structure
namely, saving as a percentage of GDP, demographicprole and labor mobility, ECOWAS nations has got somesimilarities. The industrial sector constitutes roughly a fourthof GDP in most member countries, while share of agriculturehovers around a third of national income. Majority of thepopulation still lives in the rural areas. Agriculture seemsto be the dominant means of livelihood, although in caseof economies like, Nigeria, natural resources (mainly, crudeoil) is the mainstay of economic activity. Except for BurkinaFaso, Guinea, and Sierra Leone, saving as proportion ofGDP are also similar across countries. These countries alsoshare a similar demographic prole. Very few percentage ofthe population belongs to the group aging 65 and above.This indicates that these countries are not likely to faceaging problem anytime soon which could put pressure oncommon scal resources. When countries share a similartype of economic characteristics, it indicates a lower pressure
to transfer funds from relatively resourceful countries to thepoorer ones and hence a greater harmony in following acommon scal and monetary policy.
However, the extents of trade among the ECOWAS nationsare low. ECOWAS member countries trade in much greateramount with European Union relative to what they tradeamong themselves (See Table 2). One reason for low valueof trade among ECOWAS nations are because tradables
primarily comprise of agricultural items (cocoa beans,timber, coffee, yarn, etc.) and extractive items in the formof natural resources, like, oil. Similar exports prole withrespect to primary commodities discourages trade.
Another reason for low intra-ECOWAS trade is because ofpoor infrastructure in the region. As is evident from Table3, the region is not well served by a good network of roadsand railways, crucial for the movement of goods in the
region. Only Nigeria and Cape Verde have somewhat moremiles of paved road relative to unpaved roads. Similar isthe case with miles of railway network, with, Nigeria andGuinea having somewhat better railway network facilities
73

8/15/2019 African Single Currency
http://slidepdf.com/reader/full/african-single-currency 73/192
when compared to other African States. In general, railwaylines coverage as percentage of total surface area is lessthan 0.5 percent for most African countries, which is quitelow when compared to some emerging economies in Asia.For example, railway lines coverage as a percentage of totalsurface area for China, India, South Korea and Vietnam are,0.78, 1.92, 3.40, and 0.79 percent, respectively. Politicaland social conicts in Liberia, Sierra Leone, Guinea Bissauand Niger, has prevented national governments divertadequate funds for development of both physical andsocial infrastructures.
However against these odds, the hope lies as most ofthese economies are relatively open. Forming an OCA islikely to enhance the trade gures more as there will be norestrictions on movement of goods and services (Table 4).
Finally, we examine symmetry in economic activity. Webased our analysis by examining how the key economicvariable, namely the outputs of the ECOWAS membercountries, respond to external shocks. We considered GrossDomestic Product (GDP) as a proxy for output. Changes in
the level of output over time are due to permanent andtransitory disturbances. There is a general consensus amongmacroeconomists that the transitory part of the GDP (alsoknown as cycle) is of temporary in nature and is caused bydemand shocks. The trend part of the GDP (also knownas permanent component) is explained by supply shocksand is of permanent nature. In order to show synchronizedmovement in output we have to consider the permanentpart of GDP and test whether there is any long termrelation among the trend component of GDP in the region.The temporary part of GDP by denition is stationary andtherefore cannot be tested for cointegration to ascertainpresence of any long term relation.
METHODOLOGY
To examine comovement we need to model changes in
output over time. In the 1970s, the most popular methodfor determining uctuations in output was to model a timeseries as having a trend as a deterministic function of time.In modeling GDP, the simple model containing a linear timetrend is given as follows:
(1)
where is GDP,t stands for time trend, has zero meanand variance , and is serially uncorrelated. The ideabehind this specication is that the potential output ismeasured along the trend line, and the residuals measurecyclical uctuations around the trend output. The maindrawback of this type of model is that the trend is assumedto be a deterministic function of time. But the trend itselfmay vary over time.
When the time series has a variable or stochastic trend, theconventional regression analysis containing a linear trend inthe model could give misleading results (Nelson and Plosser1982; Stock and Watson 1988). Box and Jenkins (1976)allowed trend to be driven by cumulative effects of randomshocks, resulting in stochastic trend. The advantage of usingBox-Jenkins framework is that “they have the potential toapproximate dynamics more parsimoniously than purelyautoregressive or moving average models” (p. 180, Diebold1998).
Once we have estimated the model using Box-Jenkinsmethodology, the next step is to extract the stochastic trendfrom the model. Mechanical lters, such as the Hodrick andPrescott (1997) lter, hereafter the HP lter, or the band-pass lter proposed by Baxter and King (1995), hereafterthe BK lter, can extract a trend measure from the actualoutput series. However, these univariate lters have beencriticized. For example, Harvey and Jaeger (1993) nd
that the HP lter with (nearly) integrated data can inducespurious cyclicity. Guay and St-Amant (1996) show thatboth the BK and HP lters do not accurately decomposetime series into their trend and cyclical components whenthe data have the typical spectral (or pseudo-spectral) shapeidentied by Granger (1996). Moreover, Baxter and King(1995) nd that the HP and the BK lters show instability ofestimates near the end of the sample period.
In this paper an alternative estimation techniques, theBeveridge-Nelson (1981) methodology is used to estimatethe stochastic trend. Beveridge and Nelson show that anyARIMA model can be represented as a stochastic trend
74

8/15/2019 African Single Currency
http://slidepdf.com/reader/full/african-single-currency 74/192
plus a stationary component where a stochastic trendis dened to be random walk, possibly with a drift. Forany data generating process , using Beveridge-Nelsonmethodology, we can decompose it as follows:
where and or
(2)
is a stochastic trend and is modeled as random walk witha drift . The permanent and the stationary componentsof the time series are both proportional to the disturbanceterm and are thus perfectly correlated. Beveridge andNelson (1981) dened the permanent part as that part of
which will be continued into the future, whereas thetemporary part is purely a stationary random process.
DataWe have GDP data for each country, namely, Benin, BurkinaFaso, Cote d’Ivoire, Ghana, Liberia, Niger, Nigeria, Senegal,Sierra Leone and Togo. Cape Verde, Gambia, Guinea,Liberia, Mali and Mauritania are excluded from the analysisas relevant data for all time periods for these countries arenot available. The results of the analysis will not change
much as these countries are smaller economies, with, Coted’Ivoire, Nigeria, Ghana and Senegal being the largesteconomies. The data consisted of 48 annual observationsfrom 1960 to 2007. The data used in this study are real GDPdata measured in current US dollars. The data is obtainedfrom World Development Indicators, World Bank.
RESULTS AND ANALYSIS
The rst step involves testing the data series for stationary.To test for nonstationarity, we used Augmented Dickey-Fuller tests (ADF). Using this test statistic, we found evidenceof nonstationarity for the GDP. The result of the ADF test in
Table 6 show that for all the sample countries data exhibitunit root, suggesting that these variables are not meanreverting but are I(1) processes. Specically, we estimatedthe regression model
,
where, is the logarithm of the GDP series for eachcountries, and 1 is the ADF parameter. To determineappropriate specication for the number of lagged GDPterms, we use the standard lag-length diagnostic tests,
such as AIC and Schwarz Criterion. The most parsimoniousspecication is obtained choosing a lag-length ofn = 3.The partial t -statistics on second and third-order laggedoutput were not statistically signicant (P-value>0.10).Loss functions, such as AIC and Schwarz Criterion, wereroughly minimized in the neighborhood ofn = 3. Giventhe MacKinnon (1996) critical values of 2.61, we fail toreject the null hypothesis of a unit root at the 5% levelof signicance. Taking rst difference of the data, wereject the null hypothesis of a unit root at the 1% level ofsignicance. Hence, the GDP data are non stationary.
Having identied the data as non-stationary, we take the rstdifference of the level data series and make them stationary.The autocorrelation and the partial autocorrelation functionof the rst difference of the log of output ( ), for the tencountries were then examined. They were identied andestimated as an ARIMA process. The Beveridge and Nelson(1981) decomposition is now applied to these data sets.Using (5) and (6) we can compute the permanent and thetemporary component of . The results of the estimatedmodel for each of the ten countries are summarized below2.
75

8/15/2019 African Single Currency
http://slidepdf.com/reader/full/african-single-currency 75/192
Benin
Identication:
Solution:
Burkina Faso
Identication:
Solution:
Cote d’Ivoire
Identication:
Solution:
Ghana
Identication:
Solution:
Liberia
Identication:
Solution:
Nigeria
Identication:
Solution:
Niger
Identication:
Solution:
Sierra Leone
Identication:
Solution:Senegal
Identication:
Solution:
76

8/15/2019 African Single Currency
http://slidepdf.com/reader/full/african-single-currency 76/192
Togo
Identication:
Solution:
Note: Results derived using EVIEWS 6 Software. Absolutet-statistics are reported in the bracket. All the variables are
signicant at 5% level of signicance. In all the equation Y 0 refersto the log of real output for each of the individual countries forthe base year 1960. t takes value 1 for the year 1963 and takesvalue 45 for the year 2007.
The permanent and the temporary components can now beeasily calculated using the solution to the above differenceequations. For example, in case of Nigeria the permanent
component of GDP is given as. is the log value of Nigeria’s GDP for the year 1960,and . The permanent component of thelog output for Nigeria for the year 1963 is given as
. Similarly, the permanentof the log output for Nigeria for the year 1964 is givenas . Repeatingfor each point in the data sets for Nigeria, starting 1963and ending 2008, will yield the permanent component.We follow the same rule in calculating the permanentcomponent of GDP for other countries. As one of themodel specications, that is, in case of Liberia involvingan AR (2) process, we lose three initial observations (onedue to differencing the data and the other related to AR(2) process). Since we want to examine cointegrating relationamong permanent components of all the sample countries,t takes value 1 for the year 1963 and takes value 45 for theyear 2007, to address comparability.
Once we have estimated the permanent component we caneasily calculate the temporary component by subtractingpermanent component from the actual data sets. As theGDP series for each country are expressed in natural log,the temporary and permanent component of GDP are
also in natural log format. Evidently the innovations in theBeveridge-Nelson permanent and stationary components areboth , so that the permanent and stationary componentsare perfectly correlated. The permanent component andtemporary components of log GDP are reported in Table 7and Table 8 respectively.In the nal step we test for cointegration or presence oflong term relationship among the permanent componentof GDP and examine the correlation matrix of the temporarycomponent of GDP across the member countries.Cointegration refers to a linear combination of nonstationaryvariables. Hence, we need to examine nonstationarity in thepermanent component of GDP in their level form. UsingAugmented Dickey-Fuller tests (ADF), we found evidenceof nonstationarity in the permanent component of GDP forthe sample countries. The data series can now be tested forcointegration.
The identication of the cointegration between output isbased on an unrestricted model (i.e. we will use a VectorAutoregressive (VAR) Model). Here all the variables enterall the output equations and there is no restriction on theparameter values. There are ten I(1) process in the data,implying there can be, at most, nine cointegrating relationsacross ten countries (Johansen and Juselius, 1995). Resultsindicate on the basis of maximum eigenvalue and the tracetests at a 95 percent level of signicance, there are threecointegrating relationship among the output variables (SeeTable 9).
The relationship:
(3)
where y is the permanent component of log output fromrestrictive countries.3 The standard errors are reported in theparentheses. The cointegrating relationship (3) identied
three stable time trend relationships among the permanentcomponents of GDP growth rates among the ten samplecountries. This implied that the permanent components ofGDP for these ten countries tend to move proportionally in

8/15/2019 African Single Currency
http://slidepdf.com/reader/full/african-single-currency 77/192
78

8/15/2019 African Single Currency
http://slidepdf.com/reader/full/african-single-currency 78/192
result in monetary and scal policy settings that would notcreate relative advantages or disadvantages between themember states.
However, these similarities in economic characteristics will
not work in favor if some of the present problems in theECOWAS region are not addressed. First there is a need tobuild a proper infrastructure. There is a dearth of road andrailway infrastructures. Secondly, the member countriesshould take more initiatives to trade among themselvesrather than trading with more advanced economies.Many operating companies in the ECOWAS region areheadquartered in developed countries. So when agreementsare concluded among member countries of ECOWAS, thedominance of these trans-national corporations reducessuch policy initiatives. Also, since most of the trade in theregion involves primary commodities there is a need todiversify production into higher value added manufactureditems. This might lead to possibility of intra-industry tradeand sustain monopolistic type competition. Third, thepresence of xed exchange rate regimes between FrenchFranc and some currencies in West Africa also discourage
any further initiative for having a common currency in theECOWAS region. Fourth, given the ever increasing rise inpopulation in Africa, there is a need to increase employableopportunities in the region. According to recently publishedworld population statistics by United Nations PopulationInformation Network, in 2050, Africa with 1.99 billioninhabitants, will be more populated than India (around400 millions more inhabitants), and much more than China(around 600 millions more inhabitants). And nally, thereshould be some conscious effort by the relatively resourceendowed economies in West Africa, such as, Nigeria, Ghana,Senegal and Cote d’Ivoire, to undertake more initiative totrade with relatively resource poor States in West Africa.At a time when direct transfer of resources sound ratherimplausible, trade can help to build purchasing power inthe region.
REFERENCESBackus, D., K., and P., J., Kehoe, (1992), “InternationalEvidence on the Historical Properties of Business Cycles,”The American Economic Review , Volume 82, 864-88.Baxter, M., and R., G., King, (1995), “Measuring BusinessCycles: Approximate Band-Pass Filters for Economic TimeSeries,” National Bureau of Economic Research, WorkingPaper No. 5022.Beveridge, S. and C. R. Nelson, (1981), “A New Approachto Decomposition of Economic Time Series Into Permanentand Transitory Components with Particular AttentionTowards Measurement of Business Cycles” Journal ofMonetary Economics, Volume 7, 151-174.Blanchard, O., J., and L., F. Katz, (1992), “RegionalEvolutions,” Brookings Papers on Economic Activity.Box, G.P. and M.G. Jenkins, (1976), “Time Series andForecasting: An Applied Approach,” Oakland: Holden Day.Diebold, X., F., (1998), “The Past, Present, and Futureof Macroeconomic Forecasting,” Journal of Economic
Perspectives, Volume 12, 175-192.Granger, C., J., (1996), “The Typical Spectral Shape of anEconomic Variable,”Econometrica, Volume 34, 150-161.Guay, A., and P., St-Amant, (1996), “Do Mechanical FiltersProvide a Good Approximation of Business Cycles?” BankCanada Technical Report No. 78.Harvey, A., C., and A., Jaeger, (1993), “Detrending, StylizedFacts and the Business Cycles: An Empirical Investigation,”
Journal of Applied Econometrics, Volume 8, 231-247.Hodrick, R., J., and E., C., Prescott, (1997), “Post War USBusiness Cycles: An Empirical Investigation,” Journal ofMoney Credit and Banking, Volume 29, 1-16.Johansen, S., and K., Juselius, (1995), “Identication ofthe Long-Run and the Short-Run Structure: An Applicationto the ISLM model,” Journal of Econometrics, Volume 63,7-36.Kenen, P., (1969), “The Theory of Optimum Currency Areas:An Eclectic View,” in R. Mundell and A. Swoboda (eds.),Monetary Problems of the International Economy, Chicago:
79
End Note

8/15/2019 African Single Currency
http://slidepdf.com/reader/full/african-single-currency 79/192
University of Chicago Press.Lumsdaine, R. L., and E. S. Prasad, (2003), “Identifyingthe Common Component of International EconomicFluctuations: A New Approach,”The Economic Journal ,
Volume 113, 101-127.MacKinon, J., G., (1996), “Numerical Distribution Functionsfor Unit Roots and Cointegration Test,” Journal of AppliedEconometrics, Volume 11, 601-608.McKinnon, R., I., (1963), “Optimum Currency Area,”
American Economic Review , Volume 53, 717-725Masson, P., R., and M., P. Taylor, (1994), “Optimal CurrencyAreas: A Fresh Look at the Traditional Criteria,” in Siklos(ed.), Varieties of Monetary Reforms, Kluwer Academic.Mundell, R., (1961), “A Theory of Optimum CurrencyAreas,” American Economic Review , Volume 51.Nelson, C., and C., Plosser, (1982), “Trends and RandomWalks in Macroeconomic Time Series,” Journal of MonetaryEconomics, Volume 10, 139-62.Stock, J., and M., Watson, (1988), “Variable Trends in
Economic Time Series,” Journal of Economic Perspectives,Volume 2, 147-74.
1 In forming, a FTA, members remove trade barriers among themselves butkeep their separate national barriers against trade with outside nations.In a CU, members not only remove trade barriers among themselves butalso adopt a common set of external barriers. In a CM, members allowfull freedom of factor ows (migration of labour and capital) amongthemselves in addition to having a CU. In an EU, members unify all theireconomic policies, including monetary, scal and welfare policies, whileretaining the features of a CM. An OCA is a special type of EU wherethe countries operate with a single currency.
2 Estimation was performed using the econometric software packageEVIEWS 6. Let y be the name used for the series, log of real output, ina EVIEWS session. The ARIMA (1,1,1) model was estimated using theEVIEWS commands: y = c + AR(1) + MA(1).
3 The normalized cointigrating vector in this case is (1, -1.63, -0.381,0.875, -0.079, -0.581, 0.268, -0.547, 0.449, 0.837).
4 Seignorage is the revenue government obtains by nancing its budgetdecit through printing money rather than selling debt.
End Note

8/15/2019 African Single Currency
http://slidepdf.com/reader/full/african-single-currency 80/192

8/15/2019 African Single Currency
http://slidepdf.com/reader/full/african-single-currency 81/192
C on t e n t s
90SOUTHERN AFRICANDEVELOPMENT COMMUNITY(SADC) TOWARDS CRITICAL
AREAS OF MONETARY POLICIES:STATUS AND WAY FORWARD
103ACKNOWLEDGEMENT
104REFERENCES
84EXECUTIVE SUMMARY ANDPOLICY RECOMMENDATIONS
86INTRODUCTION
88MACRO-ECONOMIC TRENDS IN
THE ECONOMY
82

8/15/2019 African Single Currency
http://slidepdf.com/reader/full/african-single-currency 82/192
EXECUTIVE SUMMARY AND POLICYRECOMMENDATIONSMonetary policy is the process by which governmentsand Reserve/Central Banks control the supply and cost ofmoney to attain a set of objectives oriented towards the
growth and stability of the economy. The success of theSouthern African Development Community (SADC) regionwill depend on its ability to promote growth in intra-regional trade for the benet of all member states. Thiswill require, amongst other things, stable macro-economicconditions for capacity-creating cross-border investment.
Achieving monetary integration between SADC countries
is often promoted as a way to enhance scal disciplineon national authorities and assist in creating this macro-economic environment. Monetary integration, epitomisedby all countries adopting a common regional currencyand, therefore adhering to xed exchange rates across theregion requires macro-economic convergence. But this isonly stage one in the progression of regional integration.This will take a considerable time to materialize in SADC.
A case can be made for a programme of single-indicatorconvergence that focuses on the control of ination as thebroadest indictor of balance in resource utilization. TheSouthern African Development Community (SADC) hasbeen in existence since 1980, when it was formed as a loosealliance of nine majority-ruled States in Southern Africa. Themain aim then was coordinating development projects inorder to lessen economic dependence on the then apartheidSouth Africa. Monetary union and a common regionalcurrency implies a single regional institution, the Southern
African Monetary Authority (SAMA?) is given responsibilityfor controlling the money supply and therefore setting thelevel of interest rates across the region.In this situation the use of scal policy instruments wouldbe constrained because an excessive budget decit in onemember state could undermine the regional exchangerate stability. This in turn could subject other member
states to external pressures. Strong intra-governmentalco-operation would be required to sustain the geo-
political regional stability required for the overall success
of common monetary union. But, the economies of SADCare characterised by divergent political, economic, tradingand social challenges. The regional economy is dominatedby the Republic of South Africa (RSA), an economic whale
swimming, sometimes uneasily, with a host of smaller sh. Although the prospect of a Common African Currency, (inSADC, the ‘SAMARAND’?) had been mooted as a goal ofthe Organisation of African Unity since 1963, the processwas given renewed priority in 2001 when the OAU’s 53member states agreed to transform the intergovernmentalorganisation into the African Union (AU). In August2003, the Association of African Central Bank Governorsannounced plans to create a common monetary andnancial system that would complement the single Africancommon market anticipated by 2021. A common centralbank would manage a single African currency in an areawithout internal frontier. Free movement of goods, persons,
services and capital would be ensured. The AU’s strategyentails two steps. First build genuine monetary unions in
Africa’s ve existing regional economic blocs. These regionaltrading communities represent the rst stage towards a
“full-blown” Economic and Monetary Union (EMU), similarto the creation of the European Union’s (EU’s) single marketin 1992 and the common currency area, the ‘Eurozone’, for
some of its members that appeared later.This monetary and economic union is proposed as anessential part of Africa playing a full and growing role inworld trade. But it is noted that global trade is still stronglycharacterised by inequities that prevent export growth in
African countries. The removal of export limiting subsidiesand tariffs may be a better solution for expanding exportsfrom Africa to the rest of the world and much easier toimplement than persuading African countries to give uptheir independence and exibility in scal and monetary
policies to an African Central Bank will be enormous. Unlessall countries were agreed that the benets to them from
giving up their economic policy freedom would allow themmore chance to reduce poverty faster through boostingtrade, investment growth and technological transfer, theyare unlikely to give up the policy instruments, includingexchange rate policies, transition they now have.
83

8/15/2019 African Single Currency
http://slidepdf.com/reader/full/african-single-currency 83/192
African countries are unclear how they can contributeto greater economic growth and currency stability in thecontinent. For example, amongst the best strategies formaximizing the development of foreign direct investment(FDI) is the creation of export of processing zones. But such
zones, with favourable tax treatment of the industries inthe zone, can also be seen as a nation rewriting the rulesof international and regional trade to gain a nationaladvantage. If every country is offering similar benets toexporters and foreign investors, the comparative advantageof each is reduced. In the Eurozone, for example, theEuropean Commission and the European Central Bank havethe authority to prevent such trade-distorting activities and
to ne countries that engage in them. Would an AfricanCentral Bank (or in SADC, the SAMABANK?) be able to dothis? In SADC, if the votes on the SAMA Bank ‘independent’board are weighted by the relative size of the economiesrepresented, the RSA would have a majority vote over everydecision. This would be used in the interest of the RSA.Most African countries, including some in SADC, evenexcluding Zimbabwe, face a crisis in economic management
attributed to poor governance and corruption. WouldBotswana, Mauritius and the RSA want to retain a vetoon decisions because they have the most to lose in termsof giving up the policy freedoms that have allowed themto become relative successful economies? Would oil-rich
Angola be prepared to transfer some of its new wealth to‘bail out’ a fellow SAMA member ghting to retain its xedexchange rate?Most literature recognizes that both scal and monetary
policy must be operating in an appropriate way if price stability is to be achieved. The view that ination is essentiallya monetary phenomenon suggests that independentreserve/central banks should operate with rules that includecontrolling ination. As prices are determined by money
supply and demand, the scal authorities must adopt acomplementary and appropriate scal policy for sustainabledevelopment in Africa. This necessitates additional scal andmonetary disciplines from authorities, with this disciplinebeing imposed by the Regional monetary authority wherenecessary. Within the SADC region, the historical recordindicates difculties with this discipline which places a high
risk on success of a price stability policy outcome.Movements towards African Monetary Co-operationProgramme (AMCP) and eventual union are guided bythe Committee of Central Bank Governors (CCBG). In
1995 the CCBG was established with the specic purposeof achieving closer cooperation and integration in thearea of monetary policy among SADC central banks. TheCCBG has contributed to major developments such as theharmonisation of the payment and clearing systems, theapproval of Memoranda of Understanding on Cooperation,and the Coordination of Exchange Control Policies in SADC.CCBG has also coordinated training for central bank ofcialsvia a Training and Development Forum. If progress can bemaintained along these lines it has been suggested that aSADC monetary union be considered for 2016.It is likely that this monetary union would build from thefoundation of the Southern African common currencyunion and the common customs union, which include theRSA, Namibia, Lesotho and Swaziland. In these countriesthe South African Rand circulates alongside the nationalcurrency, there using a common system of V.A.T rates andcustoms and excise duties. The members of the agreementmanage economic policy to retain sufcient reserves tomaintain the value of the national currency at par with theRand. Unfortunately, the Currency Union appears to havedone little to build a common framework for the transferof deposits. Cheque clearing between the national banking
systems is slow and expensive compared to transfermechanism within the country. This is despite the fact thatthe banking systems of all the peripheral countries exist asnational branches of RSA-based banking conglomerates.Economic convergence lies at the heart of SADC monetaryunion. Government targets are development indicators suchas per capita growth to equal indicators of the developedworld. Monetary policy, the domain of central banks, hasan indirect role in facilitating the engine of regional growth.Production, trade and capacity creating investment are theroles of government. But the central bank is, ultimately, acreature of the Government and must operate within the
structures of governmental economic policies, in terms ofits macro-economic inuence.
84

8/15/2019 African Single Currency
http://slidepdf.com/reader/full/african-single-currency 84/192
One signicant challenge for SADC is that its member states also participate in other regional economic, politicaland security cooperation schemes that may compete withor undermine SADC. On October 22, 2008, the African FreeTrade Zone was initiated by SADC, the Common Marketfor Eastern and Southern Africa (COMESA), and the East
African Community (EAC). If the intent is achieved a singlefree trade zone will result with a combined economic
power of an estimated GDP of $624bn (£382.9bn) from26 countries.
It is argued that the adoption of a common currency regime,where countries maintain xed exchange rates within thearea will bring a number of benets such as increased tradebetween the countries, price stability, increased aggregateinvestment, and the elimination of the exchange rate risk.There will be increased capital ows and enhanced regionalinvestment opportunities, resulting in socio-economic gainsand growth. In the short term a SADC monetary union isthe only practicable option. It will have unique challenges.Member states must prepare themselves if they are tobenet optimally from the process. Given the importance
of the process, and sensitivities around it, the citizens ofthe member states must be properly informed. There arebenets as well as costs of monetary unions. The member
states need to demonstrate benets. Diversication of the joining economies should be towards manufacturing anddeveloping of human capital. But, most importantly thefree movement of human, physical and nancial capitalresources should continue between the member states.
For SADC the working model for regional cooperation isthe common monetary area of Southern African Countries:South Africa, Lesotho, Namibia, and Swaziland. Toenable a SADC Common Monetary Union to succeed, itis recommended that the remaining SADC states join thisunion rst. This model for monetary union before currencyunion is believed to be the most practical approach to thelong term objective of the creation of a single currency in
Africa. But it has its dangers.
INTRODUCTION
Africa is the world’s second-largest and second most-populous continent, after Asia. As part of the world picture,Africa, with a current population of more than 934 millionpeople1, is witnessing changes that are remaking its nations.These changes arise in the social, economic and politicalspheres. The average citizens of Africa are most aware ofpolitical changes. The greater degree of multipartyism andwider democratisation that are part of these changes areimportant and necessary. But, social and economic changesare even more important. They form the agenda of politicsand fundamentally affect every individual citizen.
The region has sought economic recovery through theimplementation of the New Partnership for Africa’sDevelopment (NEPAD) programmes. The overall aim ofNEPAD can be summed up as a commitment by Africa’sleaders to place the continent on an accelerated path ofsocial, technological and economic development. NEPADrecognises that economic growth is not an end in itself. Itis largely a means for improving the conditions and overall
well-being of a country’s citizens, to free them from the dailystruggle for survival so they have the time and resources tobetter themselves and their society. The goal of a commonAfrican currency has long been a pillar of the developmentof African unity; a symbol of the strength that its backershope will emerge from efforts to integrate Africa. Althoughthe prospect of a single African currency had been mootedas a development goal of the Organisation of African Unitycreated in 1963, the process was given renewed priorityin 2001 when the OAU’s 53 member states agreed totransform the intergovernmental organisation into theAfrican Union (AU)2. In August 2003, the Association ofAfrican Central Bank Governors announced plans to createa single African market - an area without internal frontiersin which the free movement of goods, persons, servicesand capital is actively promoted. A single, common centralbank would manage a single African currency by 20213.
The AU’s twofold strategy entails rst building genuinemonetary unions in Africa’s ve existing regional economicblocs. These regional trading communities represent the
85

8/15/2019 African Single Currency
http://slidepdf.com/reader/full/african-single-currency 85/192
rst stage towards “full-blown” Economic and MonetaryUnion (EMU), similar to the creation of the EuropeanUnion’s (EU’s) single market in 19924. The Accra Declarationof 2007 highlighted the key role that the RegionalEconomic Communities (RECs) should play in the processof continental integration. Furthermore, the second AUconference of African Ministers of Economy and Financemeeting agreed that the RECs should play key role in theprocess of establishing the AU nancial intuitions.
Therefore the establishment of the African Union (AU) offerssome hope that African governments are now committed togreater collective efforts to address the continent’s greatestchallenges. Most countries in Africa are small and are listedby the United Nations as Least Developed. Future signicantadvances in economic development in Africa will dependin no small part on the success with which countries canexploit the opportunities and avoid the risks presented byglobalisation. A viable outward oriented strategy will haveto reect the economic structural endowments relative toother parts of the world. The formation of a monetary unionrequires harmonisation of exchange rate mechanisms and
scal and monetary policies.Since Africa is relatively rich in agricultural, mineral and otherraw materials, this comparative advantage must be used todevelop the continent’s economies and people. As much aspossible value must be added to raw materials within thecountries in which they are exploited. The establishment ofdiamond cutting industries in Botswana and Namibia is agood example in the region. Average incomes for the world
as a whole are rising, and there is an obvious capacity forinnovation and wealth creation in Africa. But these gains areaccompanied by persistent inequality, growing exclusion,insecurities caused by economic uctuations, and a feelingthat the ground rules are unfair5. Everyone wants a stable,prosperous world economy. We all want to be able tolook to the future with some sense of security. Everyone isconcerned about such global problems as the deteriorationof the environment, and poverty. But views diverge onmany specics, and are largely inuenced by what placea country occupies in the current world economic set-up.
African countries have not yet beneted from the increasesin international trade. African scal problems are much moresevere, monetary policy often begins at the departmentsof nance and the reserve/central banks that are forcedto nance growing budget decits in a monetary unionmay have to implement neutralising monetary policies thatwill drive interest rate up in order to maintain the agreedcurrency parity.
Policies are needed to promote export diversication outof primary commodities and into industrial and serviceindustries with a higher value-added. The failure of thegovernments to maintain their commitment towardsending scal dominance can led to an upwards shift in theterms and structure of ination expectations and increasedexchange rate volatility. Experience shows that the scalpolicy regime must be such that it does not allow changesin price level to become the mechanism through which thecondition for government solvency is satised.
The world has done much to help Africa to develop buthas very little positive results to show for its efforts. Whilemost of the world, especially Asia, is forging ahead inthe development stakes, Africa is marking time at best,and often marching backwards. Until the onset of theworld wide nancial crisis arising from the collapse ofthe property market prices in the United States and theconsequent illiquidity and then insolvency of internationalnancial institutions and markets, precipitating expectationof a sharp down turn in world economic growth the globaleconomy has been especially strong in recent years, with
average worldwide per capita income growing morerapidly than ever. One group of developing countries ledby Brazil, Russia, India and China (the so-called BRICs) andrepresenting a large share of world population, has been atthe forefront of global growth. These economies are alsogrowing faster than those of African countries. They areincreasingly are accessing global markets for goods, capitaland technology; they are trading more and more with eachother as well as with rich nations. They are also starting tocatch up with the wealthiest countries in terms of humandevelopment. But, another group of developing countriesin Africa, greater in number, if small in population are

8/15/2019 African Single Currency
http://slidepdf.com/reader/full/african-single-currency 86/192
8/15/2019 African Single Currency
http://slidepdf.com/reader/full/african-single-currency 87/192
88

8/15/2019 African Single Currency
http://slidepdf.com/reader/full/african-single-currency 88/192
Table 1.1: Regional Economic Blocs
Pillars RegionalBlocks (REC)
Area Square km Estimated Popu-lation2007
GDP (PPP) mil-lions of US$
(PPP) per CapitaUS$
MemberStates
AEC 29,910,4442 853, 520,010 2,053,706 2,406 53ECOWAS 5,112,903 251,646,263 342,519 1,361 15ECCAS 5,667,421 121,245,958 175,928 1,451 11SADC 9,882,959 233,944,179 737,335 3,152 14
EAC 1,763,777 97,865,428 104,239 1,065 3COMESA 12,873,957 406,102,471 735,599 1,811 20IGAD 5,233,604 187,969,775 225,049 1,197 7Western Sahara 266,000 273,008 ? ? N/A
Source: http://en.wikipedia.org/wiki/Southern_African_Development_Community
SOUTHERN AFRICAN DEVELOPMENTCOMMUNITY (SADC) TOWARDS CRITICALAREAS OF MONETARY POLICIES: STATUS ANDWAY FORWARD
SADC as a Economic Region
The Southern African Development Community (SADC) hasbeen in existence since 1980, when it was formed as a loosealliance of nine majority-ruled States in Southern Africaknown as the Southern African Development CoordinationConference (SADCC), with the main aim of coordinatingdevelopment projects in order to lessen economicdependence on the then apartheid South Africa13. Table1.2 shows economic indicators and population and Figure1.1 shows SADC Trade with the Rest of the World: Winningexport sectors and revealed comparative advantage ratios.Regional integration is necessary considering that themajority of countries are small, weak and poor. Integratingthe economies countries in the region can, in theory atleast, help them in dealing with issues of globalisation thatposes serious threat to poor nations. Currently, alreadysome countries in the region are emerging as continental
leaders in terms of macro- economic policies and povertyreduction strategies as well as institutional building. Theseare Botswana, Mauritius, Namibia and South Africa. Interms of economic performance of economic growth,Angola is leading the way with 13.8% growth rate,followed by Mozambique with 8% and Tanzania with6.2%. Improvements in growth rates have also been
witnessed in Lesotho, Namibia and South Africa. FourSADC member states ranked among the top ten in thePublic Index Rankings (PIR), as contained in the GlobalCompetitiveness Report. These were Botswana, which wasranking rst South Africa, Mauritius and Tanzania14.
89

8/15/2019 African Single Currency
http://slidepdf.com/reader/full/african-single-currency 89/192
Map 1.1 Southern African Development Community Countries
Angola
Tanzania
Malawi
Mozambique
Seychelles
Comoros Island
Swaziland
Lesotho
DR Congo
Namibia Madagascar
Mauritius
Botswana
SouthAfrica
Zambia
Zimbabwe
Table 1.2 Economic Indicators and Population
Country Total GDP (Nominal)in 2006 (billion US$)
(a)
GDP per capital in2005 (US$) (b)
PopulationApproximately238.2 (Millions)
HDI in 2005 (c )
Angola 44.03 5,985 14.8 0.733Botswana 10.33 12,057 1.7 0.654D.R. Congo 8.54 264 54.8 0.411Lesotho 1.48 1,415 2.1 0.549Madagascar 5.50 988 17.4 0.533Malawi 2.23 691 11.2 0.437Mauritius 6.45 10,155 1.2 0.804
Mozambique 7.61 743 19.2 0.384Namibia 6.37 4,547 1.9 0.650Seychelles 0.75 13,887 0.1 0.43South Africa 254.99 8,477 46.7 0.674Swaziland 2.65 4,384 1.1 0.547Tanzania 12.78 1,018 42.1 0.467Zambia 10.91 1,175 10.7 0.434
Zimbabwe 5.01 538 13.2 0.513Source: SADC Secretariat: Key: (a) Fast economy growth in Africa(b) African growth to expand 6.2% (c) African growth steady butfrail.

8/15/2019 African Single Currency
http://slidepdf.com/reader/full/african-single-currency 90/192
91

8/15/2019 African Single Currency
http://slidepdf.com/reader/full/african-single-currency 91/192
State, and the Response is the open market interventionby the Central Bank. Monetary policy options for SADCCentral Banks over the past 25 years are Ination Targeting,Price Level Targeting, Monetary Aggregates, Fixed ExchangeRate, Gold Standard, and a Mixed Policy. African politicianshave a history of undisciplined application of Monetaryand Fiscal Policy in which case the Central Bank functionsof maintaining the value of the currency has not beenachieved20.
As the primary tool of monetary policy is open marketintervention, the Central Bank requires access to nancialexchanges. In SADC stock exchanges are operating inNamibian, Johannesburg, Mauritius, Tanzania, Botswana,Lesotho, Malawi, Zimbabwe and Zambia. The largest andmost varied of options for share trading is on the JSE(Johannesburg Stock Exchange) which includes derivatives,a bond exchange, and a fully regulated on line tradingsystem, and agricultural commodities21. The South AfricaReserve Bank operates in the money market via regulatoryrequirements for overnight deposits to settle transactionsbetween the private banks22. The SA nancial system
therefore offers size and disciplined monetary policyrequired to craft an optimal SADC monetary policy. TheMonetary policy options for these Central Banks are shownin Table 1.3.
92

8/15/2019 African Single Currency
http://slidepdf.com/reader/full/african-single-currency 92/192
Table 1.3: Types of Monetary Policy and Control of the Value of aCurrency
Monetarypolicy types
Policy assumptions, measurements and policy responses Market variable(that is to becontrolled)
Long TermObjectives(desired state)
InationTargeting
This policy assumes that ination is controlled by controlling interestrates; ination is measured from growth in Stats SA indices, e.g. theConsumer Price Index.
Interest rate onovernight debt
Targeted rate ofchange in inationindices
Price LevelTargeting
This policy has the same assumption as ination targeting.Measurement of growth of ination is offset in subsequent yearssuch that over time the price level on aggregate does not move.
Interest rate onovernight debt
Targeted inationrate, e.g., CPI
MonetaryAggregates
This policy assumes economic growth is controlled by growth inthe money supply. Measurement is growth in classes of money(e.g.) and credit, e.g., (M0, M1). In the 1980s, several countriesused an approach In the USA this approach to monetary policywas discontinued with the selection of Alan Greenspan as FederalChairman. This approach is also sometimes called monetarism.
The growth inmoney supplies
Targeted rate ofchange in inationindices, e.g., CPI
FixedExchangeRate
This policy assumes value of a currency is controlled by exchangerate. Measurement is by a selection of currencies. There are varyingdegrees of xed exchange rates, which can be ranked in relation tohow rigid the xed exchange rate is with the anchor nation.
Buying and selling onthe spot market
Targeted value of thecurrency
GoldStandard
This policy assumes the value of a currency is measured by theamount of gold in the reserve bank. Measurement is by the value ofa currency is by the gold bar equivalent of the currencies held by theReserve Bank. Each Reserve Bank has a mass of gold bars that setthe value. Control is by daily buying and selling of base currencies.(i.e. open market operations, cf. above?). The ability to sell goldto support a currency is very important for economic growth andstability.
Amount of gold inthe Reserve Bankand the spot price ofgold in the nationalcurrency
Stable currency valueas measured by thegold price
MixedPolicy
Assumption: All the above policies can apply. Under this policy inpractice, a mixed policy approach is most like “ination targeting”.However some consideration is also given to other goals such as
economic growth, unemployment and asset bubbles. This type ofpolicy was used by the US Federal Reserve in 1998.
Usually interest rates Usuallyunemployment + CPIchange
Note: Statistics South Africa and the South Africa Reserve Bankare Statutory Bodies the heads of which are appointed by the SAPresident. Ref http://www.reservebank.co.za/
The primary tool of monetary policy is open marketintervention. For a Central Bank having a mixed monetarypolicy, each sub-policy is called a regime. For examplea monetary regime, can be controlled in parallel with anexchange rate regime. A xed exchange rate is also called
an exchange rate regime. An exchange rate regime entailsmanaging the quantity of money in circulation through thebuying and selling of various credit instruments, foreigncurrencies or commodities. All of these purchases and salesresult in base currency entering or leaving the nationalmarket. The purpose of monetary policy in the region is toprovide government and their reserve/central bank growthand stability of the economy. Controls are place on thesupply of money, availability of money, and cost of money
93

8/15/2019 African Single Currency
http://slidepdf.com/reader/full/african-single-currency 93/192
or rate of interest. However it is not possible to controlinterest rates if there is no consistent Monetary Policy23. Anunderstanding of monetary theory can provide insight intohow to craft an optimal SADC monetary policy.
Monetary policy can be either an expansion policy, or acontractionary policy. Expansionary policy increases thetotal supply of money in the economy. Contractionarypolicy decreases the total money supply. Expansionarypolicy is traditionally used to combat unemployment in arecession by lowering interest rates, while contractionarypolicy involves raising interest rates in order to combatination. The monetary policy is contrasted with scalpolicy, which refers to governments borrowing, spendingand taxation. Therefore, monetary policy rests on therelationship between the rates of interest in an economy,that is the price at which money can be borrowed, and thetotal supply of money.
Monetary policy uses a variety of tools to control oneor both of these, to inuence outcomes like economicgrowth, ination, exchange rates with other currenciesand unemployment. Despite political agreement on thestrategies and policies of employment creation in thedevelopment strategies in the region, monetary policies havenot followed e.g. options which promote fully employmentfor its people. About 55.0% of all people employed are notearning enough to lift themselves and families above theUS$1 a day poverty line24. The general conclusion that canbe drawn from SADC statistics and reports is that by theyear 2015 the region will have a total population of almost
278 million people with an estimated available labour forceof 44.0% of the population. The assumptions behind anemployment friendly policy is that increases in the size ofthe money supply, and decreases in the interest rate, reducebarriers to economic activity and make it easier for labourto sell its skills.
Although there is universal agreement in SADC treasuriesthat sound Monetary Policy is required25. Many or most
countries in SADC have had problems establishing aneffective operating monetary policy. The primary reason isdeep government debt. To reduce debt government musthave savings. Any option for government to increase savings
requires attractive real interest rates. To control interestrates requires targets for ination, currency exchange ratesfor major currencies, stable ination and high employment.In order to set these targets requires certainty in forecastsof money demand. This is a difculty with underdevelopedmonetary systems. The risk of a mismatch between targetsand outcomes is the unmatched expansion of the monetarybase with the value of the economy. This is complexed withthe focus where increased size of monetary transactionsis followed by increased tax to government activity. If taxrates are too high this reduces economic activity. The cycleof too little or too much currency in circulation results inunstable currencies. Despite frequent claims to credibility ofcentral banks, e.g., in search of prestige and lower interestborrowing rates for national development programmesthe meaning of the term credibility is rarely dened. TheWorld Bank/OECD describes the ability to serve the publicinterest as one aspect of credibility. There are approachesfor example, the independence of the governmentexpenditure from International Aid for essential services,degree of independence provided by the constitution andthe independence from factional political appointments.
SADC monetary policy, common monetary union andstabilization of the currencies in SADC might be achievedthrough a common monetary union where economies ofscale provide governments with more options to increaseeconomic activity. Much can be learned from the EuropeanUnion as the Southern African Development Community(SADC) attempts to create a single monetary union forthe region by 2016. It is clear that the Euro’s successfullaunch has stimulated interest in monetary unions in otherregion. But it is sometimes forgotten just how long theroad actually was travelled in Europe. The conditions26 for aSADC common monetary union include reducing inationin all SADC countries to single-digit gures by 2008 and to5% or less by 2012. The budget decit of SADC countrieshas to be 5% or less of gross domestic product by 2008and 3% or less by 2012. This can be compared with actual
performance for 2008. Those governments which do notmeet these targets will to increase their tax base and stopreliance on central bank borrowing to fund decit budgets.With the exception of Zimbabwe and the Democratic
94
R bli f th C It i t d th t i t t i C C A f S th Af i

8/15/2019 African Single Currency
http://slidepdf.com/reader/full/african-single-currency 94/192
Republic of the Congo. It is expected that economic targetswill be met to achieve the proposed timetable.
Towards Common Monetary Union in the Region
Article 44 of the Africa Union Abuja Treaty calls for theharmonisation of economic policies across the Africancontinent and emphasises two important pillars of economicintegration: the promotion of intra-Africa trade and theenhancement of monetary cooperation. The latter is guidedby the African Monetary Co-operation Programme (AMCP),which seeks to operationalise the monetary cooperationmandate of the Abuja Treaty and the Constitutive Act27.Within the SADC region, the movement towards monetaryintegration and eventual union is guided by the Committeeof Central Bank Governors (CCBG) that has pledgedsupport for the AMCP.
The CCBG was established in 1995 with the specicpurpose of achieving closer cooperation and integrationin the area of monetary policy among SADC CentralBanks. The work of the CCBG has contributed to majordevelopments towards regional monetary cooperation suchas signicant progress in the harmonisation of the paymentand clearing systems, the approval of Memoranda ofUnderstanding on Cooperation, Coordination of ExchangeControl Policies in SADC and Cooperation in the area ofInformation and Communication Technology. The CCBGhas also contributed to the coordination of training forcentral bank ofcials in SADC and the creation of a trainingand development forum. As at April 2005, the integration
programme envisaged the establishment of a SADCmonetary union by 201628.
Options for and different types of monetary integration havebeen outlined by Masson and Pattillo (2005) as follows:
i. An informal exchange rate union with separatecurrencies that are xed to one another, whoseparties are xed but only at the margins.
ii. A formal exchange rate union with separatecurrencies, which are xed to one another withzero (or very narrow) margins and a strong degreeof co-ordination amongst central banks. Example
is Common Currency Area of South Africa,Swaziland, Lesotho and Namibia.
iii. A full monetary union with a single currency.iv. A situation where one country adopts the currency
of another country (often called dollarization) anddoes not issue its own currency.v. A currency board, where a country pegs its own
currency to another currency or trade weightedbasket of currencies, with zero margins for parityadjustment. The money supply is limited to thequantity of reserves held in the other currency.
Currently, the African Union is aiming for option numberthree-full monetary union with a single currency. However,SADC may use some of the other options as stepping-stones to full monetary integration.
In discussing movement towards common monetary unionin the SADC other conditions are needed for the monetaryunion to be sustained. In terms of labour markets workersmust be able, eventually, to move to those areas of theunion where their inputs are most productive. This willmaximize growth and prosperity. The growth of laboursupply has too often been seen as a problem and as anobstacle to economic growth. Under a common monetaryunion the importance of the labour market and migrationpolicies for economic development and prosperity whichAU have adopted in different times. What could beachieved in terms of economic is increased. This will requireimplementing policies on employment and migration that
have already been adopted by the AU. It will require theharmonization of the certication of educational and skillsqualication and their acceptance throughout the Union.It also assumes the coming together of labour laws, socialprotection policies etc.
The issue of monetary integration in the region is meant toultimately lead to a monetary union on the whole Africancontinent. There are two approached taken to this. The rst
approach is the top-down continent-wide policy, under theAfrican Union (AU) which is meant to establish a commonmonetary policy and therefore a common central/reservebank. The Association of African Central Banks has been
95
requested by the African Union to work and prepare thespanning the whole African continent from the Cape to

8/15/2019 African Single Currency
http://slidepdf.com/reader/full/african-single-currency 95/192
requested by the African Union to work and prepare theestablishment of African central bank. The second approachis bottom-up from arrangements at regional level underRECs where all ve African regions are expected to work onregional monetary integration. In Southern African region,
SADC is working on a programme to establish a commonreserve/ central bank in the region by 2016 and a commoncurrency by 201829.
One problem the SADC facing is resources. The regionalbodies are under-resourced. The member states are nothappy to give it the powers and resources to use these powersthat they agreed to give when SADC was overhauled in2001. One signicant challenge is that member states alsoparticipate in other regional economic cooperation schemesand regional political and security cooperation schemesthat may compete with or undermine SADC’s aims. Forexample, South Africa, Botswana, Lesotho, Swaziland andNamibia are all members of the Southern African CustomsUnion Customs Union which coordinates external tradetariffs, national taxes such as the Value Added Tax (VAT)and excise duties. SACU has developed elaborate schemesfor collecting duties at the point of entry to the CustomsUnion Area and then allocating these revenues between itsmembers. For countries like Lesotho SACU revenues are acritical component of Budget revenue. Zambia is a part ofthe Common Market for Eastern and Southern Africa andTanzania is a member of the East African Community (EAC).But one positive outcome on the common monetary unionin the region is that on October 22, 2008, SADC joinedwith the Common Market for Eastern and Southern Africaand the East African Community to form the African FreeTrade Zone. The leaders of the three trading blocs agreedto create a single free trade zone, the African Free Tradezone, consisting of 26 countries with a GDP of an estimated$624bn (£382.9bn). It is hoped the African Free Trade Zoneagreement would ease access to markets within the zoneand end problems arising from the fact that several of themember countries belong to multiple economic and tradinggroups. Groups envisioned by Cecil Rhodes and other Britishimperialists in the 1890’s. The African Free Trade Zone aneffective step in the realization of the vision of Cecil Rhodesand the European Imperialist powers, of a rand zone
spanning the whole African continent from the Cape toCairo. The only difference is that the African Free Trade Zoneis the creation of African Countries working for the mutualbenet and development of the continent and its people.In addition to eliminating duplicative membership and the
problem member states also participating in other regionaleconomic cooperation schemes and regional political andsecurity cooperation schemes that may compete with orundermine each other, the African Free Trade Zone furtheraims to strengthen the bloc’s bargaining power whennegotiating international deals. Analysts believe that theAfrican Free Trade Zone agreement will help intra-regionaltrade and boost growth in the Region. It may also haveto be complemented by common monetary policies and,eventually a common currency.
Common Monetary Union Status
In 2004, the combined Gross Domestic Product (GDP)for Southern Africa was approximately $296.4 billion.Individual national economies are structurally diverse andat varying stages of development. South Africa, the region’s
most developed economy, has a GDP of $213.1 billion,which is more than double the combined GDP of theother Southern African countries30. The Southern AfricanDevelopment Community (SADC) may introduce a singleSouthern African currency by 2016, to be managed by asingle central bank. This has already been announced bythe Governors of the central banks in South Africa andLesotho31. The 15-member SADC plans to introduce a freetrade area by 2008, abolishing all tariffs and non-tariffbarriers32. The SADC is one of the most diverse sub-regionsin Africa, both in terms of growth performances and levelof economic development. Some countries, particularly theSouth Africa, Botswana and Mauritius, have a substantialupper and middle income economic sector and enjoyingrelatively high per capita incomes and life styles to match.This reects the strong and robust economic growth ratesrecorded in some of the countries over the past few years.
But, in spite of this positive record, the region also still hasnumerous low-income countries with poorly performingeconomics. South Africa and Mauritius have diversiedsources of growth and are less subject to growth volatility,
96
other countries confronted with signicant macro-economicparticipate Will South Africa be willing to and politically

8/15/2019 African Single Currency
http://slidepdf.com/reader/full/african-single-currency 96/192
other countries confronted with signicant macro-economicand development challenges, including macro-economicstability, scal sustainability and decits, volatility of pricesand poor growth and high and continuing levels of poverty.Even in the ‘powerhouse’ RSA, wealth is still unevenly
spread and large numbers live in disparate circumstances.Nevertheless, the region is one of the most advanced inthe pursuit of economic integration, enjoying graduallyincreasing intra-regional exchange and trade. In addition,the South African rand is consolidating its strong positionas a trading and nancial medium within the region,reecting the penetration of South African nancial andcustomer service companies into many countries. At thesame time, the region is facing tremendous growth andeconomic development challenges, including ination andscal decits that pose serious challenges for monetarypolicy and macro-economic stability. The diversity in termsof growth performance and macro-economic stability,captured by large variance in the level of per capita incomeand slow scal convergence, poses a serious challengefor advancing the objectives of economic and nancialintegration within the region. The introduction of commonmonetary union in the region will improve macro-economicstability by ensuring scal and monetary policy credibility.This is necessary for attraction of investment, whicheventually translates into economic growth and sustainabledevelopment as potential investors would only invest if theyhave full condence that they would get sufcient returnson their investment.
Despite all the enthusiasm, experience from the developmentof a common currency in the European Community suggestthat widespread adoption of a common currency for SADCwill require, above all, that the RSA believes that this will bein its own economic interest. And that the other countriesare willing to subordinate their economic policies to dowhatever is needed to maintain a xed exchange link withthe Rand in whatever manifestation it takes as the regionalunit of account. It took these countries of Europe almosthalf a century to get to this point, and has required theeconomically richest areas to be willing to make massivetransfer payment to help their poorer neighbours to
participate. Will South Africa be willing to and politicallyable to do this in SADC?
What meant by SADC moving towards a common monetaryunion. Common monetary union signies a bloc where onecurrency prevails, and where a single institution, like theUS Federal Reserve System or European Central Bank, isresponsible for controlling the money supply and interestrates policy. There are two distinct forms of monetaryintegration the region can adopt. The rst one will involvexing of exchange rates and the existence of nancingfacilities to ease money and trade adjustments, referredto as a “currency union”. The second form “nancialintegration”, involves the unication of nancial institutionsand markets facilitate free capital mobility. For the monetaryclub to be established, member countries have to acceptthey will operate under common scal rules, particularlythe maintenance of the budget decit within agreed limits.Even after 30 years of membership, signicant economiesin Europe like the United Kingdom have decided they canbenet more from the additional digress of freedom theyhave by staying of the Euro zone.
Economic difculties ahead: The economic obstaclesin the implementing the common monetary union inthe region, is these are similar to those in the EuropeanUnion’s Maastricht Treaty criteria for currency convergence,will prove stringent for the member-state to get through.Participating countries must rst achieve a marked degreeof macro-economic stability. This can be determined bycurbing the size budget decit including foreign grants to
keep within a certain range of GDP. The reserve /centralbank’s decit nancing must be limited to an amountconsistent with a maximum proportion of the previousscal year’s tax revenue. Ination must be kept below atarget rate. Reserves of foreign currency must provideat least six months import cover. The formation of acommon monetary union also will require harmonizationof exchange rate mechanisms, scal and monetary policiesas well as other policies that will affect the overall paceof the economy. Table 1.4 shows SADC countries macro-economic convergence targets.

8/15/2019 African Single Currency
http://slidepdf.com/reader/full/african-single-currency 97/192
98
South Africa, the availability of benets from having andin Zimbabwe and Swaziland will make it difcult to meet

8/15/2019 African Single Currency
http://slidepdf.com/reader/full/african-single-currency 98/192
, y gindependent monetary policy if they were outside thecurrency union would be small. It is unlikely they wouldgain any more freedom.
National autonomy over monetary policy is giving a memberstate the maximum freedom and exibility, through the useof various monetary instruments such as interest rate andreserve requirements, to steer the economy in particulardirection. Member states know that monetary policy is akey instrument of macro-economic management. Memberstates understand the constraints on independent policiesimposed by the processes of a monetary union. These maybe seen as constituting obstacles to achieving the specic
economic goals of member states. SADC member statesare at different stages of development and have differentnancial and economic structures. Such diversity wouldmake it difcult to move positively to establishing a SADCmonetary union in the short time.
The critical question is whether the creation of a commonmonetary union and single currency can be a vehicle forsolving credibility problems that bedevil existing centralbanks. If so, establishing a common monetary union andcentral bank that is more independent and exerts disciplineover scal policies than national central bank do more mayenable it to become and agency of restraint33. Experiencefrom the countries in the existing Common MonetaryArea (CMA) based on the Rand does not suggest that theexistence of monetary union per se is associated with adramatic increase in regional trade and policy coordination.The Southern African region is already dependent onthe South African rand. Lesotho, Namibia and Swazilandalready have tagged their national currencies to the randin a one-to-one exchange rate. Also the currencies ofBotswana, Mozambique, Zambia and Malawi are heavilydependent on the Rand because of South Africa being theirmajor trade partners.
Economic wealth and stability is particularly high in
South Africa, Botswana and Namibia relative to otherSADC countries other than Angola and Mauritius somecountries like Mozambique, Angola and Tanzania areproducing impressive growth rates. The political situation
SADC for membership of a SADC monetary union. Theplan for a single market calls for the abolition of tariffs andnon-tariff barriers by end of this year (2008); a SADC-widecustoms union by 2010; a common market, including free
movement of labour and capital, by 2015; and a singlecurrency and central bank by 201634. A common SouthernAfrican market - following the European Union (EU) model- is to be established by 2016. The SADC block will unitethe markets of Angola, Botswana, Congo Kinshasa (DRC),Lesotho, Malawi, Mauritius, Mozambique, Namibia, SouthAfrica, Swaziland, Tanzania, Zambia and Zimbabwe.Madagascar has joined SADC this year, 2008. Core factorsto control in a SADC regional monetary policy are relativeeconomic growth, ination, budgetary decits, exchangerates, and unemployment. Table 1.5 shows time frame oncommon economic and monetary union in the region andTable 1.6 shows changes in economic growth from 1985and 2008 selected countries.
Table 1.5 Common Economic and Monetary Union in SADC
Target Item Time Frame1 Free Trade area 20082 SADC Customs Union 20103 SADC Common Market 20154 SADC Monetary Union 2016
Source: SADC Committee of Central Bank Governors.
99
Table 2.6: Changes in Economic Growth from 1985 to 2008

8/15/2019 African Single Currency
http://slidepdf.com/reader/full/african-single-currency 99/192
Country GovernmentDebt % ofGDP 1983
Economic Growth% GDP
1970-1981
Ination %1970-1981
GovernmentDebt
% of GDP 2005
Economicgrowth% GDP
2004-2005South Africa - 3.7 12.8 17 5.6Zimbabwe 13.8 1.8 10.1 33 -7.6Malawi 42 5.6 10.3 60 0.4Tanzania 28.3 5.1 11.9 22 5.0
Source: World Development Reports; 1983 and 2007
Regional Common Monetary Union and GlobalisationCapitalist economic theory holds that a completelyliberalized global market is the most efcient way to fostergrowth, because each country specializes in producing thegoods and services in which it has a comparative advantage.Yet, in practice, cutting trade barriers and opening marketsdo not necessarily generate development. The so-calledrich countries and large corporations dominate the globalmarket place and create very unequal relations of powerand information between themselves and Africa. Thepoor countries seldom experience the rising well beingpromised from globalisation but instead have increasingunemployment, poverty, and income inequality.
An additional problem is that free trade is not equally free.A monetary union will be more feasible among regionalcountries with open economies and strong trade linkswith each other. Further more, is a common monetaryunion and single currency in the region is successful itwill promote economic convergence among the memberstates. Currently the regional empirical data suggests thatthe region does not meet all the criteria suggested by theoptimum currency area theory neither is there convergencein most of the economic variables. The process to establisha SADC common monetary union and single currency
will therefore be a long one because of macro-economicconvergence that must established rst.
Financial globalisation has taught us that the use of anindependent monetary policy is severely limited. Withglobalisation, cross-border capital ow is inevitable and thismakes independent monetary policy ineffective especiallyfor small countries in the region. Since that cannot, inany case, effectively implement independent monetarypolicy small countries in the region may be better off witha monetary union. The initiatives for free trade areas;customs unions and common market are designed as aninter-linked strategy in the region for promoting SouthernAfrica as a strong regional block within the global economy.
Increasingly, the globalisation process in terms of integratedmarkets is seen as a mechanism to enhance and promotethe region’s competitiveness with other trading blocksreduced internal trade barriers and free ow of the factorsof production – labour and capital. In the globalised nancialmarket, the feasibility and effectiveness of an independentmonetary policy is questionable, especially for small openeconomies. It can be argued that it is very hard for acountry to simultaneously maintain a xed exchange rateand an open capital market while pursuing an independentmonetary policy geared towards the domestic economy. Acountry can try to opt out of nancial globalisation. Theoutcome may not be desirable.
What is likely to happen is that such a country will beisolated and might become further marginalized in termsof its participation in the world economy. Globalisation isbeing portrayed as good for the world but globalisation hasfundamentally altered the world economy, creating winnersand losers. Reducing inequalities, both within and between
100
countries, and building a more inclusive globalisation ish d l h ll f
and failure has tended to become the ultimate standardf b h d h h d f h k

8/15/2019 African Single Currency
http://slidepdf.com/reader/full/african-single-currency 100/192
the most important development challenge of our time.Globalisation will not benet those countries that are notprepared to take advantage of the new system. Obtaininga fair globalisation is the collective responsibility of many
actors. It requires a convergence of commitment and will.And as always on issue of change and leadership thosewith the greatest power to make things better also havethe greatest responsibility at every level-nationally andinternationally.
SADC is amongst these important change agents. SADCcountries’ increasing interest and momentum for thecreation of a common monetary union and single currency
seems to be led by the pressure for the internal free tradeagreements. It is increasingly being seen as part of thestrategic push to integrate the region. In this regard, thecommon monetary union and single currency are seen asa way of reinforcing regional cohesion and demonstratinga commitment to regional solidarity that started during theSouthern African Development Coordination Conference(SADCC). Ironically, membership of a SADC MonetaryUnion, dominated by the new South Africa, will recreatethe dependency that SADCC countries were trying toescape from. Or, will the new Republic of South Africa(RSA) gracefully step back and agree to decisions made byits neighbours? Will the RSA be will to provide the resourcetransfers to its less developed neighbours that will berequired to mitigate the uneven impacts from economicand monetary integration? If SADC countries are convincedof the benets of monetary integration why are they not
queuing up to join Lesotho, Namibia and Swaziland asmembers of the existing Monetary Agreement? Wouldthey be allowed in if they applied? The SADC regionhas moved from ghting with apartheid South Africa toghting to defend its place in globalisation. To benet froma globalised economy the region must ensure that it hasthe necessary human skills capable of competing effectivelywithin the world economy and institutional arrangementsthat conform to international standards, governance andlegal system must work well. Regional common monetaryunion initiatives should recognize that globalisation hasdeveloped in an ethical vacuum, where market success
of behaviour, and where the attitude of the winner takesall weakens the fabric of communities and societies35. Theleaders of SADC and Southern Africa have a duty to helpll this vacuum.
Globalisation has generated signicant internationalopposition over concerns that it has increased inequality andenvironmental degradation. Advances in communicationand transportation technology, combined with free-market ideology, have given goods, services, and capitalunprecedented mobility. Northern countries want toopen world markets to their goods and take advantageof abundant, cheap labour in the South, policies often
supported by Southern elites36. The proponents of ‘value-free’ localization use international nancial institutionsand regional trade agreements to compel poor countriesof Africa to “integrate” by reducing the import tariffsthat protect their workers, privatising state enterprises,and relaxing environmental and labour standards. Theunfair obstacles to trade and the ecological degradationexperienced by Africa are reinforced by the world’smarketing system, which denies African states higherprices for their agricultural products and minerals, providescompetition for African-produced food-stuffs from heavilysubsidized European and American food exports and limitstheir access to markets in industrialized countries37.
Way Forward
Experience showed that the population in both urban
and rural areas tends to benet from sustained and highrates of growth only if they are given the opportunitiesto build or improve their physical, nancial, and humanassets. Adequate public investment in basic education,heath, sanitation, and physical infrastructure, and a stablemacro-economic environment for saving and investment,contribute greatly to this end. Strengthening co-operationbetween African countries and other developed countries,as appropriate at regional and sub-regional levels, will playan important role in the development efforts of Africancountries under African Union. The successful nations in thetwenty-rst century will be those who are willing to take

8/15/2019 African Single Currency
http://slidepdf.com/reader/full/african-single-currency 101/192
102
REFERENCES Masson, Paul, and Catherine Pattillo. (2002). MonetaryUnion in West Africa: An Agency of Restraint for Fiscal

8/15/2019 African Single Currency
http://slidepdf.com/reader/full/african-single-currency 102/192
African Economic Outlook 2008.Africa Development Bank, African Development Reports2007.
Berger Peter (1997). Four Faces of Global Culture. TheNational Interest, Fall.B.M. Friedman: (2001) Monetary Policy: InternationalEncyclopedia of the Social and Behavioral Science.Debrun, Xavier, Paul Masson, and Catharine Pattillo.(2002)” Monetary Unions in West Africa: Who might Gain,who might lose and Why? IMF Working paper 02/226.Washington: International Monetary Fund.Economic Commission for Africa. (2005). Economic Reporton Africa 2005 Addis Ababa.Economic Commission for Africa. (2007). AcceleratingAfrica’s Development Through Diversication 2007 AddisAbaba.Exchange Rates: The Library of Economics and Liberty(March 31, 2006).
Forder, James: (2004). Credibility in Context: Do CentralBankers and Economists Interpret the Term Differently?»(December).Herbst.J (2000) State and Power.International Monetary Fund (2006a) Regional EconomicOutlook: Sub- Saharan Africa, September.Jenkins, C and Thomas, L. (1997) Is Southern AfricaReady for Regional Integration? Centre for Research into
Economics and Finance in Southern Africa. Research PaperNo.10.Jenkins, Carolyn. (2001). “Prospects for Integration inSADC: The Political Economy of Convergence”. Macro-economic Convergence Workshop,( July).Mander Jerry; Goldsmith Edward (1996). The Case AgainstGlobal Economy: And for a Turn Toward Local. SanFrancisco: Sierra Club Books. ISBN 0-87156-865-9.
Maphanyane, E.M. (2000). Rationalisation of regionalIntegration Institutions SADC. Paper prepared for theGlobal Coalition for Africa.
Union in West Africa: An Agency of Restraint for FiscalPolicies? Journal of Africa Economies, Vol.11 (September).Masson, Paul, and Catherine Pattillo. (2004). The MonetaryGeography of Africa. Washington Brookings Institute.Masson, P and Patella, C. (2004). A Single Currency forAfrica? Probably no, but selective expansion monetaryunions could be used to induce countries to improve theirpolicies: Finance and Development. (December).Mattli, Walter. (1999). The Logic of Regional Integration.Cambridge: University Press.Monetary Policy Framework (2006). Bank of England.Mondell, Robert. (1961). “ A Theory of Optimum CurrencyArea” American Economic Review, Vol. 51 (September).Murray Warwick E (2006). Geographies of Globalization.New York: Routledge/Taylor and Francis.Policy Towards Sub-Saharan Africa and Implementation ofthe African Growth and Opportunity Act.”.Stiglitz Joseph (2006). Making Globalization Work. NewYork: W.W .Norton. ISBN 0-393-06122-1.
The Economist: www.economist.com. Different Volumes.The Global Race. (15 June, 1990). Business Week SpecialIssue.The World Bank Group (2004). World DevelopmentIndicators. Washington, DC. 2004.The Benets and Challenges of Globalization: An EconomistIntelligence Unit Executive Summary in Cooperation withEqual Terra and World 50, http//www.equaterra.com/kr/ reseach/the -Benets and-Challenges -of-Globalization-all.aspx.Rostow, W.W. (1990). Theories of Economic Growth fromDavid Hume to the Present. New York: Oxford UniversityPress.US Monetary Policy: Introduction: (2004) Federal Bank ofSan Francisco.SADC: Committee of Central Bank Governors: AnnualReport 2006/2007.SADC: (2008): “Recent Economic Developments and
103
Statistics for SADC Countries”. Committee of Central BankGovernors in SADC (April)

8/15/2019 African Single Currency
http://slidepdf.com/reader/full/african-single-currency 103/192
Governors in SADC. (April).SARB (2008) Introduction to the South African ReserveBank.Sokoler, Meir (2003). The Interaction between Fiscal andMonetary Policy in Israel, BIS Papers No. 20.PP158-159.Segnestam, L. (2002). World Bank Indicators ofEnvironmental and Sustainable Development: Theories andpractical experience. Environmental Economics Series PaperNo 89. The World Bank Environment Department.United Nations Conference on Trade and Development.(2006a) Trade and Development Report, Global Partnershipand National Policies for Development New York andGeneva.http://www.sadcbankers.orgThe World Bank: World Development Report (2006). Equityand Development. Washington, DC.The World Bank: World Development Report (2007):Development and Next Generation. Washington, DC.JSE (2000) Johannesburg Stock Exchange: Company
Overview.UNDP Human Development Report 2007/2008: FightingClimate Change: Human Solidarity in a Divided World”(2007). New York.UNDP Annual Report (2007): Making Globalization Workfor All. New York.Wolf Martin (2004). Why Globalization Works. New Haven:Yale University Press. ISBN 978-0300102529.World Bank. (2006a). World Development Indicators.Washington D.C.World Trade Organization (WTO), (2006). Trade Statisticson Line. Geneva.World Bank (1997). The state in a Changing World, OxfordUniversity Press.Yehoue, E.B. (2005). On the Pattern of Currency Blocksin Africa, IMF Working Paper WP/05/45. WashingtonInternational Monetary Fund.
104
1 http://en.wikipedia.org/wiki/List_of_African_countries_by_population2 http://www.imf.org/external/pubs/ft/fandd/2004/12/pdf/masson.pdf3 Fi d D l D b 2004
It has been suggested that monetary integration in SADC could bebest achieved by other SADC members joining SACU.
10 E i C i i f Af i Af i U i E i R
End Note

8/15/2019 African Single Currency
http://slidepdf.com/reader/full/african-single-currency 104/192
3 Finance and Development December 2004.4 http://www.africasia.com/africanbusiness/ab.php?ID=890&back_
month=575 The gaps and imbalances between countries are vast and growing. In
1960, per capita GDP in the richest 20 countries was 14 times thatin the poorest 20 countries. By 1998 the gap had widened to 34times. Only 24 percent of the world’s total foreign direct investment(FDI) went to developing countries in 1999, down from 38 percentover the period 1993-97. Eighty percent of FDI ows went to onlyten developing countries. Although the share of developing countriesin world trade in manufactured goods rose from 23 percent in1970 to 38 percent in 1997, 80 percent of that increased share wasattributable to just 13 economies. Many countries are marginalisedfrom the world economic system. Economies in transition have lostground. For too many people the world seems full of opportunities
but they do not see how to connect their lives to the opportunitiesavailable. World Employment Report 2001 International LabourOrganisation. Geneva 2001.
6 Making Globalisation Work for All. United Nations DevelopmentProgramme (UNDP) Annual Report 2007.
7 Data from Forbes; GNP of Sub-Saharan Africa was US$315 billion in1999.
8 UN World Economic Situation and Prospects 2007 Updated as of mid2007. As this paper is being written in November 2008. All forecastsfor post 2007 are being hastily rewritten in the light on the massivenancial meltdown of nancial systems throughout the world. It isironic that commentators as suggesting that, because of its poornancial and trade linkages with the rest of the world, sub-SaharanAfrica best placed to avoid the contagion as it spreads. However, itwill not avoid the effects of the predicted rapid slowdown of worldeconomic growth, which is already sending the price of African rawmaterial exports plummeting (except precious metals, so far)
9 Building blocks for Monetary Union:Arab Monetary Union (AMU)members: Algeria, Libya, Mauritania, Morocco, and Tunisia.Common Market for Eastern and Southern Africa (COMESA)members: Angola, Burundi, Comoros, Democratic Republic ofCongo, Djibouti, Egypt, Eritrea, Kenya, Madagascar, Malawi,Mauritius, Namibia, Rwanda, Seychelles, Sudan, Swaziland, Uganda,Zambia, and Zimbabwe.Economic Community of Central AfricanStates (ECCS) members: Burundi, Cameron, Central AfricanRepublic, Chad Democratic Republic of Congo, Equatorial Guinea,Gabon, Rwanda, and Sao Tome and Principe.Economic Communityof West Africa States members: Benin, Burkina Faso, Cape Verde,cote d’Ivoire, The Gambia, Ghana, Guinea-Bissau, Liberia, Mali,Niger, Nigeria, Senegal, Sierra Leone, and Togo.Southern AfricanDevelopment Community (SADC) members : Angola, Botswana,Democratic Republic of Congo, Lesotho, Malawi, Mauritius,
Mozambique, Namibia, Seychelles, South Africa, Swaziland, Tanzania,Zambia, and Zimbabwe. Within SADC South Africa, Lesotho,Swaziland and Namibia already constitute the Southern AfricanCurrency Union (SACU), the longest existing such Union in the world.
10 Economic Commission for Africa- African Union: Economic Reporton Africa 2007: Accelerating Africa’s Development ThroughDiversication. Addis Ababa.
11 Note: Developed counties, especially the United States, faces thechallenge of rising current account, government, and private sectordecits which threaten domestic economic recovery as well asglobal nancial stability. The US current account decit has risensystematically since 1990s. reaching 6.6 percent of GDP in 2006.Meanwhile, its budget balance has moved from surplus in 2000 (1.9percent of GDP) to a deepening decit that stood at 2.5 percent ofGDP in 2006. Moreover, the US private sector position continues todeteriorate due to insufcient savings partly driven by the easy creditthat fuel consumption. Economic Commission for Africa/AfricanUnion: Economic Report on Africa 2007. Addis Ababa.
12 Note: The level of saving in Africa has been historically less than
20.0% of GDP, which is considerably below the average of East Asiaand the Pacic (35.0%), Latin America and the Caribbean (21.0%)and Middle East and North Africa (26.0%). Five countries, Algeria,Botswana, republic of Congo, Gabon and Nigeria, have reached asavings ratio of more than 30.0%. Their key challenge facing thesecountries is how to translate these high savings into productiveinvestment, especially in non-oil and non-mineral activities, to achievesustained economic growth. Other African governments need tofocus efforts on mobilizing both public and private savings. EconomicCommission for Africa/African Union: Economic Report on Africa2007. Addis Ababa.
13 http://www.sadcreview.com/sadc/frsadc.htm14 SADC 2005.15 http://www.sadcreview.com/sadc/frsadc.htm16 Economic Commission for Africa- African Union: Economic Report
on Africa 2007: Accelerating Africa’s Development ThroughDiversication. Addis Ababa.Note: Brent oil futures dropped to a 22month low on 13Novemeber as evidence strengthened that a globalrecession would have deep effect on demand. As this paper is beingwritten in November 2008 London Brent crude fell 7c to US$52.30.US crude futures were 19c rmer at US$56.35.Oil has lost more than60% of its value since hitting a peak of more than US$147 a barrel inJuly 2008. Business Day South Africa.14 November 2008.
17 World Bank 1997.18 Segnestan, 2002.19 World Bank 1997.20 Herbst, 2000.21 JSE, 2008.22 SARB, 200823 World Bank 2002.24 ILO Global Employment Trends 2005.25 Committee of Central Bank Governors in SADC.
26 http://www.mg.co.za/article/2005-07-12-sadc-has-much-to-learn-about-monetary-union.27 http://www.campaicms.nl/les/articles/treasury_211.pdf28 SADC Secretariat 2008.
105
29 SADC Secretariat 2008.30 SADC 2005.31 http://www afrol com/articles/15869

8/15/2019 African Single Currency
http://slidepdf.com/reader/full/african-single-currency 105/192
31 http://www.afrol.com/articles/1586932 http://www.afrol.com/articles/1586933 Note: These are words of Paul Collier who worked on wide range of
economic topics concerned with African Development.34 http://www.afrol.com/articles/1586935 Thomas L. Friedman “examines the impact of the ‘attening’
of the globe”, and argues that globalised trade, outsourcing,supply chaining, and political forces have changed the worldpermanently, for both better and worse. He also urges that the paceof globalisation is quickening and will continue to have a growingimpact on business organization and practice. See: Friedman, ThomasL. “The Dell Theory of Conict Prevention.” Emerging: A Reader. Ed.Barclay Barrios. Boston: Bedford, St Martins, 2008.49.
36 http://www.globalpolicy.org/globaliz/econ/index.htm37 The World Bank Report: Global Economic Prospects 2004 said the
liberation would shift agricultural production from the so-calledNorth to developing countries, and boost world prices for manycommodities. For example, the price of rice in world markets wouldrise by as much as 90 % while those for cotton, dairy products,groundnuts and sugar would rise by10%-40%. It is said theEuropean Union is spending around US$100.0 billion a year on directbudget subsidies to producers, depressing world market prices insugar, dairy and wheat. One of the biggest culprits is the US, whichspends US$50 billion annually on direct support to its agriculturesector alone. Its annual cotton subsidy expenditure of US$ 3 billion isthree times its foreign aid to Africa. The South Africa Sunday TimesBusiness Times September 7, 2003.38 As this paper is being written Germany had entered its worstrecession in 12 years, the Organisation for Economic Co-operationand Development (OECD) forecasting global slump and aboutturn on the $700bn US bail out package sent Asian markets into atailspin. Business Day South Africa 14 November 2008.

8/15/2019 African Single Currency
http://slidepdf.com/reader/full/african-single-currency 106/192
LE COMMERCE EXTÉRIEUR DES PAYS DE LACEEAC:
Une Base Fragile pour laMise en Place d’une MonnaieCommunautairePar Prof. Jean-Marie GANKOU et Dr. Dieudonné BONDOMA YOKONO, Université de Yaoundé II

8/15/2019 African Single Currency
http://slidepdf.com/reader/full/african-single-currency 107/192
C on t e n t s
110RESUME ETRECOMMANDATIONS
110DES EXPORTATIONS DOMINEESPAR LES PRODUITS DE BASE,ET UN DEFICIT STRUCTUREL
DES SERVICES
114LES ECHANGESCOMMERCIAUX DES PAYS
DE LA CEEAC: POLARISATIONVERS LES PAYS DEVELOPPES
ET FAIBLESSE DES ECHANGESINTRA-COMMUNAUTAIRES
108
RESUME ET RECOMMANDATIONS
L l id l’ i i é i Af i ’
détérioration continue des termes de l’échange pour lespays de la CEEAC.
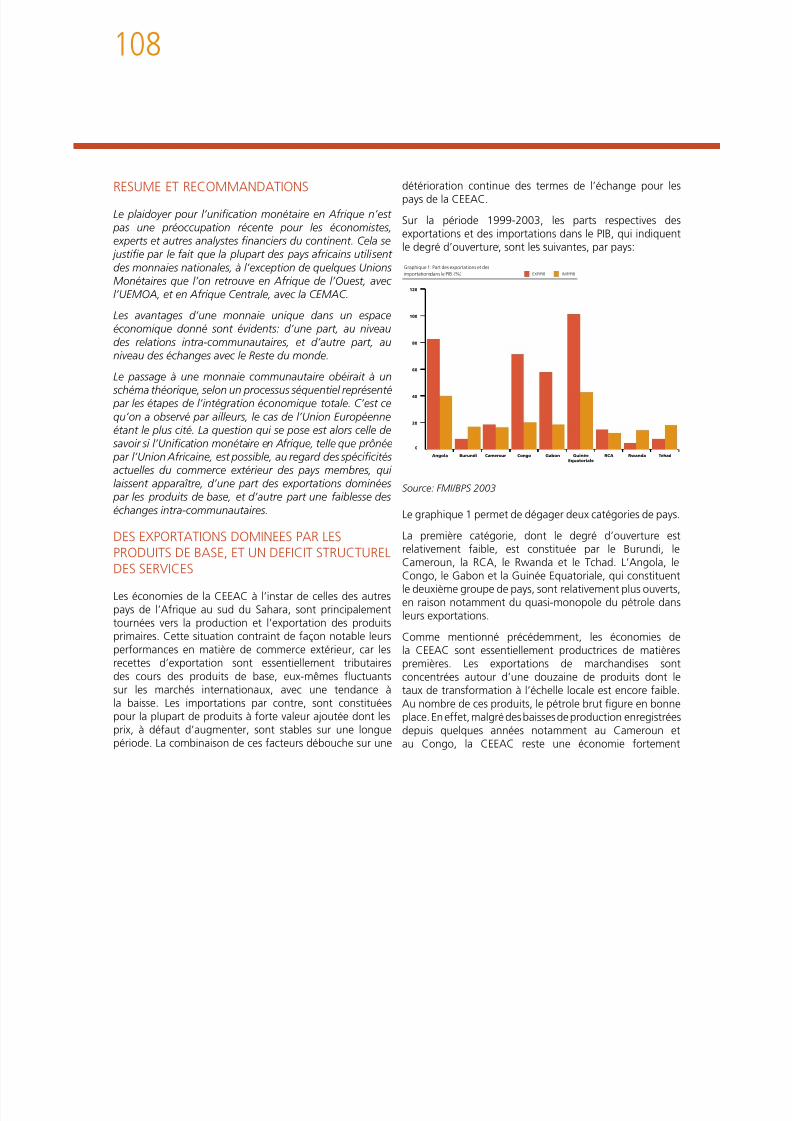
8/15/2019 African Single Currency
http://slidepdf.com/reader/full/african-single-currency 108/192
Le plaidoyer pour l’unication monétaire en Afrique n’est pas une préoccupation récente pour les économistes,experts et autres analystes nanciers du continent. Cela se
justie par le fait que la plupart des pays africains utilisentdes monnaies nationales, à l’exception de quelques UnionsMonétaires que l’on retrouve en Afrique de l’Ouest, avecl’UEMOA, et en Afrique Centrale, avec la CEMAC.
Les avantages d’une monnaie unique dans un espaceéconomique donné sont évidents: d’une part, au niveaudes relations intra-communautaires, et d’autre part, auniveau des échanges avec le Reste du monde.
Le passage à une monnaie communautaire obéirait à un schéma théorique, selon un processus séquentiel représenté par les étapes de l’intégration économique totale. C’est cequ’on a observé par ailleurs, le cas de l’Union Européenneétant le plus cité. La question qui se pose est alors celle de
savoir si l’Unication monétaire en Afrique, telle que prônée par l’Union Africaine, est possible, au regard des spécicitésactuelles du commerce extérieur des pays membres, qui
laissent apparaître, d’une part des exportations dominées par les produits de base, et d’autre part une faiblesse deséchanges intra-communautaires.
DES EXPORTATIONS DOMINEES PAR LESPRODUITS DE BASE, ET UN DEFICIT STRUCTURELDES SERVICES
Les économies de la CEEAC à l’instar de celles des autrespays de l’Afrique au sud du Sahara, sont principalementtournées vers la production et l’exportation des produitsprimaires. Cette situation contraint de façon notable leursperformances en matière de commerce extérieur, car lesrecettes d’exportation sont essentiellement tributairesdes cours des produits de base, eux-mêmes uctuantssur les marchés internationaux, avec une tendance àla baisse. Les importations par contre, sont constituéespour la plupart de produits à forte valeur ajoutée dont lesprix, à défaut d’augmenter, sont stables sur une longuepériode. La combinaison de ces facteurs débouche sur une
Sur la période 1999-2003, les parts respectives desexportations et des importations dans le PIB, qui indiquentle degré d’ouverture, sont les suivantes, par pays:i : i i i l I
0
20
40
60
80
100
120
TehadRwandaRCAGuinéeEquatoriale
GabonCongoCamerounBurundiAngola
Graphique 1: Part des exportations et desimportationsdans le PIB (%) IMP/PIBEXP/PIB
Source: FMI/BPS 2003
Le graphique 1 permet de dégager deux catégories de pays.
La première catégorie, dont le degré d’ouverture estrelativement faible, est constituée par le Burundi, leCameroun, la RCA, le Rwanda et le Tchad. L’Angola, leCongo, le Gabon et la Guinée Equatoriale, qui constituentle deuxième groupe de pays, sont relativement plus ouverts,en raison notamment du quasi-monopole du pétrole dansleurs exportations.
Comme mentionné précédemment, les économies dela CEEAC sont essentiellement productrices de matièrespremières. Les exportations de marchandises sontconcentrées autour d’une douzaine de produits dont letaux de transformation à l’échelle locale est encore faible.Au nombre de ces produits, le pétrole brut gure en bonneplace. En effet, malgré des baisses de production enregistréesdepuis quelques années notamment au Cameroun etau Congo, la CEEAC reste une économie fortement
109
pétrolière. Six des onze Etats membres constituent des paysproducteurs relativement importants. En 2003 par exemple,les activités pétrolières ont représenté en moyenne 40% du
Congo, du Gabon, de la Guinée Equatoriale et de la RCA.A l’opposé, le groupe de pays constitué par le Burundi, leRwanda Sao Tomé et Principe et le Tchad se caractérise par
8/15/2019 African Single Currency
http://slidepdf.com/reader/full/african-single-currency 109/192
les activités pétrolières ont représenté en moyenne 40% duPIB et 69,6% des exportations des pays exportateurs depétrole de la sous-région CEMAC.
Tableau 1: Le pétrole en zone CEMAC
Prod. (mlode tonnes)2002 2003
PIBpétrole/
PIB(%)
2003
% dansExport.
20022003
% dansrec. Fisc.
20022003
Cameroun 5,2 4,9 6 44 40 28 24Congo 11,8 11,2 51 87 86 70 70Gabon 12,6 13,4 42 79 81 60 54GuinéeEquatoriale
11,5 13,3 88 91 92 88 87
Tchad - 1,8 12 0 49 0 0
Source: BEAC, AIE in Rapport Zone Franc 2003
L’Angola produit actuellement 950 000 barils par jour, pourun revenu annuel de 3,2 milliards de dollars qui représenteenviron 80% des revenus de l’Etat.
Les exportations de services sont encore marginales.
Les importations de biens quant à elles sont très diversiéeset concernent les produits semi-nis, les produits nis, lesbiens d’équipement et les produits minéraux.
Une balance commerciale dont l’évolution globale estfortement inuencée par le pétrole
Sur la période 1999-2003, la balance commerciale globaledes pays de la zone CEEAC, hormis la RDC dont lesinformations ne sont pas récentes, est excédentaire. Cetexcédent masque cependant quelques différences. Ainsi,de manière un peu plus détaillée, deux grands groupes depays peuvent être identiés. Le premier groupe concerneles pays de la zone dont le commerce est structurellementexcédentaire. Il s’agit de l’Angola, du Cameroun, du
Rwanda, Sao-Tomé et Principe et le Tchad se caractérise parun décit commercial tout le long de la période sous-revue.
Hors pétrole, la balance commerciale des pays de la zonedevrait fortement être affectée à la baisse au regard del’importance de ce produit dans les exportations totales (cf.tableau 1).
110
Tableau 2: Evolution de la Balance commerciale en zone CEEAC(en millions $US)
1999 2000 2001 2002 2003

8/15/2019 African Single Currency
http://slidepdf.com/reader/full/african-single-currency 110/192
1999 2000 2001 2002 2003
Angola 2 047,2 4 881,2 3 355,1 - -Burundi -42,3 -58,8 -69,1 -73,0 -119,3Cameroun 283,1 510,7 65,5 21,8 66,5Congo 1 037,4 2 036,5 1 374,0 1 597,7 1 011,2Gabon 1 588,3 2 522,5 1 766,4 1 825,5 1 240,3Guinée Equatoriale 284,1 744,6 1 001,4 1 905,1 1 002,3RCA 15,2 43,8 31,7 28,8 -5,1RDC - - -274 - -Rwanda -185,4 -154,8 -151,9 -166,1 -Sao-Tomé et Principe -18,0 -22,4 -21,2 -22,9 -Tchad -33,7 -40,2 -239,4 -466,2 -198,8Total 4 975,9 10 463,1 7 112,6 4 650,7 3 116,4
Source: FMI/BPS 2003, Banquedu Burundi 2003
- Données nondisponibles
Les exportations de biens
Les exportations des pays de la CEEAC sont principalementconstituées par les produits de base. Il convient cependantde signaler que quelques produits manufacturés sontaussi exportés. De manière générale, il s’agit de produitspétroliers, de matières précieuses (diamants, or), de métauxet produits du secteur minier (cuivre, cobalt, manganèse,uranium, méthanol, aluminium), du cacao, du café, du thé,du coton, du bois, du tabac, des peaux, du bétail, du sucreet des poissons.
De manière générale, il apparaît que les exportations despays de la CEEAC sont peu diversiées. De plus, elles secaractérisent par la prédominance des produits de base.Aussi, la diversication des produits d’exportation et unplus grand degré de transformation devraient constituerla priorité en matière de politique commerciale, an
de renforcer la contribution du commerce extérieur àl’intégration sous-régionale.
Les importations de biens
La structure des importations de la CEEAC est quasiidentique dans tous les pays membres. Elle peut être éclatéeen grands groupes et principaux produits suivants:
• Produits alimentaires, boissons et tabacs (viandeset abats; poissons, crustacées et mollusques; laitset produits laitiers; farine de froment; tabacs etcigarettes; malts; blés; riz; boissons; préparationsviandes, poissons)
• Produits minéraux (ciment hydraulique, pétrolelampant, fuel-oil, gasoil, essence)
• Produits chimiques (médicaments, savons, produitsde chimie inorganique, produits de chimie organique)
• Papiers et applications (papier, cartons)• Produits de l’industrie textile (coton et tissus coton,
tissus synthétiques, bonneterie, vêtements)• Verrerie et ouvrages en pierre• Métaux et ouvrages en métaux (fer, fonte, acier)
111
• appareils électriques)• Matériel de transport (voitures, camions et tracteurs)
GuinéeEquatoriale
- -551,7 -768,3 -657,6 -565,2
RCA 64 5 83 7 78 3 85 3 43 5

8/15/2019 African Single Currency
http://slidepdf.com/reader/full/african-single-currency 111/192
• Instruments d’optique, photos et sons• Autres produits
Tableau 11: Evolution des importations par pays (en millions de$US)
1999 2000 2001 2002
Angola 3,109,1 3 039,5 3 179,2 ndBurundi 97,3 107,9 108,3 104,0Cameroun 1,317,5 1 626,2 1 863,9 2 070,3Congo 522,7 455,3 681,3 691,1Gabon 910,5 798,1 847,4 1 063,3GuinéeEquatoriale 425,2 515,0 813,5 564,8
RCA 131,1 117,0 107,0 139,1RDC Nd Nd 1 024 ndRwanda 246,9 223,2 245,2 233,3Sao-Tomé 21,9 25,1 24,4 28,0
Tchad 153,2 170,4 377,7 590,0Total 6,935,4 7,077,7 8,247,9 5 483,9
Source: FMI/BPS 2003; nd: non disponible
Un décit structurel de la balance des services
La balance des services non facteurs (transport, assurances,voyages) de la zone CEEAC est structurellement décitaire.Tableau 12: Balance des services (en millions $US)
1999 2000 2001 2002 2003Angola -2,441,6 -2,432,2 -3 315,6 - -Burundi -26,6 -36,7 -31,1 -35,7 -Cameroun -292,3 -357,5 -426,5 -713,7 -297,7
Congo -722,6 -601,8 -708,4 -762,1 -460,2Gabon -586,1 -684,9 -536,5 -744,0 -536,5
RCA -64,5 -83,7 -78,3 -85,3 -43,5RDC - - - - -Rwanda -142,6 -140,8 -123,3 -136,3 -Sao-Tomé -10,9 -12,5 -13,0 -14,2 -Tchad - -189,9 -270,9 -435,5 -266,0Total -4,287,2 -5,091,7 -6,271,9 -3,584,4 -2,169,1
Source: Rapport Zone Franc 2003; IMF/BPS Yearbook 2003
Dans le cas du Burundi par exemple, les exportations de
services sont essentiellement le fait des administrationspubliques tandis que les importations concernent letransport et les voyages. Sur la période 1999-2002, lesservices exportés ont représenté 11% des exportationsde biens; les dépenses de services ont valu 30% desimportations de biens.
Au Cameroun, les ventes de services à l’exportation sontconcentrées sur cinq services représentant 84% des ventes:
les télécommunications, les services juridiques comptableset de gestion en réalisent presque la moitié (47,8%);viennent ensuite les transports qui représentent 25,5%. Lesassurances valent 14,8% de l’ensemble des services.
En ce qui concerne le Congo, le Gabon et la GuinéeEquatoriale, les «autres services» et notamment ceuxdestinés aux entreprises constituent l’essentiel des venteset des dépenses de services avec l’extérieur.
Au Tchad, la facture des services, avec notamment le fret etles «autres services aux entreprises», représente 35% à 40%du coût des biens. L’organisation et la professionnalisationdes fonctions liées au transport, y compris l’assurance, sontd’une impérieuse nécessité.
Au Rwanda, les revenus tirés des services valent 51,4%de ceux tirés des exportations de marchandises. En
importations, les dépenses de services équivalent à 65,4%de celles effectuées pour les marchandises.
112
A Sao Tomé et Principe, la facture des services est le quartde celle des biens.
Malgré l’indisponibilité des informations sur les autres
Graphique 2: Exportations et Importations intra CEEAC par rapportaux échanges mondiaux de la CEEAC (%)

8/15/2019 African Single Currency
http://slidepdf.com/reader/full/african-single-currency 112/192
Malgré l’indisponibilité des informations sur les autrespays de la CEEAC, force est de constater que la chargedes services non facteurs grève encore lourdement le soldecourant de l’ensemble des pays concernés. Cette situationest davantage aggravée par le poids des intérêts sur la detteextérieure.
LES ECHANGES COMMERCIAUX DES PAYSDE LA CEEAC: POLARISATION VERS LES PAYSDEVELOPPES ET FAIBLESSE DES ECHANGESINTRA-COMMUNAUTAIRES
Une polarisation des échanges autour de l’Amérique duNord et de l’Union Européenne
Le commerce des pays de la CEEAC est essentiellementorienté vers les pays développés et notamment vers deuxpôles: l’Amérique du Nord (les Etats-Unis en particulier) etl’Union Européenne. Certains pays asiatiques comme laChine, Taiwan, la Corée du Sud, le Japon, l’Indonésie, l’Indeou les Philippines gurent également parmi les grandspartenaires de la région.
Bien que dans des proportions moindres, l’Afrique horsCEEAC (République d’Afrique du Sud, Kenya, Ouganda,Tanzanie, Zambie, Nigeria et Côte d’Ivoire) est égalementprésente dans ces échanges. Au sein de la sous-région, levolume des produits échangés est encore faible, commel’indique le graphique ci-contre.
0
4000
8000
12000
16000
20000
20001999199819971996
Graphique 2: Exportations et Importations intra CEEAC parrapport aux échanges mondiaux de la CEEAC (%) Export CEEAC-Afrique Export.CEEAC-MondeExport Intra-CEEAC
0%
25%
50%
75%
100%
20001999199819971996
:. Import CEEAC-Afrique Import CEEAC-MondeImport Intra-CEEAC
Source: DOTS-FMI, 2002
En 2003, les exportations totales de la région s’élevaientà 21,2 milliards de dollars US et les importations à 12,2milliards de dollars US, soit une balance commercialeexcédentaire de 9 milliards de dollars US.
L’Angola est le plus grand exportateur et importateur de lazone. Il a contribué pour 40,5% et 36,5% respectivementen exportations et en importations aux échanges mondiauxde la zone.
113
Part dans les exportations de la CEEAC Burundi Rwanda RCACongo
Cameroun Ang ola Sao-Tomé Guinee E quatoria lGabon
1
Toutefois, le commerce intra-régional de la CEEAC connaîtdepuis 1990 une évolution à la hausse. Il a atteint 293millions de dollars US en 2003, contre 200 millions de dollars

8/15/2019 African Single Currency
http://slidepdf.com/reader/full/african-single-currency 113/192
12
12
11
1
1
10
41
17
Burundi Rwanda RCACongo
Cameroun Angola RDC Guinee EquatorialGabon
Part dans les importations de la CEEAC
11
11
9
10
1
3
1
15
38
Source: FMI, DOTS 2004
Une faiblesse des échanges intra-communautaires
Les échanges intra CEEAC demeurent marginaux. En2003 par exemple, les exportations intra-régionales nereprésentaient que 1,4% des exportations mondiales de larégion. Rappelons que cette part n’a pas fondamentalementchangé depuis 1990 (1,2%). Il apparaît que ce commerceest insigniant, par rapport aux performances des entitéscomme la CEDEAO ou le COMESA dont les échanges intra-communautaires oscilleraient entre 10 et 15%.
US en 2000, et 163 millions de dollars US en 1990. Sur labase des données de la Banque Mondiale (UNCOMTRADE),
la contribution par pays à cette évolution est la suivante(en %):
Tableau 13: Contribution par pays au commerce intra-régional
2 0 0 0
2 0 0 1
2 0 0 2
2 0 0 3
M o y e n n e
ExpImp
ExpImp
ExpImp
ExpImp
ExpImp
Angola 2,37,2
3,84,4
2,82,3
2,21,8
2,73,8
Burundi 1,70,6
1,90,4
2,50,5
1,00,0
1,60,3
Cameroun 66,54,0
66,011,4
64,34,3
61,74,1
64,16,1
Congo 7,78,8
6,07,6
8,09,3
18,45,4
11,47,5
Gabon 16,662,1
18,860,3
19,964,2
12,565,4
16,263,0
Guinée Equat. 0,00,0
0,00,0
0,00,0
0,10,0
0,00,0
RCA 1,0
3,4
1,3
2,5
0,9
3,5
1,0
2,4
1,0
2,8RDC 0,7
9,61,28,7
0,94,0
1,78,8
1,28,0
Rwanda 0,00,0
0,30,5
0,10,6
1,40,3
0,60,3
Sao-Tomé et P. 0,11,2
0,01,3
0,11,6 0,1
1,20,11,3
Tchad3,53,2
0,72,9
0,49,7
0,110,8
1,06,7
Source: Calculs effectués à partir des données UNCOMTRADE- etde DOTS Yearbook 2004 , FMI
114
Ce tableau appelle quelques commentaires:• La prédominance de la CEMAC qui à elle seule
réalise en moyenne 91% des exportations intra
8/15/2019 African Single Currency
http://slidepdf.com/reader/full/african-single-currency 114/192
y pCEEAC et 78,7% des importations à l’intérieur dela zone. Au nombre des facteurs pouvant expliquer
cette situation, on peut évoquer l’existence d’unemonnaie commune aux six (6) Etats concernés,l’effectivité de leur Zone de Libre Echange, et lesconits socio-politiques dans les autres Etats (RDC,Rwanda, Burundi et Angola) durant la périoded’analyse;
• La prédominance des exportations du Camerounavec un peu plus de 64% dans le commerce intra-
régional et une certaine homogénéité des niveauxd’importations par pays, si l’on exclut le Gabon entant que plus grand importateur, et des pays commel’Angola, le Burundi, le Rwanda et Sao-Tomé etPrincipe dont les niveaux globaux des échangesdans la zone sont restés timides. Le commerce intrarégional de cette dernière catégorie de pays subitainsi les contrecoups de l’instabilité politique dont ilsont été victimes et de la faiblesse de leurs secteursmanufacturiers.
Il apparaît important que les pays de la CEEAC s’engagentrésolument dans la voie de la construction effective d’unespace économique, ce qui suppose le développement deséchanges entre ces pays. Cette recommandation peut êtreétendue à l’ensemble des pays africains, dans la perspectivede la mise en place d’une monnaie unique en Afrique.
115

8/15/2019 African Single Currency
http://slidepdf.com/reader/full/african-single-currency 115/192

8/15/2019 African Single Currency
http://slidepdf.com/reader/full/african-single-currency 116/192
THE FUTURE OF MONETARY INTEGRATION INSOUTHERN AFRICA:
Lessons from the EuropeanMonetary Union?By Donald L. Sparks and Richard Dutu, Citadel University (USA) and University of Waikato (New Zealand)

8/15/2019 African Single Currency
http://slidepdf.com/reader/full/african-single-currency 117/192
C on t e n t s
130THE EXPERIENCE OF MONETARYINTEGRATION: LESSONS FROM
THE EMU
132CONCLUSIONS
133REFERENCES
137APPENDIX
120EXECUTIVE SUMMARY ANDRECOMMENDATIONS
121INTRODUCTION
122AN ECONOMIC AND
HISTORICAL OVERVIEW OFTHE REGION
125THE POSSIBILITY OF
MONETARY INTEGRATION INSOUTHERN AFRICA
118
EXECUTIVE SUMMARY ANDRECOMMENDATIONS
The states of southern Africa face a dilemma: while
reasons to go with such expansion, there are the risks ofthe poorer performing countries causing problems for thewhole. One might consider, for example, a parallel in theEU where the German Central Bank feared “importing

8/15/2019 African Single Currency
http://slidepdf.com/reader/full/african-single-currency 118/192
The states of southern Africa face a dilemma: whilethe region already sustains a successful and long-
running monetary union, the Common Monetary Area(CMA, known as the “Rand Zone”), the region’s leadingeconomic integration organization, the Southern AfricanDevelopment Community (SADC), is opposed to joining theunion. However, the Common Market for East and Southern
Africa (COMESA), a less successful, but rival economicorganization favors a monetary union. The situation isfurther complicated by the existence of the successful andalso long-lived Southern African Customs Union (SACU)and by the recent Cross Border Initiative (CBI). This paperwill attempt to answer the basic --and indeed important--question: is SADC prepared for joining the CMA?
While several scholars have looked at southern Africanregional integration until recently there has been littleresearch on the specic issue of expanding CMA. There area number of reasons for this. The rst, and most important,is that the region’s dominant player, South Africa, is not infavor of expansion at this time. The second is also somewhat
political: the existing regional organizations are so rivalousthat reaching any sort of agreement is a difcult, timeconsuming and cumbersome process. Third, the smallernon-CMA members might be reluctant to join because ofSouth Africa’s overwhelming economic and commercialdominance. Fourth, there is no general consensus thatSADC is ready for monetary integration. Fifth, the Rand is
not always the region’s strongest currency. Sixth, no statehas yet come forward with a concrete proposal.
In addition to the macroeconomic fundamentals, thereare also important political considerations. First, there isa political reality on the ground that indicates the smallerSADC members are afraid of South African political,economic, commercial, military and strategic hegemony.Perhaps South Africa needs a longer track record of “good
neighbourness” before these concerns are laid to rest. A second aspect is whether South Africa wants to expand theCMA northward. While there are a number of commercial
p gination” from the high ination EU members into therest of the union. Additional analysis needs to be done todetermine whether it would be in South Africa’s interestto push for CMA expansion. Finally, in the light of whathas been done in the Euro zone, southern African countries
should put more in building southern Africa as a single political entity. One way to achieve that goal is to devotemore time and resources in political aspects of economicintegration. One can reasonably conclude that this way ofthinking was one of the major reasons for the successful
building of the Euro.Nonetheless, according to SADC, one of its objectives is to,“develop policies aimed at the progressive elimination ofobstacles to free movement of capital and labour, goodsand services, and of the peoples of the region generallyamong member states.” In addition, the organization may,“develop such other activities as member states may decidein furtherance of the objectives of SADC.” And, the Boardof Central Bank Governors has expressed a desire for aneventual monetary union in the future.
Nonetheless, without a signicant change in the politicaland economic climate in southern Africa, it is unlikely thatSADC will soon join CMA or make its own monetary union.However, in the near term some states, perhaps Botswana,Mauritius or Seychelles, may individually negotiate joining.This paper calls for further study of such individual potentialmembers to estimate the costs and benets of unilateraldecisions to join CMA. In reality, if CMA expands, it will
probably be gradually, one new member at a time.
For the Southern African REC, it is recommended thatinitially the SADC members adopt the rand as a commoncurrency by joining the Common Monetary Area (CMA).This could be done in stages, with the countries with theclosest convergence criteria joining almost immediately,followed by the remaining members by 2015.
After most or all of the members have joined, then the next
119
stage would be to convert the CMA into a true monetaryunion, replacing the South African Reserve Bank with aSouthern African Central Bank.
In the meantime South Africa should encourage the
Figure 1: Souther African Membership in Major RegionalOrganizations
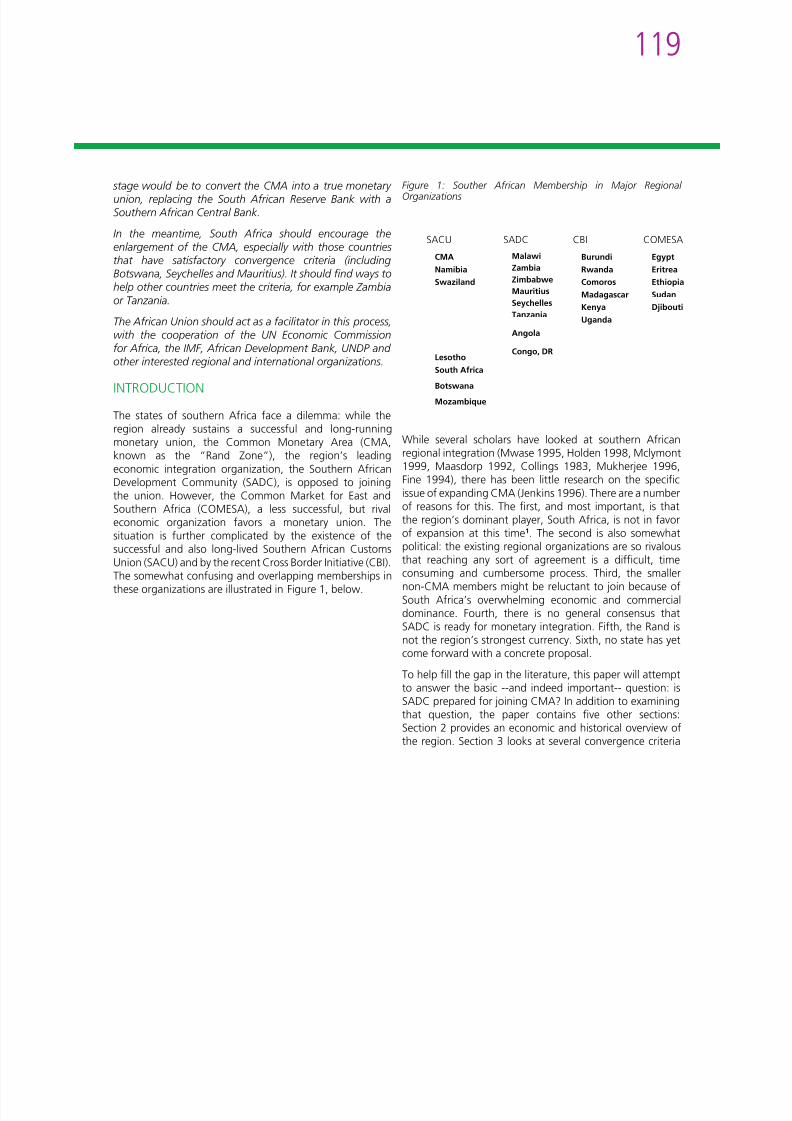
8/15/2019 African Single Currency
http://slidepdf.com/reader/full/african-single-currency 119/192
In the meantime, South Africa should encourage theenlargement of the CMA, especially with those countriesthat have satisfactory convergence criteria (includingBotswana, Seychelles and Mauritius). It should nd ways tohelp other countries meet the criteria, for example Zambiaor Tanzania.
The African Union should act as a facilitator in this process,with the cooperation of the UN Economic Commissionfor Africa, the IMF, African Development Bank, UNDP andother interested regional and international organizations.
INTRODUCTION
The states of southern Africa face a dilemma: while theregion already sustains a successful and long-runningmonetary union, the Common Monetary Area (CMA,known as the “Rand Zone”), the region’s leadingeconomic integration organization, the Southern African
Development Community (SADC), is opposed to joiningthe union. However, the Common Market for East andSouthern Africa (COMESA), a less successful, but rivaleconomic organization favors a monetary union. Thesituation is further complicated by the existence of thesuccessful and also long-lived Southern African CustomsUnion (SACU) and by the recent Cross Border Initiative (CBI).The somewhat confusing and overlapping memberships inthese organizations are illustrated in Figure 1, below.
SACU
CMANamibiaSwaziland
Lesotho
South AfricaBotswana
Mozambique
SADC
MalawiZambiaZimbabweMauritiusSeychellesTanzania
Angola
Congo, DR
CBI
BurundiRwandaComorosMadagascarKenyaUganda
COMESA
EgyptEritreaEthiopiaSudanDjibouti
While several scholars have looked at southern Africanregional integration (Mwase 1995, Holden 1998, Mclymont1999, Maasdorp 1992, Collings 1983, Mukherjee 1996,Fine 1994), there has been little research on the specicissue of expanding CMA (Jenkins 1996). There are a numberof reasons for this. The rst, and most important, is thatthe region’s dominant player, South Africa, is not in favorof expansion at this time1. The second is also somewhatpolitical: the existing regional organizations are so rivalousthat reaching any sort of agreement is a difcult, timeconsuming and cumbersome process. Third, the smallernon-CMA members might be reluctant to join because of
South Africa’s overwhelming economic and commercialdominance. Fourth, there is no general consensus thatSADC is ready for monetary integration. Fifth, the Rand isnot the region’s strongest currency. Sixth, no state has yetcome forward with a concrete proposal.
To help ll the gap in the literature, this paper will attemptto answer the basic --and indeed important-- question: isSADC prepared for joining CMA? In addition to examiningthat question, the paper contains ve other sections:Section 2 provides an economic and historical overview ofthe region. Section 3 looks at several convergence criteria
120
of the nine SADC members (of the 14) which are not inCMA and examines the possibility of them joining. Section4 presents a comparison between the SADC and the EMUconsidering political aspects of economic integration.
l d h
area and 22percent of the population accounts for some73percent of SADC’s total GDP, with $129,094 million ofa SADC total of $178,710 million. South Africa dominatesCMA, comprising 96percent of the area’s GDP. Such poverty
d l l k l k f h

8/15/2019 African Single Currency
http://slidepdf.com/reader/full/african-single-currency 120/192
Section 5 concludes the paper.
AN ECONOMIC AND HISTORICAL OVERVIEW OFTHE REGION
Some economic comparisons
The states of southern Africa are varied in size, both inpopulation and economic terms.2 This paper includes onlythe 14 SADC members as comprising southern Africa.3 The combined population of the area is approximately 187million. The smallest state, Seychelles, has a populationof only 80,000, while largest, the Democratic Republic ofCongo has 48 million. Also, the states are unequally endowedwith natural resources. For example, South Africa, Namibia,Botswana, Congo (DR), and to a lesser degree Zimbabweand Zambia have signicant and important strategicmineral reserves including copper, cobalt, diamonds and
gold, Angola is heavily endowed with petroleum, whileother states, eg. Swaziland, Lesotho and Tanzania have verylittle such natural resources (Europa Publications 2000). Thecountries have differing levels of education, literacy, healthprovisions and other social indicators.
There are two important and fundamental characteristics ofthe SADC region: (1) it is poor; and, (2) South Africa is thedominant economic force. The region’s average GDP per
capita is $1,763 (in current 1997 prices), which places it inone of the lowest such areas in the world. These per capitaGDPs range with a low of $94 in Mozambique to a highof $7,304 in Seychelles. The CMA average is a bit higherthan the SADC average, at $1,825. Growth rates havebeen uneven. The average GDP growth rate for the regionfrom 1989 to 1997 was 3.9percent. The fastest grower,Seychelles, averaged 8.2percent during that time, while theDemocratic Republic of Congo achieved only 0.6percentgrowth over the same period. The sizes of the economiesalso vary dramatically: South Africa, with 13percent of land
and unequal economic power is likely to make furthereconomic integration difcult.
121
Table 1. Selected Economic Indicators for SADC, CMA and South Africa (1997)
Pop (millions) GDP ($m current) GDP Per Capita GDP Growth (annualaverage, 1989-97)
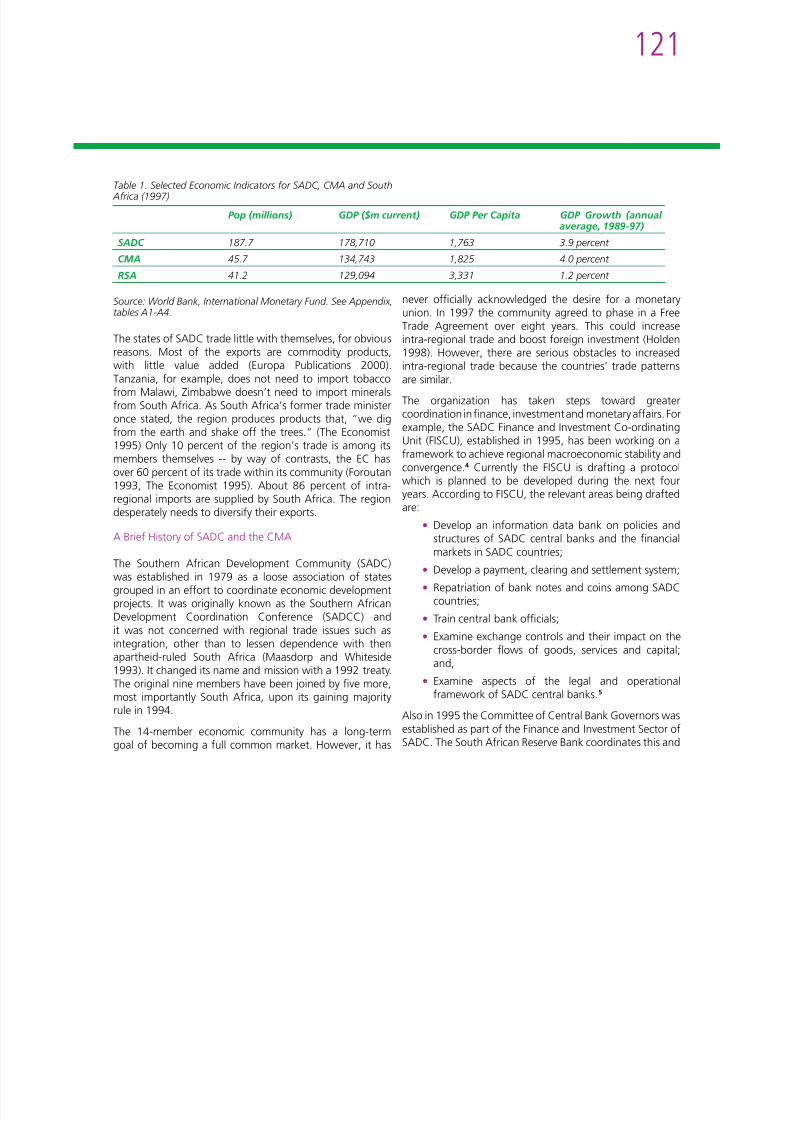
8/15/2019 African Single Currency
http://slidepdf.com/reader/full/african-single-currency 121/192
SADC 187.7 178,710 1,763 3.9 percent
CMA 45.7 134,743 1,825 4.0 percent RSA 41.2 129,094 3,331 1.2 percent
Source: World Bank, International Monetary Fund. See Appendix,tables A1-A4.
The states of SADC trade little with themselves, for obviousreasons. Most of the exports are commodity products,with little value added (Europa Publications 2000).Tanzania, for example, does not need to import tobaccofrom Malawi, Zimbabwe doesn’t need to import mineralsfrom South Africa. As South Africa’s former trade ministeronce stated, the region produces products that, “we digfrom the earth and shake off the trees.” (The Economist1995) Only 10 percent of the region’s trade is among itsmembers themselves -- by way of contrasts, the EC hasover 60 percent of its trade within its community (Foroutan
1993, The Economist 1995). About 86 percent of intra-regional imports are supplied by South Africa. The regiondesperately needs to diversify their exports.
A Brief History of SADC and the CMA
The Southern African Development Community (SADC)was established in 1979 as a loose association of statesgrouped in an effort to coordinate economic developmentprojects. It was originally known as the Southern AfricanDevelopment Coordination Conference (SADCC) andit was not concerned with regional trade issues such asintegration, other than to lessen dependence with thenapartheid-ruled South Africa (Maasdorp and Whiteside1993). It changed its name and mission with a 1992 treaty.The original nine members have been joined by ve more,most importantly South Africa, upon its gaining majority
rule in 1994.The 14-member economic community has a long-termgoal of becoming a full common market. However, it has
never ofcially acknowledged the desire for a monetaryunion. In 1997 the community agreed to phase in a FreeTrade Agreement over eight years. This could increaseintra-regional trade and boost foreign investment (Holden1998). However, there are serious obstacles to increasedintra-regional trade because the countries’ trade patternsare similar.The organization has taken steps toward greatercoordination in nance, investment and monetary affairs. Forexample, the SADC Finance and Investment Co-ordinatingUnit (FISCU), established in 1995, has been working on aframework to achieve regional macroeconomic stability andconvergence.4 Currently the FISCU is drafting a protocolwhich is planned to be developed during the next fouryears. According to FISCU, the relevant areas being draftedare:
• Develop an information data bank on policies andstructures of SADC central banks and the nancialmarkets in SADC countries;
• Develop a payment, clearing and settlement system;• Repatriation of bank notes and coins among SADC
countries;• Train central bank ofcials;• Examine exchange controls and their impact on the
cross-border ows of goods, services and capital;and,
• Examine aspects of the legal and operationalframework of SADC central banks.5
Also in 1995 the Committee of Central Bank Governors wasestablished as part of the Finance and Investment Sector ofSADC. The South African Reserve Bank coordinates this and
122
the Governor of the South African Reserve Bank acts asthe committee’s chairman (SADC 1998). In 1998 the SADCmember states created a Banking Association to establishinternational banking standards and a regional paymentssystem Although not specically mentioned a major
• Share a common pool of foreign exchange reserves,managed by the South African Reserve Bank;
• Apply a common exchange control policy towardsthe outside world;

8/15/2019 African Single Currency
http://slidepdf.com/reader/full/african-single-currency 122/192
system. Although not specically mentioned, a majorcomponent of fuller integration could include a commoncurrency arrangement.6
Thus, while there is a general agreement among SADCmembers that some sort of deeper coordination in nancialand monetary areas is essential, there are neither plans forestablishing a monetary area, nor for joining CMA.
What exactly is the CMA? The Common Monetary Area(CMA, known as the “Rand Zone”) is composed of SouthAfrica, Namibia, Lesotho and Swaziland, all of which areSADC members (Coilins 1983, van der Merwe no date).It is the region’s only currency area. Before independence,Botswana, Lesotho and Swaziland (the B-L-S states) usedthe South African Rand, and there was free movement ofcapital among these states. After independence in 1972,the B-L-S states and South Africa began negotiations forrationalizing the existing system. The Rand MonetaryAgreement came into force in 1974, when Botswana optedout. The Rand Monetary Area was replaced by CMA in1986 with the signing of the Trilateral Monetary Agreement(TMA) between South Africa, Swaziland and Lesotho. Thisagreement gave both Swaziland and Lesotho considerablymore power in determining their respective monetarypolicies, although in reality not much was changed. TheTMA was in turn replaced by the Multilateral MonetaryAgreement in 1992 when Namibia formally joined(although it had been a de facto member as a protectorateadministered by South Africa).
The CMA uses the South African Rand as a commoncurrency, although each member issues its own currency aswell, at par with the Rand. The South African Reserve Bankin effect plays an important --even dominant-- role in themonetary policies of each member (Lundhal and Peterson,1991). The residents of Lesotho, Namibia and Swazilandcan freely access to the South African capital and moneymarkets. There are a number of other important aspectsof the CMA (van der Merwe no date, Maasdorp andWhiteside, 1992). The member states:
• Hold regular consultations to make changes to theagreement,7 and,
• Must permit the repatriation of their notes and coinsissued which may circulate in other countries of theCMA.
• All maintain current accounts with the South AfricanReserve Bank. In addition, Lesotho, Namibia andSwaziland can hold foreign reserves managed bythemselves for their own immediate needs. They canhold up to 35percent of these reserves in currenciesother than the Rand.
One of the most important aspects of the CMA is SouthAfrica’s obligation to compensate Lesotho and Namibia forusing the South African Rand, ie. the loss of seignorage(Fisher 1982). The assumption is that these states couldhave earned an income if the Rand circulating in their areashad been issued by them and had been fully invested inincome-generating assets. Swaziland does not receive suchcompensatory payments, because it “ofcially” suspendedthe use of the Rand as legal tender in 1986, although theRand is widely accepted in Swaziland.
Other Regional Economic Organizations
The other major regional organizations in southern
Africa are: the Southern African Customs Union (SACU),The Common Market for Eastern and Southern Africa(COMSEA), and the Cross Border Initiative (CBI).
The ve member SACU was established in 1910 and is thusone of Africa’s oldest organizations. Like most customsunions, SACU provides for duty free movement of goodswithin the union, and a common tariff rate extended tonon-members. Tariffs are collected by South Africa on
behalf of the members and placed into a common pool.The smaller members receive a share with a 42percentbonus over what they would have received had the tariffsbeen collected by the smaller members themselves. This is
123
designed to compensate those members for a loss of scalpolicy options (Lennart and Peterson 1991). The agreementhas been under negotiation for over ve years (Maasdorp,Robson and Hudson 1995) with the small members wantingeven greater compensation and South Africa pushing for
between SADC and COMESA diverts members fromaccomplishing their goals and instead continues to muddlethe political landscape (World Bank 2000). Finally, the pointmost relevant to this study is that the organization has donelittle –if anything-- to move its goal of monetary union to

8/15/2019 African Single Currency
http://slidepdf.com/reader/full/african-single-currency 123/192
even greater compensation, and South Africa pushing forless (Fagenbaum, Sharer, Thugge and DeZoysa, 1999).Tariff revenues are very important for the smaller members.In 1996 SACU revenue as a share of central governmentrevenues was: Lesotho, 50.6percent; Swaziland, 50percent,Namibia, 30percent; and, Botswana, 16percent. (Holden1998). In addition, the smaller states must accept thereduced tariff rates South Africa has been accomplishingunder GATT and now WTO (Harrold, 1995). The CMA nodoubt facilitates trade between the SACU members.
The twenty two-member organization COMESA wasoriginally begun as the Preferential Trade Area for Eastand Southern African States (PTA) in 1983. As the nameimplies, its goal was to offer preferred tariff rates amongits members. More ambitiously, it had hoped to abolishall tariffs among members by the year 2000. For a varietyof reasons, not least because tariffs contribute such aproportion of member government’s revenues, this goal
has not been met. In 2000 it announced the COMESA FreeTrade Area to be completed by 2002. In 1994 COMESAreplaced the PTA. COMESA has several initiatives thatduplicate or overlap SADC, such as a clearing house forsettling accounts between members. In 1998 PTA beganissuing checks denominated in PTS Units of Accounts. In1990 COMESA declared a goal of establishing a monetaryunion by 2020 (Holden 1998). According to COMESA,its Monetary Harmonisation Programme will… “beimplemented in four phases, from 1991 to 2025, withthe nal phase to culminate in full monetary union whichimplies the use of irrevocable xed exchange rates; a singlecurrency… and the establishment of a common monetaryauthority.” (COMESA 2001). COMESA has not been verysuccessful in reducing tariffs in particular, on in promotingintra-regional trade in general (Rwegasira 1998, Foroutanand Pritchett 1993). It remains unclear if SADC members
will abandon COMESA, although Tanzania already has.And, most importantly, until South Africa joins, the futureof a successful COMESA is unclear at best. Competition
little if anything-- to move its goal of monetary union tofruition.
Finally, the 14 member CBI, established in 1990, is fundedby the World Bank, IMF, EU and AfDB. (Fagenbaum, Sharer,Thugge and DeZoysa, 1999). The goal is to promote tradeand investment in east and southern Africa. According tothe IMF, about one half of the CBI states have either fully orsubstantially implemented nancial sector reforms, essentialin achieving its overall goals. Nonetheless, according toHolden, ”The CBI represents the interesting combinationof unilateral trade liberalisation through the low commonexternal tariff with a lower probability of trade diversionoccurring.” (Holden 1998).
THE POSSIBILITY OF MONETARY INTEGRATIOIN SOUTHERN AFRICA
In discussing options for the region, and specically whetherSADC will join CMA, a preliminary question must be asked:what are the gains of closer monetary coordination? Theanswer to this question depends, of course, on whichcountries or sets of countries are being considered (Kenen1969, Connolly 1982). Clearly, instituting a commoncurrency among geographically related countries could beexpected to reduce the uctuations and uncertainty --andthus costs-- of foreign currency conversions. For small
and open economies, the costs of exible exchange ratesystems can outweigh the advantages (Artis 1991, Emerson1992). Many countries with relatively small economies willpeg their currencies of their main trading partner or –in thecase of Botswana- to a basket of currencies of their maintrading partners. This can promote greater price stabilitythan under a exible exchange rate system. Greater pricestability in turn can lead to long term condence, increasedforeign investment, trade and growth.
In addition to the above, Van der Mewre sites severalspecic and signicant benets accruing to the smaller
124
members of CMA. He suggests:• “they have free access to the South African money
and capital markets;• capital and labour move freely between the countries
nancial markets in South Africa probably outweighs thesedisadvantages. Co-operation and consultation betweenmembers as well as other arrangements have ensured thatoverall control of the rand currency and foreign reserves ofthe area has not been autocratic or centralised.” (Van der

8/15/2019 African Single Currency
http://slidepdf.com/reader/full/african-single-currency 124/192
because there is no exchange control or otherrestrictions;
• no foreign exchange problems arise in the servicingof foreign debt, which facilitates raising loans fordevelopment purposes from non-member countries;
• trade is promoted between member countriesthrough the absence of any exchange risk, paymentrestrictions, inconvenience or additional costs oftransactions; the close relations with South Africahave been to the benet of macro-economic stability;and, the countries concerned have experiencedrelative exchange rate stability, which might havebeen difcult to achieve if an independent exchangerate policy had been pursued.” (Van der Mewre nodate).
The associated question is: what are the costs of monetaryunion? The most obvious answer is loss of autonomy andcontrol over domestic monetary and scal affairs. This hasproven to be a major reason for the UK’s reluctance for
joining the Euro (Schnitzer 1999). The small members ofCMA have surrendered their monetary policy to the SouthAfrican Reserve Bank. Ultimately, the best interests of SouthAfrica may not necessarily always also be in the best interestof CMA. The Reserve Bank is guided by domestic economicstability, most importantly price stability, but also associated
goals, for example lessening unemployment. The smallermembers have little power to inuence policy which wouldhave profound effects over their own destinies. A goodexample of this came in the 1980s when the appreciatingrand had adverse effects on the smaller members (Guma,1985).
The benets generally appear to outweigh the costs. As Vander Mewre suggests, “ Despite the fact that these other
countries have forfeited monetary, exchange rate and scalautonomy by deciding to become members of a monetaryunion, their close relationship with the rand currency and
the area has not been autocratic or centralised. (Van derMewre no date).
There have been a number of studies of the criteria ofoptimal currency areas (OCAs) (Mundell 1961, 1971, Ricci1977, Williamson 1982, Bayoumi 1994, DeGrauwe 1977,Rose 2000, Tower 1976, Giordano 1998). In the 1960’s,OCAs generally included such criteria as similar tax regimes,exible wages, labor and capital mobility, free prices,similar ination rates, degrees of openness and perhapsgeographical proximity (Mundell 1957, 1961, Bertola 1989,Gros 1996). However, the consensus today is that perhapsthe idea may not be so relevant (Tavlas 1993). Indeed,Cohen (1994) examined six cases where the OCA criteriawould have not predicted monetary union. This paperwill not enter this theoretical debate, but will nonethelesslook at some convergence criteria that might be importantfor the SADC region. In other words, are the countriessufciently close in a number of important macroeconomic
fundamentals to make a monetary union viable?While there are numerous potential criteria that are essentialfor the feasibility of a monetary union, this paper will useseven. They are: (1) currency exchange rate uctuations;(2) ination rates; (3) public debt as a percentage ofGDP; (4) foreign economic assistance per capita and (5)as a percentage of GDP; and, (6) importance of trade; (7)interest rates, all based on available data from the pastve years. These criteria were selected because they areprobably the most important ones for an area representingdeveloping nation, and because most of them were used inthe Maastricht Treaty for economic convergence in Europe(Maastricht Treaty, 1991).8 Other important criteria, such asthe size of budget decits cannot be used because of thelack of data.
125
Exchange Rate Fluctuations
Clearly members’ currency rates should show stability overtime. Table 2 below shows the uctuation of potentialmembers’ currency exchange rate uctuations relative to the
is somewhat arbitrary. One could also use an average of the3 best countries considering ination, plus 1.5 percent likein the Maastricht Treaty). The other states’ ination ratesrange from 12 percent to 1,865 percent. It should be noted,however, that ination has been reduced in all states, and

8/15/2019 African Single Currency
http://slidepdf.com/reader/full/african-single-currency 125/192
y gSouth African Rand. The criteria here is that local currencyrates would not uctuate more than a given percentageannually against the Rand over the past ve-year period.If a (arbitrary) 3 percent threshold were established, thenonly Botswana (0.4 percent) and Mauritius (3.0 percent)would “qualify”. If that threshold were raised to 5percent,then Tanzania (5.5 percent) could be added to the list. Thecurrencies of the other states uctuations range from 9.4percent up to 892 percent. Clearly only three states would
meet this convergence criteria.Table 2. Annual Percent Currency Change Against South AfricanRand: 1995-98
1995/6 1996/7 1997/8 1998/9 1995-98(average)
Angola 2,667.7 24.8 120.6 663.3 892.1Botswana 0.6 0.6 -2.8 -1.3 -0.4
Congo (DR) Na Na Na Na NaMalawi -22.1 33.0 72.4 0.6 16.2Mauritius -20.7 19.3 -7.3 -1.8 -3.0Mozambique Na Na Na Na NaSeychelles -20.3 -0.9 -11.4 -6.4 -9.4Tanzania -15.6 0.7 -9.3 14.4 -5.5Zambia 4.6 5.9 35.0 9.0 18.2
Zimbabwe -4.8 72.9 39.0 -5.2 21.5
Source: IMF. IFS Yearbook 2000.
Ination rates
Another important fundamental is annual rate of ination.Table 3 shows ination rates for the potential members
for the past four years. A possible criteria would be thatno country’s ination rate would exceed 10 percent onaverage Only Mauritius and Seychelles met that criteria. (It
, ,seriously reduced in some (e.g., Angola and Congo).
Table 3. Ination (GDP Deator annual percent rates): 1995-98
1995 1996 1997 1998 1995-8(average)
Angola 1,886 5,422 94 61 1,965Botswana 9 12 9 8 59Congo (DR) 466 613 187 15 315
Lesotho 9 9 8 8 8Malawi 90 40 13 23 44Mauritius 5 6 5 6 5Mozambique 52 41 11 4 47Namibia 7 12 8 10 9Seychelles -0 -0 3 2 2South Africa 10 8 8 8 8
Swaziland 19 10 11 9 12Tanzania 29 22 18 19 17Zambia 37 24 26 23 27Zimbabwe 10 27 16 30 20
SADC Average 187 843 29 16 268CMA Average 11 9 6 8 8
Source: World Bank, 2000
External debt as a Percentage of GDP
The level of external debt in an economy is an importantfundamental. Table 4 shows the amount of total debt as apercentage of GDP. The criterion here could be that total
debt should not exceed 100 percent of GDP on averageduring the past ve years. The countries which met thatcriteria are Botswana, Malawi, Mauritius, Seychelles and
126
Zimbabwe. Had the 60 percent external debt Maastrichtcriterion been used, only Mauritius and Seychelles wouldbe qualied.
Table 4. Total External Debt as percentage of GDP: 1995-1998
ODA should not represent more than 10 percent of GDP.The countries which met the per capita criteria are Angola,Congo, Mauritius, Tanzania and Zimbabwe. The countriesmeeting the 10 percent of GDP criteria are Angola,Botswana, Congo, Lesotho, Mauritius, Namibia, Seychelles,

8/15/2019 African Single Currency
http://slidepdf.com/reader/full/african-single-currency 126/192
1995 1996 1997 1998 1995-98(average)
Angola 500.5 273.4 276.6 297.1 336.9Botswana 14.5 12.6 11.7 11.8 12.6Congo (DR) 241.8 249.5 232.3 208.2 232.9Lesotho 53.7 52.5 51.9 64.7 55.7Malawi 141.6 100.7 87.9 137.5 94.4Mauritius 44.4 42.7 59.4 59.6 51.5Mozambique 337.8 283.2 234.6 23.0 269.6Namibia na na na na naSeychelles 34.4 29.9 28.2 36.3 32.2South Africa 70.8 71.6 66.7 68.9 69.5Swaziland 17.4 16.6 25.4 18.7 19.5Tanzania 148.9 125.6 100.9 94.3 117.4Zambia 215.3 229.0 197.4 217.4 210.2Zimbabwe 74.4 60.5 60.3 79.8 68.8
SADC Average 146.3 119.0 108.8 116.7 120.8CMA Average 47.3 46.9 48.0 50.1 48.2
Source: World Bank, Global Development Finance, Country Tables,2000
Foreign economic assistance per capita and as apercentage of GDP
Foreign economic assistance is important in most countriesin the region. Excessive dependence on ofcial developmentassistance (ODA) probably indicates some structuralproblems in an economy. Table 5 shows how importantforeign aid is to each country on a per capita basis. Table6 shows ODA as a percentage of GDP. A possible criteriahere would be that no country should have more than $50per capita in ODA (roughly the SADC average), and that
South Africa, Swaziland and Zimbabwe.
Table 5. Ofcial Development Assistance per capita (US$): 1995-98
1995 1996 1997 1998 1995-98(average)
Angola 38 42 30 28 34.5Botswana 62 50 79 68 64.7Congo (DR) 4 4 3 3 3.5Lesotho 59 53 46 32 47.5Malawi 44 49 34 41 42.0Mauritius 21 17 36 34 19.5Mozambique 67 55 57 61 60.0Namibia 124 119 101 108 113.0Seychelles 171 247 191 294 225.7South Africa 10 9 12 12 10.7Swaziland 62 33 28 31 38.5Tanzania 30 29 30 31 30.0Zambia 226 66 65 36 98.2Zimbabwe 45 33 29 24 32.7SADC Average 69 58 53 58 58.6CMA Average 64 54 47 38 52.4
Table 6. ODA as a percentage of GDP: 1996-1998
1996 1997 1998 1996-98(average)
Angola 6.3 4.6 5.2 5.3Botswana 1.5 2.4 2.2 2.0Congo (DR) 2.8 2.7 2.3 1.9Lesotho 11.0 9.0 7.4 9.1Malawi 20.2 13.5 25.0 19.5Mauritius 0.5 1.1 1.0 0.5
127
Mozambique 31.3 27.9 26.8 28.6Namibia 5.4 4.5 5.3 5.0Seychelles 3.5 2.9 4.0 3.4South Africa 0.3 0.3 0.4 0.3
South Africa 23 25 25 26 24.7Swaziland 83 81 82 101 86.7Tanzania 23 22 18 18 20.2Zambia 38 34 32 29 25.7

8/15/2019 African Single Currency
http://slidepdf.com/reader/full/african-single-currency 127/192
Swaziland 2.6 2.0 2.6 2.4Tanzania 13.5 12.3 11.6 12.4Zambia 18.6 15.6 10.8 15.0Zimbabwe 4.3 3.9 4.4 4.2
Source: OECD Development Assistance Committee. www.oecd.org/dac; World Bank 2000; African Development Indicators 2002.
Importance of TradeThe “openness” of an economy may not be, strictly speaking,an important or necessary convergence criteria. However,it is important for illustrative and comparative purposes.If a country’s exports are relatively low, for example, thiscould point to the lack of need for monetary union. Table7 shows how important trade is to each country. Except forMozambique, exports represent at least 20percent of theGDP in each country. The high is Swaziland, whose exportsequal 86percent of GDP. The SADC and CMA averages arevery close, 40.7 and 47.6, respectively.
Table 7. Exports of Goods and Services as a percentage of GDP:1995-98
1995 1996 1997 1998 1995-98(average)
Angola 69 66 68 52 63.7Botswana 50 54 44 35 38.2Congo (DR) 28 28 24 N.A 26.6Lesotho 21 25 28 27 25.2Malawi 29 23 24 31 26.7Mauritius 60 65 63 63 62.7Mozambique 15 15 13 12 13.7
Namibia 54 56 53 53 54.0Seychelles 53 62 68 70 63.2
Zimbabwe 38 36 38 46 39.5
SADC Average 42 40 41 52 40.7CMA Average 40 47 47 52 47.6
Source: World Bank, 2000
Interest rates
Fluctuations in interest rates can indicate a country’seconomic instability. Table 8 details the wide uctuations inthis area. Over a three year average, these rates uctuatefrom a low of 1 percent in Seychelles to 36 percent inAngola. This section employs nominal interest rates – asopposed to real—interest rates which does not incorporateination, which has already been studied previously (table3). This provides a good picture of the way monetary policyis conducted in these countries. If an arbitrary average ofunder 15 percent were set, only Seychelles, Botswana andMauritius would qualify.
Table 8. Discount Rates: 1996-1998 (percentage)
1996 1997 1998 1996-98(average)
Angola 2.0 48.0 58.0 36.0Botswana 13.0 12.5 12.5 12.6Congo (DR) na na na naLesotho 17.0 15.6 19.5 17.4Malawi 27.0 23.0 43.0 31.0Mauritius 11.8 10.5 17.2 13.1Mozambique na na na naNamibia 17.8 16.0 18.8 17.6Seychelles 1.0 1.0 1.0 1.0
128
South Africa 17.0 16.0 19.3 17.4Swaziland 16.8 15.8 18.0 16.9Tanzania 19.0 16.2 17.6 17.6Zambia 47.0 17.7 na 32.3
in the Euro Zone, with varying tastes and standards of livingthat can trigger economies of scale in production. Whileboth regions have a large scale of specialization, in SADCraw materials and low value-added commodities are thenorm, while, nancial services, agricultural and industrialhigh l dd d g d i th EMU Thi i li ti d

8/15/2019 African Single Currency
http://slidepdf.com/reader/full/african-single-currency 128/192
Zimbabwe 27.0 31.5 39.5 32.6
Source: World Bank, African Development Indicators 2002.
All the above criteria show that most members of theSADC are far from the economic stability that is requiredfor convergence and monetary union. There are too bigdifferences in crucial statistics like ination or nominalinterest rates. However progress has been made, and onecould consider a progressive union between the countriesthat perform good criteria, like Botswana, Tanzania,Mauritius, Namibia or Seychelles, and the CMA members.Besides these economic considerations, it would be usefulto try to draw some lessons from the European experiencein monetary unication.
THE EXPERIENCE OF MONETARY INTEGRATION:
LESSONS FROM THE EMUThe history of the Euro Zone provides important lessonsfor regions trying to establish a monetary union. In thissection we compare some basic economic, geographicaland political features of both the European EconomicCommunity (EEC) and the SADC. We also consider someof their main achievements. As will be seen further, suchcomparison clearly do not speak for an immediate monetaryintegration in South Africa. Beyond this foreseeable result,it appears that the political aspects of economic integrationshould also be taken into account. They have played animportant role in the successful building of the EMU.Economic convergence is not the only criterion to beconsidered.9
Compared economic and geographical features
The SADC and the EMU are populated with a large numberof potential consumers, 187 million in the SADC and 304
high value-added goods in the EMU. This specialization anddivision of labour clearly promotes exchange and overallefciency in production. For southern African countries, theproblem is that its members trade little with themselves dueto small intra-sectorial trade, as well as other infrastructureand logistical impediments. Conversely, intense intra-sectorial trade is a stylized fact of developed countries.
However, the differences are much more numerous. First,there is a strong asymmetry inside the SADC because ofSouth Africa’s dominant position. The size of South Africa’seconomy (73 percent of total SADC’s GDP) is far biggerin proportion than the EMU’s biggest economy, Germany,which represents only 30 percent of EMU’s total GPD. Thisgenerates a desequilibrium between South Africa and theother members. Second, there is the same asymmetry in theGDP per capita. The biggest GDP per capita in the SADC(Seychelles) is 80 times the lowest (Mozambique) whereas
the biggest GDP per capita in the EMU (Luxembourg) is only3 times the lowest (Greece). On top of that, the averageGDP per capita in the SADC is 12 times smaller thanEMU’s average GDP per capita. Third, SADC’s exports aremainly low value added commodities and raw materials.This specialization pattern is far less rewarding than thehigher valued one of the EMU. It might then be difcult tobuild an offensive common budgetary policy. Finally, only10 percent of SADC’s trade is among its members, whilesome 60 percent of the EMU trade is among its members.Transaction costs benets of a single currency would thenbe small (Guillaume and Stasavage, 1999).
The need for political convergence
The idea of a European community goes back a very longtime. It is the search of peace among European nations after
World War II that has denitively ensured its launch (Lafay,1997). According to contemporary statesmen, the mostappropriate way to fulll that goal was to achieve economic
129
prosperity and welfare (Ambrosi & alii 1990). Besides thiseconomic background, there was also a strong will amongpoliticians toward closer political integration. Severalprojects have been managed successfully, like the CommonAgricultural Policy (CAP) and the Euro. However, severalother initiatives have failed (e g European Community of
stabilizing policy. It was the European Monetary Snake in1972, replaced by the European Monetary System (EMS)in 1979. As discussed above, the Rand Zone has beencarrying out this job for southern Africa since 1974. Thebig difference between the two agreements is that the EMSused to apply to every member of the EMS which is not

8/15/2019 African Single Currency
http://slidepdf.com/reader/full/african-single-currency 129/192
other initiatives have failed (e.g., European Community ofDefense). But Europe as a single political entity has alwaysbeen a reference for the fathers of Europe. Considering theEMU experience, are there any political aspects relevant toeconomic integration in southern Africa?
Both economic communities face (or used to face) oneor several alternative competing associations. In Europe,the Stockholm Treaty of the 4th January 1959 created theEuropean Association for Free Trade (EAFT) following GreatBritain’s initiative and gathered Denmark, Norway, Sweden,Switzerland, Austria and Portugal. In southern Africa, asdiscussed above, several entangled communities (COMESA,CBI, SACU) are also contesting the lead for economicintegration, as the EAFT did in Europe. Second, both the EECand the SADC have followed a progressive union towarda fully integrated common market. The rst achievementof the EU was a mere common market for coal and steel,
the European Community for Coal and Steel in 1951. Itwas followed ve years later by the Treaty of Rome (1957)which aimed at: 1) establishing a plan for a generalizedtrade union; 2) a common agricultural policy and market;and, 3) unication of the labour and capital markets. In thesame way, the SADC was rst a loose association of statesgrouped to coordinate economic development projectsand to lessen dependence on South Africa. In 1997 itestablished a free trade agreement including South Africaas a key element. It is now considering deeper monetary andnancial integration. Note that both economic associationsdid not ofcially acknowledge in their rst steps the desireof a monetary union, and this is especially true for Europe.At the beginning of the EEC, monetary independence wasconsidered by many as the last remote and sacred placeof political sovereignty. It was not until the 1970 Werner’sreport that this question put in the European agenda
(Ambrosi et al. 1990). Finally, for Europe as for southernAfrica, the advance toward monetary integration took rstthe form of an agreement establishing an exchange rates
used to apply to every member of the EMS, which is notthe case for the CMA, which includes only 6 states out ofSADC’s 15.
Besides these similar political aspects of economicintegration, several strong differences remain between theEU and the SADC. These differences generally reinforce theunfavourable chances of monetary union in southern Africain the near term. First of all, there is no clear overall commoneconomic policy agenda inside the SADC members. Yet,several specic policies strongly supported the building theEMU. They even appeared to reveal the need for a commonmonetary agreement. This was especially the case for theCommon Agricultural Policy. Here, deciency paymentswere established in order to compensate the uctuationsof the European currencies. A common currency soonappeared to be one way to get rid of this problem. Assoon as 1970, the Werner’s report launched the basis of
a future monetary agreement. In 1989 the Delors reportestablished a more detailed agenda (Ambrosi et al. 1990).The SADC still lacks a plan for economic convergence andcommon economic policies although a lot of efforts havebeen carried over recently to promote nancial integration.Second, a symbolic, yet important point lies in the differentnature of both common currencies. The Euro, former theECU (for European Currency Unit), is a weighted basket ofprevious national currencies (the German Mark, the DutchFlorin, the French Franc, etc) whereas the CMA uses anexisting currency, the South African Rand. Finally, the longterm objectives of the European Union are admittedly moreambitious than the SADC’s. The fathers of Europe werelooking for peace, growth and social progress. The mainobjective of the SADC do not exceed for the time being thecoordination of economic projects and the implementationof free trade. Monetary union generally represents the last
step in the process of economic integration. Monetaryunion goes beyond an economic agreement and is likely tobe better supported by a superior goal.
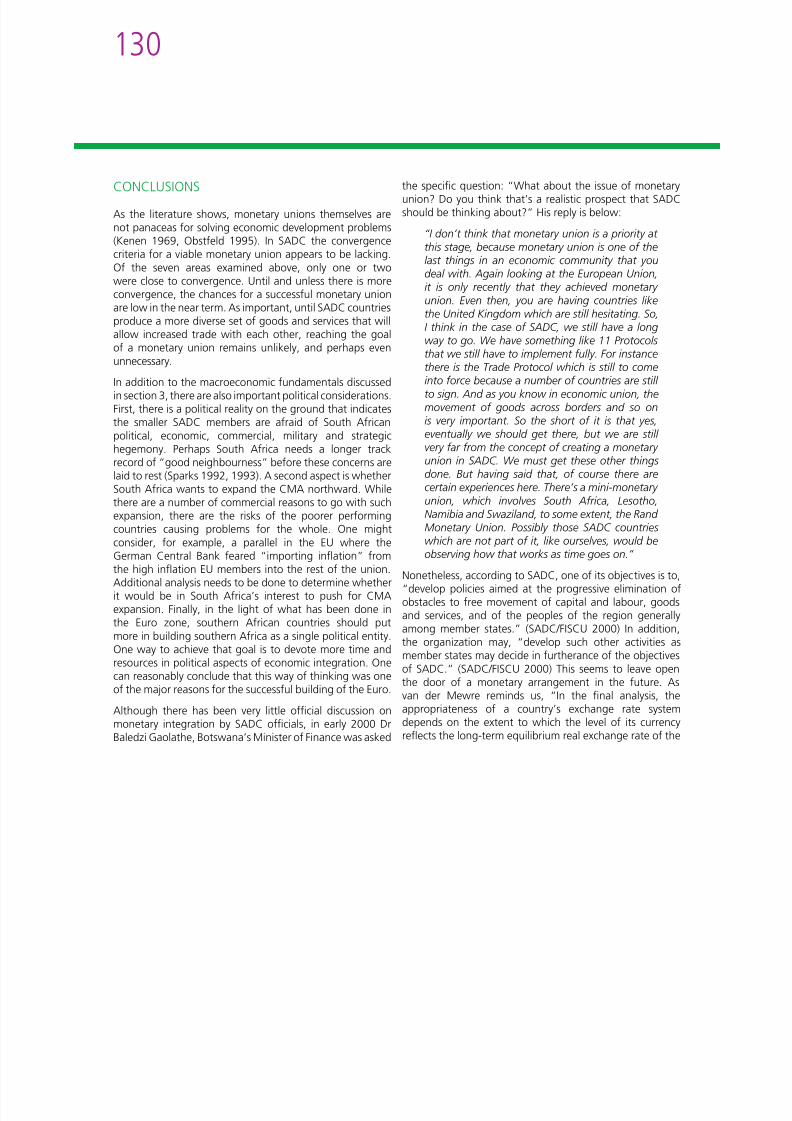
8/15/2019 African Single Currency
http://slidepdf.com/reader/full/african-single-currency 130/192
131
country, i.e. the exchange rate at which internal and externalequilibrium exist in the economy.” (Van der Mewre no date)One could add to that analysis the need to examine theexternal consideration: does an expanded monetary unionin southern Africa make sense?
REFERENCESAmbrosi Ch., Baleste M., Tacel, M.,Economie Contemporaine Tome 2 1960-1989, Delagrave.Artis, M. “One Market, One Money: An Evaluation of thePotential Benets and Costs of Forming an Economic and

8/15/2019 African Single Currency
http://slidepdf.com/reader/full/african-single-currency 131/192
Without a signicant change in the political and economicclimate in southern Africa, it is unlikely that SADC will soon join CMA or make its own monetary union. However, inthe near term some states, perhaps Botswana, Mauritiusor Seychelles, may individually negotiate joining. This papercalls for further study of such individual potential membersto estimate the costs and benets of unilateral decisionsto join CMA. In reality, if CMA expands, it will probably begradually, one new member at a time.
Potential Benets and Costs of Forming an Economic andMonetary Union”,Open Economics Review , 2, 1991.Banque de France, “Principales Comparaisons Entre la ZoneEuro, l’Union Monétaire, les USA et le Japon”, available atwww.banque-france.fr/ Bayoumi, T. “A Formal Model of Optimum Currency Areas”,IMF Staff Papers, 41, 1994.Bayoumi, T. “Operationalising the Theory of Optimum
Currency Areas”, in Baldwin, R, Cohen, D and Sapir, A (eds),Market Integration, Regionalism, and the Global Economy .Cambridge: The Cambridge University Press, 1999.Guillochon, B. Economie Internationale, Dunod, 1993.Brown, M. “Exchange Controls in South Africa”,FPEconomic Research, June 1995.Coilings, D. “The Rand Monetary Area”. InternationalMonetary Fund DM/83/6, February 1983.COMESA.“Monetary and Fiscal Co-Operation in COMESA”,www.comesa.int/ance/econmph.Commission of Inquiry into the Monetary System andMonetary Policy in South Africa:Exchange Rates in South
Africa, (Interim Report), Government Printer, Pretoria, RP112/1978.Connolly, M. “The Choice of an Optimum Currency Peg
for a Small, Open Country”, Journal of International Moneyand Finance, Volume 1, 1982.Commission of Inquiry into the Monetary System andMonetary Policy in South Africa.The Monetary Systemand Monetary Policy in South Africa, Government Printer,Pretoria, RP 70/1984.Cooper, R. “Toward a Common Currency?”,InternationalFinance, 2000.Cukierman, A. Central Bank Strategy, Credibility andIndependence: Theory and Evidence. Cambridge: MIT
132
Press, 1992.De Grauwe, P. The Economics of Monetary Integration.Oxford: Oxford University Press, 1997.Elbadawi, I A. “The Impact of Regional Trade/MonetarySchemes on Intra Sub-Saharan Africa Trade”, AERC
African Economy and International Finance London Schoolof Economics, 1994.Gidlow, R.M. “Forward Exchange Policy in South Africa:Guidelines for Reform”,The South African Journal ofEconomics, Vol. 53, No. 3, September 1985.

8/15/2019 African Single Currency
http://slidepdf.com/reader/full/african-single-currency 132/192
Research Workshop (Harare, Zimbabwe), 1995.Eichengreen, B.International Monetary Arrangements forthe 21st Century . Washington, DC: Brookings Institution,1994.Emerson, M, Gros, D, Italianer, A, Pisani-Ferry, J, Reichenbach,H. One Market,One Money: An Evaluation of the PotentialBenets and Costs of Forming an Economic and MonetaryUnion. Oxford: Oxford University Press, 1992.Europa Publications. Africa South of the Sahara 2000.London: Europa Publications 1999.European Community,The Maastricht Treaty , 1991Fajgenbaum, J, R Sharer, K Thugge and H DeZoysa. “TheCross Border Initiative in Eastern and Southern Africa”,International Monetary Fund, 1999.Fine, J and S Yeo. “Regional Integration in Sub-Saharan
Africa: Dead End or a Fresh Start?” AERC Project RegionalIntegration and Trade Liberalization in SSA (Nairobi, Kenya),1994.Fisher, S. “Seigniorage and the Case of a National Money”,
Journal of Political Economy , 90, 1982.Flood, R and P Garber. “Collasping Exchange Rate Regimes:Some Linear Examples”, Journal of International Economics,August 1984.
Foroutan, F and L Pritchett. “Intra-Sub-Saharan Trade: Is ItToo Little?”, Policy Research Working Paper 1225, WorldBank, 1993.Frankel, J and Rose, K, “The Endogeneity of the OptimumCurrency Area Criteria”,NBER Working Paper 5700, 1996.Garber, P and M Taylor. “Sand in the Wheels of ForeignExchange Markets: A Skeptical Note”,Economic Journal ,January 1995.Garner, J. “An Analysis of the Financial Rand Mechanism”,Research Paper No 9, Centre for the Study of the South
Giordano, Francesco and Persaud, Sharda.The PoliticalEconomy of Monetary Union. London: Routledge, 1998.Green, RH and A Seidman.Unity or Poverty: The Economicsof Pan-Africanism. Baltimore: Penguin Press, 1968.Guillaume D., Stasavage D., “Improving Policy Credibility: IsThere a Case for African Monetary Unions?”, CES workingpaper, 1999.Guma, X.P. “The Rand Monetary Area Agreement”,TheSouth African Journal of Economics, Vol. 53, No. 2, June1985.Gros, D. “A Reconsideration of the Optimum CurrencyArea Approach: The Role of External Shocks and LaborMobility”,Center for European Monetary Studies WorkingPapers, 101, 1996.Holden, M. “Economic Integration and Trade Liberalizationin Southern Africa”,World Bank Discussion Paper Number342, 1996.Holden, Merle. “South African Economic Integration”,World Economy , June 1998, volume 21, issue 4.Horwood, C.P.F. “Progress in the Implementation of theNew Exchange Rate System”, Statement in the House ofAssembly, May 1979.The Economist . “Southern Africa Dreams of Unity”. 9/2/95,
p35.International Monetary Fund. “Initiative for PromotingCross-Borrder Trade, Investment, Payments in Eastern andSouthern Africa”. Washington, DC: IMF, SM/94/91, 1994.International Monetary Fund. “The Cross-Border Initiativein Eastern and Southern Africa” SM/96/94. Washington:International Monetary Fund, 1996.International Monetary Fund. “Trade Liberalization inFund-Supported Programs” EBS/97/113 Washington:International Monetary Fund, 1997.
133
International Monetary Fund. International FinancialStatistics Yearbook . Washin-gton, D.C.: InternationalMonetary Fund 2000.International Monetary Fund. “Revenue Implications ofTrade Liberalization” SM/98/254 Washington: InternationalMonetary Fund,1998.
Occasional Papers, Konrad Adenauer Stiftung,Johannesburg, South Africa, 1992.Mukherjee, N and S Robinson. “Southern Africa: EconomicStructure, Trade and Regional Integration”. InternationalFood Policy Research Institute, Washington, DC, 1996.

8/15/2019 African Single Currency
http://slidepdf.com/reader/full/african-single-currency 133/192
Monetary Fund,1998.Ishiyama, Y. “The Theory of Optimum Currency Areas: ASurvey”,IMF Staff Papers, 22, 1975.Jenkins, C and L Thomas. “Is SADC Ready for CloserMonetary Integration?”, Arne Ryde Symposium, Lund,Sweden, 1996.Kahn, B. “Capital Flight and Exchange Controls in SouthAfrica”, Research Paper No. 4, Centre for the Study of the
South African Economy and International Finance LondonSchool of Economics, 1991.Kawai, M. “Optimum Currency Areas”, in Eatwel, J,Milgate, M and Newman, P (eds).The New Palgrave: ADictionary of Economic Theory and Doctrine. New York:Macmillan, 1987.Kenen, P. “The Theory of Optimal Currency Areas: AnEclectic View”. In Mundel, R and A Swoboda, eds,MonetaryProblems of the International Economy . Chicago: Universityof Chicago Press, 1969.Lafay, G.L’euro contre l’Europe, Arléa, 1997McCallum, B. “Theoretical Issues Pertaining to MonetaryUnions”, inNBER Working Papers Series, October 1999.McKinnon, R, “Optimum Currency Areas”, AmericanEconomic Review , 53, 1963.
McLymont, R. “Regional Pact Spurs Trade”, Journal ofCommerce, December 29, 1999.Mehran, H, et al. “Financial Sector Development in Sub-Saharan African Counties”, IMF Occasional Paper Number169, 1998.Meijer, J.H., “Monetary Policies: The Reserve Bank’sExchange Rate Policy”, Address at the GATT Conference,Fourways, 4 October 1994.Maasdorp, G and A Whiteside. “Rethinking EconomicCooperation in Southern Africa: Trade and Investment”,
Mundell, Robert A. “Currency Areas, Volatility andIntervention”, Journal of Policy Modeling 22, 2000.Mundell, Robert A. ”A Theory of Optimum CurrencyAreas”, American Economic Review , 51, 1961.Mundell, Robert A.Monetary Theory: Ination, Interest andGrowth in the World Economy . Pacic Palasades: GoodyearPublishing, 1971.Mwase, Ngila. “Economic Interation for Development inEastern and Southern Africa”,Round Table, October 1995,Issue 336.Nyerere, J. “Problems of East African Co-Operation”, inFreedom and Socialism. Nairobi: Oxford University Press,1968.Obstfeld, M and K Rogoff. “The Mirage of Fixed ExchangeRates”, Journal of Economic Perspectives, Volume 9,Number 4, Fall 1995.Obstfeld, M. and K Rogoff. “Exchange Rate DynamicRedux”, Journal of Political Economy , June 1995, 102.Peterson, T and G Tabellini. “Designing Institutions forMonetary Stability”, Carnage-Rochester Conference Serieson Public Policy, Fall 1993, 39.Ramos, M.: “The Development of the Forward ExchangeMarket in South Africa”, Research Paper No. 3, Centre for
the Study of the South African Economy and InternationalFinance London School of Economics, 1991.Ricci, L. “A Model of an Optimum Currency Area”,IMFWorking Paper WO97, 1997.Rose, A and Engel, C. “Currency Unions and InternationalIntegration”, inNBER Working Papers Series, October 1999.Ross, A.A.: “The South African Forward Exchange Market”,Investment Analysts Journal , October 1980.Rwegasira, DG. “Economic Cooperation and Integration inAfrica: Experiences and the Road Ahead”, Understanding
134
New Orders Between Old Borders Workshop, Cape Town,South Africa, 1998.SADC. “Report by the Subcommittee on Exchange Controlto the Committee of Central Bank Governors in SADC”.Pretoria, South African Reserve Bank, 23 October 1998.
Bankers in South Africa, 28 April 1981.Stals, C.L. “Foreign Exchange Control in South Africa”,Address to the Johannesburg Branch of the EconomicSociety of South Africa, 17 May 1983.Stals, C.L. “The South African Foreign Exchange Market in

8/15/2019 African Single Currency
http://slidepdf.com/reader/full/african-single-currency 134/192
SADC/FISCU.SADC Finance & Investment Sector News:December 1999-February 2000. Internet edition: www.nance.gov.za.Sadeh, T. “Managing a Common Currency: Political andCultural Preferences”, paper presented to Conicts inMonetary Unions , Universitat Gesamthoschschule Kassel,Kassel, Germany, 2001.Schelkle, W. “The Optimum Currency Area Approcah to
European Monetary Integration: A Framework of Debateor Dead End?”, paper presented to Conicts in MonetaryUnions , Universitat Gesamthoschschule Kassel, Kassel,Germany, 2001.Schnitzer, MC.Comparative Economic Systems (8th Edition).Cincinnati: South Western College Publishing, 2000.Sparks, D. “Economic Trends in Africa South of the Sahara,2000”, in Africa South of the Sahara 2001(30th Edition)London: Europa Publications, 2000.Sparks, D. “The Economic Consequences for SouthernAfrica after Apartheid: The Regional Costs and Benets”,in Economic Digest, Quarterly Journal of the Economics
Association of Swaziland,Volume 3, Number 2, June 1992.Sparks, D.South Africa’s Economic Relations with Africa: ACase Study of Malawi . Unpublished PhD Thesis, School ofOriental and African Studies, University of London, 1985.(Available at Senate House Library, University of London.)Sparks, D. “The Peace Dividend: Southern Africa AfterApartheid”, inIndicator South Africa, Volume 10, Number2, Autumn, 1993.Stahl, HM. “Hard Core Tariffs on Intra-SADC Trade andTheir Elimination in the Context of the Implementationof the SADC Trade Protocol”, Trade and Industry PolicySecretariat, Johannesburg, South Africa, 1997.Stals, C.L. “Integration of the Money Market and the Spotand Forward Exchange Market”, Address to the Institute of
Perspective”, Address at a Conference on Foreign Exchange,Johannesburg, 23 May 1985.Tavlas, G. “The ‘New’ Theory of Optimum Currency Areas”,The World Economy , 33, 1993.Tower, E and Willet, T.The Theory of Optimum Currency
Areas and Exchange Rate Flexibility . Princeton: PrincetonUniversity Press, 1976.United Nations. Statistical Yearbook, 1997 . New York:United Nations Publications, 2000.UN/ECA.Treaty for the Establishment of the PreferentialTrade Area for Eastern and Southern Africa (Addis Ababa)1981.UN/ECA. “Exchange Rate Management Policies in Africa:Recent Experience and Prospects”. www.un.org/Depts/eca/ confr/6nmin/experm1.html.
Van der Merwe, E.J.: “Forward Exchange Cover Transactionsof the South African Reserve Bank”,Quarterly Bulletin,South African Reserve Bank, March 1990.Van der Merwe, E.J. “Exchange Rate Management Policiesin South Africa: Recent Experience and Prospects”. Studyprepared for the UN Economic Commission for Africa,(no date) http://www.un.org/Depts/eca/confr/6nmin/ experm2.htm.
Van der Merwe, E.J. and de Clerck, J.N. “Activity in theSouth African Foreign Exchange Market”,QuarterlyBulletin, South African Reserve Bank, September 1990.Van der Merwe, E.J. “Exchange Rates and ExchangeRate Policy in South Africa”, Address to the KäpstädterWirtschaftsrunde, 7 November 1990.Wickham, P.: “The Choice of Exchange Rate Regime inDeveloping Countries”,IMF Staff Papers, Vol. 32, No. 2,June 1985.Williamson, J. “A Survey of the Literature on the Optimal
135
Peg”, Journal of Development Economics, Volume 11,pp.39-61, 1982.World Bank. “Inter-regional Trade in Sub-Saharan Africa”,Trade and Finance Division, Africa Region, Washington, DC,1991.
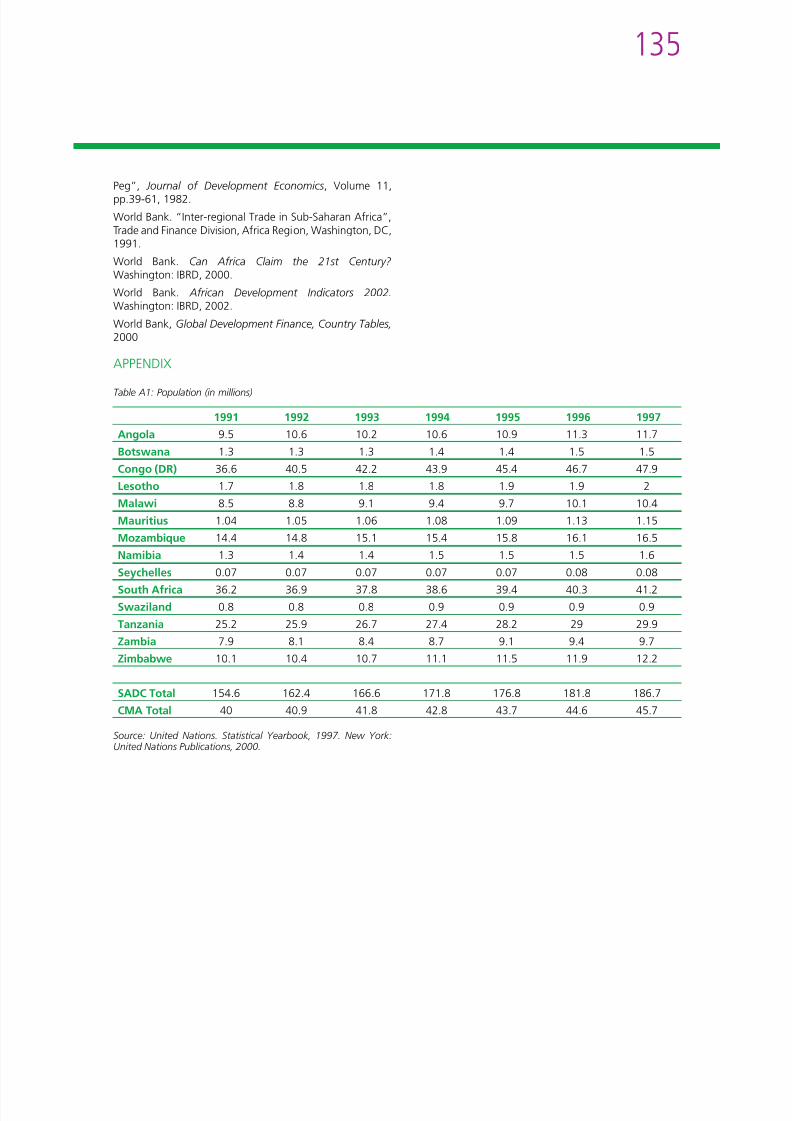
8/15/2019 African Single Currency
http://slidepdf.com/reader/full/african-single-currency 135/192
World Bank. Can Africa Claim the 21st Century? Washington: IBRD, 2000.World Bank. African Development Indicators 2002.Washington: IBRD, 2002.World Bank,Global Development Finance, Country Tables,2000
APPENDIX
Table A1: Population (in millions)
1991 1992 1993 1994 1995 1996 1997Angola 9.5 10.6 10.2 10.6 10.9 11.3 11.7Botswana 1.3 1.3 1.3 1.4 1.4 1.5 1.5Congo (DR) 36.6 40.5 42.2 43.9 45.4 46.7 47.9
Lesotho 1.7 1.8 1.8 1.8 1.9 1.9 2Malawi 8.5 8.8 9.1 9.4 9.7 10.1 10.4Mauritius 1.04 1.05 1.06 1.08 1.09 1.13 1.15Mozambique 14.4 14.8 15.1 15.4 15.8 16.1 16.5Namibia 1.3 1.4 1.4 1.5 1.5 1.5 1.6Seychelles 0.07 0.07 0.07 0.07 0.07 0.08 0.08South Africa 36.2 36.9 37.8 38.6 39.4 40.3 41.2
Swaziland 0.8 0.8 0.8 0.9 0.9 0.9 0.9Tanzania 25.2 25.9 26.7 27.4 28.2 29 29.9Zambia 7.9 8.1 8.4 8.7 9.1 9.4 9.7Zimbabwe 10.1 10.4 10.7 11.1 11.5 11.9 12.2
SADC Total 154.6 162.4 166.6 171.8 176.8 181.8 186.7CMA Total 40 40.9 41.8 42.8 43.7 44.6 45.7
Source: United Nations. Statistical Yearbook, 1997. New York:United Nations Publications, 2000.
136
Table A2: GDP per capita at current prices (in US $)
1992 1993 1994 1995 1996 1997Angola 503 323 328 481 582 663Botswana 2 922 2 693 2 880 3 066 2 918 3 209Congo (DR) 1 247 1 109 698 786 787 702

8/15/2019 African Single Currency
http://slidepdf.com/reader/full/african-single-currency 136/192
Lesotho 367 380 403 442 437 505Malawi 190 209 123 142 225 234Mauritius 2 965 2 938 3 182 3 567 3 827 3 688Mozambique 72 78 74 77 95 94Namibia 2 030 1 836 2 053 2 185 2 026 2 046Seychelles 6 096 6 527 6 643 6 920 6 728 7 304
South Africa 3 385 3 240 3 299 3 566 3 311 3 331Swaziland 1 214 1 200 1 253 1 452 1 366 1 420Tanzania 169 151 155 176 212 245Zambia 435 419 419 427 393 450Zimbabwe 654 624 648 707 781 802SADC Average 1 589.2 1 551.9 1 582.7 1 713.8 1 692 1 763.7CMA Average 1 749 1 664 1 752 1 911.2 1 785 1 825.5
Source: IMF. International Financial Statistics Yearbook.Washington, D.C.: International Monetary Fund 2000.
137
Table A3: GDP at current prices (in US million $)
1992 1993 1994 1995 1996Angola 4 967 3 302 3 473 5 273 6 605Botswana 3 969 3 766 4 140 4 520 4 401Congo (DR) 2 932 2 684 1 736 2 011 2 072

8/15/2019 African Single Currency
http://slidepdf.com/reader/full/african-single-currency 137/192
Lesotho 661 700 759 851 860Malawi 1 818 1 999 1 181 1 369 2 216Mauritius 3 189 3 205 3 510 3 973 4 301Mozambique 1 098 1 248 1 232 1 337 1 710Namibia 2 895 2 689 3 089 3 372 3 207Seychelles 434 469 483 508 499
South Africa 119 833 116 961 121 406 133 610 126 238Swaziland 970 987 1 062 1 267 1 228Tanzania 4 601 4 258 4 511 5 255 6 469Zambia 3 308 3 273 3 347 3 498 3 298Zimbabwe 6 751 6 563 6 925 7 687 8 627
SADC Total 157 426 152 104 156 854 174 531 171 731CMA Total 124 359 121 337 126 316 139 100 131 533
Source: IMF. International Financial Statistics Yearbook.Washington, D.C.: International Monetary Fund 2000.
138
Table A4. GDP Growth Rates (at constant 1991 prices)
1991 1992 1993 1994 1995 1996 1997Angola -1.6 1.2 -21 7.3 10.9 7 6Botswana 8.7 6.3 -0.1 4.1 3.1 7 5.5Congo (DR) -1.9 4.8 -2.8 -5.5 0.9 6 0.9L h 0 7 3 6 3 9 12 9 9 2 12 7 5

8/15/2019 African Single Currency
http://slidepdf.com/reader/full/african-single-currency 138/192
Lesotho 0.7 3.6 3.9 12.9 9.2 12.7 5Malawi 7.2 -8.9 9.6 15.7 4.6 -2.5 5.3Mauritius 4.1 6.2 5.6 3.9 4.7 5.7 5.5Mozambique 1.9 -1.9 17.2 5.7 2 4 3.8Namibia 5.4 7.6 -1.5 6.7 4.9 2.6 4.5Seychelles 2.7 7.2 6.2 -0.8 -0.6 1.9 39.5
South Africa -1 -2.2 1.3 2.7 3.4 3.2 1.7Swaziland 2.6 1.4 3.8 3.6 2.5 3 3.7Tanzania 5.7 1.8 1.2 0.6 3.6 4.2 3.3Zambia -2 -1.8 6.8 -3.5 -2.3 6.5 3.5Zimbabwe 5.5 -9 1.3 6.8 0.1 7.3 3.4SADCAverage
2.7 1.1 2.2 4.3 3.3 4.9 6.5
CMA Average 1.9 2.6 1.8 6.4 5 5.3 3.7
Source: IMF. International Financial Statistics Yearbook.Washington, D.C. 2000.
139
1991 1992 1993 1994 1995 1996 1997Angola -1.6 1.2 -21 7.3 10.9 7 6Botswana 8.7 6.3 -0.1 4.1 3.1 7 5.5Congo (DR) -1.9 4.8 -2.8 -5.5 0.9 6 0.9Lesotho 0.7 3.6 3.9 12.9 9.2 12.7 5
2 8 9 9 6 1 4 6 2 3
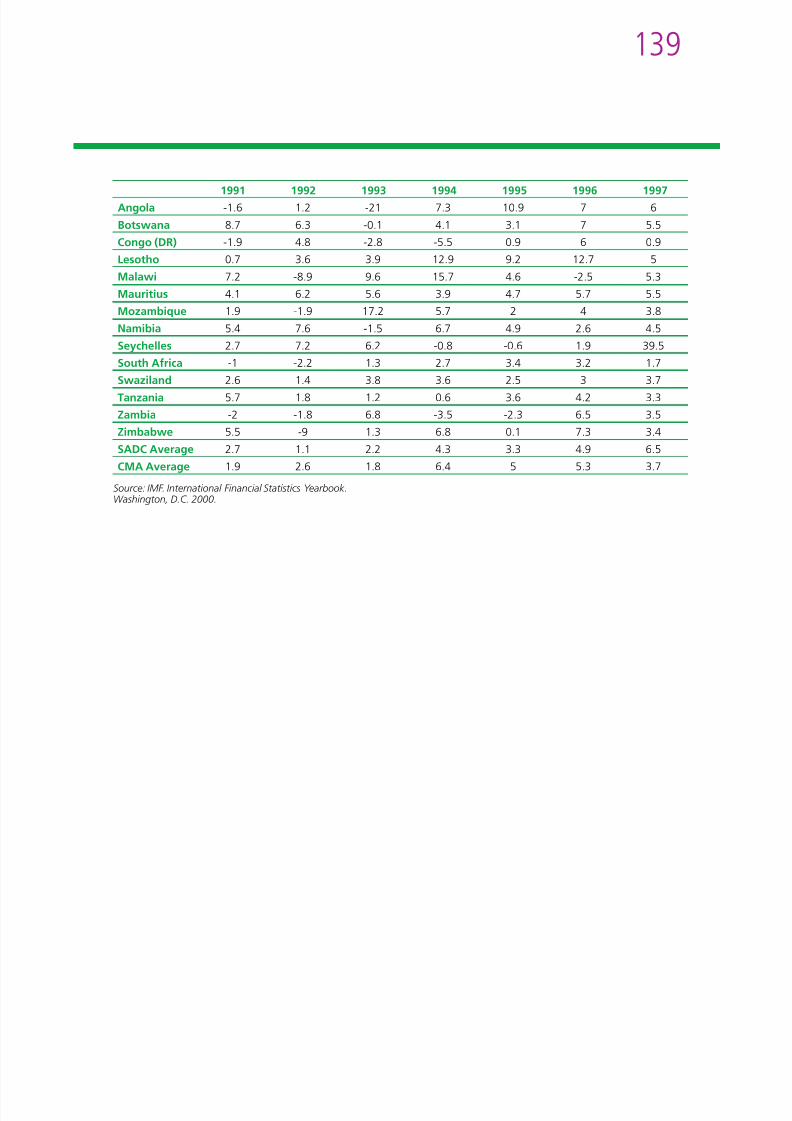
8/15/2019 African Single Currency
http://slidepdf.com/reader/full/african-single-currency 139/192
Malawi 7.2 -8.9 9.6 15.7 4.6 -2.5 5.3Mauritius 4.1 6.2 5.6 3.9 4.7 5.7 5.5Mozambique 1.9 -1.9 17.2 5.7 2 4 3.8Namibia 5.4 7.6 -1.5 6.7 4.9 2.6 4.5Seychelles 2.7 7.2 6.2 -0.8 -0.6 1.9 39.5South Africa -1 -2.2 1.3 2.7 3.4 3.2 1.7
Swaziland 2.6 1.4 3.8 3.6 2.5 3 3.7Tanzania 5.7 1.8 1.2 0.6 3.6 4.2 3.3Zambia -2 -1.8 6.8 -3.5 -2.3 6.5 3.5Zimbabwe 5.5 -9 1.3 6.8 0.1 7.3 3.4SADC Average 2.7 1.1 2.2 4.3 3.3 4.9 6.5CMA Average 1.9 2.6 1.8 6.4 5 5.3 3.7
Source: IMF. International Financial Statistics Yearbook.Washington, D.C. 2000.
140
1 See www.nance.gov.za and summary from a personal communicationwith R Mowatt, SADC Finance and Investment Co-ordinating Unit(FISCU) Republic of South Africa .
2 See Table 1.3 Other states in the area, eg. Madagascar and Comoros, are excluded
since they are not SADC members.4 Personal communications with R Mowatt, FISCU, and www.sadcreview.
com.5 Information provided by the Sector Coordinator, Finance & Investment
End Note

8/15/2019 African Single Currency
http://slidepdf.com/reader/full/african-single-currency 140/192
p y ,Programme, Republic of South Africa.
6 While it is clear that these efforts fall short of developing a monetaryunion, it clearly demonstrates the need for closer monetary policycoordination.
7 The Common Monetary Area Commission convenes at regular intervalsor at the request of any member. A technical committee also meetsevery quarter to solve problems of a technical nature encountered bymembers.
8 The EU, for example, did not have to concern itself with the levels of
ofcial development assistance.9. Most of the statistics used for Europe can be found on the web site ofthe French Central Bank, www.banque-france.fr
141

8/15/2019 African Single Currency
http://slidepdf.com/reader/full/african-single-currency 141/192
8/15/2019 African Single Currency
http://slidepdf.com/reader/full/african-single-currency 142/192
HETEROGENEITY OF MONETARY REGIMES INMAGHREB:
An illustration with national
Taylor rulesBy Aram Belhadj, Laboratoire d’Economie d’Orlean, France

8/15/2019 African Single Currency
http://slidepdf.com/reader/full/african-single-currency 143/192
C o
n t e n t s
160HETEROGENEITY OF THEMAGHREB COUNTRIES: THEOPTIMISATION RESULTS
163CONCLUSION AND POLICYRECOMMENDATIONS
164REFERENCES:
146EXECUTIVE SUMMARY ANDRECOMMENDATIONS
147INTRODUCTION
148MONETARY REGIMES IN
MAGHREB
153ILLUSTRATION OF THE
HETEROGENEITY OFMAGHREB COUNTRIES
144
EXECUTIVE SUMMARY ANDRECOMMENDATIONS
Starting from the idea that the European experience offers several lessons for countries looking to reinforce theirnancial and economic integration, this preliminary workallowed us to highlight the heterogeneity of the Maghrebcountries and the difculties of establishing a common
that the movement towards the creation of a regionalmonetary union presupposes certain conditions thatwould be necessary to ensure the long term success of themonetary integration process.
In this regard, the MC have to:
i. Opt for gradualism. The MC have to continuethe liberalization of their capital accounts and

8/15/2019 African Single Currency
http://slidepdf.com/reader/full/african-single-currency 144/192
countries and the difculties of establishing a commonmonetary policy.
Firstly, we described the characteristics of monetary andexchange rate policies in the three countries and explainedtheir foundations. Our results prove that, although themonetary policies of the MC have similar nal objectives,the operational frames and the monetary instrumentsused for the realization of these objectives differ from onecountry to another. Furthermore, the exchange rate policiesof these countries are led and interpreted differently.
Thereafter, we illustrated this heterogeneity from a simplemodel reecting the characteristics of each country. Thislatter contains an IS equation, a Phillips curve equation andan exchange rate equation. It turned out that the extent ofeconomic policies (monetary and exchange rate policy) onreal variables differs amongst the MC.Finally, we simulated national Taylor rules for each countrywhich describes the behaviour of central banks facing thechallenge of price, activity and exchange rate stability. Ourresults suggest that these central banks will not chooseidentical monetary rules to achieve their stabilizationobjectives. Central Bank of Tunisia (CBT) is inclined to grantmore weight to ination, Bank Al Maghreb (BAM) has to
grant a similar weight to ination, activity and exchangerate, while Bank of Algeria (BA) has to place greateremphasis to activity.
It follows then that the application of a unique monetary policy over the whole zone of the Maghreb would not bebenecial for all countries.
However, even though there is strong heterogeneity, weconsider that the Maghreb can draw numerous lessonsfrom monetary integration experiences. These demonstrate
pdeepen their market-based operations in orderto improve the efciency of the nancial marketsin the allocation of resources. At the same time,they must continue consolidating macroeconomic
stability and adapting macroeconomic frameworksto deal with an increase in the level and volatilityof capital ows.
ii. Deepen national and regional nancialintegration. With this end in view, the MC have tocontinue and further reinforce their efforts towardthe modernization of their national nancial
systems as well as harmonize the infrastructure oftheir domestic nancial markets (harmonizationof payment systems, regulatory and supervisoryframeworks, nancial information, nancialcontracts, technical platform, etc.) Moreover, they
should seek to eliminate nancial barriers to intra-Maghreb trade, by allowing Maghreb banks to setup cross-border branches or subsidiaries.
iii. Accelerate movement toward economicintegration. In this framework, MC have toeliminate trade distortions, press forward withtariff reforms, modernize and extend logistical
chain – including transport infrastructure and joint investments –, as well as harmonize traderegulations, etc.
iv. Promote banking sector competitionand intensify its solidity. The nancial andeconomic integration process will continue to lackdynamism if national bank balance sheets are not
strengthened. To this effect, the authorities of the
MC must reduce non performing loans, ensureadequate loan classication and provisioning,
145
privatize non efcient public banks, strengthencorporate governance in the banking sector, moveto international standards in nancial reportingand auditing and continue upgrading prudentialregulation toward international standards, etc.
v. Improve nancial and budgetary situations. Infact, although some of them underwent signicantprogress towards budgetary stability during
nancial European systems may have led to the idea thatEurope does not constitute a viable monetary zone.
The idea behind this reasoning is that the conduct of aunique monetary policy in the presence of heterogeneityfaces many constraints insofar as the objective ofmonetary stability is hard to achieve in the presence ofthis heterogeneity (for example, one decision may suitth i l ti f t d t b

8/15/2019 African Single Currency
http://slidepdf.com/reader/full/african-single-currency 145/192
progress towards budgetary stability duringthe last decade (notably Tunisia and Morocco),the nancial and budgetary situations remainvulnerable. This vulnerability is the result of budgetbalance sensitivity to terms of trade imbalances, adependence on external ow assistance, as wellas a wide exposure to natural disasters, given the
importance of the agricultural sector. Therefore,the MC have to diversify the production, in particular, through commercial liberalization,modernizing the banking and nancial system, aswell as creating new nancial instruments, etc.
vi. Improve coordination of nancial, monetaryand exchange rate policies. In this vein, centralbanks of the MC have to accelerate their cooperationvia sharing and exchanging information, etc.
vii. Overcome political conicts. In fact, thesecountries have to set in motion a “state rhetoric”calling for «Maghreb solidarity and fraternity » andpushing citizens toward feeling “Maghrebian”.This feeling may constitute a permanent drivingforce toward cooperation and, at the same time, amajor hindrance to future conicts.
All these measures can help the MC improve nominal andreal convergences and become a homogeneous bloc. Theycan also bring the monetary integration process more inline with the economy of these countries.
INTRODUCTION
The launch of the euro has fueled doubts concerningthe constitution of an optimal European monetary zone.Indeed, the differences in legal, institutional and culturalframeworks… as well as the diversity of the productive and
the macroeconomic evolutions of one country and not besuitable for another).
However, even if the partner countries are unanimousconcerning the objectives of the common monetary policy,they face an additional constraint related to the divergenceof monetary transmission mechanisms. Indeed, differentstructures between many economies composing a monetaryzone make their reaction (or their response) to a shockdiverse. Moreover, the speed of price adjustments differsaccording to the extent of this diversity. In addition, thedelays in monetary transmission are long and inconsistent,and expand according to changes in the nancial, economicand institutional environment.
Basically, the common Central Bank can no longer achieve
its objective of price stability for the entire zone given theincreasing complexity of the transmission mechanisms ofmonetary policy.
On the other hand, the absence of political unicationwithin Europe makes the situation more difcult. In fact,in spite of a strong political desire to create the uniqueEuropean currency, the discordance of individual decisions,especially budgetary ones, renders the success of the euro
more problematical. Up to now, the feeling of nationalcitizenship has come before the feeling of being European.
The history of monetary unions shows that the failure ofthe monetary integration process was often due to theabsence of efcient adjustment mechanisms allowing theviability of the monetary zone, especially when it is deeplyheterogeneous. Bordo & Jonung (1999) consider the theoryof optimum currency areas (OCA) as static and ahistorical.
They also consider that studies which have dealt with thequestion of the stability and durability of monetary unions
146
are few. This is why future research into OCAs must beoriented toward the practical questions linked to the relativeefciency of different adjustment mechanisms.
Also, history shows that the absence of political involvementtoward the process of monetary integration facilitates thedisintegration and the division of countries into manyindependent entities, each of them characterized by a newnational currency and a unique Central Bank (Goodhart
Moreover, a political involvement directed towards thecreation of a monetary union probably constitutes a seriousproblem for governments, given the traditional rivalrybetween some countries of the zone and the importanceof the seigneuriage role as a last resort. Furthermore, thereare still many political problems which have prevented,
until now, the completion of the economic and nancialintegration within the Maghreb as well as the functioning

8/15/2019 African Single Currency
http://slidepdf.com/reader/full/african-single-currency 146/192
national currency and a unique Central Bank (Goodhart,1995).
In Africa, the decision of African Central Bank governorsto adopt a single currency by 2021 and the call from theunion of Maghreb banks in November 2007 to create onecurrency for the Maghreb raises the same doubts as to theefciency of such decisions.
The Maghreb countries (which groups together Algeria,Libya, Morocco, Mauritania and Tunisia) indeed decided toimprove the coordination of their economic policies and toreinforce their nancial and commercial relations when theycreated the Arab Maghreb Union (AMU) in February 1989.The reasoning behind this creation is that a Maghrebianzone where goods, services and capital circulate freely
would be an attractive market for domestic and foreigninvestors. In particular, a well-integrated Maghrebianzone would bring more important advantages then thepotential gains resulted from association agreements withthe European Union and the new European neighbourhoodpolicy. It would moreover become an attractive destinationfor other investors notably the oil-exporting countries ofthe Middle-East (IMF 2007). Besides, the establishment ofsupranational central bank would resolve the problem ofdependence of national central banks.This ambition to pursue an autonomous monetary policy inorder to avoid the marginalisation of their monetary powerfaces many problems. Indeed, the economic and nancialstructures of these countries are different and evolve withchanges in the international environment. Furthermore,these countries conduct monetary policies whose objectivesand strategies are not yet transparent.
of the AMU (Darrat & al 2002).
In this preliminary work, we have tried to understand thefoundations of differences in Maghrebian monetary regimesto evaluate the consequences of the choice of monetaryunication in these countries1.
To this end, we have tried in a rst section to describethe evolution of the monetary practices of the Maghrebcountries (MC). We have illustrated in a second section theheterogeneity of these practices from a model describingthe functioning of their economies. We have nally triedin a third section to evaluate the consequences of thisheterogeneity by simulating optimal monetary policy rulesfor each country.
Our choice is focused on the Taylor rule and expresses ourwillingness to dene an efcient, credible and simple rulewhich will be understandable by all economic agents andwill constitute the key to the success of all future reformsundertaken by the Maghrebian authorities.
MONETARY REGIMES IN MAGHREB
McKinnon & Schnabl (2004) admit that emerging marketsand developing countries cannot choose their monetaryregimes in an exogenous way. These regimes are in factendogenous and generally determined by interdependentfactors such as macroeconomic stabilisation, invoicing ofinternational trade as well as currency denomination of theinternational capital ows.
In this section, we will try to describe the evolution ofmonetary regimes (monetary and exchange rate policies)in MC over the last two decades before illustrating thefoundations of this evolution via a simple model of an openeconomy.
147
Tunisia
In the early 1980s, the Central Bank of Tunisia (CBT)undertook to dene a strategy aiming at the preservation ofthe value of the currency and the support of the economicpolicies of the government. However, although this strategy
has more than one objective, price stability remains theprimary (implicit) objective of monetary policy.
non remunerated accounts, at the Central Bank, all depositswhich were above a certain rate determined monthly by theemission institute.
Since 2003, the CBT has modied the quantitative approachthrough the targeting of M3 instead of M2. The nal aimbeing to attain an ination objective close to the oneobserved in partner and competitive countries. However,in reality the formulation of the monetary policy has not

8/15/2019 African Single Currency
http://slidepdf.com/reader/full/african-single-currency 147/192
Indeed, since 1987, the Tunisian monetary authoritieshave had as an intermediary objective the targeting of M2aggregate. This is determined according to the quantitativefunction MV=PY. In fact, the CBT x a growth of M2 at 2%below the projected growth of nominal GDP2. Then, underthe assumption of a roughly constant multiplier, the amount
of base money supply consistent with the target growthof M2 is calculated. Finally, taking into account projectednet international reserves and the credit requirement ofthe agricultural sector, the CBT determines the quantityof liquidity to be distributed through the renancingfacilities. On a weekly basis, these amounts are ne-tunedtaking into account the perceived nancing needs of thecommercial banks (Treichel 1997). Any deviation of M2from its reference value is considered as a risk to the pricestability objective.
To attain its intermediary objective, the CBT acts on theamount of liquidity. Until 1996, this amount was regulatedfrom the restrictions imposed to the commercial banks.These banks are in fact submitted to constraints such as theobligation to nance priority sectors as well as the xationof debtors’ interest rates.
Furthermore, from 1997, after the removal of theserestrictions, the principal instrument became that of moneymarket interventions (FMI 2004). The CBT inject or withdrawliquidity through the renancing facilities (repurchaseagreements and bid techniques3). These techniques arecompleted with standing facilities and weekly ne-tunedoperations in light of the nancing needs of the commercialbanks. As regards reserve requirement techniques, this was
not actively used during the last two decades. In October1989, the reserve requirement rate rose from zero to 2%.From that date to the early 2000s, banks had to deposit on
in reality, the formulation of the monetary policy has notreally changed and the Central Bank has continued to acton the level of banking liquidity through many operations,notably call for tender, allowance uptake4 as well as weeklyne tuned operations. The reserve requirement techniquewas also reactivated and differentiated according to theduration of deposits in 20025.
Moreover, from 2006, the monetary authorities claimedthat the fundamental objective of the Central Bank is pricestability and that the emission institute will use the interestrate as a basic instrument which, in line with ne regulation,will help it to inuence the price level6.
Practically, the adoption of this new frame will be establishedin two stages. At the rst stage, the Central Bank will apply
a quantitative approach by acting on the monetary base(considered as its operational objective) and by using moneymarket operations to regulate bank liquidity. Afterwards,during the second stage, the institute of emission willestablish an ination targeting approach (CBT 2007). Thistarget will be reached through the manipulation of interestrates and will allow it to continue to control prices.
Concerning the exchange policy, the aim of establishing
prudent monetary policy following the recession andthe balance of payment problems of the middle 1980s –combined with the start of an openness and a liberalizationprocess of the economy – urged the monetary authoritiesto target the real exchange rate (after having devaluatedthe dinar).
This policy consists of indexing the nominal exchange rateto the domestic price level in order to cancel the loss of
competitiveness of the economy and the overvaluation ofthe Tunisian dinar. A domestic price shock can in fact be
148
resolved through a depreciation of the nominal exchangerate and rapid monetary growth.
The aim of this strategy is then to keep a constant realexchange rate level (CRER) vis-à-vis the partners throughnominal exchange rate adjustments.
More recently (the beginning of 2000s), the monetaryauthorities have been more exible in the application ofh l b b h l f d
On the contrary, the constraints imposed on the asset sideof the banks were gradually softened down and nallydisappeared completely. For example, the public bill oorwas abrogated in 1998 and the coefcient of compulsoryuses was also eliminated in April 1994 (Sagou 2006).
During the last few years, notably in the early 2000s, theMoroccan money market has been characterized by anexcess of banking liquidity9. This situation has inuenced

8/15/2019 African Single Currency
http://slidepdf.com/reader/full/african-single-currency 148/192
this rule by basing themselves on a series of indicatorsof competitiveness. This evolution has allowed wideructuations in the actual real exchange rate notablysuccessive depreciations (Fanizza & al 2002).
It seems then that monetary authorities sometimes usethe nominal exchange rate to correct shocks on domesticprices. Such a practice can lead to hyper ination7. But, inthe case of Tunisia, the success of targeting real exchangerate policy was facilitated by the absence of shocks in theterms of trade, the rigidity of prices and wages as well asthe continuity in controlling the capital account (Dropsy &Grand 2004).
Morocco
At the beginning of the 1990s, Bank Al Maghrib (BAM)was led to rely more on a quantitative approach to attainits nal goal which was redened around price stability andthe stability of the value of the national currency. Indeed,the objective of monetary rule prompted it to dene agrowth rate for the monetary aggregate M18 considered asan intermediary objective. The growth rate is estimated at8,3% to reach a 2% ination rate (Benbouziane & Benamar
2004).To achieve their goal, the monetary authorities haveadopted a policy of base. Indeed, BAM tried to manipulatethe monetary base by putting in place indirect interventioninstruments (instead of rediscount techniques) such as 7days call for tender, 5 days and 24 hours advances, as wellas reserve requirement operations. The latter were usedconsistently at the beginning of the nancial liberalization
process (early 1990s).
excess of banking liquidity. This situation has inuencedthe functioning of the money market and the conduct ofthe monetary policy of BAM. So, the operational frameworkhas been renewed. The Central Bank indeed tries tointervene on the interbank market in order to insure therenancing of the banks while reaching a desired level of“from day to day” rate. This rate has to uctuate between
a oor rate (interest rate applied to the 24 hours depositfacilities) and a ceiling rate (interest rate applied to 24 hoursadvances). Such a framework allows the Central Bank tomanage liquidity and to point out the general short andmiddle term orientation of monetary policy.
It follows that the modication of banking liquidity is madethrough quantities and the level of intervention rate isstable and rarely revised. Basically, the instruments used
to that end are essentially liquidity injection canals (7 daysadvances via weekly call for tender and 24 hours advancefacilities at the initiative of banks) as well as liquiditytapping channels (weekly resumption liquidity operationsat the initiative of the Central Bank and 24 hours depositfacilities at the initiative of banks). These techniques arecompleted with secondary instruments such as ne tunedoperations (temporary selling or purchasing of treasurybonds, rm operations or foreign exchange swaps) andreserve requirement operations.
But, with the persistence of the excess of liquidity, notablysince 2003, the liquidity tapping operations have becomealmost the only usual technique used by the Central Bank.Indeed, this institution has become constantly concernedwith the sterilisation of the superuous “over liquidity”through the sale of securities on the money market. It alsoraised the rate on 7 days tapping liquidity operations from2.5 % to 2.75 % in December 2006.
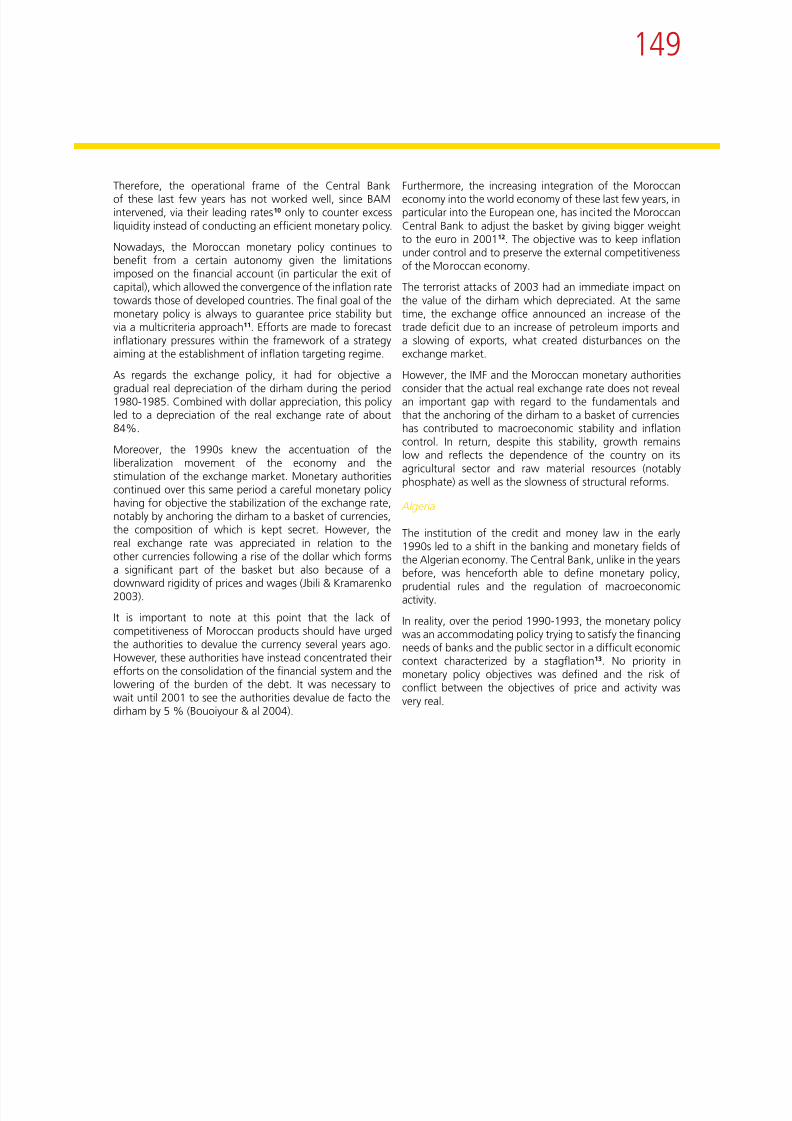
8/15/2019 African Single Currency
http://slidepdf.com/reader/full/african-single-currency 149/192
150
Besides, this same law of the early 1990s set up a packageof indirect instruments such as rediscount, allowanceuptake of private and public bills, open market operationsas well as reserve requirement. However, in reality, giventhe prevalent situation at the time, instrumentation wasdirect. The interest rates could not really play their role in
the allowance of resources given the weak situation ofpublic companies and the high level of ination, makingthem negative in real terms
primacy over a full employment objective. In this context,the ination rate, after its stabilization during the previousperiod, had to evolve to a rate comparable to that of themain trade partners. The intermediate objective was thelimitation of money supply growth of M2 via the controlof Central Bank internal assets. The instruments put in
place were those used during the stabilization period butaccompanied by the introduction of Treasury bill auctiontechniques as well as the establishment of open market
8/15/2019 African Single Currency
http://slidepdf.com/reader/full/african-single-currency 150/192
them negative in real terms.
It was with the enforcement of the macroeconomicstabilization program (1994-1995) followed by thestructural adjustment program (1995-1998) that monetarypolicy was really able to play its role. Indeed, on the eveof the coming into force of the stabilization program, the
governor of Bank of Algeria (BA) signed instruction n°16-94 of April 1994 concerning the instruments of monetarypolicy and the renancing of banks. The nal objective ofmonetary policy was ination control14, but also the activitygrowth (at a secondary degree)15.
To reach this objective, a double intermediary objectivewas dened, that is the limitation of the money supplyand credit growth. However, reaching this double objective
required having recourse to a double operational objectiveconsisting in xing an upper limit to the growth of theCentral Bank internal assets (credits to the State andrenancing of banks) as well as those of the banks (creditsto the State and to the economy)16.
As for the instruments used, the Central Bank was led to setup a battery of rates in order to supervise the banking ratesand direct its intervention, namely: a rediscount rate set at15%, an intervention pivot rate over the money marketset at 20% and a rate applied to advances to banks setat 24%. But, due to the prevalent economic situation andthe incapacity of these instruments to control monetaryand credit expansion, other instruments were introduced,notably: a rediscount upper limit by bank, credit restriction,credit auctions17 (call for tender) as well as reserverequirement techniques18.
During the structural adjustment period, the monetarypolicy was assigned the role of ghting ination which had
techniques as well as the establishment of open marketoperations19.
From 2001, the conduct of the Algerian monetary policyconsisted in targeting clearly a rate of ination as a middleterm prospect. Unlike the previous years, this rate was setat 3% (Grand Alger index). The objective was not only
to insure price stability but particularly to maintain a lowlevel of prices already reached during the stabilisation andstructural adjustment period20. The intermediary objectivewas money supply (and credit to the economy). In coherencewith this objective, BA tries to use a reserve requirementtechnique –which has been really reactivated– and bankliquidity mapping (Zouache & Ilmane 2008).
Besides, these last few years has been marked by the
durability of the abundance of liquidity (because of theprodigious increase in oil receipts), which has allowed thecommercial banks to work in an “out of bank” system.This has limited the use of Central Bank monetary policyinstruments such as rediscount. At the same time, thissituation has forced BA to act in two directions. On the onehand, it offers remuneration to banks for the liquidity whichis not used. On the other hand, it subjects these banksto mandatory regulations. Indeed, to mop up the excessof liquidity, BA has intervened on the interbank moneymarket by using resumption liquidity operations with morefrequency. These became the main indirect instrument ofthe monetary policy. Similarly, a further indirect instrumentcalled “remunerated deposit facilities” was introduced atthe end of 2005 (Bank of Algeria 2006). Also, in the eld ofregulation, the base of calculus of reserve requirements wasincreased to 6.5% of deposits in dinars.
As regards the exchange policy, after anchoring the dinar toa basket of currencies, the petroleum counter shock and the
151
term of trade deterioration during the second half of the1980s forced the monetary authorities to let the Algeriandinar depreciate against the other currencies. During all theperiod of depreciation (from the middle 1980s to 1995), theparallel market developed and the black market exchangerate reected better the economic reality.
Faced with this situation, Algerian authorities took as aguideline the stability of the dinar. Indeed, since 1995, theAl i h li h i d i i bl
To conclude, one can notice that, although the monetarypolicies of MC have similar nal objectives, the operationalframes and the monetary instruments used for therealization of these objectives differ from one country toanother. Also, the exchange rate policies of these countriesare led and interpreted differently.
A question arises at this level: can one illustrate thisheterogeneity of Maghreb? It is the object of the following
i
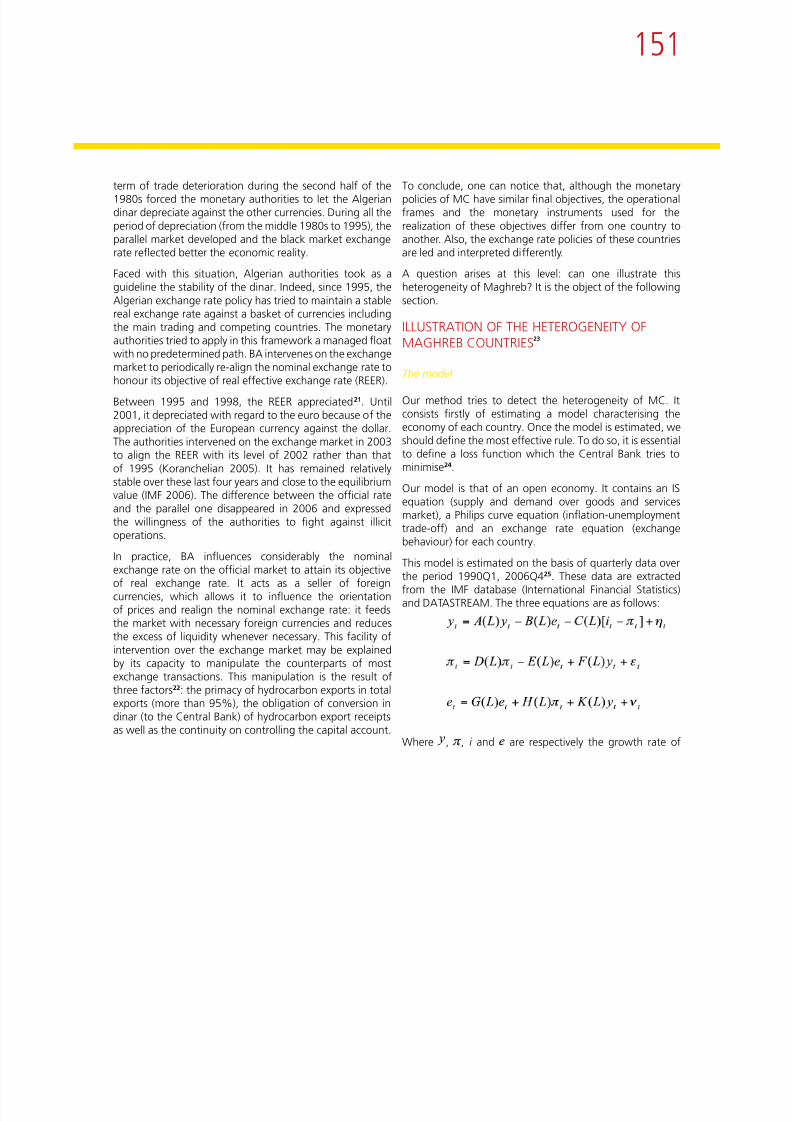
8/15/2019 African Single Currency
http://slidepdf.com/reader/full/african-single-currency 151/192
Algerian exchange rate policy has tried to maintain a stablereal exchange rate against a basket of currencies includingthe main trading and competing countries. The monetaryauthorities tried to apply in this framework a managed oatwith no predetermined path. BA intervenes on the exchangemarket to periodically re-align the nominal exchange rate to
honour its objective of real effective exchange rate (REER).Between 1995 and 1998, the REER appreciated21. Until2001, it depreciated with regard to the euro because of theappreciation of the European currency against the dollar.The authorities intervened on the exchange market in 2003to align the REER with its level of 2002 rather than thatof 1995 (Koranchelian 2005). It has remained relativelystable over these last four years and close to the equilibrium
value (IMF 2006). The difference between the ofcial rateand the parallel one disappeared in 2006 and expressedthe willingness of the authorities to ght against illicitoperations.
In practice, BA inuences considerably the nominalexchange rate on the ofcial market to attain its objectiveof real exchange rate. It acts as a seller of foreigncurrencies, which allows it to inuence the orientationof prices and realign the nominal exchange rate: it feedsthe market with necessary foreign currencies and reducesthe excess of liquidity whenever necessary. This facility ofintervention over the exchange market may be explainedby its capacity to manipulate the counterparts of mostexchange transactions. This manipulation is the result ofthree factors22: the primacy of hydrocarbon exports in totalexports (more than 95%), the obligation of conversion indinar (to the Central Bank) of hydrocarbon export receiptsas well as the continuity on controlling the capital account.
section.
ILLUSTRATION OF THE HETEROGENEITY OFMAGHREB COUNTRIES23
The model
Our method tries to detect the heterogeneity of MC. Itconsists rstly of estimating a model characterising theeconomy of each country. Once the model is estimated, weshould dene the most effective rule. To do so, it is essentialto dene a loss function which the Central Bank tries tominimise24.
Our model is that of an open economy. It contains an ISequation (supply and demand over goods and servicesmarket), a Philips curve equation (ination-unemploymenttrade-off) and an exchange rate equation (exchangebehaviour) for each country.
This model is estimated on the basis of quarterly data overthe period 1990Q1, 2006Q425. These data are extractedfrom the IMF database (International Financial Statistics)and DATASTREAM. The three equations are as follows:
Where , , i and are respectively the growth rate of
152
industrial production index (IPI), the growth rate ofconsumption price index (CPI), nominal interest rate (theinstrument of monetary policy) and REER in each country26.
, , , , , , , andare the traditional polynomial lags of which the
degrees are naturally different from one country to another
according to the signicance of the estimated coefcients., and are error terms.
Th i h h ff f d
equation) describes how exchange rate and monetarypolicy can inuence the dynamism of the economy. Theeffect of exchange policy on economic growth depends forexample on the degree of openness of the countries andshows in fact the diversity of economic structures. Similarly,the effect of monetary policy on economic growth depends
for example on the sharing of direct nance versus indirectnance and shows therefore the differences in nancialstructures.

8/15/2019 African Single Currency
http://slidepdf.com/reader/full/african-single-currency 152/192
The rst equation shows the effect of monetary andexchange rate policy on the activity and therefore onthe real sphere. An appreciation (depreciation) of theexchange rate implies a price increase (a price fall) of thedomestic goods comparing to the foreign ones which leadsto a decrease (increase) in domestic production. Also, a
restrictive (expansionist) monetary policy reected by anincrease (decrease) in interest rate acts negatively (positively)on the global demand component and leads to a decrease(increase) in domestic production. The expected coefcientsfor e and are then negative.
The second equation shows how economic growthand exchange policy affect prices27. An appreciation(depreciation) of exchange rate makes domestic productsless required (more required) and decreases (increases) theinationary pressures while a rapid (sluggish) economicgrowth due to expansionist (restrictive) monetary policyfor example leads to an acceleration (deceleration) ofinationary pressures28. This argument is often stated bycentral bankers when they claims that demand increasemore rapidly then supply. The expected coefcient for e isthen negative while that of is positive.
Finally, the third equation shows how evolution of inationand activity acts on the exchange rate. Higher (lower)ination leads to an appreciation (depreciation) of thereal exchange rate following a price increase (decrease)of domestic goods – more (less) than foreign one – whilelow (high) activity growth leads to the reverse effect (sameeffect). The expected coefcients for and are thenpositive.
One can note at this level that we can nd in theseequations the different sources of difference betweencountries. Indeed, the growth rate equation (the rst
Moreover, the second equation shows the effect ofgrowth and exchange rate on ination and exempliesthe differences in productive and institutional structures. Inan open economy for example, the effect of growth onination is more important than in a closed one. Besides,
rigid labour markets may lead to a permanent effectof economic growth on ination. Likewise, the effect ofexchange rate variations on ination depends for exampleon the market power of local participants – and so on thedegree of competition – as well as the “pricing to marketbehaviour” and reects the differences in productivestructures. This effect may also depend on the willingnessof monetary authorities to maintain their price stabilityobjectives and reect then differences in the credibility andthe effectiveness of the monetary policy (Taylor 2000).Finally, the third equation shows the effect of growth andination on the exchange rate and expresses for examplethe differences of labour market functioning. It may alsoexpress the characteristics of the economy (case of rentaleconomy).
The effect of ination on the exchange rate for example is
minor if prices and wages are exible. Similarly, the effectof economic growth on the appreciation of exchange rateis big if prices and salaries do not adjust rapidly or if theeconomy is based on a unique sector.
Estimation of the model
Before estimating the parameters of the model, weestablished a stationarity test for the different variables toavoid a spurious regression. The following tables synthesizesour results:
153
Table 1: Results of Dicky Fuller test 29
Tunisia
Zero mean Single mean Trend DF Statistic P-value DF Statistic P-value DF Statistic P-value
Growth rate (y) -85.7544 <0.0001 -93.0509 0.0001 -93.0713 <0.0001Ination rate (π) -13.8598 0.0062 -43.4721 0.0001 -52.7584 <0.0001
Real money rate -0.8403 0.0072 -1.2919 0.656 -2.9667 0.9510
Real exchange

8/15/2019 African Single Currency
http://slidepdf.com/reader/full/african-single-currency 153/192
Real exchangerate (e) -0.1313 0.2149 1.1474 0.9875 -3.3306 0.8890
Morocco
Zero mean Single mean Trend DF Statistic P-value DF Statistic P-value DF Statistic P-value
Growth rate (y) -109.328 <0.0001 -111.246 0.0001 -111.324 <0.0001
Ination rate (π) -41.9485 <0.0001 -64.1475 0.0001 -73.8384 <0.0001Real money rate-1,0716 0,0396 -0.4902 0.8989 -7.6871 0,5519
Real exchangerate (e) 0.0883 0.8923 -4.547 0.2308 -3.6445 0.8448
Algeria
Zero mean Singlemean
Trend
DF Statistic P-value DF Statistic P-value DF Statistic P-value
Growth rate (y) -206.293 <0.0001 -206.723 <0.0001 -206.724 <0.0001Ination rate (π) -100.658 <0.0001 -108.959 <0.0001 -120.184 <0.0001Real money rate
-1.8283 0.1956 -3.0226 0.6906 -4.7633 0.81
Real exchangerate (e) -2.1433 0.3131 -31.9247 0.0011 -38.8168 0.0005
154
Table 2: Result of Phillips Perron test 30
Tunisia PP Model (1) Model (2) Model (3)Growth rate (y) Level
First difference-2.78*** -5.58*** -6.57***
Ination rate (π) LevelFirst difference
-10.86*** -14.2*** -14.55***
Real money rate LevelFirst difference
-2.52**-6.07***
-1.23-6.59***
-1.13-6.67***
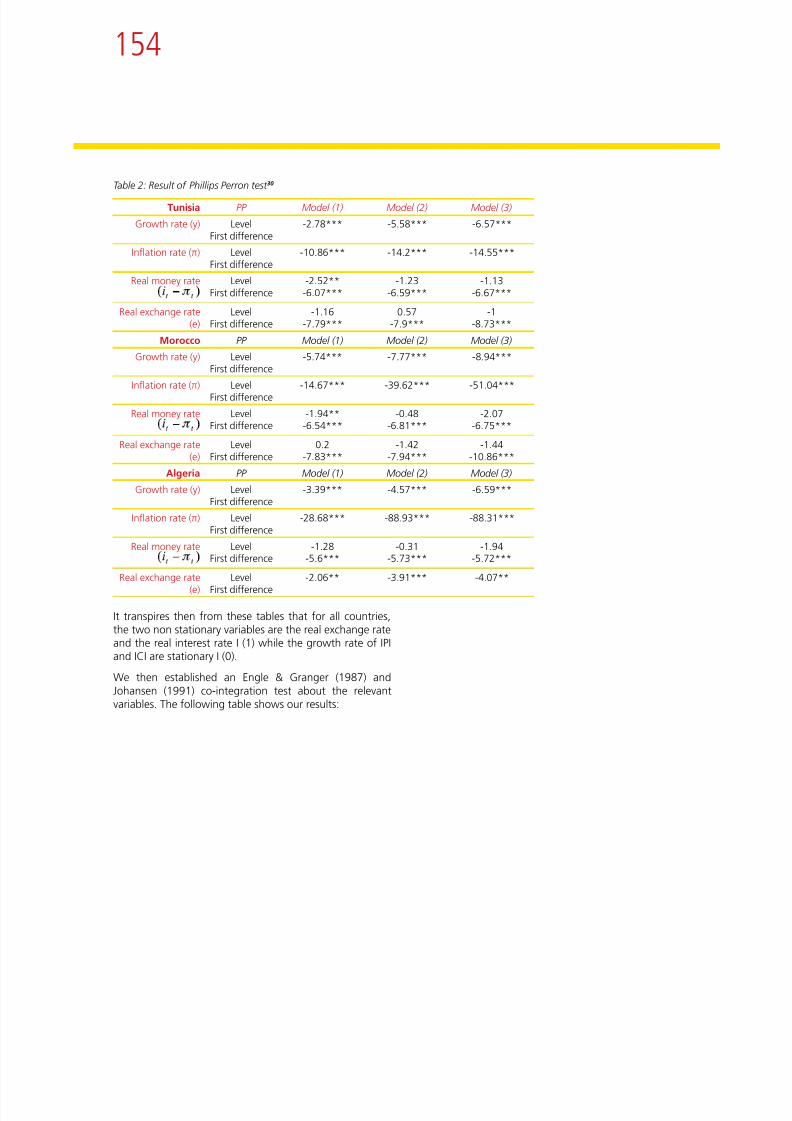
8/15/2019 African Single Currency
http://slidepdf.com/reader/full/african-single-currency 154/192
Real exchange rate(e)
LevelFirst difference
-1.16-7.79***
0.57-7.9***
-1-8.73***
Morocco PP Model (1) Model (2) Model (3)Growth rate (y) Level
First difference-5.74*** -7.77*** -8.94***
Ination rate (π) LevelFirst difference
-14.67*** -39.62*** -51.04***
Real money rate LevelFirst difference
-1.94**-6.54***
-0.48-6.81***
-2.07-6.75***
Real exchange rate(e)
LevelFirst difference
0.2-7.83***
-1.42-7.94***
-1.44-10.86***
Algeria PP Model (1) Model (2) Model (3)Growth rate (y) Level
First difference-3.39*** -4.57*** -6.59***
Ination rate (π) LevelFirst difference
-28.68*** -88.93*** -88.31***
Real money rate LevelFirst difference
-1.28-5.6***
-0.31-5.73***
-1.94-5.72***
Real exchange rate(e)
LevelFirst difference
-2.06** -3.91*** -4.07**
It transpires then from these tables that for all countries,the two non stationary variables are the real exchange rateand the real interest rate I (1) while the growth rate of IPIand ICI are stationary I (0).
We then established an Engle & Granger (1987) andJohansen (1991) co-integration test about the relevantvariables. The following table shows our results:
155
Table 3: Results of Engel & Granger test 31
Zero mean Single mean Trend DF
Statistic P-value DF
Statistic P-value DF
Statistic P-value
Tunisia -1.1935 0.26 -1.9746 0.4126 -0.6863 0.99
Morocco 0.4019 0.7934 -0.7343 0.8495 -6.3894 0.729Algeria -4.5602 0.0947 -6.0594 0.3585 -8.9871 0.3044
None 8.7 11.22(0.13)
10.25 15.89(0.31)
10 14.26(0.21)
At most 1 1.68 4.12(0.22)
7.31 9.16(0.11)
3.39 3.84(0.06)
Algeria Model (1) Model (2) Model (3)
TCR –TMR
Tracestatistic
0.05criticalvalue
Tracestatistic
0.05criticalvalue
Tracestatistic
0.05criticalvalue

8/15/2019 African Single Currency
http://slidepdf.com/reader/full/african-single-currency 155/192
Table 4: Result of Johansen test 32
Tunisia Model (1) Model (2) Model (3)
TCR –TMR
Tracestatistic
0.05criticalvalue
Tracestatistic
0.05criticalvalue
Tracestatistic
0.05criticalvalue
None 14.32 12.32(0.02) 15.13 20.26
(0.21) 9.73 15.49(0.3)
At most 1 5.16 4.12(0.02) 5.38 9.16
(0.24) 0.6 3.84(0.43)
TCR - TMRMax-Eigen
statistic
0.05criticalvalue
Max-Eigen
statistic
0.05criticalvalue
Max-Eigen
statistic
0.05criticalvalue
None 8.7 11.22(0.13) 10.25 15.89(0.31) 10 14.26(0.21)
At most 1 1.68 4.12(0.22) 7.31 9.16
(0.11) 3.39 3.84(0.06)
Morocco Model (1) Model (2) Model (3)TCR –TMR
Tracestatistic
0.05criticalvalue
Tracestatistic
0.05criticalvalue
Tracestatistic
0.05criticalvalue
None 10.38 12.32(0.1)
17.57 20.26(0.11)
13.39 15.49(0.1)
At most 1 1.68 4.12(0.22)
7.31 9.16(0.11)
3.39 3.84(0.06)
TCR - TMRMax-Eigen
statistic0.05
criticalvalue
Max-Eigen
statistic0.05
criticalvalue
Max-Eigen
statistic0.05
criticalvalue
None 5.3 12.32(0.52)
22.88 20.26(0.02)
19.99 15.49(0.00)
At most 1 1.26 4.12(0.30)
2.78 9.16(0.62)
0.16 3.84(0.68)
TCR - TMRMax-Eigen
statistic0.05criticalvalue
Max-Eigen
statistic0.05criticalvalue
Max-Eigen
statistic0.05criticalvalue
None 4.04 11.22(0.62)
20.09 15.89(0.01)
19.82 14.26(0.00)
At most 1 1.26 4.12(0.30)
2.78 9.16(0.62)
0.16 3.84(0.68)
It turns out that in the case of three countries and forequation (1), the two variables (real money rate and realexchange rate) are not co-integrated. The regression istherefore made by using the rst difference of the twovariables. For equation (2), the co-integration problemdoes not arise (except that the regression is made by usingthe rst difference of the real exchange rate). Similarly, forequation (3), the problem does not arise and the regressionis simple (and not in difference)33.
The next step consists in the search for the optimal lagsbased on information criteria: Akaike (aic) and Schwartz(bic)34. Our results are shown in the following table:
156
Table 5: Optimal lags for each country
1 st equation 2nd equation 3rd equation
Tunisia 4 1 2 1 1 2 1 5 2Morocco 4 1 1 3 3 2 4 3 1
Algeria 3 2 1 2 1 3 1 1 1
We notice from this table that the majority of lags vary
opened). This result may be due to the rigidity of labourmarkets. Indeed, the speed of renovation efforts in thesemarkets remains modest and the pace of wage adjustmentis still slow.
As for the effects of the exchange policy on prices ( ),they appear after one quarter for Tunisia and Algeria andthree quarters for Morocco. This result allow to mentionthat an appreciation of the real exchange rate for examplemay have an immediate effect on ination in the rst two

8/15/2019 African Single Currency
http://slidepdf.com/reader/full/african-single-currency 156/192
j y g ybetween countries, meaning that, the effects of monetaryand exchange rate policies on activity and prices takedifferent lapses from one country to another (equation 1and 2). Similarly, the effects of activity and price evolutionon the exchange rate are different (equation 3)35.
Indeed, the optimal lags of the rst equation show that theeffects of monetary policy on the real sphere ( ) appearafter two quarters for Tunisia and one quarter for Moroccoand Algeria. This result may express the resemblance of thesharing direct/indirect nancing in these countries. Besides,despite many efforts aiming at developing the capitalmarkets, indirect nancing remains the pillar in nancingthe economies of MC and nancial markets still remain
supercial. However, the nancial specicities of eachcountry make the extent of monetary policy transmissiondifferent (see below).
As for the effects of exchange policy ( ), they appearafter one quarter for Tunisia and Morocco and two quartersfor Algeria. A variation in real exchange rate will have animmediate effect in the Tunisian and Moroccan economieswith regard to the Algerian one. This last result can beexpected especially because these economies are open.It can also explain the exibility of Tunisian monetaryauthorities in the treatment of the real exchange rate targetrule.
Concerning the lags of the second equation, the resultsshow that the nal effects of economic growth on prices (
) appear after two quarters for Tunisia and Moroccoand three quarters for Algeria. Accelerated economicgrowth for example in these countries does not entail animmediate effect on prices (even if these economies are
ycountries, and can probably reect the importance of effortsof openness in these economies. This may strengthens theidea of the importance of the “pass through” effect ofexchange rates in an open economy. It may also corroboratethe idea according to which, although the Moroccan
economy is opened, quasi-xed exchange rates can delaythe effect of exchange rates on prices.
Finally, for the lags of third equation, the table shows thatthe effects of ination on exchange rates ( ) appearafter ve quarters in Tunisia, three quarters in Morocco andone quarter in Algeria. Ination affects immediately theAlgerian exchange rate while the effect is not immediatein Tunisia and Morocco. This result can reect the structure
of the Algerian economy where dependence on one sectorrenders the exchange rate more sensitive to the variation offoreign good prices.
As regards the effects of activity on the exchange rate (), they appear after two quarters in Tunisia and one
quarter in Morocco and Algeria. Accelerated economicgrowth for example may have an immediate effect on theexchange rate in the last two countries while the effectis more delayed in the Tunisian case. This conrms theidea that wages and prices do not adjust quickly in theseeconomies.
Finally, the estimation of our model has allowed us to reachthe following results36 37:
157
For Tunisia These results show that the most important coefcient isnot the same and strengthen the idea of the heterogeneityof MC. Indeed, the extent of different policies conductedby monetary authorities on activity, ination and exchangerate is different and sometime divergent. Concerning theextent of monetary policy on the real sphere, while it is
modest, it appears more important in the Tunisian casethan in that of Morocco or Algeria. This result may expressthe specicities of the Tunisian nancial structure whichcan expose it to more interest rate variation The small size

8/15/2019 African Single Currency
http://slidepdf.com/reader/full/african-single-currency 157/192
For Morocco
For Algeria
can expose it to more interest rate variation. The small sizeof Tunisian banks and companies, the small availability ofcapital direct contributions and the short-term debts ofTunisian companies and households are perfect illustrations.However, the existence of bank liquidity excess in Moroccoand Algeria can explain the weak capacity of monetaryauthorities in managing money market operations and so,in inuencing banking conditions. The money and creditchannels turn out to be less functional in Morocco andAlgeria than in Tunisia38.
Similarly, the effect of exchange policy on activity is relativelymore important in the Tunisian case than in that of Algeriaand may express the importance of the degree of opennessin inuencing the activity. Indeed, the Tunisian economy ismore open than the Algerian one (98% in Tunisia against83,1% in Algeria in 2006) and may reveal the relativeimportance of exchange rate channels in this country.However, the low sensitivity of the activity to exchange ratemodication in the three countries seems to relativize thisfact.
Yet, it is useful to mention that the «contradictory effect»of exchange policy on Moroccan activity may be explainedby the fact that a great part of Moroccan debt is labelled inforeign currency, by the effects of imported ination as wellas the effects of the increase in petroleum bill (Boughrara2003).
Concerning the effect of activity growth on ination, itturns out to be similar in the case of Tunisia and Morocco.Accelerated economic growth for example is translated byan increase in the ination level, but the effect appearsafter two quarters. This can reect the fact that in an opencountry, the effect of growth on ination is more important
158
than in a closed one. However, as was explained earlier, therigidity of the labour market can delay this effect39.
It is moreover important to note in this frame that theweakness of the adjustment process in these economiesmay express price inertia. This inertia may be explainedby the still important presence of the public sector in theeconomy, low competition between sectors but also thepresence of industry characterised by sticky prices.
However the inverse effect occurs in Algeria Accelerated
lead to a decrease in prices and then to a depreciation ofthe exchange rate.
However, results concerning the effects of ination on theexchange rate show that these effects are acute in Moroccoand Algeria but differs from what is expected in the caseof Tunisia. The acceleration of ination in this last countrywill be translated by a depreciation of the real exchangerate at the end of the fth quarter. This result can express aprogressive substitution of domestic goods by foreign onesf ll i i i h i f h f Fi l l

8/15/2019 African Single Currency
http://slidepdf.com/reader/full/african-single-currency 158/192
However, the inverse effect occurs in Algeria. Acceleratedgrowth in this country may result in a decline of priceswhile this decline is felt from the second quarter. This resultcan reect the importance of tradable good prices in theAlgerian economy. These prices are generally on a parwith world prices following acceleration or deceleration oftradable goods production sector40.In return, the effect of exchange policy on ination turnsout to be small in the three countries, although theireconomies are open. This effect seems to be the resultof continuity in controlling capital movements and theabsence of total convertibility of the currency. Moreover, asEngel (2002) noted, in a country where the market powerof local participants is important, variations in the exchangerate do not hardly affect domestic prices. Besides, a goodproportion of prices is still administered by the governmentsof these countries reecting the rmness in establishingprice stability.
This result can also reect the nominal rigidities and slowadjustment of good prices which could make domesticprices less responsive to exchange rate movements.
Finally, concerning the effects of growth on the exchangerate, they are important for the Tunisian case while thereverse happen in Algerian and Moroccan one41. The effectof economic growth on exchange rate appreciation isimportant in Tunisia and can reect the slowness of wageand price adjustment in this country.
As for the Algerian and Moroccan results, it can be explainedby the nature of production in these two countries. Arapid growth in agricultural products for example, whichrepresent an important part of Moroccan economy, may
following an increase in the price of the former. Final resultmay be so an increase in the price of the latter42.
Differences between countries appear therefore partially inthe estimation of the model, but they can be strengthenedby the observation of more efcient Taylor rules dened ateach country’s level.We would try therefore to answer the following question:which will be the characteristics of the monetary practicesin MC?
HETEROGENEITY OF THE MAGHREBCOUNTRIES: THE OPTIMISATION RESULTS
After estimating the model for each country, our aim is todetermine the monetary rules which best full the objectiveof the Central Bank, that is, to minimise a loss function43.We retain the Taylor rule in an open economy which thesimple form is as follows44:
Where , and are respectively the weight attached toactivity, ination and exchange rate by the Central Bank45.Moreover, the existence of the term expresses theinterest rate smoothing behaviour of the emission institute(or the monetary policy inertia). Moving the policy rate bysmall steps in the same direction increases its impact on thelong term interest rate because market participant expectthe change to continue and hence price their expectationsinto forward rates (Mohanty & Klau 2004). Such practice isalso often present, especially in countries where bankingand nancial weakness is signicant. It also expresses the
159
willingness to maintain the credibility of the Central Bank andthe reduction of uncertainty that mark the key parametersof the structure of the economy. These parameters governthe transmission mechanisms of monetary policy. Lastly,represent the output gap or the difference between currentproduction and potential production, is the
deviation of ination from its target value and isthe deviation of current exchange rate from its equilibriumlevel. However, given that several studies showed that inthe three countries there were no problems of substantial
are recovered. These last ones respect the distribution ofhistorical shocks. It is then a matter of historical simulationswhich deal with reproducing the past shocks.
Our objective consists so of observing the behaviour ofmonetary authorities following a shock hitting the economy.For that purpose, we use for each country a model with fourequations: the rst three describe the functioning of theeconomy (the model above) while the last one is the Taylorrule. We look through this rule for the parametersi th i t l [0 1 10 1] b h i g t f 0 1 d b
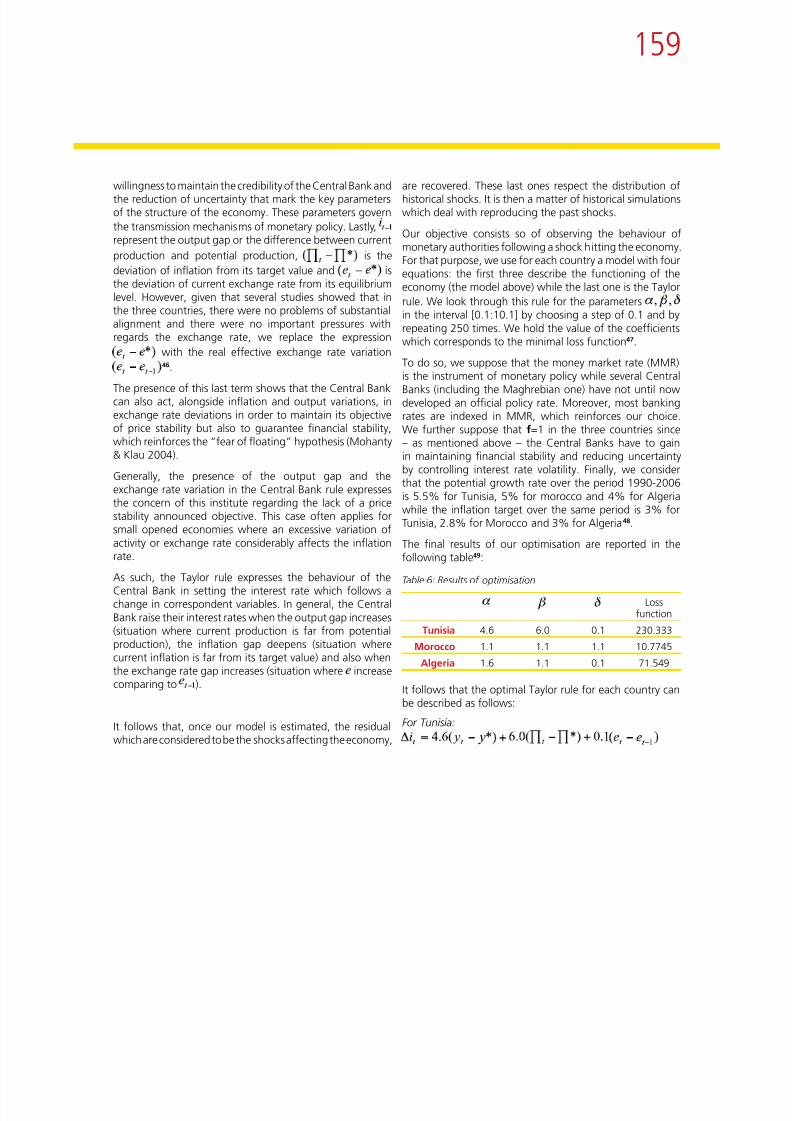
8/15/2019 African Single Currency
http://slidepdf.com/reader/full/african-single-currency 159/192
the three countries, there were no problems of substantialalignment and there were no important pressures withregards the exchange rate, we replace the expression
with the real effective exchange rate variation46.
The presence of this last term shows that the Central Bankcan also act, alongside ination and output variations, inexchange rate deviations in order to maintain its objectiveof price stability but also to guarantee nancial stability,which reinforces the “fear of oating” hypothesis (Mohanty& Klau 2004).
Generally, the presence of the output gap and theexchange rate variation in the Central Bank rule expressesthe concern of this institute regarding the lack of a pricestability announced objective. This case often applies forsmall opened economies where an excessive variation ofactivity or exchange rate considerably affects the inationrate.
As such, the Taylor rule expresses the behaviour of theCentral Bank in setting the interest rate which follows achange in correspondent variables. In general, the CentralBank raise their interest rates when the output gap increases(situation where current production is far from potentialproduction), the ination gap deepens (situation wherecurrent ination is far from its target value) and also whenthe exchange rate gap increases (situation where increasecomparing to ).
It follows that, once our model is estimated, the residualwhich are considered to be the shocks affecting the economy,
in the interval [0.1:10.1] by choosing a step of 0.1 and byrepeating 250 times. We hold the value of the coefcientswhich corresponds to the minimal loss function47.
To do so, we suppose that the money market rate (MMR)is the instrument of monetary policy while several CentralBanks (including the Maghrebian one) have not until nowdeveloped an ofcial policy rate. Moreover, most bankingrates are indexed in MMR, which reinforces our choice.We further suppose that f=1 in the three countries since– as mentioned above – the Central Banks have to gainin maintaining nancial stability and reducing uncertaintyby controlling interest rate volatility. Finally, we considerthat the potential growth rate over the period 1990-2006
is 5.5% for Tunisia, 5% for morocco and 4% for Algeriawhile the ination target over the same period is 3% forTunisia, 2.8% for Morocco and 3% for Algeria48.
The nal results of our optimisation are reported in thefollowing table49:
Table 6: Results of optimisation
Lossfunction
Tunisia 4.6 6.0 0.1 230.333Morocco 1.1 1.1 1.1 10.7745
Algeria 1.6 1.1 0.1 71.549
It follows that the optimal Taylor rule for each country canbe described as follows:
For Tunisia:

8/15/2019 African Single Currency
http://slidepdf.com/reader/full/african-single-currency 160/192
161
In our case, the non reactivity of the Maghrebian CentralBanks to this variable (exchange rate) shows that shocks areoften temporary. This hypothesis seems to be consolidatedin several works that show that Maghrebian exchange ratesare near their equilibrium value.
These results strongly support the idea that the Maghrebzone is heterogeneous and that this heterogeneity is theresult of differences in productive, nancial and institutionalstructure. It follows thus that, problems are likely to emergeif these countries decide to belong to a monetary union
However, even though there is strong heterogeneity, theMaghreb can draw numerous lessons from monetaryintegration experiences. These show that the movementtowards the creation of a regional monetary unionpresupposes certain conditions that would be necessary toensure the long term success of the monetary integrationprocess. The MC must opt for gradualism, deepening thenational and regional nancial integration, promotingthe banking competition, intensifying the banking sectorsolidity, diversifying the production notably through a
i l lib li ti (i d t d th ff t

8/15/2019 African Single Currency
http://slidepdf.com/reader/full/african-single-currency 161/192
if these countries decide to belong to a monetary unionwith a common conducted monetary policy. This wouldlikely prove a hindrance for all the countries and wouldcreate important costs as far as heterogeneity persist51.
CONCLUSION AND POLICYRECOMMENDATIONS
Starting from the idea that the European experience offersseveral lessons for countries looking to reinforce theirnancial and economic integration, this preliminary workallowed us to highlight the heterogeneity of MC and thedifculties of establishing a common monetary policy.
We have described rst of all the characteristics ofmonetary and exchange rate policies in the three countriesand explained their foundations. We then illustratedthis heterogeneity from a simple model reecting thecharacteristics of each country. It turned out that the extentof economic policies (monetary and exchange rate policy)on real variables differs between MC.
We then simulated national Taylor rules for each country.Our results suggest that the latter will not choose identicalmonetary rules to achieve their stabilization objectives.Tunisia has to grant more weight to ination, Morocco hasto grant a similar weight to ination, activity and exchangerate while Algeria has to grant more weight to activity.
It follows that the application of a unique monetary policyover the whole zone of Maghreb would not be benecialfor all countries.
commercial liberalization (in order to reduce the effectsof independence) as well as improving coordination ofnancial, monetary and exchange rate policies to guaranteethe success of Maghreb monetary integration process.
In the same vein, they have to outshine their politicalconicts and further improve their nancial and budgetarysituation.
162
REFERENCES:Achy L. & Sekkat K. (2000): «The European Single Currencyand MENA’s Manufactured Export to Europe» FemiseResearch Programme, June.Allen D. (2006): «Trade liberalization, factor market
exibility, and growth: The case of Morocco and Tunisia»World Bank Policy Research Working Paper 3857, March.Ball L. (1997): «Efcient rules for monetary policy» JohnsHopkins University, January.
March 2007.Bouoiyour J. Marimoutou V. et Rey S. (2004): «Taux dechange réel d’équilibre et politique de change au Maroc:une approche non paramétrique» Économie internationalen° 97 (1).Calvo G-A. & Reinhart C-M. (2000): “Fear of Floating”Mimeo, University of Maryland, January.Central Bank of Tunisia (2007): “Annual Report”.Dack J-V (1999): «Implementing monetary policy in

8/15/2019 African Single Currency
http://slidepdf.com/reader/full/african-single-currency 162/192
p y, yBall L. (1998): «Policy rules for open economies» ResearchDiscussion Paper 9806.Bangaké C, Belhadj A & Jedlane N (2007): «Toward MaghrebMonetary Unication: What does the theory and historytell us?” African Review of Money Finance and Banking,supplementary issue of Savings and Development, p7-37.Bangaké C, Desquilbet J.B & Jedlane N (2008) “Exchangerate regimes for small countries: an application to Maghrebcountries” chapter 9 in « Monetary Policy and CentralBanking in the Middle East and North Africa », Routledge,London, Forthcoming.Bank of Algeria (2007): “Annual Report”.Bank Al Maghrib (2007): “Annual Report”.Benbouziane M. & Benamar A. (2004): «The relationshipbetween money and prices in the Maghreb Countries:A cointegration analysis» 11th Annual Conference ofthe Economic Research Forum (ERF), Beirut – Lebanon –December 16-28.Bordo M.D. & Jonung L. (1999): “The future of EMU:
what does the history of monetary unions tell us?” NBERWorking Paper 7365.Boughrara A. (2003): «What do we know about monetarypolicy and transmission mechanism in Morocco and Tunisia»10th annual conference of the Economic Research Forum(ERF), Marrakech-Morocco-December 18-21.Boughzala M. Boughrara A. & Moussa H. (2007):«Credibility of ination targeting in Morocco and Tunisia»paper presented at Eight Mediterranean Social and PoliticalResearch Meeting, Florence and montecatini terme 21-25
emerging market economies: an overview of issues»Monetary policy operating procedures in emerging marketeconomies BIS Policy Papers n°5, March.Darrat A-F. & Pennathur A. (2002): “Are the Arab Maghreb
countries really integratable? Some evidence from thetheory of cointegrated systems”, Review of FinancialEconomics n°11.Domat I. & Shabsigh G. (1999): «Real exchange ratebehaviour and economic growth: Evidence from Egypt,Jordan, Morocco and Tunisia» IMF Working Papers 99/40,March.Dropsy V. & Grand N. (2004): «Exchange rate and ination
targeting in Morocco and Tunisia» Working paper,September.Durand & Payelle (1998): “Regles de politique monetaire etobjectif de PIB nominal. Application au cas francais», Revueéconomique, Vol. 49, No. 3.Dyer P. (2005): « Disponibilité de main-d’oeuvre, chômageet création », Banque mondiale, Table Ronde du Maghreb:Tunis, 24-25 mai.Emmonot C & Rey S. (2008): «Quelles sont les politiques dechange effectives du Maroc et de la Tunisie ?», EconomieAppliquée n°1.Eichengreen B. (2002): «Lessons of the Euro for the Rest ofthe World» Working Paper PEIF 2, University of California,December.Fanizza D. Laframboise N. Martin E. Sab R. & KarpowiczI. (2002): «Tunisia’s experience with real exchange ratetargeting and the transition to a exible exchange rate
163
regime» IMF Working Papers 02/190, November.Filosa R. (2001): «Monetary policy rules in some matureemerging economies» BIS Papers No 8.Finaish M. & Bell E. (1994): «The Arab Maghreb union» IMFWorking Papers 94/55, May.Freedman C. (1981): “Monetary aggregates as targets:some theoretical aspects», NBER Working paper seriesn°775.Goodhart C. (1995):”The Political Economy ofM U i ” Ch 12 i K P U d di
Economics 43 p 579-605.Mohanty M-S. & Klau M. (2001): «What determinesination in emerging market economies? BIS Papers No 8.Neaime S. (2007): «Monetary policy transmission andtargeting mechanisms in the MENA region: An empiricalinvestigation», paper presented at Eight MediterraneanSocial and Political Research Meeting, Florence andmontecatini terme 21-25 March 2007.Penot A. (2002): “ Appréciations et conséquences possiblesde l’hétérogénéité structurelle de la zone euro» Revue d›

8/15/2019 African Single Currency
http://slidepdf.com/reader/full/african-single-currency 163/192
Monetary Union” Chap 12 in Kenen P «Understandinginterdependence. The macroeconomics of the openeconomy».Haddou S. (2002): «Règles de rétro-action et réformes
monétaires: quelques propos sur le cas tunisien» Mondesen Développement, Tome 30, p118 – 79.Hallett A-H. & Weymark D-N. (2001): «The cost ofheterogeneity in a monetary union» Working PaperN°01-W28, December.Ilmane M-C (2006): «Réexions critiques sur la politiquemonétaire en Algérie: objectifs, instruments et résultats(2000–2004)» Cahier de CREAD, n°75/2006.
IMF (2004): «Monetary Policy Implementation at DifferentStages of Market Development» October 26.Juan (2007): «Financial Sector Reforms and Prospects forFinancial Integration in Maghreb Countries» IMF WorkingPaper 07/125, May.Koranchelian T (2004): The Equilibrium Real Exchange Ratein a Commodity Exporting Country: Algeria’s experience»IMF Working Paper n°135, July.Masson P. et Pattillo C. (2004): «Une monnaie unique pourl’Afrique?», Finance et Développement, Décembre.McCallum B-T (1994): “Monetary policy rules and nancialstability”, NBER Working paper series n°4692.McKinnon R & Schnabl G. (2004): “The East Asian DollarStandard, Fear of Floating, and Original Sin” Review ofDevelopment Economics , 8, 331-60.
Mishkin F-S. (1999): «International experiences withdifferent monetary policy regimes» Journal of Monetary
de l hétérogénéité structurelle de la zone euro», Revue d›Economie Financière, vol. 65(1), Avril.Penot A & Pollin J-P (1999): “Construction d’une règlemonétaire pour la zone euro», Revue Economique, vol.50(3), Mai.Penot A. Pollin J-P et Seltz V (2001): «Hétérogénéité de lazone euro et politique monétaire unique» document derecherche.Sorsa P. (1999): «Algeria: the real exchange rate, exportdiversication and trade protection» IMF Working Paper99/49, April.Tahari A, Brenner P, De Vrijer E, Moretti M, Senhadji A,
Sensenbrenner G & Solé Talor J. (1993), « Discretion versusPolicy Rules in Practice », Carnegie-Rochester ConferenceSeries on Public Policy, vol. 39, December, pp. 195-214.Taylor J. (1998a): «The robusteness and efciency ofmonetary policy rules as guidelines for interest rate settingby the European Central Bank» Institute for internationaleconomic studies, Stockholm University, August.Taylor J. (1998b): « An Historical Analysis of Monetary Policy
Rules », NBER Working Paper Series, n° 6768, October.Treichel V. (1997): «Broad money demand and monetarypolicy in Tunisia» IMF Working Papers 97/22, March.Woodford M. (1999): “The Taylor Rule and OptimalMonetary Policy” The American Economic Review, Vol. 91,No. 2, Papers and Proceedings of the Hundred ThirteenthAnnual Meeting of the American Economic Association,(May, 2001), p 232-237World Bank (2006): «Is there a new vision for Maghreb
164
End Note
economic integration?» Volume I: Main Report, Socialand Economic Development Group Middle East and NorthAfrica Region, November.Zouache A. & Ilmane M-C (2007): «Central Bankindependance and monetary policy in a MENA transitioneconomy: the experience of Algeria» chapter 5 in «
Monetary Policy and Central Banking in the Middle Eastand North Africa », Routledge, London, Forthcoming.
1 Our sample is limited to Algeria, Morocco and Tunisia.2 The CBT inserts in the denition of M2 the anticipation of prices,
products and the velocity of this aggregate.3 The distinction between the two instruments is a little bit vague. For
further details, see Dack (1999).4 The 3 months allowance uptake of treasury bonds was introduced in
2001.5 It is useful to note that the CBT continue his rising of the reserve
requirement rate given the prevailing situation of excess of liquidity ofthe Tunisian money market (CBT 2007).6 Article 33 of the law n°2006-26 of 15 May 2006 modifying the law
n°1958-90 of 19 September 1958 relating to the creation and theorganization of CBT.
7 The depreciation of the nominal exchange rate could lead to an increase

8/15/2019 African Single Currency
http://slidepdf.com/reader/full/african-single-currency 164/192
7 The depreciation of the nominal exchange rate could lead to an increasein the price of foreign goods (and/or a revision in the increase of theination expectations concerning the price of domestic goods), whichcan feed inationary pressures.
8 Until 2006, the aggregate target was M1, but, with the great instabilityof this aggregate (privatization operations, tourist receipts, foreignworkers’ remittances), the Central Bank chose M3 aggregate.
9 This excess of liquidity was often attributed to the increase of net outsideassets of Central Bank due to selling of 35% of the capital of MarocTélécom, favourable increase of tourist receipts as well as increase offoreign workers remittances.
10 They are call for tender, facility of deposit and facility of lending rates.11 For further details, see BAM (2007).12 Besides, Mussa et al (2000) consider that the anchoring to a basket of
money which represents the main trading partners remains better thanclose money anchoring.
13 This stagation was the result of a historical fall of hydrocarbon pricesof the middle 1980s and a deterioration of the socio-political situationin the early 1990s.
14 It was more a question of cancelling the inationary drift due toimportant adjustment of the dinar exchange rate combined to aliberalization of many prices (Ilmane 2006).
15 The consideration of the activity objective is reected by the fact thatthe ination target which the Central Bank have to control is denedin compatibility with a certain growth rate of the economy.
16 According to Ilmane (2006), the real operational objective which BAcould master in that time was its «internal assets » post.
17 This technique was used at the same time as rediscount, but within thelimits of the xed ceilings.18 This instrument was effectively used from 2001.19 These operations were used solely two times during the second half
of 1990s.20 The objective of stabilization was not excluded but BA took the
political liberty by only taking care for price stability as nal objectiveof monetary policy.
21 This appreciation coincides with the structural adjustment periodand may be due to productivity growth and administrative priceadjustments (Sorsa 1999).
22 Koranchelian T (2004): The Equilibrium Real Exchange Rate in aCommodity Exporting Country: Algeria’s experience» IMF Working
165
Paper n°135, July.23 Many empirical studies have tried to explain the heterogeneity of a
zone by putting in place a series of macroeconomic variables. For asurvey, see Penot (2002).
24 This methodology was adopted in many works such as Durand &Payelle (1998), Freedman (1981), McCallum (1994), Penot & al (2001),Penot & Pollin (1999) …
25 The choice of this period is imposed by the fact that, in these countries,
the liberalization process started only in the early 1990s.26 The REER is dened as follows: ( arethe price of domestic goods and the price of foreign goods). Anincrease in REER is synonymous with appreciation.
27 We consider that the hypothesis of Stock and Watson (1999) is veried(th t ti l i ti it i t t th h t t i d)
41 This result joins many works which mention the absence of Balassa-Samuelson effect, especially in the case of Algeria.
42 This result can also reect the exibility of Tunisian monetary authoritiesin the application of real exchange rate target rules. Ination iscorrected by a more important nominal devaluation, which nallyleads to a depreciation of the real exchange rate.
43 The form of this loss function is:We
suppose that each element in the loss function is identically weighted,which means that . This function express the willing-ness of the monetary authorities to reduce ination uctuations, out-put gap and exchange rate variations in accordance with their objec-tives. The existence of interest rate in the loss function is justied bythe fact that most efcient rules in term of activity stabilisation and
8/15/2019 African Single Currency
http://slidepdf.com/reader/full/african-single-currency 165/192
(the potential economic activity is constant over the short term period)and that the activity, rather then the output gap, affect the ination.
28 It is the effect of imported ination in an opened economy.29 For the non stationary variables (real exchange rate and real money
rate), variables in difference are stationary. The results of correspondentDF tests are not reported here. Our thresholds of signicance arerespetively 1%, 5% and 10%.
30 *** Signicant at the 1% level. ** Signicant at the 5% level. *Signicant at the 10% level. Model (1): Without Constant and Trend.Model (2): With Constant. Model (3): With Constant and Trend.
31 We transfer the results of DF test to the residual series obtained fromthe regression of real money rate over the real exchange rate. Ourthresholds of signicance are respectively 1%, 5% and 10%.
32 Model (1): Without Constant and Trend. Model (2): With Constant.Model (3): With Constant and Trend.
33 Hassler (1996): «Spurious regression when stationary regressors are
included» Economic letters 50 p25-31.34 Generally, lag length criteria such as Akaike and Schwartz statistic arenot without shortcomings and should be used more as a guide thanas uncompromised rules.
35 However, these results and the interpretations which follow remaindependent on the degree of signicance of the estimated parameters(see below).
36 Non signicant coefcients are not transferred here, unless they areabout one lag. *** Signicant at the 1% level. ***signicant at the5% level. *signicant at the 10% level.
37 Estimation can also be done by using panel technique but, in our case,we have only few observations.38 However, a detailed analysis concerning the respective position ofintermediation and markets, interest rate indexation practices, shareof short term credits compared to the long term… in the Maghreb willbe interesting in this frame.
39 Furthermore, investigation elds concerning the functioning of theMaghrebian labour market, such as the nature of wage negotiation,legal setting, active and passive employment policies, are importantin this frame.
40 It is useful to note that the weakness of this effect in the case of Algeriamay also translate the bad representation of the total production bythe industrial production. This bad representation can be attributed toa weak industrialization of this country.
the fact that most efcient rules in term of activity stabilisation andination control generate very high interest rate variations. For furtherdetails on the shape of the loss function in a closed economy, seePenot & al (2001), Woodford (2001).
44 This rule displayed many improvements such as the incorporation oftargeted variables in the form of expected ination.
45 The price of nancial securities is not taken into account here. Weconsider that the quasi absence of nancial market role in theseeconomies make monetary policy inactive toward a shift in price assets.
46 We consider that the fact of integrating the exchange rate in theCentral Bank rule may be useful. However, this hypothesis must beapproached cautiously.
47 This methodology is subject to Lucas criticism.48 These numbers are approximate but close to the authorities’ statements.
See also the IMF and European Commission reports.49 These results can be confronted with two types of instabilities: on the
one hand, because weight assigned to ination, activity and exchangerate changed during the period of estimation and on the other handbecause the reaction function of the central bank is «backwardlooking» and is not simulated according to expected variables (referto Lucas criticism 1976).
50 It is interesting to reconsider the results by taking a Taylor rule on whichthe exchange rate does not gure.
51 In this respect, an evaluation of the effects of introducing a commonmonetary policy, by identifying a Taylor rule for the whole area couldbe fruitful.

8/15/2019 African Single Currency
http://slidepdf.com/reader/full/african-single-currency 166/192
CRÉATION DE LA MONNAIE UNIQUE EN AFRIQUE:
L’expérience de l’Afrique de
l’OuestPar Prof Mohamed Ndiaye, Agence Monétaire de l’Afrique de l’Ouest (AMAO)
C 175170

8/15/2019 African Single Currency
http://slidepdf.com/reader/full/african-single-currency 167/192
on t e n t s
175EXAMEN DES DIFFERENTS
VOLETS DU PCMC
185EXAMEN DES DIFFERENTES
OPTIONS VISANT À ACCELERERLE PROCESSUS DE CREATION
DE LA MONNAIE UNIQUE DE LACEDEAO
187PERSPECTIVES
188CONCLUSION ETRECOMMANDATIONS
170RESUME ET
RECOMMANDATIONS
172INTRODUCTION
173PRESENTATION DE LA
COMMUNAUTE ECONOMIQUEDES ETATS DE L’AFRIQUE DE
l’OUEST (CEDEAO)
174LE PROGRAMME DE
COOPERATION MONETAIRE DELA CEDEAO (PCMC)
168
RESUME ET RECOMMANDATIONS
L’accélération de la mondialisation de l’économie constituel’une des caractéristiques majeures des mutations de cesdernières années. Ce phénomène, appelé à s’intensier, est
générateur d’opportunités considérables pour les agentséconomiques les plus performants et pour les Etats quiauront rendu leur espace économique attractif pour lesinvestisseurs nationaux comme étrangers. A contrario, elleest porteuse de risques pour les autres opérateurs et lesEtats qui ne se seront pas adaptés à la nouvelle donne,’ à d é i i d i li i A
conditions économiques et nancières soient réunies avantle lancement de la monnaie unique. De ce fait, la viabilitéet la stabilité de la future monnaie seront mieux garanties.
Par ailleurs, des interrogations se rapportent à l’efciencede la zone monétaire de la CEDEAO, à son optimalité auxregards des critères classiques, et parfois aux résultats
mitigés enregistrés en matière de convergence deséconomies. En effet, l’évolution de la CEDEAO et les thèses sur les unions monétaires optimales semblent indiquerque les pays membres des deux zones économiques de laCEDEAO (UEMOA et ZMAO) ne connaissent pas encore les

8/15/2019 African Single Currency
http://slidepdf.com/reader/full/african-single-currency 168/192
s’exposant à de sérieux risques de marginalisation. A cetégard, il importe de souligner qu’en Afrique, un consensuscommence à émerger sur les vertus de l’intégrationmonétaire, désormais, considérée comme un amortisseurefcace des effets systémiques éventuels du processus de globalisation nancière. C’est dire que, dans le cas de laCEDEAO (comme en Afrique) une intégration monétaireeffective, sans toutefois en constituer une condition
sufsante, est une exigence qui serait de nature à favoriserune accélération du processus d’intégration des économiesdes pays membres, dont force est de reconnaître que lebilan est mitigé, trente trois (33) ans après la signature, en1975, de son traité constitutif.
Toutefois, au regard des aspects fondamentaux del’intégration régionale, l’espace CEDEAO se présenteaujourd’hui comme une zone économique assez bienorganisée lorsqu’on la compare à d’autres communautéséconomiques régionales en Afrique. En effet, depuis sacréation en 1975, la CEDEAO a réalisé des étapes importantesdans la matérialisation de l’intégration économique.
Cependant, la CEDEAO éprouve encore des difcultésdans le cadre de la réalisation de l’intégration monétairemalgré l’adoption il y a plus de vingt ans du Programmede Coopération Monétaire de la CEDEO (PCMC) et endépit d’une volonté évidente d’accélérer la création de lamonnaie unique régulièrement renouvelée par les leaders
politiques de la région.
Le retard enregistré dans la création de l’Union monétairede la CEDEAO est principalement lié au fait que lesdirigeants de la région ont tenu à s’assurer que toutes les
CEDEAO (UEMOA et ZMAO) ne connaissent pas encore lesefciences attendues de l’intégration économique.
En présence de ses nombreuses interrogations et inquiétudesquant à l’avenir de la zone monétaire de la CEDEAO, ilimporte de faire l’état de l’expérience de la Communautééconomique des états de l’Afrique de l’ouest (CEDEAO)en matière d’intégration monétaire avant de projeter unevision sur l’orientation de l’intégration monétaire dans laCEDEAO vers l’intégration monétaire africaine.
Ce document retrace les expériences vécues dans le cadre duProgramme d’intégration monétaire de la CEDEAO depuis
sa mise sur pied, en 1987, en espérant que ces expériences seront protables à d’autres sous-régions d’Afrique. Il donneune vue d’ensemble du processus d’intégration monétaireen Afrique de l’Ouest avant d’exposer les objectifs du
programme. Ensuite, il met en exergue l’état d’avancementdes différents volets du programme, en soulignant, bien
sûr, les obstacles qui entravent sa mise en œuvre mais aussiles mesures prises pour faciliter la réalisation de l’objectifultime. Enn il dégage une vision sur l’orientation de
l’intégration monétaire dans la CEDEAO.Comme indiqué plus haut, la stratégie d’accélération a tiréen longueur, suscitant ainsi des inquiétudes par rapport à lalenteur de la mise en œuvre du programme de coopérationmonétaire.
Après avoir exprimé son insatisfaction devant la lenteurde la mise en œuvre, la Conférence des Chefs d’États, ena appelé, à l’occasion de son sommet du 15 juin 2007 à
Abuja, à une révision de la stratégie d’accélération, laissant
169
la porte ouverte à son éventuel remplacement par uneapproche unique. Dans ce contexte, le Secrétariat conjointde l’AMAO et de la commission de la CEDEAO a réuni lesinstitutions régionales an d’étudier les propositions surles options alternatives que sont: l’approche de la voieunique, l’approche Big Bang, l’approche de l’adhésion àl’UEMOA, l’approche de l’élargissement du Projet de ZMAOet l’approche de la Masse Critique.
Aujourd’hui l’AMAO se propose de rééchir sur un PlanStratégique visant l’accélération du processus d’intégrationmonétaire en Afrique de l’Ouest. Ce Plan stratégique
Afrique ne sont pas insurmontables. Avec l’adoptiond’une bonne gouvernance économique et politique parnos pays respectifs et avec l’option résolue en faveur dela coopération régionale, appuyée par un engagementnational idoine, nous avons bon espoir de pouvoir accélérerle rythme de développement du continent africain pour lebien-être de nos peuples.
Dans la perspective de l’actuelle mondialisation rapide dela structure économique du monde, les régions africainesn’ont d’autres alternatives que de pousser de l’avant àl’aide de nos programmes de coopération et d’intégration

8/15/2019 African Single Currency
http://slidepdf.com/reader/full/african-single-currency 169/192
q g qindique que le processus de création monétaire passeranécessairement par différentes phases notamment une
période de stabilisation des taux de change et une étapede passage à la monnaie unique assortie d’un calendrier
précis. L’adoption du cadre juridique va concerner la préparation de l’ensemble des documents, instrumentset procédures pour la mise en place de la zone monétaireunique de la CEDEAO, et les reformes institutionnelles
porteront essentiellement sur la mise en place du ConseilMonétaire, la création de la Banque centrale de la CEDEAOet des autres institutions nancières pertinentes.
L’Agence Monétaire de l’Afrique de l’Ouest (AMAO) estd’avis que ce genre de réunions organisées au niveauinternational constitue le cadre idéal pour des échangesd’idées et d’expériences sur une base périodique, d’autant
plus qu’elles offrent un mécanisme d’apprentissage utile pour faciliter la réalisation effective de l’intégration desdifférents programmes sous-régionaux du continentafricain.
Ainsi, dans sa communication faite à l’occasion de cePremier Congrès des Economistes africains, l’AMAO a procédé à l’analyse approfondie des expériences spéciquesdu Programme de coopération monétaire de la CEDEAO.Les contraintes ne sont pas particulières à la sous-régionouest-africaine, car on constate que la plupart des pays ducontinent africain ont des caractéristiques économiques et
sociales similaires.
Les difcultés rencontrées dans la plupart des regroupements pour l’intégration et la coopération sous-régionales en
p g p grégionales. Si les «géants» pays du Nord ont senti lanécessité de renforcer leur coopération, les pays du Suddevront trouver les stratégies idoines pour surmonter nosdifcultés et développer nos économies an de restercompétitifs dans l’arène internationale.
Ainsi, pour la mise en place de la monnaie commune en Afrique, un certain nombre de recommandations peuventêtre formulées.i. D’abord, il faut nécessairement élaborer un Plan
d’Actions. Il s’agira particulièrement:• D’élaborer un Programme précis pour la création de
la monnaie commune en Afrique;• De dénir les tâches et actions fondamentales
(prioritaires) pour la création de la monnaie communeen Afrique: parmi lesquelles toutes les tâchesd’harmonisation des statistiques, des systèmes depaiements, des politiques économiques, etc.;
• De xer des échéances (un agenda) pour chacune destâches ou action à entreprendre dans le processus;
• De constituer des Groupes de travail composésde spécialistes qui peuvent venir de toutesles composantes de la société (AutoritésGouvernementales, Banques, Université, Syndicat,etc.).
ii. Par ailleurs, il serait utile de revoir certaines considérationssur les principes de base du processus d’intégrationmonétaire actuel en Afrique particulièrement et travaillersur une stratégie commune et précise de coopération
170
monétaire en Afrique. Ces (deux) principes de base seretrouvent dans:
• L’Analyse faite sur les critères de reconnaissance d’unezone monétaire optimale: Ici, il faut comprendrequ’aucune zone monétaire ne peut être optimaleau regard des critères traditionnels et modernes de
reconnaissance d’une zone monétaire optimale. Detels critères, qui dénissent un cadre de référencethéorique, constituent des conditions idéalesvers lesquelles il est souhaitable de diriger l’unionmonétaire, laquelle ne les attendra pas forcément;
(au chapitre des harmonisations) à l’harmonisation oula fusion des systèmes de paiements des différents paysou zones économiques africaines. Pour atteindre cetobjectif, les actions suivantes sont à entreprendre:
• La modernisation des systèmes de télécommunicationà travers une technologie de pointe permettant la
promotion des paiements scripturaux, l’utilisation deplus en plus accrue et facile du système bancaire parles opérateurs économiques et le grand public;
• Le développement des infrastructures de transportet de production d’électricité sans lesquelles la
8/15/2019 African Single Currency
http://slidepdf.com/reader/full/african-single-currency 170/192
• Les exigences en termes de respect des critères deconvergence macroéconomique: dans ce cas, il estimportant d’étudier la pertinence des critères deconvergence. En d’autres termes, il serait nécessairedans ce processus de déterminer le niveau deconvergence (ou de divergence) idéal (acceptable)pour nos économies. La convergence à l’absolue,c’est-à-dire la convergence de tous les pays à la foissur une plus ou moins longue période, est quasimentirréalisable. Tout en ayant à l’idée la nécessité d’unediscipline collective, il faut considérer la convergencecomme un processus continu même au-delà del’établissement de la monnaie commune, mais nonune condition strictement obligatoire sans laquelle(sans l’atteinte des cibles par tous les pays), toutprocessus de création monétaire est impossible.
iii.Evaluer la pertinence du modèle d’intégration régionalebasé sur le développement des échanges (modèleprivilégié actuellement) par rapport au modèle fondé surle développement du secteur nancier (et des services).
Cette seconde option permettrait, par le développementde la nance (libéralisation du capital), de stimuler laproduction par exemple.
iv.Donner davantage de l’importance au rôle que lamonnaie peut jouer dans nos économies.
v. Eviter autant que possible la création d’une monnaie(sous-régionale) et ou d’institutions transitoires, decourte durée et coûteuse.
vi.A moyen ou long terme, il faut impérativement procéder
p qpromotion des systèmes de paiement serait aléatoire;
• L’interconnexion du réseau bancaire de la sous-régionen vue de faciliter les paiements transfrontaliers;
• Le renforcement de la lutte contre la pauvreté dansnos pays ainsi que l’éducation et la formation despopulations à l’utilisation du système bancaire etnancier;
• La sensibilisation et l’incitation des opérateurs dusecteur informel à l’utilisation du secteur bancaire àtravers, entre autres, l’allègement des procédures, laréduction des charges, la formation.
INTRODUCTION
L’accélération de la mondialisation de l’économie constituel’une des caractéristiques majeures des mutations de cesdernières années. Ce phénomène appelé à s’intensier estgénérateur d’opportunités considérables pour les agentséconomiques les plus performants et pour les Etats quiauront rendu leur espace économique attractif pour lesinvestisseurs nationaux comme étrangers. A contrario, elleest porteuse de risques pour les autres opérateurs et lesEtats qui ne se seront pas adaptés à la nouvelle donne,s’exposant à de sérieux risques de marginalisation. A cetégard, il importe de souligner qu’un consensus commence àémerger sur les vertus de l’intégration monétaire régionale,désormais considérée comme un amortisseur efcace deseffets systémiques éventuels du processus de globalisationnancière. C’est dire que, dans le cas de la CEDEAO,une intégration monétaire effective, sans toutefois en
171
constituer une condition sufsante, est une exigence quiserait de nature à favoriser une accélération du processusd’intégration des économies des pays membres, dont forceest de reconnaître que le bilan est mitigé, trente trois (33)ans après la signature, en 1975, de son traité constitutif.
Toutefois, au regard des aspects fondamentaux de
l’intégration régionale, l’espace CEDEAO se présenteaujourd’hui comme une zone économique assez bienorganisée lorsqu’on la compare à d’autres communautéséconomiques régionales en Afrique. En effet, depuis sacréation en 1975, la CEDEAO a réalisé des étapes importantesd l é i li i d l’i é i é i
CEDEAO.
Ce document retrace les expériences vécues dans le cadre duProgramme d’intégration monétaire de la CEDEAO depuissa mise sur pied, en 1987, en espérant que ces expériencesseront protables à d’autres sous-régions d’Afrique. Il donneune vue d’ensemble du processus d’intégration monétaire
en Afrique de l’Ouest avant d’exposer les objectifs duprogramme. Ensuite, il met en exergue l’état d’avancementdes différents volets du programme, en soulignant, biensûr, les obstacles qui entravent sa mise en œuvre mais aussiles mesures prises pour faciliter la réalisation de l’objectif
l i E il dé i i l’ i i d

8/15/2019 African Single Currency
http://slidepdf.com/reader/full/african-single-currency 171/192
dans la matérialisation de l’intégration économique.
Cependant, la CEDEAO éprouve encore des difcultésdans le cadre de la réalisation de l’intégration monétairemalgré l’adoption il y a plus de vingt ans du Programmede Coopération Monétaire de la CEDEO (PCMC) et endépit d’une volonté évidente d’accélérer la création de lamonnaie unique régulièrement renouvelée par les leaderspolitiques de la région.
Le retard enregistré dans la création de l’Union monétairede la CEDEAO est principalement lié au fait que lesdirigeants de la région ont tenu à s’assurer que toutes lesconditions économiques et nancières soient réunies avantle lancement de la monnaie unique. De ce fait, la viabilitéet la stabilité de la future monnaie seront mieux garanties.
Par ailleurs, des interrogations se rapportent à l’efciencede la zone monétaire de la CEDEAO, à son optimalité auxregards des critères classiques et parfois aux résultats mitigésenregistrés en matière de convergence des économies. Eneffet, l’évolution de la CEDEAO et les thèses sur les unionsmonétaires optimales semblent indiquer que les paysmembres des deux zones économiques de la CEDEAOne connaissent pas encore les efciences attendues del’intégration économique.
En présence de ses nombreuses interrogations et inquiétudesquant à l’avenir de la zone monétaire de la CEDEAO, ilimporte de faire l’état de l’expérience de la Communautééconomique des états de l’Afrique de l’ouest (CEDEAO)en matière d’intégration monétaire avant de projeter unevision sur l’orientation de l’intégration monétaire dans la
ultime. Enn il dégage une vision sur l’orientation del’intégration monétaire dans la CEDEAO.
PRESENTATION DE LA COMMUNAUTEECONOMIQUE DES ETATS DE L’AFRIQUE DEl’OUEST (CEDEAO)
L’accélération de la mondialisation des économies ainsi quela perception par les Chefs d’Etat et de Gouvernement dela sous-région ouest africaine de la nécessité de s’organiserpour mieux faire face à ce phénomène, ont décidé, enmai 1975, de créer la Communauté Economique desEtats de l’Afrique de l’Ouest (CEDEAO). L’objectif visépar cette communauté étant de renforcer la coopérationentre ses Etats membres, dans la perspective de créationd’une union économique et monétaire pouvant contribuerà relever le niveau de vie de ses populations à travers undéveloppement accru de leurs échanges. A cet effet, leTraité portant création de la CEDEAO a prévu, entres autres,la libéralisation des échanges, la création d’une union
douanière et d’un marché commun etc.A l’heure actuelle, deux institutions sous-régionales,l’UEMOA et la ZMAO, fonctionnent et sont toutes partiesprenantes au programme global de création d’une monnaieunique pour la CEDEAO piloté par l’AMAO. Elles disposentde leur propre organisation institutionnelle comprenant,selon le cas, un Comité technique, un Comité desGouverneurs, un Conseil d’Administration, un Conseil de
convergence, un Conseil des ministres et une Conférencedes chefs d’Etat et de Gouvernement.
172
En marge de ces deux grandes zones (UEMOA et ZMAO),nous avons le Cap Vert et le Liberia qui continuent, bienqu’étant membres de la CEDEAO, d’évoluer séparémentpour des raisons diverses.
L’Union Economique et Monétaire Ouest Africaine(UEMOA)
Comme rappelé plus haut, la majorité des pays francophonesd’Afrique de l’Ouest (Bénin, Burkina-Faso, Côte d’Ivoire,Guinée Bissau, Mali, Niger, Sénégal et Togo) ont préféré resterdans la zone franc1 après leur indépendance. C’est dans ce
UEMOA dans le cadre d’un ensemble plus élargi d’unionmonétaire de la CEDEAO.
LE PROGRAMME DE COOPERATION MONETAIDE LA CEDEAO (PCMC)
Les Chefs d’Etat et de Gouvernement ont lancé l’idée desa création en mai 1983 à Conakry en Guinée. Ainsi ont-ilsdécidé de lui consacrer toute l’attention nécessaire en tantqu’étape essentielle de l’intégration. Ainsi, un Programmede coopération monétaire fut institué, en juillet 1987, avecl’objectif ultime de création d’une monnaie unique gérée
8/15/2019 African Single Currency
http://slidepdf.com/reader/full/african-single-currency 172/192
cadre que l’Union Monétaire Ouest Africaine (UMOA) a étémis en place en 1962. Ce nouveau mécanisme monétaire,placé sous les auspices de la France, a été renforcé par
la suite et son champ d’application étendu à d’autrescomposantes de la politique économique, conduisant àla création de l’Union économique et monétaire ouest-africaine (UEMOA) en 1994
La Zone Monétaire de l’Afrique de l’Ouest (ZMAO)
L’idée de création de la Zone Monétaire de l’Afrique del’Ouest (ZMAO) dérive, principalement, des résultats de
la revue effectuée en 1999 du PCMC qui a fait le constatde la faiblesse des progrès réalisés dans sa mise en œuvre.En effet, les Etats membres avaient d’énormes difcultés àatteindre les objectifs quantitatifs et qualitatifs nécessairesà toute intégration monétaire crédible et les contrastesqui existaient entre les performances des différents paysétaient très marqués. C’est ce qui a amené les Chefs d’Etatet de Gouvernement de la CEDEAO, lors de leur 22èmeSommet tenu en Décembre 1999 à Lomé, au Togo, àdécider de l’abandon de la stratégie d’une convergenced’ensemble, jusqu’alors observée, pour opter pour unestratégie d’approche accélérée ou «fast track» en matièred’intégration monétaire. La conséquence de cette décisionfut la prorogation de l’échéance de la date de création dela monnaie unique de 2000 à 2004. Suite à cette création,l’Institut Monétaire de l’Afrique de l’Ouest (IMAO) a étémis en place en janvier 2001 à Accra, au Ghana, en vue
d’exécuter un programme spécial visant à rendre cette zonerelativement homogène et prête à fusionner avec la zone
l objectif ultime de création d une monnaie unique géréepar une Banque centrale commune.
Contexte historique du PCMC
Historiquement, l’intégration économique et monétairede l’Afrique de l’Ouest remonte à l’ère coloniale. Avant lesindépendances, les territoires coloniaux (anglophones etfrancophones) étaient liés à leurs métropoles respectivespar des arrangements monétaires qui leur permettaientd’utiliser la même monnaie sur un espace commun. Ainsi,dans l’espace anglophone, la Gambie, le Ghana, le Nigeriaet la Sierra Leone, étaient régis par un arrangement concluavec la West African Currency Board, qui était géréepar la Grande Bretagne et avait en charge l’émission et leremboursement de la Livre Sterling en billets de banque et enpièces dans ces quatre pays. Quant aux pays francophonesde la sous-région, en l’occurrence le Bénin (Dahomey àl’époque), le Burkina Faso (ancienne Haute-Volta), la Côted’Ivoire, la Guinée, le Mali, le Niger, le Sénégal et le Togo, ilsavaient un arrangement similaire avec la France qui reposait
sur l’utilisation du franc CFA comme monnaie commune deleur espace.
Toutefois, l’arrangement des pays anglophones fut suppriméau début des années 1960 au lendemain des indépendancestandis que l’arrangement des pays francophones s’étaitconsolidé et même transformé en union monétaire en1962. La Guinée s’est retiré du système, en 1960, pourcréer sa propre monnaie. Par contre, la Guinée Bissau, pays
lusophone, y a adhéré et est membre, à part entière, decette union depuis1997.
173
Objectif du Programme de Coopération Monétaire de laCEDEAO (PCMC)
Le Programme de coopération monétaire de la CEDEAO(PCMC) vise comme objectif ultime la création d’une zonemonétaire utilisant une monnaie unique gérée par unebanque centrale commune.
Ceci, à travers l’adoption, par ses membres, de mesuresassurant une convergence des politiques économiquesnationales et facilitant la mise en place d’un systèmemonétaire et nancier harmonisé et d’institutions degestion communes A ce titre les pays membres se doivent:
b. le Comité de suivi technique, constitué desdirecteurs des études des Banques centraleset les hauts responsables des ministères desFinances, qui est responsable de l’établissementde rapports semestriels sur les performancesmacroéconomiques des Etats membres aux fins de
présentation au Conseil de convergence;c. l’Agence Monétaire de l’Afrique de l’Ouest
(AMAO) et la Commission de la CEDEAO, qui sontconjointement responsables de la compatibilité du
programme de convergence mis en œuvre par lesEtats membres; et

8/15/2019 African Single Currency
http://slidepdf.com/reader/full/african-single-currency 173/192
gestion communes. A ce titre, les pays membres se doivent:• de respecter les critères de convergence
macroéconomique établis;• d’harmoniser leurs politiques budgétaires, monétaireset nancières;• d’harmoniser leurs règlementations en matière de
taux de change et d’adopter un régime de changedéterminé par le marché;
• de créer un marché communautaire efcace grâceà la libéralisation des échanges, en supprimant lesbarrières tant tarifaires que non tarifaires;
• de libéraliser leurs marchés monétaires et de capitauxet de faciliter la création de bourses régionales devaleurs mobilières an de stimuler l’épargne et lacroissance.
An d’atteindre l’objectif d’intégration monétaire, unmécanisme de surveillance multilatérale a été mis en placeen vue d’assurer une coordination très étroite des politiques
économiques des Etats membres et la convergence deséconomies nationales (Décision A/DEC.17/12/01 du 21décembre 2001 de la Conférence des Chefs d’Etat et deGouvernement des pays membres de la CEDEAO). Lesorganes du mécanisme sont les suivants:
a. le Conseil de convergence, comprenant lesMinistres des Finances et les Gouverneurs desBanques Centrales, qui a vocation à assurer le suivides politiques et performances macroéconomiques;
Etats membres; et d. les Comités Nationaux de Coordination qui aident
l’AMAO et la CEDEAO à recueillir et à traiter lesdonnées portant sur les Etats membres.
EXAMEN DES DIFFERENTS VOLETS DU PCMC
Les différents volets du Programme de CoopérationMonétaire de la CEDEAO peuvent, d’une façon générale,être classés comme suit: les conditions de convergencemacroéconomique; le mécanisme de surveillancemultilatérale CEDEAO; le mécanisme de change CEDEAO
et l’intégration des systèmes de paiement au sein de laCEDEAO.
Convergence macroéconomique
La convergence macroéconomique, qui est une composanteessentielle du Programme de coopération monétaire de laCEDEAO (PCMC), accorde la priorité aux domaines suivants:la stabilité des prix, l’assainissement des nances publiques,la maîtrise du nancement monétaire du décit public etle maintien de niveaux appropriés de réserves extérieuresbrutes2.
Le respect des critères permet d’évaluer les progrès en vuede la réalisation de la convergence macroéconomique. Lescritères de convergence adoptés par la Conférence deschefs d’Etat et de Gouvernement sont classés en critèresprimaires et secondaires3, comme suit:
174
Critères primairesi. Ratio du décit budgétaire/PIB (hors dons) ≤ 4 pour
cent;ii. Taux d’ination ≤ 5 pour cent;iii. Financement des décits budgétaires par la Banque
centrale ≤ 10 pour cent des recettes scales del’année précédente;
iv. Réserves extérieures brutes ≥ 6 mois de couverturedes importations.
Critères secondaires
Ainsi fut adoptée l’initiative accélérée ou double approchedans le cadre de la mise en œuvre du PCMC. L’approcheaccélérée repose sur une stratégie de création d’uneseconde union monétaire (ZMAO) transitoire appeléeà fusionner avec l’UEMOA, à terme, pour former uneunion monétaire plus large regroupant l’ensemble desquinze pays de la CEDEAO. Pour le moment, le lancementde la monnaie unique de la ZMAO n’a pas encore pu sefaire, la mise en circulation de la monnaie unique de laseconde zone, l’ECO, a été reportée à plusieurs reprises.La persistance des problèmes budgétaires et l’instabilitépolitique ont été identiées comme étant des obstacles
j à l é li i d l

8/15/2019 African Single Currency
http://slidepdf.com/reader/full/african-single-currency 174/192
i. Interdiction d’accumuler de nouveaux arriérés etapurement de tous les arriérés existants;
ii. Ratio recettes scales/PIB ≥ 20 pour cent;iii. Ratio masse salariale/recettes scales totales ≤ 35
pour cent;iv. Ratio investissement public nancé par les
ressources internes/recettes scales ≥ 20 pour cent;v. Taux d’intérêt réel positif; etvi. Stabilité du taux de change réel.
Le bilan de l’exécution du PCMC, effectué en 1999, arévélé que des progrès, certes, ont été accomplis au titrede la convergence macroéconomique mais que ceux-ciétaient insufsants pour assurer le lancement de l’unionmonétaire en 2000. Hormis le problème de l’instabilitémacroéconomique et l’incidence des chocs externes, leproblème de l’instabilité politique, dans certains pays,a guré au nombre des facteurs qui ont sous-tendu cesrésultats modestes.
Aussi, la Conférence des chefs d’Etat et de Gouvernement,au cours de sa session tenue à Lomé en décembre 1999,a-t-elle décidé de repousser l’échéance de 2000 à 2004.A cette même occasion, la Conférence a adopté uncertain nombre de mesures visant à accélérer le processusd’intégration, notamment l’intensication du processusde convergence macroéconomique et l’adoption d’uneapproche dite accélérée pour la mise en œuvre rapide duprocessus d’intégration.
majeurs à la réalisation de la convergence.
La prédominance des problèmes budgétaires constituela plaie qui gangrène l’environnement macroéconomique,entraînant l’incapacité des Etats membres à satisfaire auxcritères de convergence arrêtés. La taille trop souventimportante des décits budgétaires nuit à l’épargneet à l’investissement nationaux, au compte courantet à l’efcacité de la politique monétaire. Le mode denancement du décit met en lumière des différents typesde distorsions qui occasionnent l’ination par la demande,la dépréciation du taux de change et la hausse des taux
d’intérêt.Les conits civils et l’instabilité politique entraventégalement les actions menées en vue de la convergence.La baisse de l’activité économique, qui a pour corollairele chômage, les tensions sociales et le faible degré dedémocratisation se sont combinés pour faire de l’Afriquede l’Ouest une zone de conit civil et d’instabilité politique.Les changements de régime à la faveur des coups d’Etat ont
été monnaie courante au cours des dernières décennies etpresque tous les pays de la sous-région qui ont connu cetype de changement politique. Un environnement instablede ce genre a toutes les chances d’engendrer une instabilitémacroéconomique. Quelle que soit la qualité des politiquesformulées, leur mise en œuvre sera vouée à l’échec si lenécessaire climat de paix et de stabilité n’est pas assuré.Ce problème a considérablement affecté le rythme et ladirection de la coopération régionale et du programmed’intégration de la CEDEAO.
175
La prise de conscience de la nécessité de garantir la stabilitésociale et politique pour pouvoir mener le processus dedéveloppement de la sous-région a obligé la CEDEAO àprendre un certain nombre d’initiatives destinées à créer unenvironnement paisible. Au nombre de ces mesures, il fautnoter la lutte contre la corruption, l’adoption de protocolessur la démocratie, sur la bonne gouvernance et sur ladéfense, et la création d’un mécanisme de prévention, degestion et de résolution des conits. La contributionappréciable du Groupe CEDEAO de suivi de la paix(ECOMOG) à la restauration de la paix dans certains paysouest africains témoigne amplement des efforts entreprispar la CEDEAO pour garantir un environnement paisible qui
Les Tableaux 1 et 2 donnent un résumé du nombre de paysqui ont atteint les critères, ainsi que le nombre total decritères (tant primaires que secondaires) atteints par chaquepays. Il convient de souligner que le Tableau 2 ne prend pasen compte le critère des arriérés intérieurs, en raison del’absence de réponses dans certains pays.
Tableau 1: Nombre de Pays qui ont rempli les critères deconvergence au sein de la CEDEAO au cours de la période 2000-08.
2 0 0 0
2 0 0 1
2 0 0 2
2 0 0 3
2 0 0 4
2 0 0 5
2 0 0 6
2 0 0 7
2 0 0 8

8/15/2019 African Single Currency
http://slidepdf.com/reader/full/african-single-currency 175/192
par la CEDEAO pour garantir un environnement paisible quifacilite le processus d’intégration.
En somme, malgré les différents reports et les difcultésdans la réalisation de la convergence, il importe de nuancerle bilan de la mise en œuvre du PCMC. En effet, au-delà desréalisations quantitatives, une mobilisation de plus en pluscroissante est perceptible autour des idéaux de l’intégrationmonétaire. Plus particulièrement, les populations sont deplus en plus mobilisées en faveur de l’avènement d’unemonnaie commune dans l’espace CEDEAO. Cette situationconstitue une donne importante qui augure de meilleures
perspectives pour le processus d’intégration monétaire dansla mesure où elle constitue une source nouvelle de pressionexercée sur les autorités communautaires les obligeant àaccélérer le processus. S’y ajoute la volonté politique qui estde plus en plus manifeste. Le volontarisme des dirigeantsde la CEDEAO pour la création de la monnaie unique est deplus en plus marqué.
Aperçu sur les performances en matière de convergencemacroéconomique dans la CEDEAO.
L’évolution vers la convergence macroéconomique estdemeurée mitigée dans la CEDEAO et diffère au cours de lapériode considérée, selon les pays ou les zones (UEMOA ouZMAO). Certains pays membres ont éprouvé des difcultésà maintenir leur performance en ce qui concerne lesobjectifs atteints au cours des années précédentes.
Critères primairesDécit budgétaire/PIB 6 6 5 5 3 5 6 6 6
Ination 11 9 10 10 9 9 8 7 10Financement du décitbudgétaire par labanque centrale
11 13 11 11 14 15 13 14 15
Réserves extérieuresbrutes 10 10 9 9 9 9 9 9 9
Critères secondairesArriérés intérieurs4 n.
d. 5 4 5 4 4 7 8 8Recettes scales/PIB 1 0 0 0 2 2 2 3 3Masse salariale/recettesscales 6 6 5 8 5 7 7 8 8
Investissements publics/ recettes scales 6 6 5 5 7 6 7 7 7
Taux d’intérêt réelspositifs 12 7 8 9 7 7 7 7 9Stabilité du taux dechange réel 1 9 3 0 0 12 12 13 14
Source: AMAO
Concernant la performance du principal critère primaire, leratio décit budgétaire/PIB, seulement six (6), sur les quinze
ont atteint ce critère en 2007. Le nombre de pays qui ontréalisé le critère relatif a l’ination a chuté à sept (7) au cours
176
de la période considérée, contre huit (8) en 2006. Quatorze(14) pays ont atteint l’objectif requis pour le nancementdu décit budgétaire par la banque centrale, contre 13 en2006. S’agissant des réserves extérieures brutes, neuf pays(le Nigeria et les huit pays de l’UEMOA) ont pu atteindre cetobjectif au cours de la période.
La performance au titre des critères secondaires a égalementété mitigee, d’une manière générale. Seuls trois (3) pays ontatteint l’objectif recettes scales/PIB au cours de la périodeconsidérée. Etant donné que la masse salariale absorbel’essentiel des recettes scales générées au plan internedans la plupart des pays, la réalisation de ce critère s’est
Tableau 2: Nombre total de critères de convergence atteints4
PAYS/PERIODE 2 0 0 0
2 0 0 1
2 0 0 2
2 0 0 3
2 0 0 4
2 0 0 5
2 0 0 6
2 0 0 7
2 0 0 8 *
BENIN 5 6 6 6 5 5 4 8 8BURKINA FASO 5 5 4 5 5 6 6 6 6
CAP-VERT 2 4 2 3 3 5 4 5 4COTE D’IVOIRE 5 5 4 5 5 5 6 6 6GAMBIE 7 2 0 1 4 5 6 4 6GHANA 2 1 0 1 2 2 3 2 4GUINEE 1 4 3 1 1 3 2 5 4

8/15/2019 African Single Currency
http://slidepdf.com/reader/full/african-single-currency 176/192
p p p yégalement avérée difcile. Il convient de prendre en comptel’incidence des taux d’intérêt réels positifs dans la majoritédes pays en 2007. D’une manière générale, les taux dechange réels sont demeurés stables dans les pays membreset ce critère a été rempli par treize (13) pays à la n de2007.
Le Tableau 2 montre qu’aucun pays n’a encore pu respectertous les critères de convergence primaires et secondaires. Ala n de 2007, la meilleure performance a été réalisée parle Bénin avec huit (8) objectifs atteints. Ce pays est suivi parle Mali qui a satisfait à sept (7) critères. Le Burkina Faso,la Côte d’Ivoire, le Niger, le Sénégal et le Togo ont réussichacun six critères de convergence. Pour leur part, le CapVert, la Guinée et le Nigeria ont obtenus chacun cinq (5)critères. Quant à la Gambie, elle a réussi quatre (4) critères.De leur côté, la Guinée Bissau et la Liberia ont satisfait àtrois critères. Enn, le Ghana et la Sierra Leone n’ont réaliséque deux (2) critères de convergence chacun.
GUINEE 1 4 3 1 1 3 2 5 4GUINEE-BISSAU 3 5 5 4 5 5 5 3 5LIBERIA 7 4 4 4 2 3 3 3 3MALI 6 5 5 6 6 7 6 7 7NIGER 4 5 5 4 5 5 7 6 7NIGERIA 5 4 3 4 4 6 5 5 6SENEGAL 6 8 7 7 6 7 6 6 8SIERRA LEONE 3 3 4 0 1 2 1 2 2TOGO 4 5 5 6 5 5 6 6 6
Source: AMAO
Le niveau élevé des décits budgétaires est demeuré undé majeur de la politique de gestion macroéconomiquedans les Etats membres de la CEDEAO en 2007, en dépitde quelques améliorations. Six (6) pays, à savoir le Bénin, laCôte d’lvoire, la Gambie, la Guinée, le Liberia, le Nigeria,ont atteint cet objectif à la n 2007, contre sept (7) à la nde 2006.
La bonne performance de la production agricole dansla plupart des Etats a contribué à atténuer l’impact despoussées inationnistes dues à l’envolée des cours desproduits pétroliers et de leurs produits dérivés en 2007. Sept(7) pays (Bénin, Burkina Faso, Cap-Vert, Côte d’Ivoire, Mali,Niger et Togo) ont atteint cet objectif au cours de la périodeconsidérée contre 8 pays au cours de l’année précédente.
Concernant le critère relatif au nancement du décitbudgétaire par la banque centrale, il est demeuré
177
satisfaisant au cours de la période, dans la mesure où 14pays ont atteint cet objectif. Cette performance pourraits’améliorer en 2008 pour l’ensemble des pays respectant lanorme, comme ce fut le cas en 2005.
L’accumulation des réserves extérieures brutes à n 2007au sein de la CEDEAO s’est maintenue avec les huit pays
de l’UEMOA et le Nigeria qui remplissent ce critère commed’habitude. Le faible niveau des réserves au Cap-Vert, enGuinée et au Liberia demeure une préoccupation.
Concernant l’accumulation d’arriérés intérieurs, aucun paysde l’UEMOA n’a enregistré une accumulation d’arriérésintérieurs au cours de la période considérée Les autres pays
Mali, Niger, Nigeria et Sénégal) ont satisfait à ce critère en2007. En n 2008, les mêmes pays pourraient maintenirleur performance en ce qui concerne ce critère.
Ces dernières années, les taux d’intérêt réels ont étéconstamment négatifs dans certains pays en dépit desefforts déployés en vue de résoudre le problème connexe
des taux d’ination élevés. La prévalence des taux d’intérêtréels négatifs est incompatible avec la mobilisation del’épargne intérieure et l’intermédiation nancière quisous-tendent l’importance du critère en tant que variablemacroéconomique clé. Huit (8) pays (Bénin, Burkina Faso,Cap-Vert, Côte d’Ivoire, Guinée, Mali, Sierra Leone et Togo)

8/15/2019 African Single Currency
http://slidepdf.com/reader/full/african-single-currency 177/192
intérieurs au cours de la période considérée. Les autres paysde la ZMAO, le Cap-Vert et le Liberia sont exhortés à fournirles données et informations pertinentes pour l’évaluation
de ce critère.La performance au niveau des recettes scales est demeuréefaible durant la période considérée. Seuls trois pays (Cap-Vert, Ghana et Sénégal) ont satisfait à ce critère en 2007,contre deux pays ces dernières années. Ceci nécessiteune réexion plus approfondie sur le caractère optimaldes taux d’imposition mais aussi sur l’efcacité actuellede l’Administration scale dans la majorité des pays. Les
mêmes pays pourraient remplir ce critère en 2008.La masse salariale, qui représente une part non négligeabledes dépenses renouvelables dans les Etats membres de laCEDEAO, fait également l’objet d’un suivi périodique ande mettre en évidence son impact sur le budget. En ndécembre 2007, huit (08) pays (Bénin, Gambie, Guinée,Mali, Niger, Nigeria, Sénégal et Togo) avaient atteint cetobjectif et ce niveau de performance sera maintenu en2008.Le critère, relatif au ratio investissement public enpourcentage des recettes scales (≥ 20 %), qui assure le suivide l’utilisation des ressources internes en vue de satisfaireles besoins d’investissement des pays membres, a connula même évolution que le critère de la mobilisation desrecettes scales, bien que sa performance soit légèrementmeilleure en ce qui concerne le nombre de pays ayantatteint l’objectif. Sept (7) pays (Bénin, Burkina Faso, Ghana,
ont réalisé ce critère en 2007. Il est attendu que neuf (9)pays respectent ce critère en 2008.
Enn, concernant la stabilité des taux de change réel(a +ou – 5%), il faut noter que deux principaux régimesde taux de change co-existent au sein de la CEDEAO: lerégime de taux de change xe (vis-à-vis de l’euro) pour leCap-Vert et les huit pays de l’UEMOA, et le régime de tauxde change exible pour le Liberia et les pays de la ZMAO.La coexistence des deux régimes de taux de change rendpeu pertinente toute évaluation fondée sur l’évolution destaux de change nominaux. C’est la raison pour laquelle lesanalyses fondées sur l’évolution du taux de change réelsont plus appropriées dans ce cas de gure. Ainsi, le tauxde change réel de la plupart des économies est demeuréstable en 2007. Avec une marge de uctuation de ± 5%, treize (13) pays remplissent le critère, contre 12 paysl’année précédente.
Mécanisme de surveillance multilatérale
Le concept de surveillance multilatérale suppose le suivicontinu des politiques économiques et nancières desEtats membres pour garantir la meilleure coordination etla plus grande convergence possible entre les économiesnationales. L’Agence est confrontée à un certain nombrede problèmes dans l’exercice de sa fonction de surveillancemultilatérale, les problèmes les plus cruciaux étantl’absence de données statistiques standardisées, le manqued’engagement politique et la faiblesse des arrangements
178
institutionnels dans les pays membres.
S’agissant des impératifs en matière de statistiques, ilconvient de souligner qu’une évaluation effective de laqualité du respect des indicateurs de convergence nécessitel’utilisation de statistiques économiques comparableset ables qui garantirait la crédibilité du mécanisme de
surveillance multilatérale. Il est toutefois pertinent de noterque les méthodes de calcul des agrégats statistiques différentd’un pays à l’autre de la sous-région, en particulier en cequi concerne le calcul, la compilation et la présentation del’ination et des comptes nationaux. Concernant l’ination,la couverture géographique et le contenu du panier de la
é è diffè d’ à l’
portant sur les performances macroéconomiques de cespays. Bien que les Autorités soient au courant de cesexigences, seuls quelques Etats membres ont fait montre deleur engagement en incorporant les cibles de convergencedans leurs budgets et leurs programmes nationaux dedéveloppement.
Le mécanisme de change CEDEAO (MCC)
Le prochain volet du PCMC, a trait au mécanisme dechange de la CEDEAO. L’existence de regroupements sous-régionaux dans l’espace CEDEAO, en particulier la zoneCFA (UEMOA) et la seconde zone monétaire (ZMAO),

8/15/2019 African Single Currency
http://slidepdf.com/reader/full/african-single-currency 178/192
ménagère diffèrent d’un pays à l’autre.
On n’insistera jamais assez sur la nécessité d’une
harmonisation des cadres juridique, comptable etstatistique, des méthodologies et de la dénition desagrégats macroéconomiques dans les différents paysde l’espace CEDEAO. Des efforts louables ont été faits,au cours de ces dernières années, dans le domaine de lastandardisation.
Un autre problème relatif à la surveillance multilatéraleest le manque d’engagement politique et l’existence
d’arrangements institutionnels précaires. Le processusd’intégration ne s’est pas vu accorder la priorité absoluedans la plupart des pays membres, dans la mesure oùl’engagement politique montré en faveur du programmen’a pas été appuyé de manière appropriée par une rapidemise en application des politiques essentielles.
An de faciliter la réalisation de la convergence souhaitée,il a été demandé aux Etats membres de prendre en compteles critères de convergence lorsqu’ils élaborent leursprogrammes économiques nationaux, en particulier lorsde la préparation des budgets publics. En outre, chaquepays était censé mettre sur pied un comité national decoordination, organe chargé d’organiser et de mettre enœuvre les volets techniques du programme d’intégrationau niveau des pays et de travailler en collaboration avec lacommission de la CEDEAO et l’AMAO dans les domainesde la collecte, du traitement, de l’analyse des données,et de la préparation de rapports d’évaluation périodiques
( ) ( )avec des orientations quelque peu différentes, crée unproblème administratif lorsqu’il s’agit de faire fonctionnerle mécanisme de change de la CEDEAO. Dans le cadre duprogramme de coopération monétaire, les pays membressont tenus d’harmoniser leurs réglementations des changeset d’accéder à un mécanisme de change de la CEDEAO.
Il est, toutefois, pertinent de noter que les pays de la ZMAOont des régimes de change exibles dans lesquels les tauxbilatéraux sont déterminés de manière immuable, alorsque l’UEMOA fonctionne avec un système de change à
parité xe déterminé de manière administrative. En outre,la ZMAO a, depuis avril 2002, introduit un mécanisme dechange en vertu duquel les différents taux de change sontréférés au dollar des Etats Unis, alors que le franc CFA del’UEMOA et l’Escudo cap-verdien sont ancrés à l’Euro sur labase d’un taux de parité xe.
Malgré cette dichotomie entre les deux unions monétairesde la sous-région, l’Agence monétaire de l’Afrique de
l’Ouest est en train d’introduire un mécanisme de changede la CEDEAO (MCC) qui propose un système de taux dechange stables par rapport à l’unité de compte de l’Afriquede l’Ouest (UCAO), rattachée au DTS du FMI pour une simpleraison de stabilité. L’obstacle manifeste qui se dresse devantl’Agence est de taille, car il s’agit d’amener ces deux blocs àassouplir leurs positions respectives au prot du mécanismede change de la CEDEAO qui leur serait commun.
179
L’intégration des systèmes de Paiement
L’importance du développement des systèmes depaiement n’est plus à démontrer dans le contexte actuelde globalisation des marchés nanciers caractériséepar des progrès importants en matière d’innovationstechnologiques et par l’accroissement des ux de capitauxet d’investissements.Rappel de quelques initiatives en matière de mécanisme etmoyens de paiement au sein de la CEDEAO
a La Chambre de Compensation de l’Afrique de l’Ouest(CCAO)
correspondant pas à des transactions internationalescourantes étaient aussi admis de commun accord entre lesparties prenantes.
Toutes les transactions du mécanisme de compensationétaient enregistrées dans une unité de compte dénomméeUnité de Compte de l’Afrique de l’Ouest (UCAO) qui servait
de dénominateur commun pour les différentes monnaiesdes Banques Centrales des pays membres. Cette unité decompte équivaut à un Droit de Tirage Spécial (DTS) du FMI.
La valeur des monnaies nationales par rapport à l’UCAO estcalculée à travers les taux croisés du DTS et des monnaiesd’ancrage de ces monnaies.

8/15/2019 African Single Currency
http://slidepdf.com/reader/full/african-single-currency 179/192
(CCAO)
Au cours des années 70, l’Association des Banques Centrales
Africaines (ABCA) avait initié la mise en place de systèmesd’accords multilatéraux de paiements dans les différentessous-régions de l’Afrique en vue de faciliter les échangesentre leurs Etats membres.
C’est dans ce cadre que la Chambre de compensation del’Afrique de l’Ouest de l’Afrique de l’Ouest (CCAO) fut crééele 25 juin 1975 par les Banques Centrales de douze pays,à savoir le Bénin, le Burkina-Faso, la Gambie, le Ghana,
la Côte d’Ivoire, le Libéria, le Mali, le Niger, le Nigeria, leSénégal, la Sierra Leone et le Togo.
Le mécanisme de compensation mis en place à travers laCCAO était basé sur un accord multilatéral de paiementqui mettait en jeu l’Agence Monétaire de l’Afrique del’Ouest (AMAO), les Banques Centrales et les banquescommerciales opérant dans les quinze (15) Etats membres dela CEDEAO. Il facilitait les règlements, en monnaies locales,
des transactions commerciales entre les pays membres cequi, du coup, permettait de réaliser des économies sur leursressources en devises étrangères. L’utilisation des devisesintervenait seulement lors du règlement des soldes netsissus de la compensation en n de mois.
Les transactions relevant des opérations inscrites aucompte courant de la balance des paiements et quisatisfont à la règle d’origine de la sous-région de l’Afrique
de l’Ouest étaient éligibles au mécanisme. Les dons,les prêts intergouvernementaux et autres paiements ne
g
Cependant, après quelques années de fonctionnementnormal et réussi, le mécanisme a été confronté à desdifcultés liées, entre autres, à la suppression du contrôledes changes, à la libéralisation nancière, au manquede complémentarité entre les productions des paysmembres, à la concurrence du secteur informel, à la quasiméconnaissance du système de compensation. Finalement,il a été arrêté depuis décembre 2006.
b le chèque de voyage CEDEAO
La mise en circulation, en octobre 1998, du chèque devoyage CEDEAO, comme instrument de paiement, visaitsurtout à la familiarisation des populations de la sous-région à la future monnaie unique de la CEDEAO.
Cependant, malgré les espoirs suscités lors de sa créationet après quelques années de fonctionnement, les résultatsobtenus sont restés en deçà des attentes en raison deplusieurs aléas et entraves qui ont émaillé son chemin.Parmi ces aléas et entraves il faut citer:
• la concurrence des autres types de chèquesde voyage libellés en monnaies convertibles etbeaucoup plus prisés par la clientèle et les utilisateurs(American express, Thomas cook, Mastercard, CréditLyonnais….);
• l’insufsance de la sensibilisation des utilisateurs etacteurs impliqués dans la promotion des chèques devoyage Cedeao;
180
• la préférence des opérateurs économiques du secteurinformel pour l’argent liquide;
• le refus de certaines banques commercialesd’encaisser les chèques de voyage non vendus parleurs propres correspondants à cause de soupçonsde spéculation.
Pour soutenir le fonctionnement correct du mécanisme decompensation et du chèque de voyage Cedeao, un Fondsde Crédit et de Garantie fut mis en place et nancé par lesBanques centrales.
Ce fonds était destiné à l’octroi de crédit, à court terme,aux Banques Centrales débitrices en vue de leur permettre
d’importance systémique avec la mise en place d’unsystème de règlement brut en temps réel (RTGS),notamment pour les virements de trésorerie, lestransferts, les opérations du marché monétaire, lerèglement des opérations de bourse, le règlementde la dette publique, dénommé Système de TransfertAutomatisé et de Règlement dans l’UEMOA (STAR-UEMOA);
• la modernisation du système d’échange et derèglement des transactions de petits montants,à savoir les paiements de masse: virements,chèques, cartes, avec le démarrage d’un système decompensation multilatérale automatisé dénommé

8/15/2019 African Single Currency
http://slidepdf.com/reader/full/african-single-currency 180/192
aux Banques Centrales débitrices en vue de leur permettrede liquider leurs positions débitrices. Sa dotation initiale futxée à Ucao 2 millions (soit environ Usd 3 millions).
Etat des lieux en matière de système de paiement au seinde la CEDEAO
Depuis quelques années, nous assistons au niveau des deuxzones monétaires de la CEDEAO, Union Economique etMonétaire Ouest Africaine (UEMOA) et la Zone Monétairede l’Afrique de l’Ouest (ZMAO), à d’intenses activités demodernisation des infrastructures et du cadre juridiquedes systèmes de paiement en vue de s’adapter aux normesinternationales admises et aux évolutions techniquesactuelles.
a Union Economique et Monétaire Ouest Africaine (UE-MOA) 5
Le système de paiement dans l’UEMOA est composé dedeux (2) éléments fondamentaux à savoir un cadre légal
et réglementaire rénové et une infrastructure constituéede systèmes d’échange et de règlement de gros montantsen temps réel, de compensation automatisée pour lespaiements de masse et de paiement interbancaire parcartes bancaires.
La réforme des systèmes de paiement des pays de l’UEMOAs’articule autour des trois axes majeurs suivants:
• la modernisation du système d’échange et derèglement des transactions de gros montants ou
compensation multilatérale automatisé dénomméSystème Interbancaire de Compensation Automatisédans l’UEMOA (SICA-UEMOA);
• le développement d’un système de carte interbancairesous-régional mis en place par le secteur bancairesous l’impulsion de la BCEAO avec la création duGroupement Interbancaire Monétique de l’UEMOA(GIM-UEMOA) et du Centre de Traitement MonétiqueInterbancaire de l’UEMOA (CTMI-UEMOA) etpermettant la promotion de paiement alternatif parrapport aux espèces.
• Les règlements des soldes de compensation despaiements de masse et des opérations compenséesde la Bourse Régionale des Valeurs Mobilières(BRVM) à travers le Dépositaire Central Banque deRèglement (localisé à Abidjan) sont effectués parSTAR-UEMOA. De même, les soldes des opérationsmonétiques régionales sont réglés dans ce système.
• Le cadre juridique et réglementaire
Le cadre légal et réglementaire est bâti autour de principesde gestion respectant les normes internationales enmatière de sécurité, de délai de paiement et de gestion desrisques. Il offre toutes les conditions requises pour le bonfonctionnement et le renforcement du système nancier.
A cet effet, la BCEAO a édicté le règlement No 15/2002/CM/ UEMOA qui actualise le cadre juridique pour lui permettre
de répondre aux multiples exigences de sécurité découlantde l’évolution technique des instruments de paiement.
181
Ce dispositif veille, d’une part, à la sécurisation desinstruments et procédés de paiements électroniquesexistants et à venir et, d’autre part, à la sécurisation destransactions nancières à travers une assise juridiquesufsante de garantie des titres.
La loi uniforme sur les instruments de paiement de
l’UEMOA prend aussi en compte les nouveaux instrumentset procédés de paiement nés de l’évolution technologique.Elle prévoit un dispositif de traitement des infractions liées àl’utilisation des nouveaux moyens et procédés de paiement.
Cette loi est complétée par la Directive 08/2002/CM/ UEMOA qui porte sur la promotion de la bancarisation
b Zone Monétaire de l’Afrique de l’Ouest (ZMAO) 6
Les travaux sur les systèmes de paiement dans la ZMAO, ontdébuté par l’évaluation de leur niveau de développementdans les différents Etats membres, à travers une étuderéalisée, en 2004, par l’Institut Monétaire de l’Afrique del’Ouest (IMAO).
Cette étude a permis de faire un état des lieux et d’élaborerun cadre de stratégie et de politique devant guider ledéveloppement et le fonctionnement des systèmes depaiement. Il est ressorti de cette étude les conclusions que:
• Les systèmes de paiement dans les pays de la ZMAO,individuellement pris, se trouvaient à des niveaux de

8/15/2019 African Single Currency
http://slidepdf.com/reader/full/african-single-currency 181/192
et l’utilisation de nouveaux instruments et procédés depaiement scripturaux; et par l’instruction 01/2003/SP
relative à la promotion des moyens de paiement scripturauxet à la détermination des intérêts exigibles en cas de défautde paiement.
Au terme de cette directive, toutes les opérationsnancières, tous les salaires, impôts, taxes, indemnités etautres prestations, en argent, portant sur un montant deréférence xé par la BCEAO, doivent être payés par chèqueou par virement, sur un compte ouvert auprès des services
nanciers de la Poste ou d’une banque.La Directive communautaire de lutte contre le blanchimentde capitaux et de promotion des moyens scripturauxde paiement vient compléter ce cadre juridique etréglementaire.• L’infrastructure
Les trois systèmes (STAR-UEMOA, SICA-UEMOA et
Monétique interbancaire régionale) sont régis par un cadre juridique et réglementaire solide, un arsenal de principesde gestion respectant les normes internationales en matièrede sécurité, de délai de paiement et de gestion des risqueset une rénovation du dispositif de la Centralisation desIncidents de Paiement.
De même, ils sont sous tendus par une infrastructure detélécommunication à haut débit permettant d’assurer une
haute qualité à un coût moindre.
p ,développement différents.
• Qu’aucun des pays membres ne disposait decomposante de système de paiement pouvant servirde modèle pour l’ensemble de la zone parce que lessystèmes en place ne répondaient, seulement, qu’àdes contextes spéciques utilisant des infrastructuresbancaires qui diffèrent d’un pays à un autre.
• Qu’aucun d’eux n’avait de cadre juridique, de règleset procédures reétant les plus récentes évolutionstechnologiques. Toutefois, tous les pays avaiententrepris la révision de leurs lois, règles et procéduresen la matière, en vue de les adapter aux exigencesd’harmonisation engagée dans la ZMAO.
En dehors des constats faits, ci-dessus, il faut noter que leNigeria et le Ghana sont en avance sur les autres pays etque, ces deux pays ont entrepris d’importantes réformes deleurs systèmes de paiement dans la perspective de fusion deleurs bourses de valeurs à plus ou moins brève échéance.• Politiques et stratégies
Dans le cadre de ces politiques et stratégies, ledéveloppement des systèmes de paiement nationaux, larationalisation des systèmes nanciers des Etats membreset l’interopérabilité des systèmes de paiement de la ZMAOsous l’égide de la future Banque centrale de l’Afrique del’Ouest (BCAO) occupent une place importante. C’est
pourquoi, les actions suivantes ont été entreprises:
182
• Le développement de normes communes pour leschèques, la chambre de compensation automatique(CCA) et d’autres composantes du système depaiement;
• l’élaboration d’un acte commun de la ZMAO sur lesystème de paiement;
•
La conception de règles et procédures en vue d’assurerle fonctionnement de chacune des composantes dusystème de paiement.
En vue de faciliter la mise en œuvre d’un système depaiement commun au sein de la ZMAO, des tâches avaientété assignées à chaque Etat membre sous la supervision del
composante des systèmes de paiement.
Les utilisateurs des systèmes de paiement (les banques,les entreprises, les gouvernements et le public) serontainsi soumis aux mêmes lois et règlements dans tous lespays membres de la ZMAO. Ce qui facilitera les paiementstransfrontaliers et rehaussera la conance en l’union
monétaire envisagée.• Infrastructure
Les travaux en cours en matière d’infrastructure visent àdoter la future Banque Centrale d’un mécanisme efcaceassurant la sécurité et la solidité des systèmes de paiementset de règlements en temps réel. Cette infrastructure

8/15/2019 African Single Currency
http://slidepdf.com/reader/full/african-single-currency 182/192
l’IMAO.
Ainsi, la Gambie devait rééchir sur l’acquisition et la miseen œuvre d’un système de paiement commun à la ZMAO;le Ghana fut chargé de l’élaboration du cadre juridiquedu système de paiement de la zone; la Guinée avait encharge la mise en œuvre d’un Système de compensationautomatique fonctionnel sur l’ensemble de la ZMAOainsi que des règles et procédures qui l’accompagnent; le Nigeria, de son côté, avait comme mission, la mise en placed’un déclencheur de Distributeur Automatique de Billets/
Point de Vente (DAB/PDV) fonctionnel sur l’ensemblede la zone ainsi que la conception des normes, règles etprocédures communes de base pour son fonctionnement;enn la Sierra Leone, le développement de la reproductiond’images sur les chèques.• Cadre réglementaire
Dans le but d’atteindre un système de paiement communet moderne (système RTGS système de TraitementAutomatique des chèques, Chambre de CompensationAutomatique, système de Traitement des Cartes bancaires)répondant aux normes internationales, la ZMAO a jugé utilede doter les pays membres d’un cadre réglementaire solide.Ce dispositif qui n’attend que son adoption, par les paysmembres, permettra de disposer d’un moyen de contrôleet de supervision des systèmes de paiement électroniques.
Une fois que ce cadre légal commun aura été adopté, unensemble de règles communes sera préparé pour chaque
g pcomprend deux principales composantes: l’infrastructurede la BCAO et le système RTGS.• Le réseau de la Banque Centrale de l’Afrique de
l’Ouest (BCAO)
Cette infrastructure sera un vaste réseau reliant les Etatsmembres de la ZMAO. Tous les utilisateurs des systèmes depaiement et de règlement de la BCAO qui ne participentpas directement aux transferts transfrontaliers de fondsauront accès au système, à travers les banques centralesnationales.• Le système de RTGS
Ce système est une plateforme qui facilitera le traitementdes paiements de gros montants à travers le réseau. Sonrôle est de transmettre les ordres de paiement de n’importequelle partie du système au point ou serveur central oùest logée la base de données comportant les comptes desdifférentes banques centrales.
Le plan d’action qui avait été élaboré pour la mise en placedu système de paiement de la ZMAO était le suivant:
• Conception du réseau: Mars 2008;• Acquisition de l’équipement et du logiciel: Juin 2008;• Construction du réseau: Septembre 2008;• Adaptation du logiciel: Octobre 2008;•
Test du réseau: Décembre 2008.
8/15/2019 African Single Currency
http://slidepdf.com/reader/full/african-single-currency 183/192
184
en a appelé, à l’occasion de son sommet du 15 juin 2007à Abuja, à une révision de la stratégie d’accélération,laissant la porte ouverte à son éventuel remplacementpar une approche unique. Dans ce contexte, le Secrétariatconjoint de l’AMAO et de la commission de la CEDEAO(l’un des principaux organes du Mécanisme Multilatéralde Surveillance) s’est réuni à Freetown, en Sierra Léone,en juillet 2007, pour étudier la voie à suivre. Le Secrétariatconjoint a par la suite convoqué une réunion entre lesinstitutions régionales an d’étudier les propositions sur lesoptions alternatives. Voici, les options étudiées à l’occasionde cette rencontre.
Approche de la voie unique
grâce aux conditions de convergence. Avec cette option,l’union monétaire pourrait voir le jour dès que possible.
Toutefois, elle présente un inconvénient majeur, à savoir laperte des sommes englouties dans les projets abandonnéset ayant trait à l’établissement des institutions nancièrespertinentes, aux éventuelles modications des statuts
pertinents et des règlements bancaires dans le but dereéter les objectifs régionaux
Approche Big Bang
Cette option appelle une unication monétaire immédiatedes quinze États membres de la CEDEAO par une simpledécision politique et ce, à une date convenue entre eux.

8/15/2019 African Single Currency
http://slidepdf.com/reader/full/african-single-currency 184/192
pp q
Il s’agit essentiellement d’une modication de l’actuelle
approche des deux blocs par une approche d’un bloc uniquefondée sur des critères d’éligibilité prescrits. Son succèsdépendrait largement de la réussite de l’actuelle approcheprogressive des deux blocs dont les piliers centraux sont laconvergence économique et l’harmonisation des politiques.Ainsi, le projet de ZMAO devrait poursuivre ses programmes
jusqu’en 2009, excluant par conséquent la création de laBanque Centrale Ouest Africaine (BCOA) et l’introductionnale de l’éco.
Sur la base de critères convenus d’un commun accord, lesÉtats membres éligibles pourront tendre vers la formationde l’union monétaire régionale, à condition que les paysremplissant les critères aient la possibilité d’accéder plus tardà l’union en temps voulu. L’accent a été mis sur la nécessitéd’une surveillance multilatérale efcace et l’introductiond’un Pacte de Croissance et de Stabilité qui serait assorti desanctions an de rendre le processus durable.
Le principal avantage de cette option serait en termesd’économies qui iraient aux États membres de la secondezone monétaire en raison de la non création ou de la miseen suspens de la BCAO ainsi que des autres institutionsnancières prévues dans le cadre de la ZMAO. La mise enattente de ces institutions nancières serait une mesure deprudence lorsque l’on considère les dépenses colossales
en capital et leur caractère transitoire. Le second avantageserait la garantie d’une monnaie régionale forte et stable
décision politique et ce, à une date convenue entre eux.Vu l’absence de conditions préalables, le projet de laCEDEAO peut démarrer dès que possible. La convergencemacroéconomique et l’harmonisation des politiques neseraient plus des conditions prérequises mais exigiblesseulement après.
Cette option présente l’avantage d’être la manière laplus simple de réaliser l’unication dans un délai le pluscourt possible. Il n’y aurait pas de critères d’éligibilité, nide procédures de convergence et d’harmonisation des
politiques longues et compliquées. La seule conditionmajeure serait la mise sur pied d’institutions nancièrespertinentes.
Toutefois, cette option présente quelques risquesliés aux politiques divergentes, à la faiblesse desfondamentaux économiques et aux situations d’instabilitémacroéconomique pouvant avoir des effets adverses surla durabilité de la monnaie unique proposée. La stabilité
budgétaire, la stabilité du taux de change, la stabilité desprix, la durabilité structurelle et la crédibilité de la politiquemonétaire seront confrontés à des risques considérables àcause l’inexistence d’un cadre institutionnel approprié. Dece fait les Etats membres devront observer une certainediscipline en vue de maintenir la convergence après lelancement de la monnaie unique.
185
Approche de l’adhésion à l’UEMOA
Avec cette option, les États qui ne sont pas encore membresde l’UEMOA devraient s’engager à y adhérer. Cette décisionserait essentiellement politique. Toutefois, l’éligibilité seraitfondée sur des critères macroéconomiques, juridiques, etc.Dans ce dispositif, une banque centrale qui adopterait le
CFA serait transformée en une liale de la BCEAO. Cetteformule présente certains avantages qui tiennent au fait quel’UEMOA possède la capacité technique requise pour servirde noyau à l’édication d’une union monétaire à l’échellede la CEDEAO. Le premier: la garantie d’une stabilitémacroéconomique pour les nouveaux entrants étant donnéque la BCEAO a jusqu’ici fait preuve d’une très grandef ité tiè d ti d l liti ét i
stable pour rejoindre une nouvelle union sur laquelleplanent des incertitudes.
Approche de la Masse Critique
Avec cette option, l’union monétaire pourrait démarrer dèsque possible à condition qu’une “masse critique” de paysconstituant au moins soixante-quinze pour cent (75%) duPIB de la CEDEAO remplissent les critères de convergence.Toutefois, tous les pays devront s’engager à respecterun Pacte de Croissance et de Stabilité qui garantiraitla pérennité de l’union. Le principal avantage de cetteoption est qu’elle reposerait sur de solides fondamentauxmacroéconomiques.

8/15/2019 African Single Currency
http://slidepdf.com/reader/full/african-single-currency 185/192
efcacité en matière de gestion de la politique monétaire.Deuxième avantage: le coût de cette formule serait modéréen comparaison de la phase de création de l’union puisquel’architecture du système nancier est déjà en place. Avecce dispositif, une banque centrale qui déciderait d’adopterle CFA comme monnaie deviendrait une liale de la BCEAO.Il n’y aurait pas de coût supplémentaire pour établirde nouvelles institutions nancières communautaires àl’exclusion des dépenses pour la modication des statuts,des procédures, et l’impression de nouveaux billets de
banque ainsi que les contributions aux capitaux propres desinstitutions existantes.
Cependant, cette formule présente quelques difcultésqui méritent d’être mis en relief. Le premier est que le CFAest considéré comme une survivance du système colonialfrançais en Afrique. Le deuxième se rapporte aux liens avecle Trésor Français.
Approche de l’élargissement du Projet de ZMAO
Avec cette option, la monnaie de la ZMAO – l’Eco –serait lancée pour l’ensemble des pays de la CEDEAO. Yprendraient part tous les États membres de l’UEMOA ainsique les pays de la ZMAO qui rempliraient les quatre critèresfondamentaux. Par la suite, tout autre pays satisfaisant auxcritères pourrait adhérer.
Toutefois, il restera à savoir si les pays de l’UEMOA serontprêts à abandonner leur union bien établie et leur monnaie
Après avoir passé en revue tous ces scénarios, les institutionsrégionales ont présenté trois options pour créer l’unionmonétaire régionale:
i. l’approche big-bang;ii. l’approche purement graduelle; etiii. l’approche de la masse critique.
Mais à l’issue des débats, la réunion a marqué sa préférenceà l’option de la masse critique. Par la suite, le Conseil de
Convergence s’est réuni le 9 octobre 2007 à Ouagadougoupour étudier les options présentées par les institutionsrégionales. Après s’être accordé sur la nécessité d’une seuleapproche pour l’intégration monétaire dans la région, leConseil a demandé à ce qu’une étude soit effectuée ande déterminer la faisabilité de toutes les options proposéeset de proposer un calendrier précis pour l’introduction de lamonnaie unique de la CEDEAO.
Sur la base de ces pertinentes réexions, l’AMAO proposeici deux schémas devant aboutir à la création de la monnaieunique dans un bref délai.
PERSPECTIVES
Aujourd’hui l’AMAO se propose de rééchir sur unPlan Stratégique visant l’accélération du processusd’intégration monétaire en Afrique de l’Ouest. La nalitéde ce Plan est de permettre la création dans l’espace
186
CEDEAO d’une monnaie commune sufsamment stablepour promouvoir le développement durable et assurerla convergence des économies. Elle s’est intéressée à lafaisabilité de cette zone monétaire au regard des critèresde reconnaissance d’une zone monétaire optimale et parrapport au niveau de performance dans le cadre de laconvergence macroéconomique. Il ressort de l’analyse quequelques critères fondamentaux de reconnaissance d’unezone monétaire optimale ne sont pas encore remplis. Ence qui concerne la convergence, le niveau de réalisationest considéré comme insufsant en dépit de quelquesefforts louables. Ce constat au lieu d’être un motif dedécouragement doit renforcer la conviction en faveur del’idéal d’intégration monétaire.
chacun de ces scénarios, les performances en matière deconvergence ne seront pas des conditions obligatoires pourl’adhésion. Toutefois, l’introduction de la monnaie pourraitêtre précédée par l’adoption d’un pacte de stabilité dans lebut de garantir la stabilité de l’environnement économiqueet la viabilité de la future monnaie.
La mise en œuvre de l’une ou l’autre des options proposéespassera nécessairement par différentes phases notammentune période de stabilisation des taux de change et uneétape de passage à la monnaie unique assortie d’uncalendrier précis. L’adoption du cadre juridique va concernerla préparation de l’ensemble des documents, instrumentset procédures pour la mise en place de la zone monétaireunique de la CEDEAO et les reformes institutionnelles

8/15/2019 African Single Currency
http://slidepdf.com/reader/full/african-single-currency 186/192
Plusieurs raisons doivent justier cette démarche. La zonemonétaire optimale doit être perçue comme une situationde référence idéale et non comme une condition sanslaquelle toute intégration monétaire serait impossible.Le cas de l’Union Economique et Monétaire Européenne(UEME), considéré comme le modèle le plus réussi dans cedomaine, constitue une parfaite illustration. Par rapport àla convergence macroéconomique, beaucoup d’analystess’accordent à la considérer comme un processus qui ne doit
pas être la condition primordiale à la création d’une zonemonétaire unique.
Par ailleurs, l’existence d’une monnaie unique favorisela réalisation de cette convergence. En plus, l’analyse enterme d’avantages et de coûts, approche privilégiée parbeaucoup de spécialistes des zones monétaires, montreclairement que les opportunités sont considérables pour lespays de l’Afrique de l’Ouest dans la perspective d’une union
monétaire. En outre, la CEDEAO peut compter sur unedonnée non moins importante à savoir l’engagement desleaders politiques de la région en faveur de l’intégration.
Une fois le doute levé sur l’opportunité ou non de la futurezone monétaire, le document s’est intéressé aux options quis’offrent dans le cadre de l’accélération du processus. A lasuite de cette revue, l’AMAO a proposé deux scénarios pourla création rapide de la monnaie unique de la CEDEAO. Dans
les deux cas, l’introduction de la monnaie sera précédéed’une phase de stabilisation des taux de change. Dans
unique de la CEDEAO et les reformes institutionnellesporteront essentiellement sur la mise en place du ConseilMonétaire, la création de la Banque centrale de la CEDEAOet des autres institutions nancières pertinentes.
CONCLUSION ET RECOMMANDATIONS
L’Agence Monétaire de l’Afrique de l’Ouest (AMAO) estd’avis que ce genre de réunions organisées au niveauinternational constitue le cadre idéal pour des échanges
d’idées et d’expériences sur une base périodique, d’autantplus qu’elles offrent un mécanisme d’apprentissage utilepour faciliter la réalisation effective de l’intégration desdifférents programmes sous-régionaux du continentafricain.
Ainsi, dans sa communication faite à l’occasion de cePremier Congrès des Economistes africains, l’AMAO aprocédé à l’analyse approfondie des expériences spéciques
du Programme de coopération monétaire de la CEDEAO.Les contraintes ne sont pas particulières à la sous-régionouest-africaine, car on constate que la plupart des pays ducontinent africain ont des caractéristiques économiques etsociales similaires.
Les difcultés rencontrées dans la plupart des regroupementspour l’intégration et la coopération sous-régionales enAfrique ne sont pas insurmontables. Avec l’adoption
d’une bonne gouvernance économique et politique parnos pays respectifs et avec l’option résolue en faveur de
187
la coopération régionale, appuyée par un engagementnational idoine, nous avons bon espoir de pouvoir accélérerle rythme de développement du continent africain pour lebien-être de nos peuples.
Dans la perspective de l’actuelle mondialisation rapide dela structure économique du monde, les régions africaines
n’ont d’autres alternatives que de pousser de l’avant àl’aide de nos programmes de coopération et d’intégrationrégionales. Si les «géants» pays du Nord ont senti lanécessité de renforcer leur coopération, les pays du Suddevront trouver les stratégies idoines pour surmonter nosdifcultés et développer nos économies an de restercompétitifs dans l’arène internationale.
• L’Analyse faite sur les critères de reconnaissance d’unezone monétaire optimale: Ici, il faut comprendrequ’aucune zone monétaire ne peut être optimaleau regard des critères traditionnels et modernes dereconnaissance d’une zone monétaire optimale. Detels critères qui dénissent un cadre de référencethéorique constituent des conditions idéales vers
lesquelles il est souhaitable de diriger l’unionmonétaire, laquelle ne les attendra pas forcément;• Les exigences en termes de respect des critères de
convergence macroéconomique: dans ce cas, ilest important d’étudier la pertinence des critèresde convergence. En d’autres termes, il seraitnécessaire dans ce processus de déterminer le niveau

8/15/2019 African Single Currency
http://slidepdf.com/reader/full/african-single-currency 187/192
Ainsi, pour la mise en place de la monnaie commune en
Afrique, un certain nombre de recommandations peuventêtre formulées.1. D’abord, il faut nécessairement élaborer un Plan
d’Actions. Il s’agira particulièrement:• D’élaborer un Programme précis pour la création de
la monnaie commune en Afrique;• De dénir les tâches et actions fondamentales
(prioritaires) pour la création de la monnaie communeen Afrique: parmi lesquelles toutes les tâchesd’harmonisation des statistiques, des systèmes depaiements, des politiques économiques,…;
• De xer des échéances (un agenda) pour chacune destâches ou action à entreprendre dans le processus.
• De constituer des Groupes de travail composésde spécialistes qui peuvent venir de toutesles composantes de la société (AutoritésGouvernementales, Banques, Université, Syndicat).
2. Par ailleurs, il serait utile de revoir certainesconsidérations sur les principes de base duprocessus d’intégration monétaire actuel en Afriqueparticulièrement et travailler sur une stratégiecommune et précise de coopération monétaire enAfrique. Ces (deux) principes de base se retrouventdans:
pconvergence (ou de divergence) idéal (acceptable)
pour nos économies. La convergence à l’absolue,c’est-à-dire la convergence de tous les pays à la foissur une plus ou moins longue période, est quasimentirréalisable. Tout en ayant à l’idée la nécessité d’unediscipline collective, il faut considérer la convergencecomme un processus continu même au-delà del’établissement de la monnaie commune, mais nonune condition strictement obligatoire sans laquelle(sans l’atteinte des cibles par tous les pays), toutprocessus de création monétaire est impossible.
3. Evaluer la pertinence du modèle d’intégrationrégionale basé sur le développement des échanges(modèle privilégié actuellement) par rapport aumodèle fondé sur le développement du secteurnancier (et des services). Cette seconde optionpermettrait, par le développement de la nance(libéralisation du capital), de stimuler la productionpar exemple.
4. Donner davantage de l’importance au rôle que lamonnaie peut jouer dans nos économies.
5. Eviter autant que possible la création d’une monnaie(sous-régionale) et ou d’institutions transitoires, decourte durée et coûteuse.
6. A moyen ou long terme, il faut impérativement
procéder (au chapitre des harmonisations) à
8/15/2019 African Single Currency
http://slidepdf.com/reader/full/african-single-currency 188/192
189
1 Après l’adhésion de la Guinée Bussau en 1997, la Zone franc compte 8membres. Le franc CFA qui avait à l’époque une parité xe avec le Francfrançais est aujourd’hui arrimé à l’euro (1 EUR = 655,95666 F CFA)
2 Les pays membres sont tenus de respecter les objectifs xés an defavoriser la mise en place d’un cadre macroéconomique stable en vued’assurer une intégration monétaire réussie.
3 Les critères primaires sont les variables jugées essentielles pour laréalisation de la convergence. Les critères secondaires sont les outilsd’intervention qui concourent à la réalisation des critères primaires.
4 Ce critère n’a été évalué que pour les pays de l’UEMOA; les autres paysn’ont pas fourni de données.5 Les arriérés intérieurs n’ont pas été pris en compte6 Cf Expérience de la BCEAO dans le cadre de la modernisation des
systèmes de paiement dans les pays de l’UEMOA (Séminaire sur laconduite des systèmes de paiement en RDC-Kinshasa du 3 au 4 juin2008)
7 Cf Rapports IMAO sur le Développement du système des paiementsdans les Etats membres de la ZMAO
End Note

8/15/2019 African Single Currency
http://slidepdf.com/reader/full/african-single-currency 189/192

8/15/2019 African Single Currency
http://slidepdf.com/reader/full/african-single-currency 190/192

8/15/2019 African Single Currency
http://slidepdf.com/reader/full/african-single-currency 191/192
Organised by:

8/15/2019 African Single Currency
http://slidepdf.com/reader/full/african-single-currency 192/192
The Department of Economic Affairs in collaboration with
Communication and information Division.If you have any questions or suggestions, please contact:Mr. Yeo Dossina,[email protected] Fetun Getahun,[email protected]: +251 11 551 9287Fax: + 251 11 551 0249
www.africa-union.org
Organisé par:Le Département des Affaires économiques en collaborationavec la Division de la Communication et Information.Pour vos questions ou suggestions, veuillez contacter:Mr. Yeo Dossina,[email protected] Fetun Getahun,[email protected]: +251 11 551 9287Fax: + 251 11 551 0249www.africa-union.org