African development in perspective
55
A presentation to the National Treasury (NT) Pretoria, South Africa, 7-8 February 2017 John Page Finn Tarp African Development in Perspective
-
Upload
united-nations-university-world-institute-for-development-economics-research -
Category
Economy & Finance
-
view
309 -
download
0
Transcript of African development in perspective
A presentation to the National Treasury (NT)
Pretoria, South Africa, 7-8 February 2017
John Page
Finn Tarp
African Development
in Perspective

Introduction
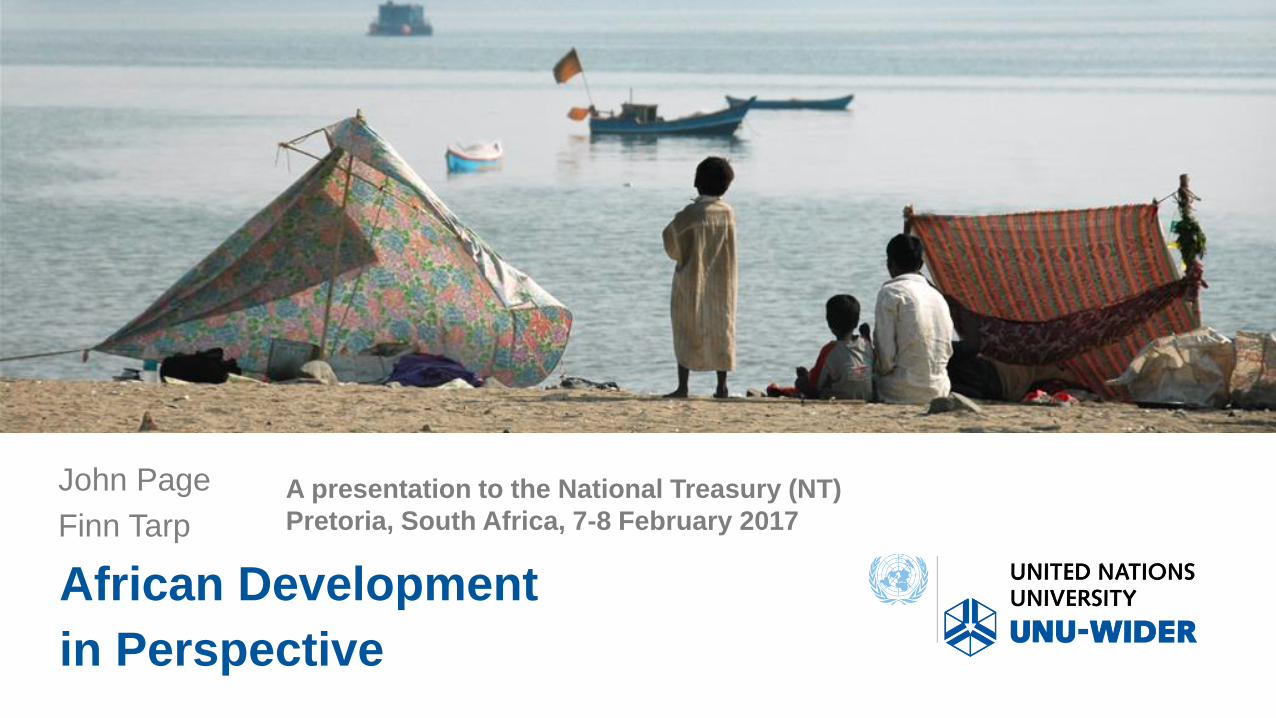
Context
• The Economist (11 May 2000): Hopeless Africa
• The Independent (15 July 2009): Africa – the lost continent
• The Economist (3 December 2011): The hopeful continent – Africa rising
• A recent Afrobarometer survey suggests: ‘despite high reported growth rates, lived poverty at the grassroots remains little changed’ (Dulani et al. 2013); others even question the growth revival referring to poor data
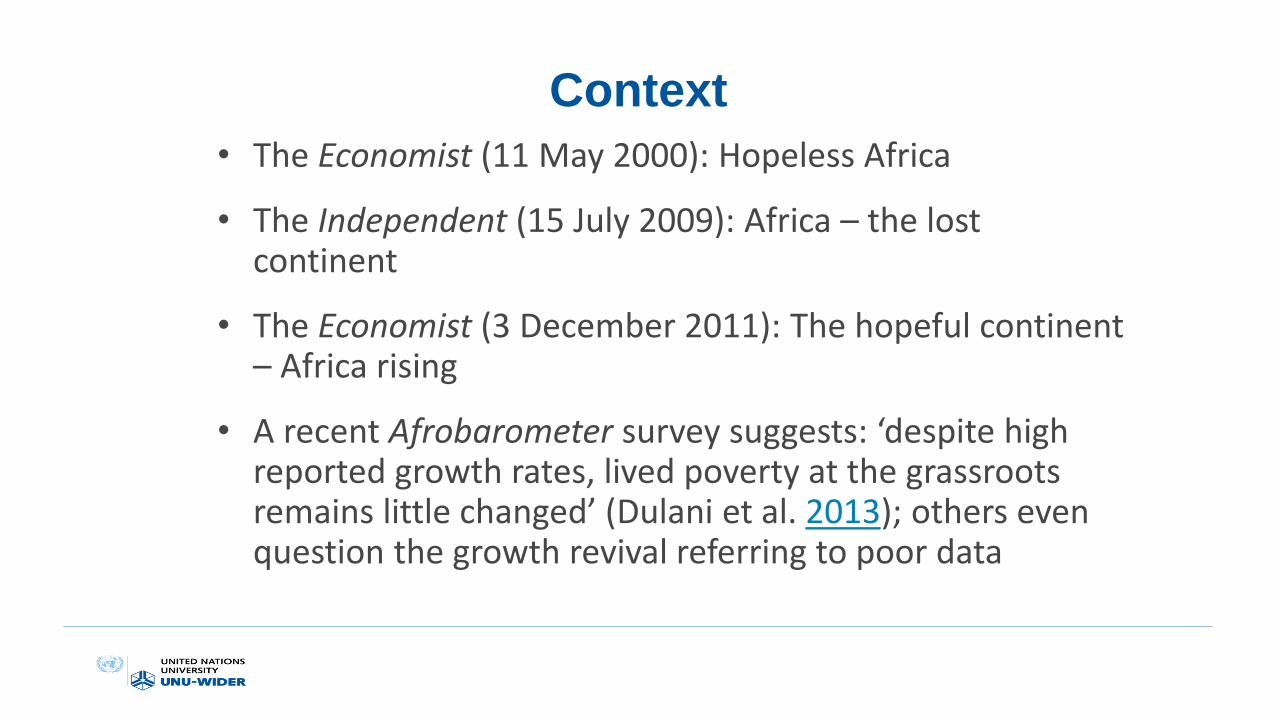
Pressing questions
• What is really happening?
• What is going on at country level?
• Can one make sense of all this?
• Policy implications – more broadly and for National Treasury’s Africa strategy
Macro-economic Background
Key issues
• A growth turn-around but still poor
• Variability
• New vulnerabilities
• Public sector dependence on foreign inflows and indirect
taxes
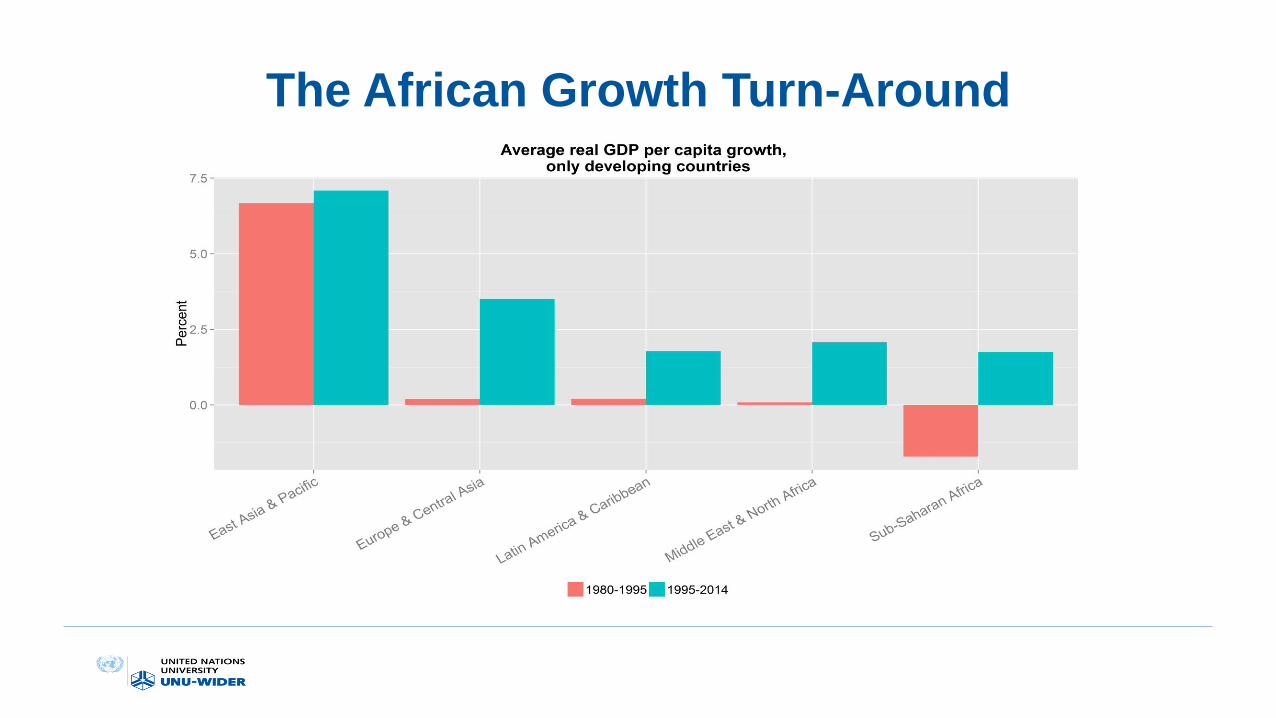
The African Growth Turn-Around
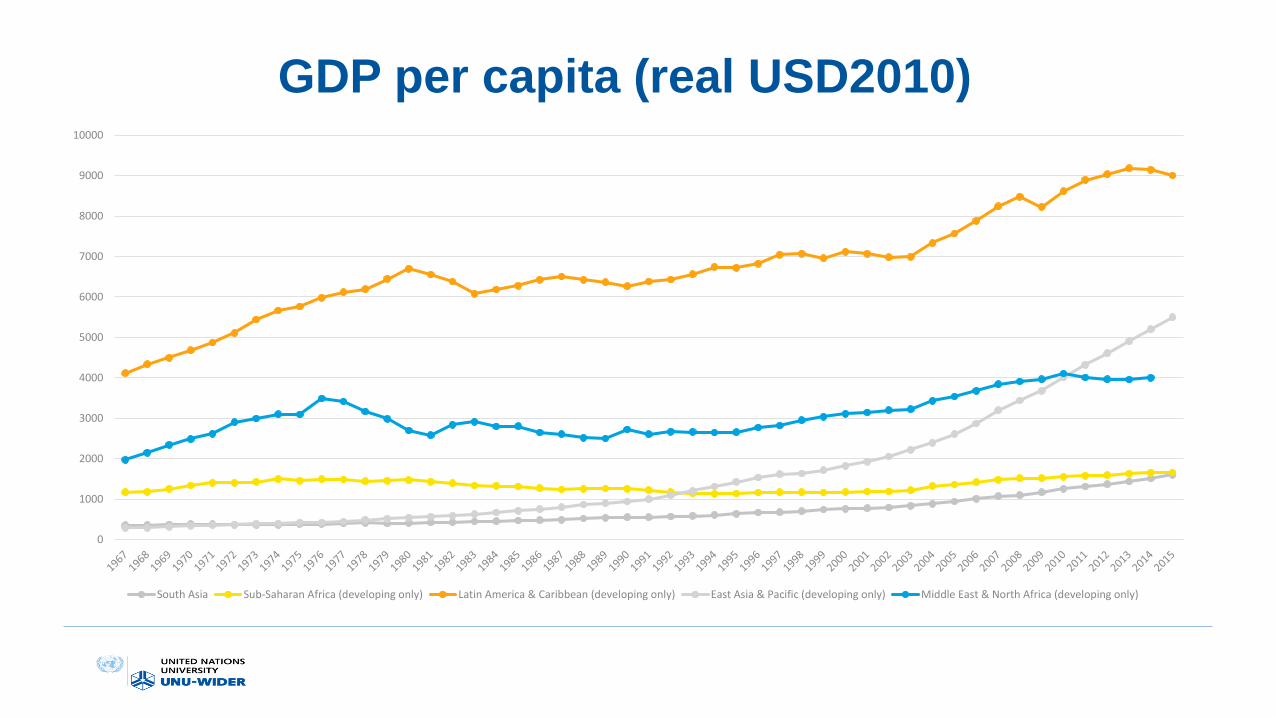
GDP per capita (real USD2010)
0
1000
2000
3000
4000
5000
6000
7000
8000
9000
10000
South Asia Sub-Saharan Africa (developing only) Latin America & Caribbean (developing only) East Asia & Pacific (developing only) Middle East & North Africa (developing only)
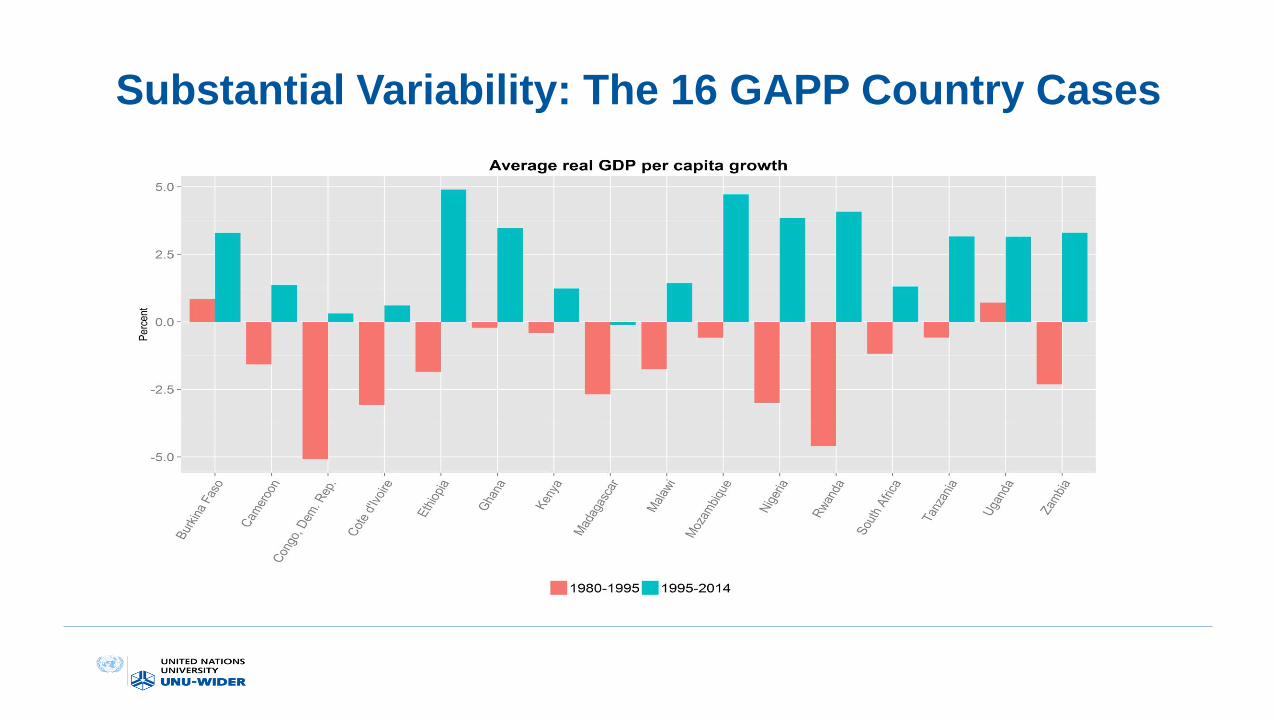
Substantial Variability: The 16 GAPP Country Cases
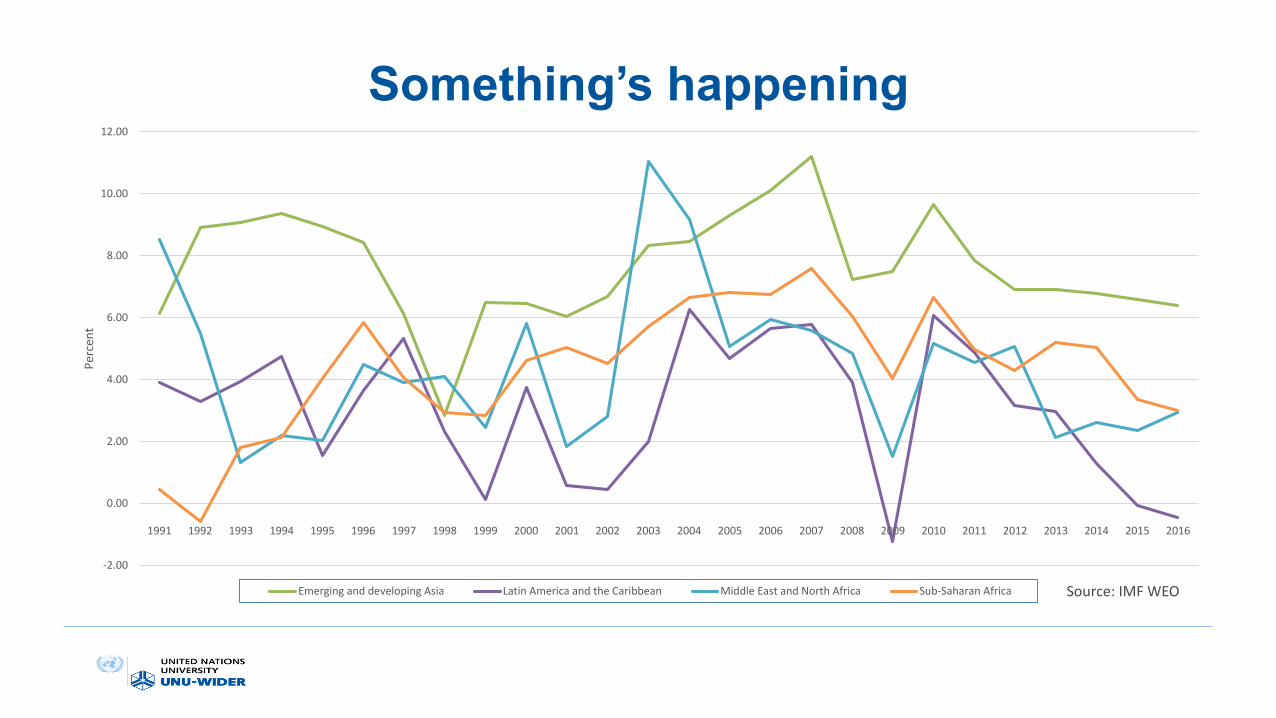
Something’s happening
-2.00
0.00
2.00
4.00
6.00
8.00
10.00
12.00
1991 1992 1993 1994 1995 1996 1997 1998 1999 2000 2001 2002 2003 2004 2005 2006 2007 2008 2009 2010 2011 2012 2013 2014 2015 2016
Per
cen
t
Emerging and developing Asia Latin America and the Caribbean Middle East and North Africa Sub-Saharan Africa Source: IMF WEO
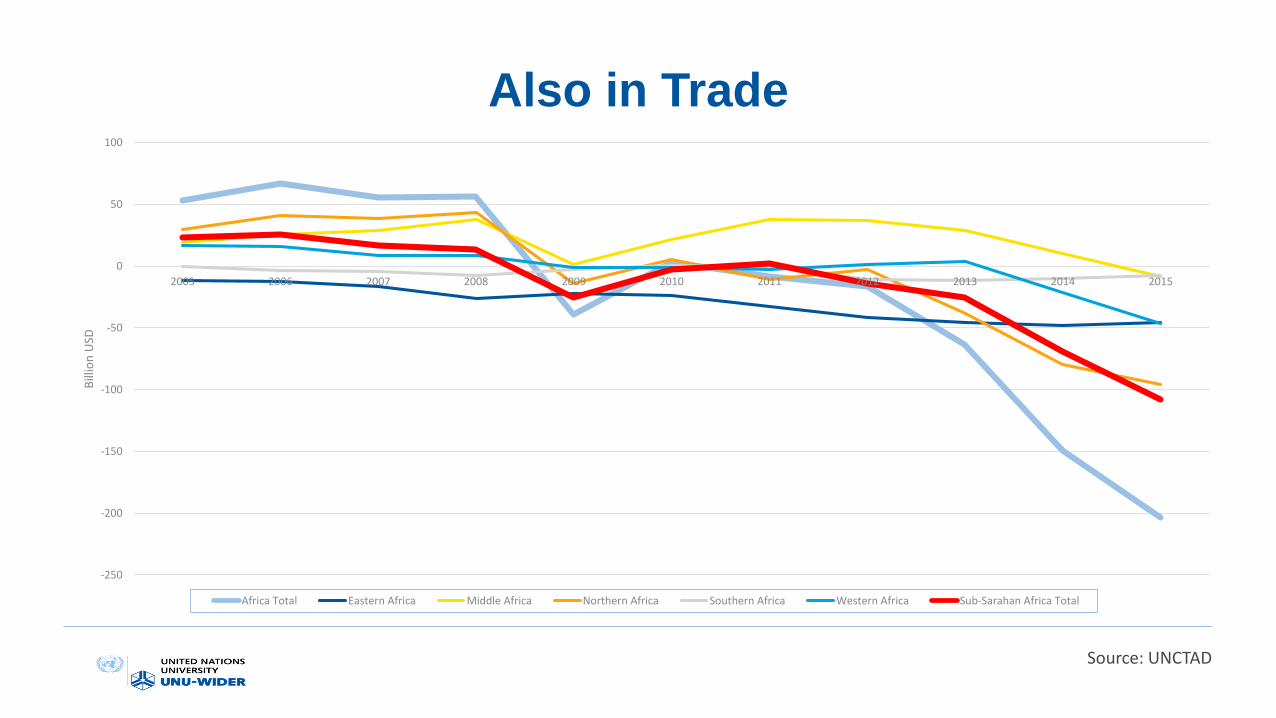
Also in Trade
Source: UNCTAD
-250
-200
-150
-100
-50
0
50
100
2005 2006 2007 2008 2009 2010 2011 2012 2013 2014 2015
Bill
ion
USD
Africa Total Eastern Africa Middle Africa Northern Africa Southern Africa Western Africa Sub-Sarahan Africa Total
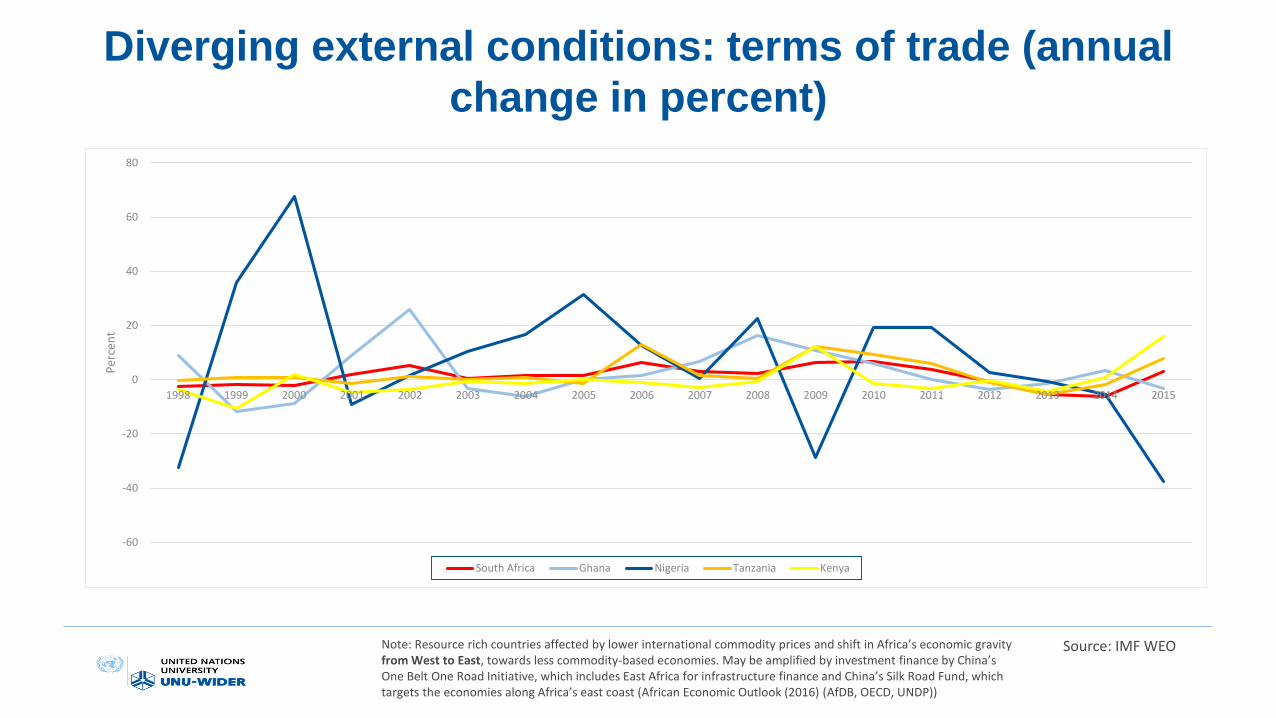
Diverging external conditions: terms of trade (annual
change in percent)
-60
-40
-20
0
20
40
60
80
1998 1999 2000 2001 2002 2003 2004 2005 2006 2007 2008 2009 2010 2011 2012 2013 2014 2015
Per
cen
t
South Africa Ghana Nigeria Tanzania Kenya
Source: IMF WEONote: Resource rich countries affected by lower international commodity prices and shift in Africa’s economic gravity from West to East, towards less commodity-based economies. May be amplified by investment finance by China’s One Belt One Road Initiative, which includes East Africa for infrastructure finance and China’s Silk Road Fund, which targets the economies along Africa’s east coast (African Economic Outlook (2016) (AfDB, OECD, UNDP))
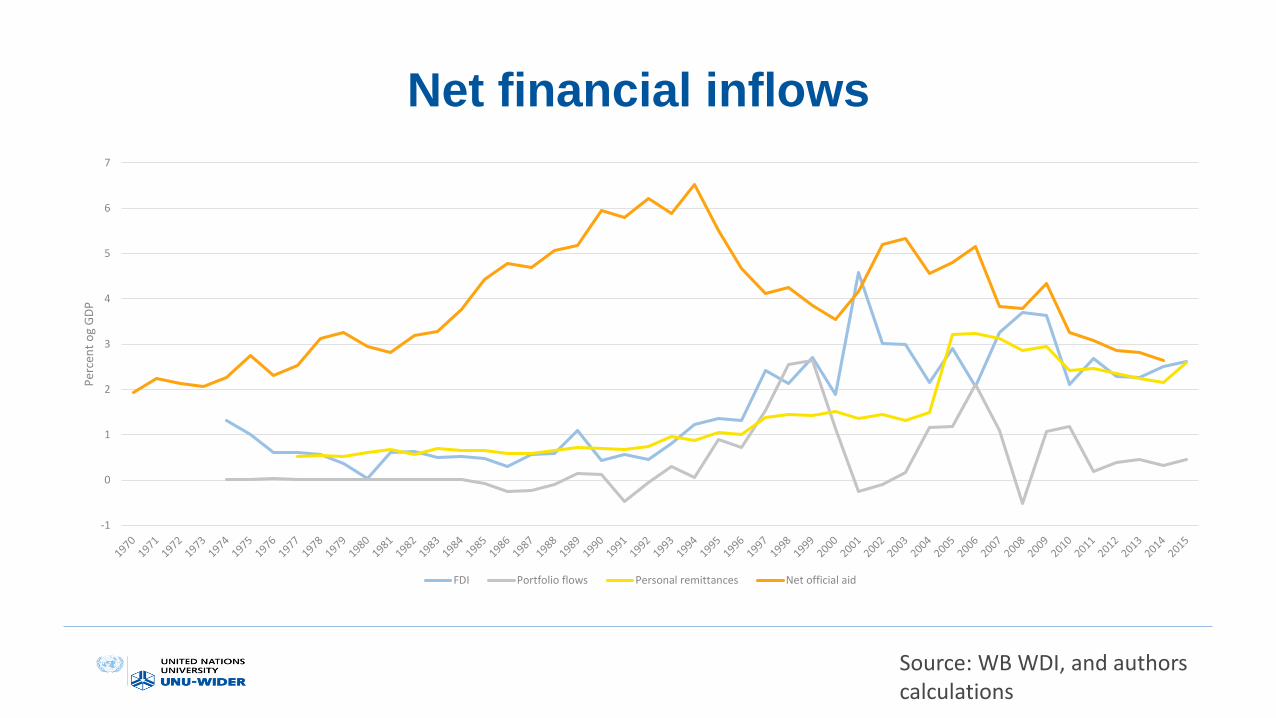
Net financial inflows
-1
0
1
2
3
4
5
6
7
Per
cen
t o
g G
DP
FDI Portfolio flows Personal remittances Net official aid
Source: WB WDI, and authors calculations
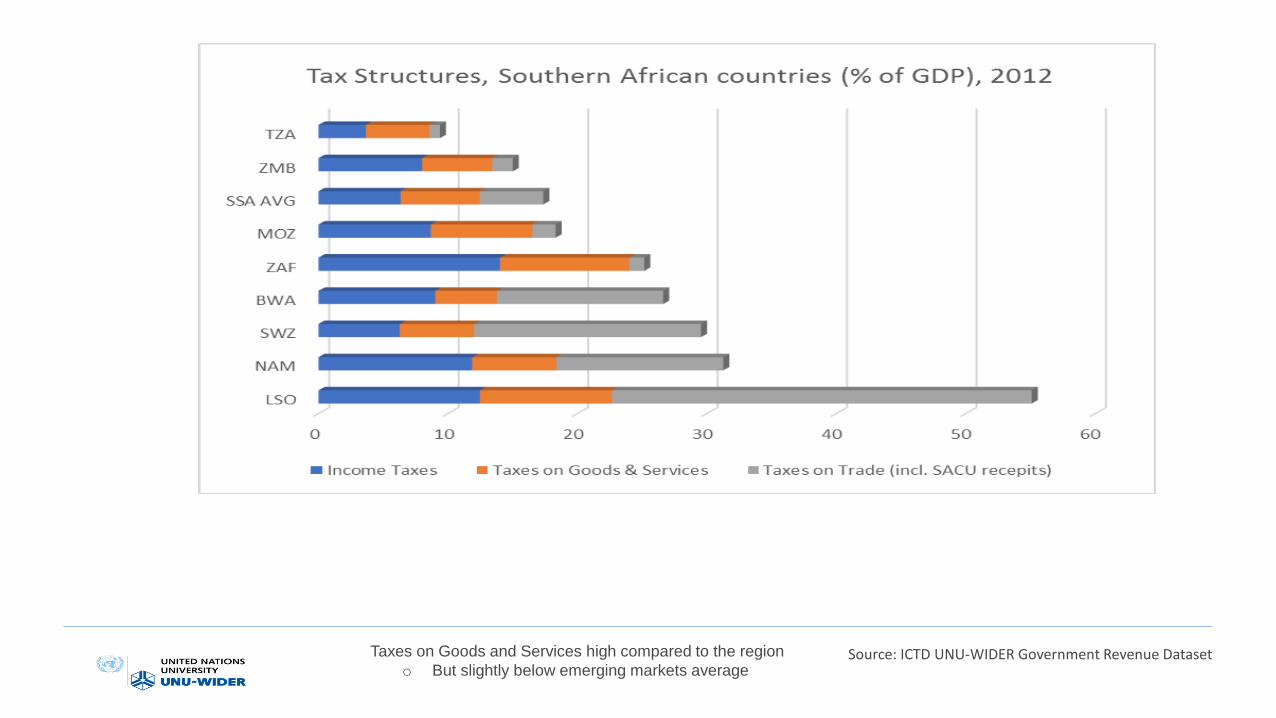
Taxes on Goods and Services high compared to the region
o But slightly below emerging markets averageSource: ICTD UNU-WIDER Government Revenue Dataset

Structural Dimensions
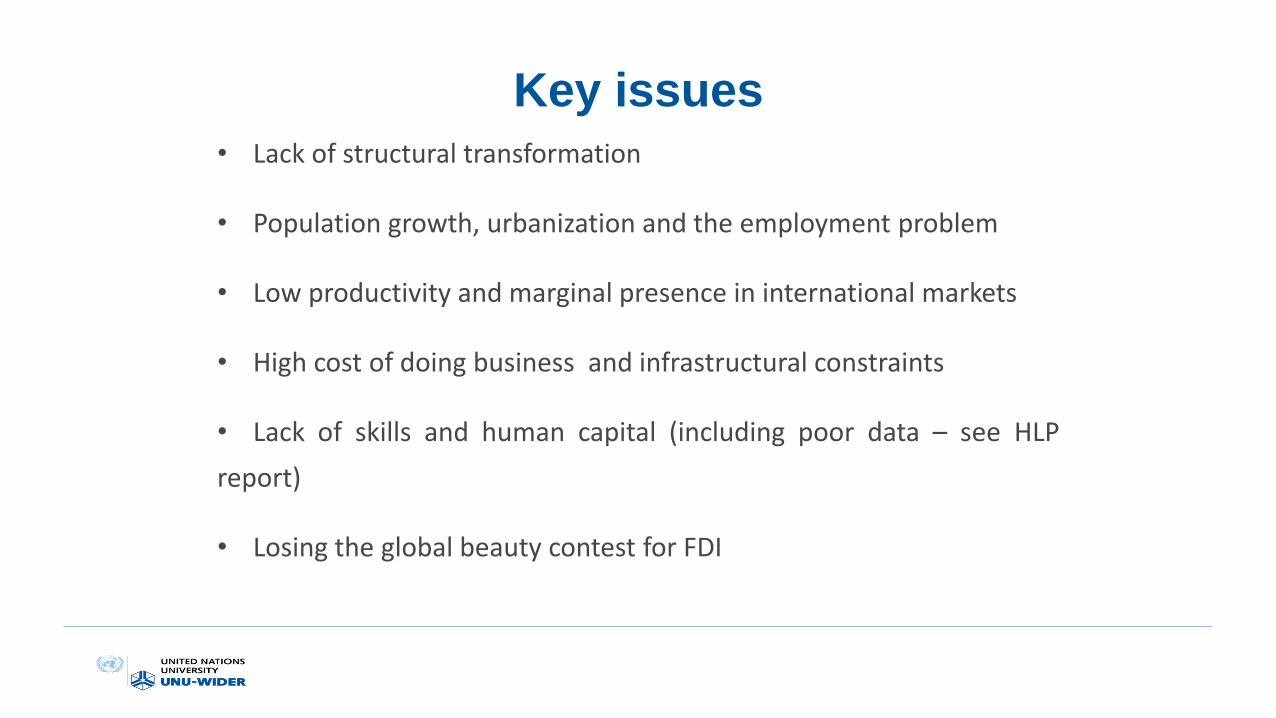
Key issues
• Lack of structural transformation
• Population growth, urbanization and the employment problem
• Low productivity and marginal presence in international markets
• High cost of doing business and infrastructural constraints
• Lack of skills and human capital (including poor data – see HLP
report)
• Losing the global beauty contest for FDI
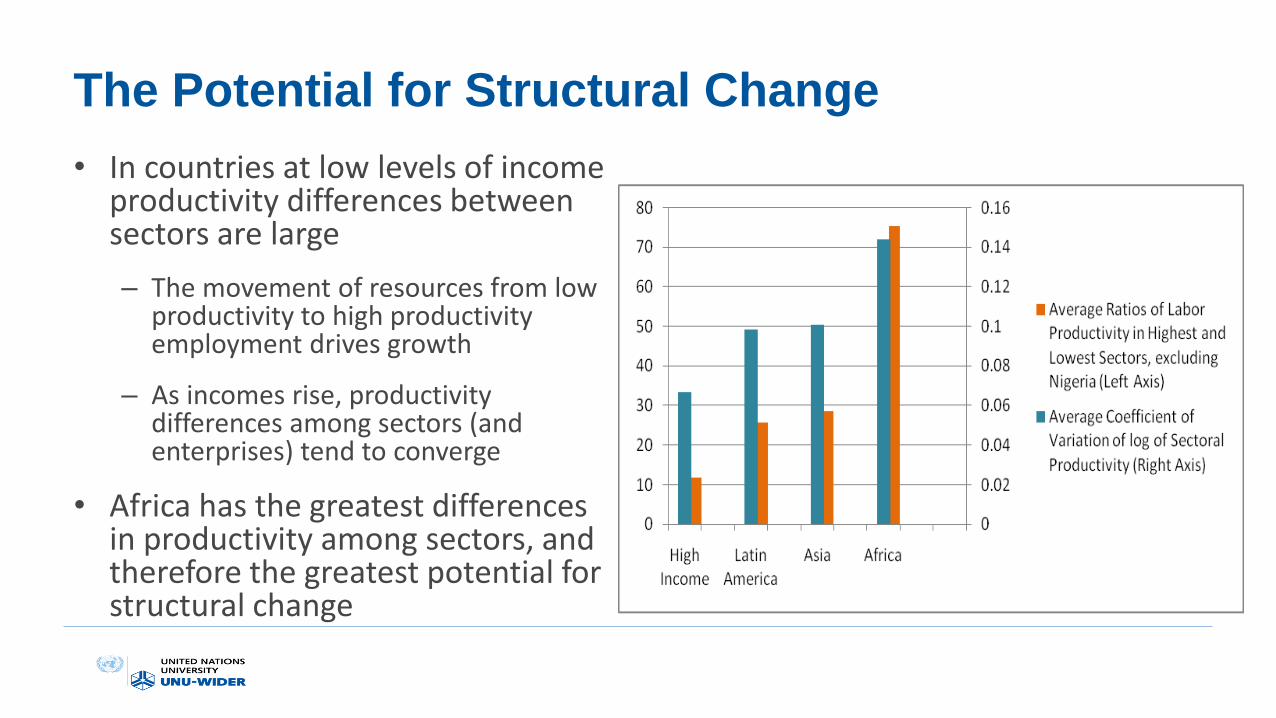
The Potential for Structural Change
• In countries at low levels of income productivity differences between sectors are large
– The movement of resources from low productivity to high productivity employment drives growth
– As incomes rise, productivity differences among sectors (and enterprises) tend to converge
• Africa has the greatest differences in productivity among sectors, and therefore the greatest potential for structural change
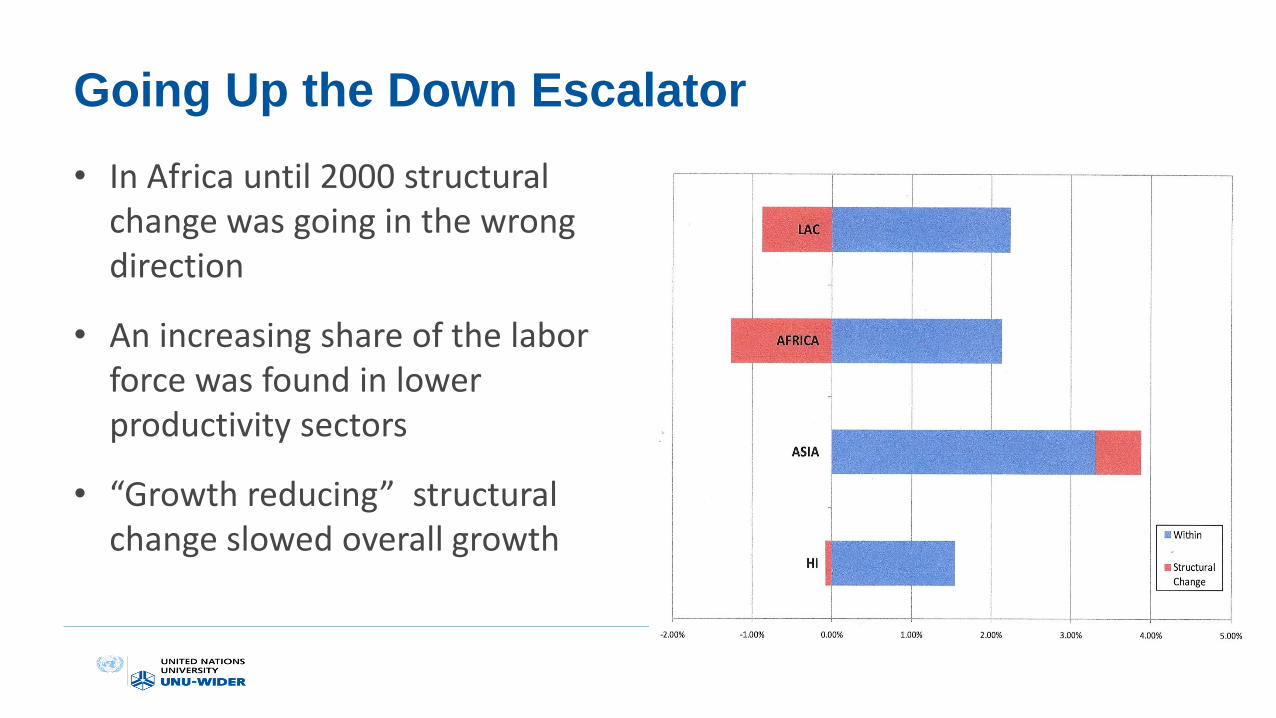
Going Up the Down Escalator
• In Africa until 2000 structural change was going in the wrong direction
• An increasing share of the labor force was found in lower productivity sectors
• “Growth reducing” structural change slowed overall growth
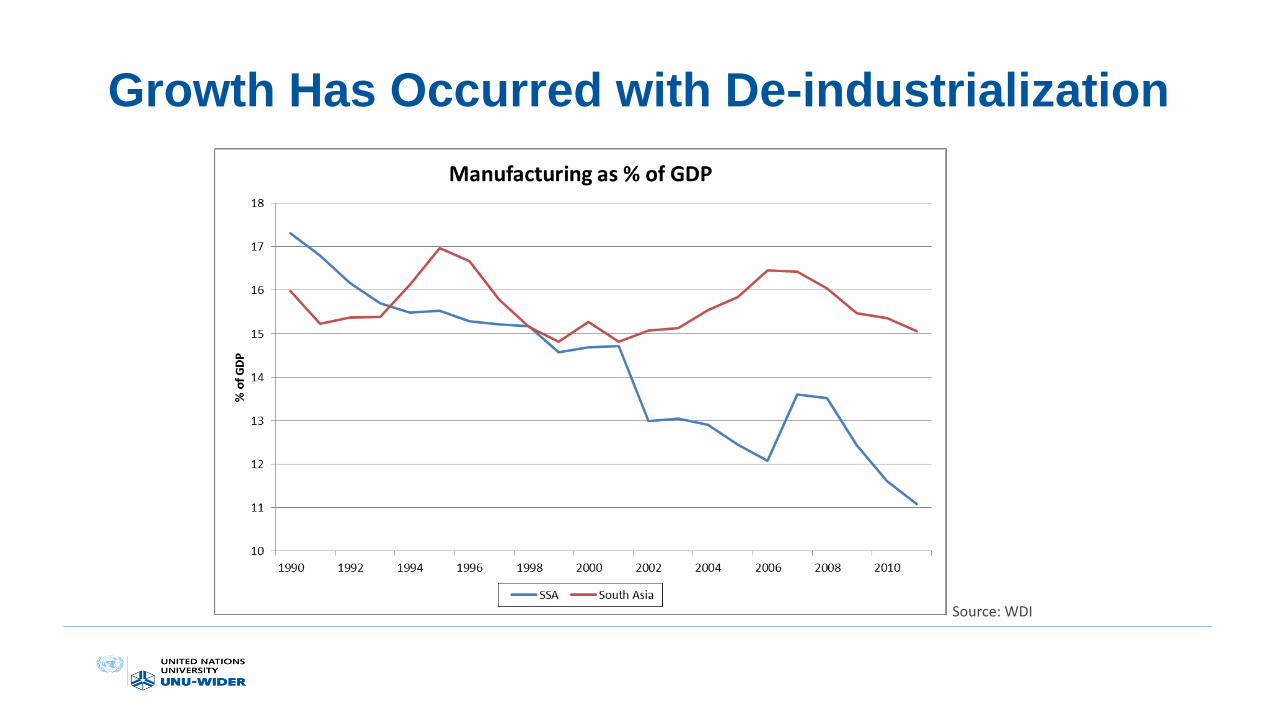
Growth Has Occurred with De-industrialization
Source: WDI
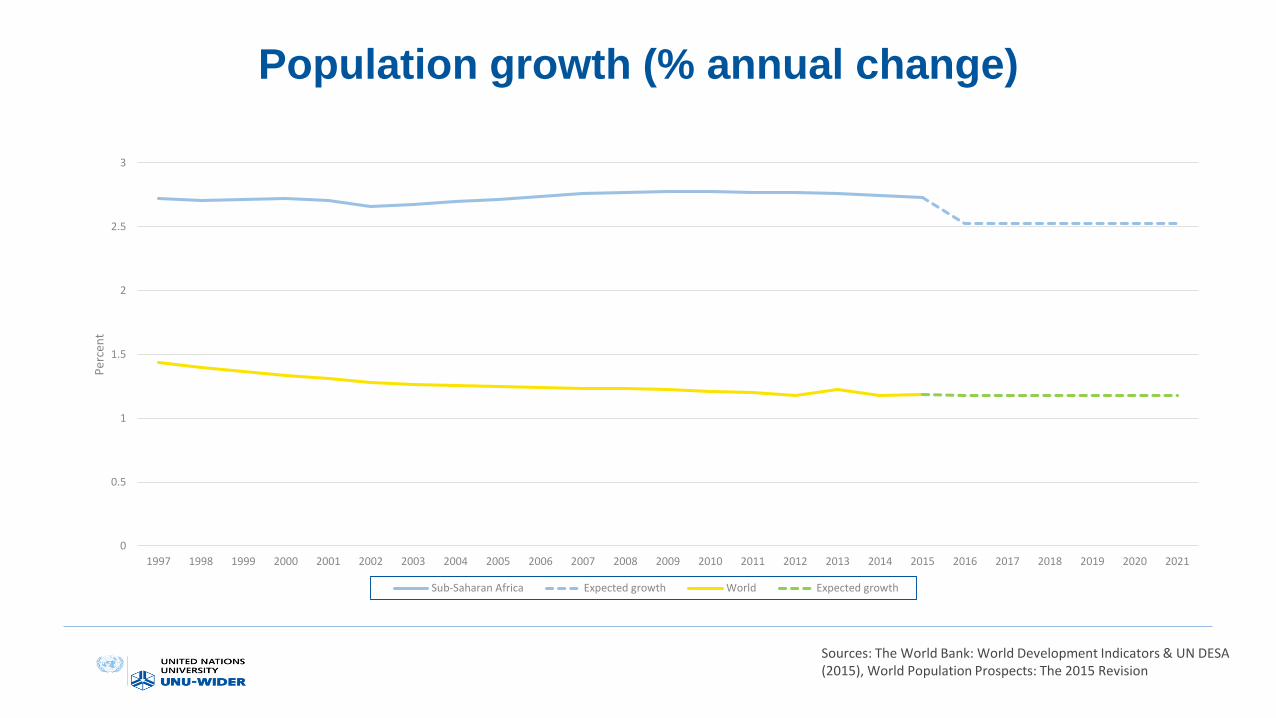
Population growth (% annual change)
0
0.5
1
1.5
2
2.5
3
1997 1998 1999 2000 2001 2002 2003 2004 2005 2006 2007 2008 2009 2010 2011 2012 2013 2014 2015 2016 2017 2018 2019 2020 2021
Per
cen
t
Sub-Saharan Africa Expected growth World Expected growth
Sources: The World Bank: World Development Indicators & UN DESA (2015), World Population Prospects: The 2015 Revision
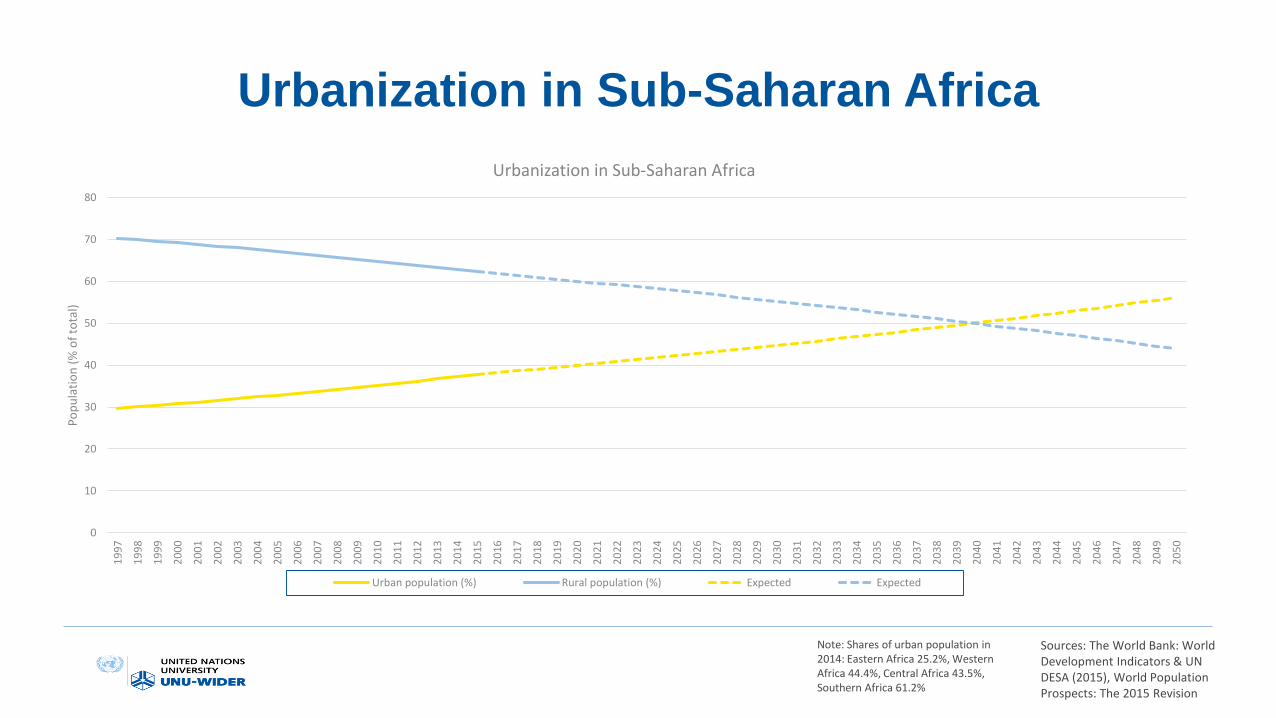
Urbanization in Sub-Saharan Africa
0
10
20
30
40
50
60
70
80
19
97
19
98
19
99
20
00
20
01
20
02
20
03
20
04
20
05
20
06
20
07
20
08
20
09
20
10
20
11
20
12
20
13
20
14
20
15
20
16
20
17
20
18
20
19
20
20
20
21
20
22
20
23
20
24
20
25
20
26
20
27
20
28
20
29
20
30
20
31
20
32
20
33
20
34
20
35
20
36
20
37
20
38
20
39
20
40
20
41
20
42
20
43
20
44
20
45
20
46
20
47
20
48
20
49
20
50
Po
pu
lati
on
(%
of
tota
l)
Urbanization in Sub-Saharan Africa
Urban population (%) Rural population (%) Expected Expected
Sources: The World Bank: World Development Indicators & UN DESA (2015), World Population Prospects: The 2015 Revision
Note: Shares of urban population in 2014: Eastern Africa 25.2%, Western Africa 44.4%, Central Africa 43.5%, Southern Africa 61.2%
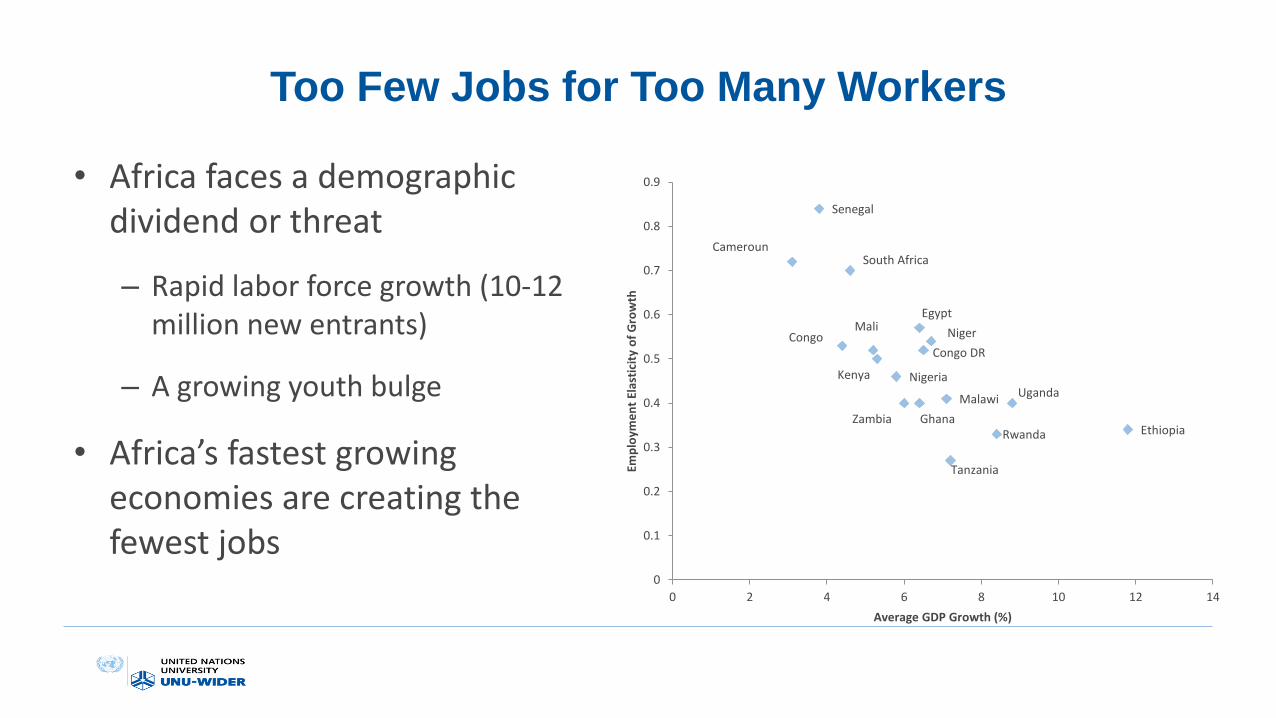
Too Few Jobs for Too Many Workers
• Africa faces a demographic dividend or threat
– Rapid labor force growth (10-12 million new entrants)
– A growing youth bulge
• Africa’s fastest growing economies are creating the fewest jobs
Ethiopia
Uganda
Rwanda
Tanzania
Malawi
Niger
Congo DR
Ghana
Egypt
Zambia
NigeriaKenya
Mali
South Africa
Congo
Senegal
Cameroun
0
0.1
0.2
0.3
0.4
0.5
0.6
0.7
0.8
0.9
0 2 4 6 8 10 12 14
Emp
loym
en
t El
asti
city
of
Gro
wth
Average GDP Growth (%)
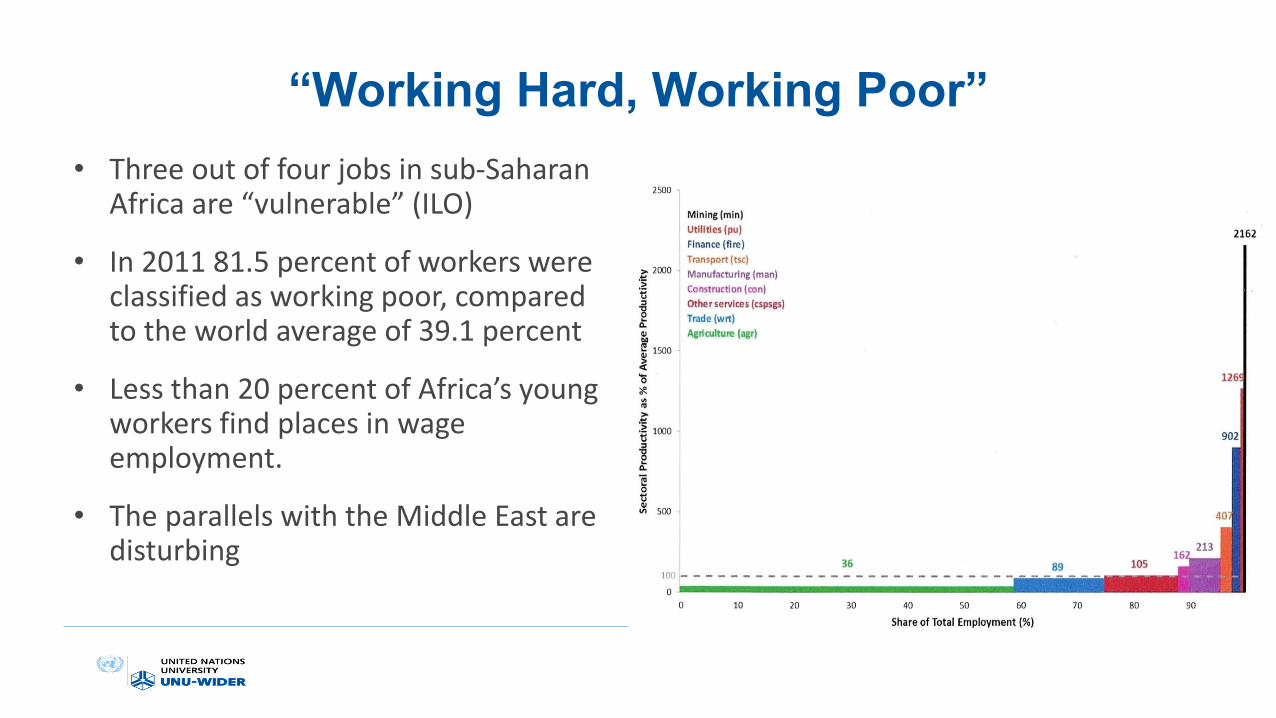
“Working Hard, Working Poor”
• Three out of four jobs in sub-Saharan Africa are “vulnerable” (ILO)
• In 2011 81.5 percent of workers were classified as working poor, compared to the world average of 39.1 percent
• Less than 20 percent of Africa’s young workers find places in wage employment.
• The parallels with the Middle East are disturbing
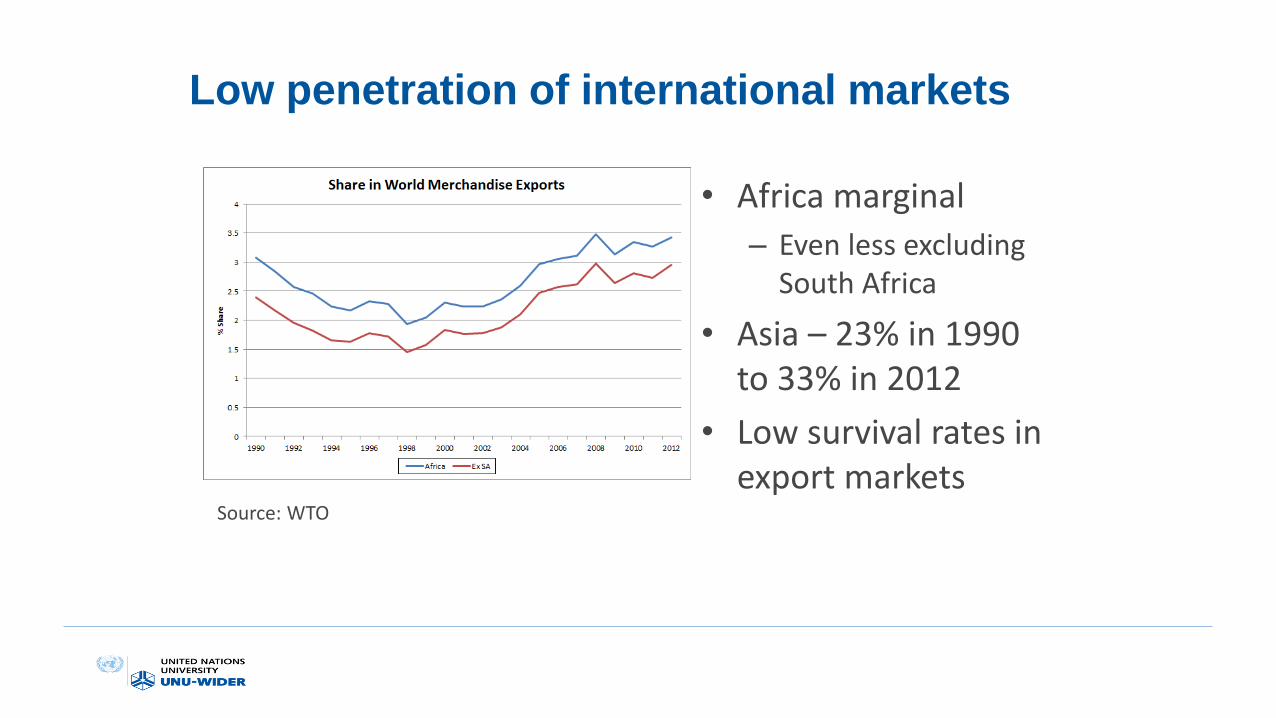
Low penetration of international markets
• Africa marginal
– Even less excluding South Africa
• Asia – 23% in 1990 to 33% in 2012
• Low survival rates in export markets
Source: WTO
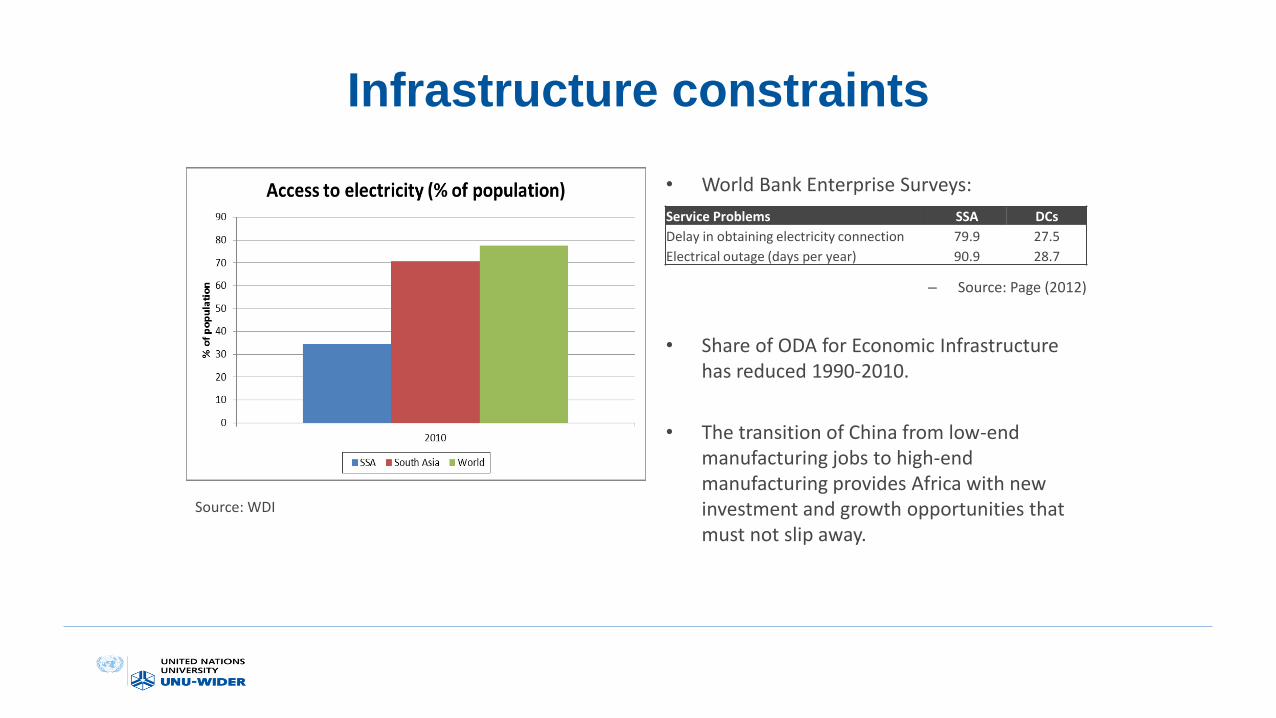
Infrastructure constraints
• World Bank Enterprise Surveys:
– Source: Page (2012)
• Share of ODA for Economic Infrastructure has reduced 1990-2010.
• The transition of China from low-end manufacturing jobs to high-end manufacturing provides Africa with new investment and growth opportunities that must not slip away.
Service Problems SSA DCs
Delay in obtaining electricity connection 79.9 27.5
Electrical outage (days per year) 90.9 28.7
Source: WDI
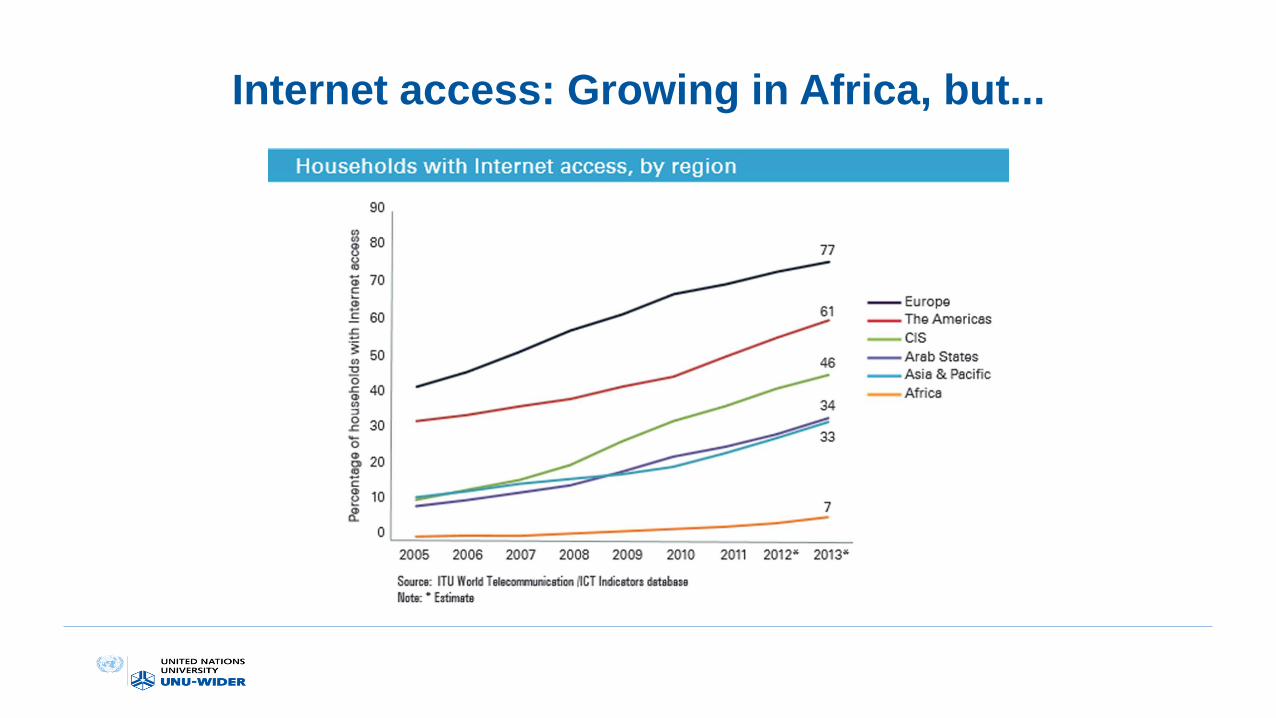
Internet access: Growing in Africa, but...
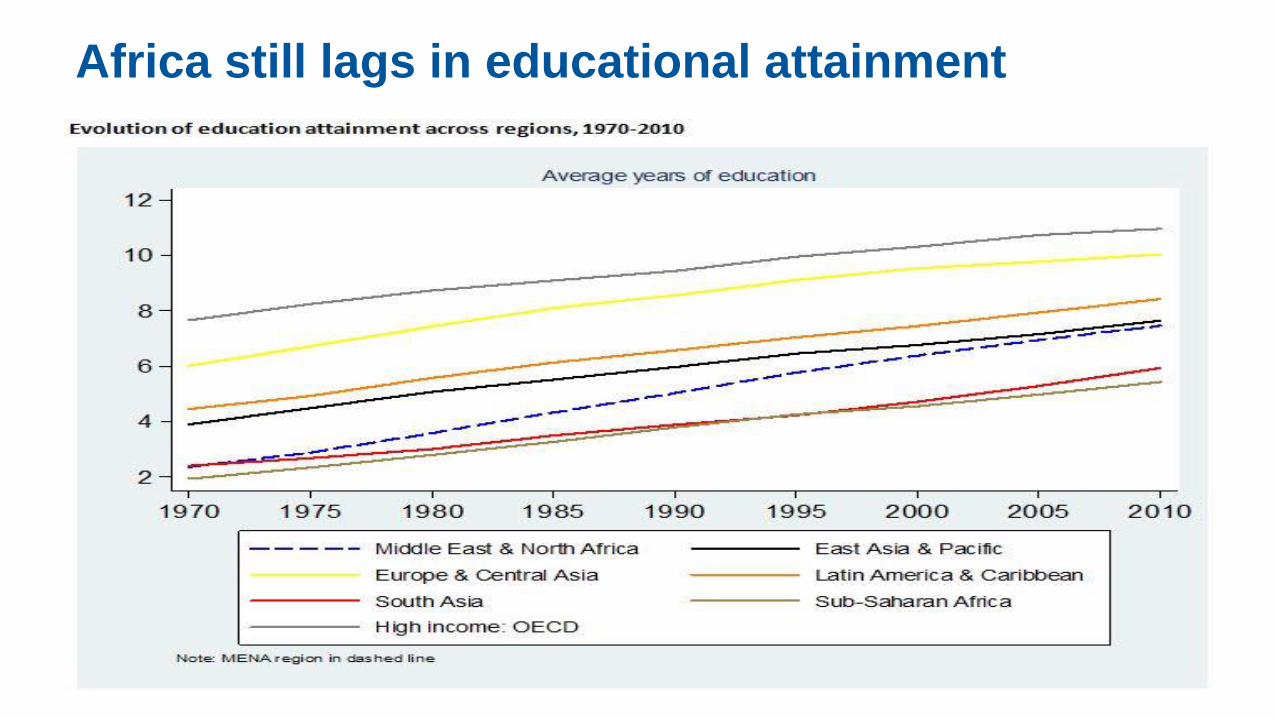
Africa still lags in educational attainment
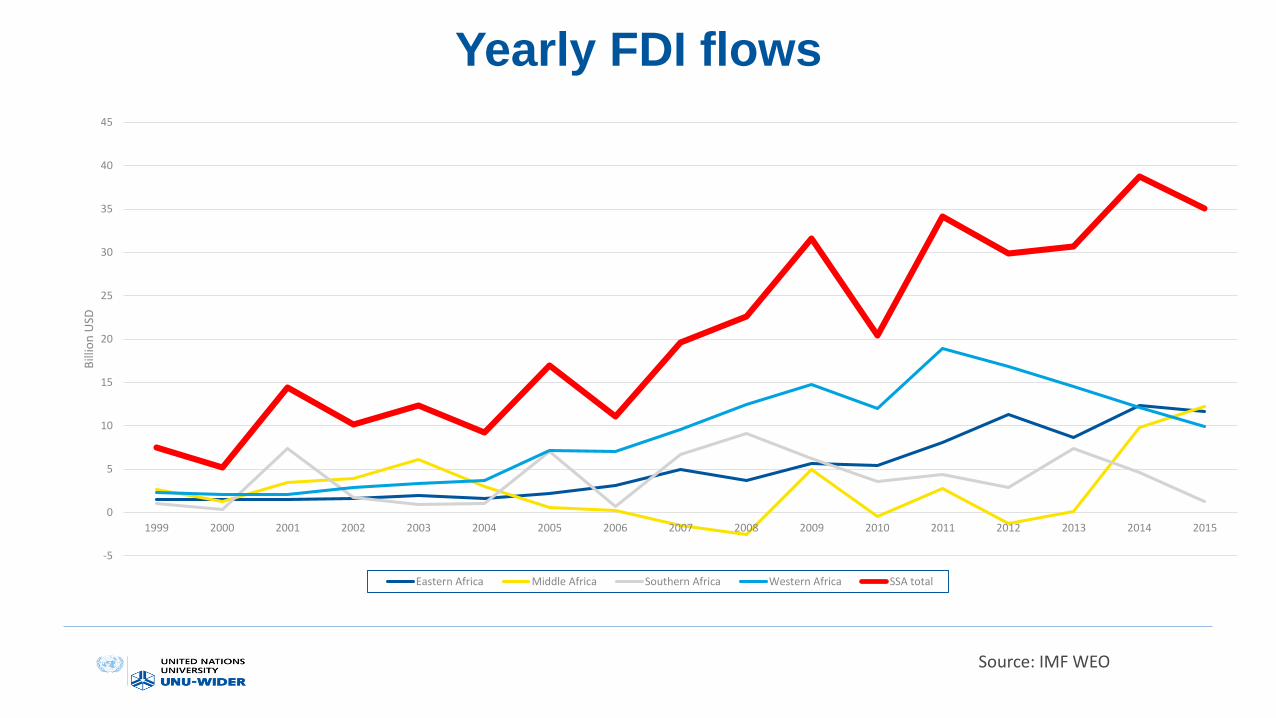
Yearly FDI flows
Source: IMF WEO
-5
0
5
10
15
20
25
30
35
40
45
1999 2000 2001 2002 2003 2004 2005 2006 2007 2008 2009 2010 2011 2012 2013 2014 2015
Bill
ion
USD
Eastern Africa Middle Africa Southern Africa Western Africa SSA total
WIDER’s engagement in Africa
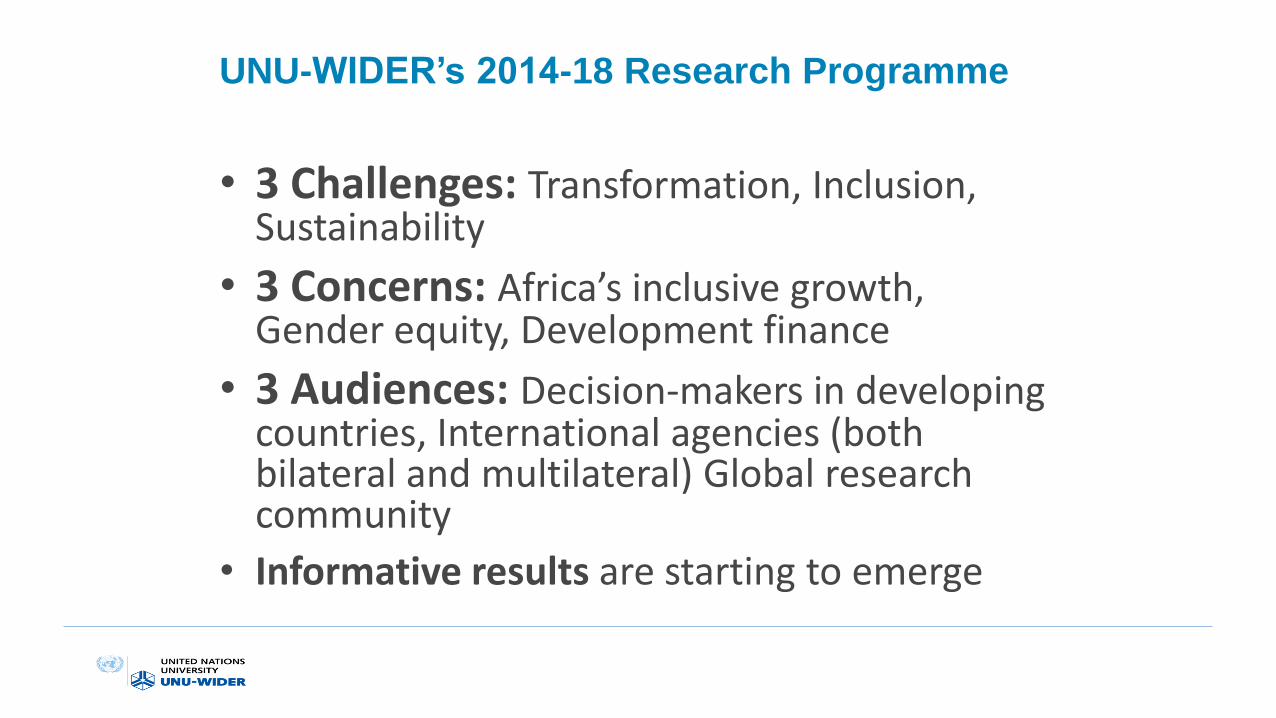
UNU-WIDER’s 2014-18 Research Programme
• 3 Challenges: Transformation, Inclusion, Sustainability
• 3 Concerns: Africa’s inclusive growth, Gender equity, Development finance
• 3 Audiences: Decision-makers in developing countries, International agencies (both bilateral and multilateral) Global research community
• Informative results are starting to emerge
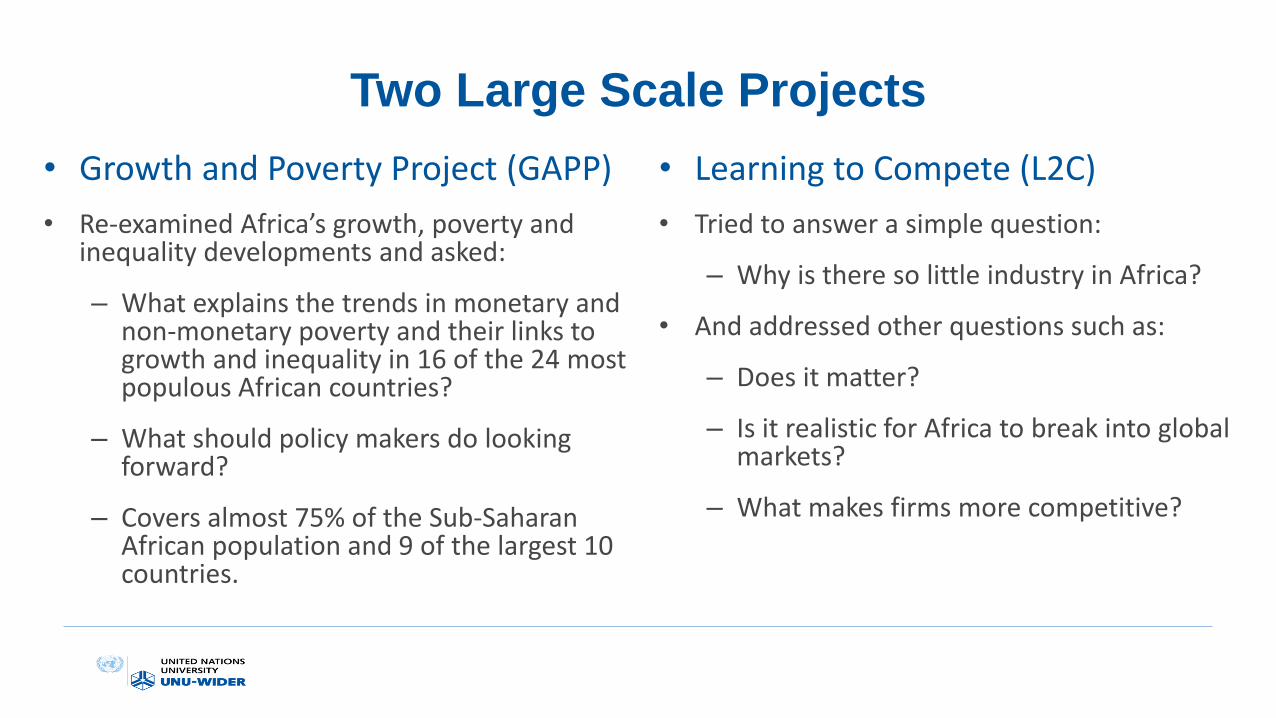
Two Large Scale Projects
• Growth and Poverty Project (GAPP)
• Re-examined Africa’s growth, poverty and inequality developments and asked:
– What explains the trends in monetary and non-monetary poverty and their links to growth and inequality in 16 of the 24 most populous African countries?
– What should policy makers do looking forward?
– Covers almost 75% of the Sub-Saharan African population and 9 of the largest 10 countries.
• Learning to Compete (L2C)
• Tried to answer a simple question:
– Why is there so little industry in Africa?
• And addressed other questions such as:
– Does it matter?
– Is it realistic for Africa to break into global markets?
– What makes firms more competitive?

GAPP Approach and Country
Categorisation
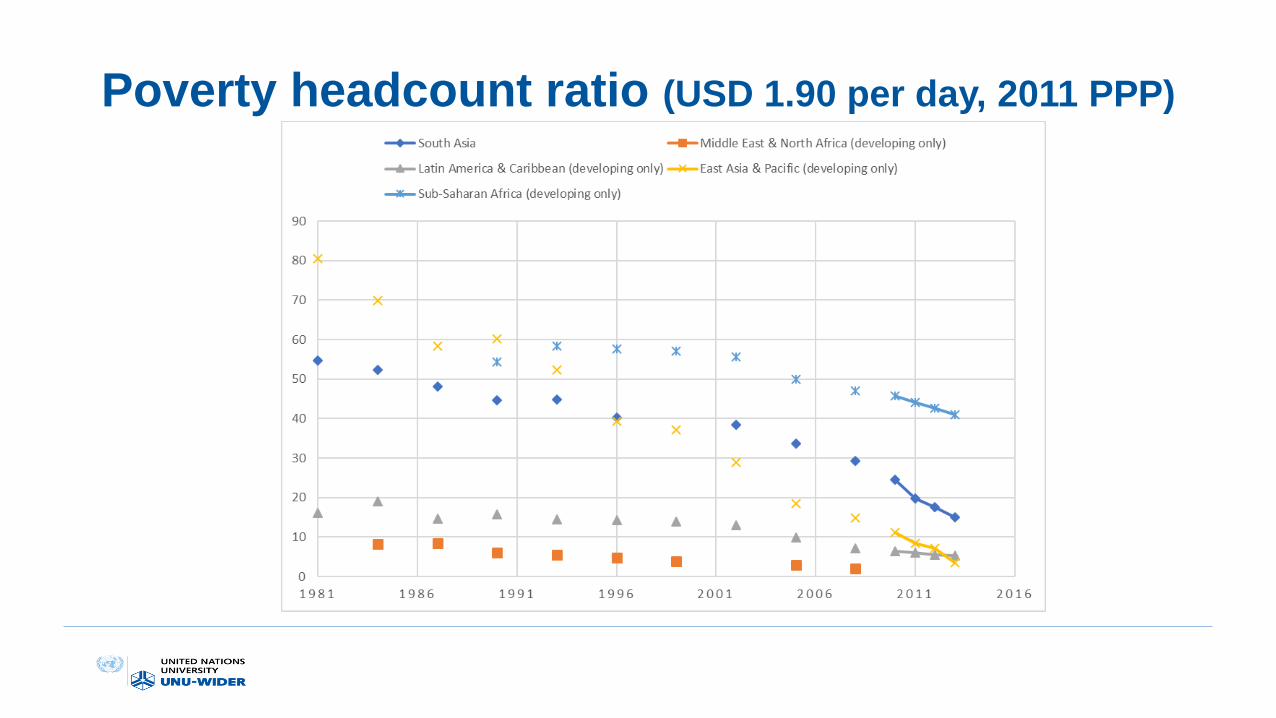
Poverty headcount ratio (USD 1.90 per day, 2011 PPP)
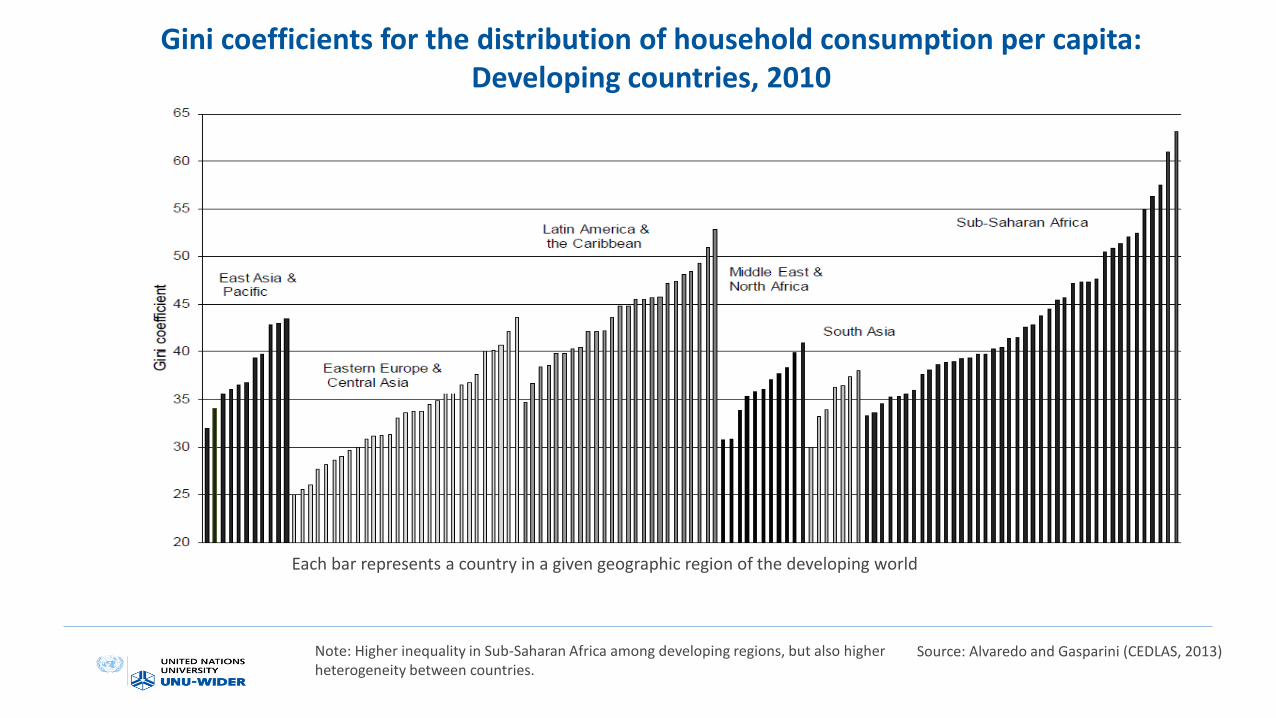
Gini coefficients for the distribution of household consumption per capita: Developing countries, 2010
Each bar represents a country in a given geographic region of the developing world
Source: Alvaredo and Gasparini (CEDLAS, 2013)Note: Higher inequality in Sub-Saharan Africa among developing regions, but also higher heterogeneity between countries.
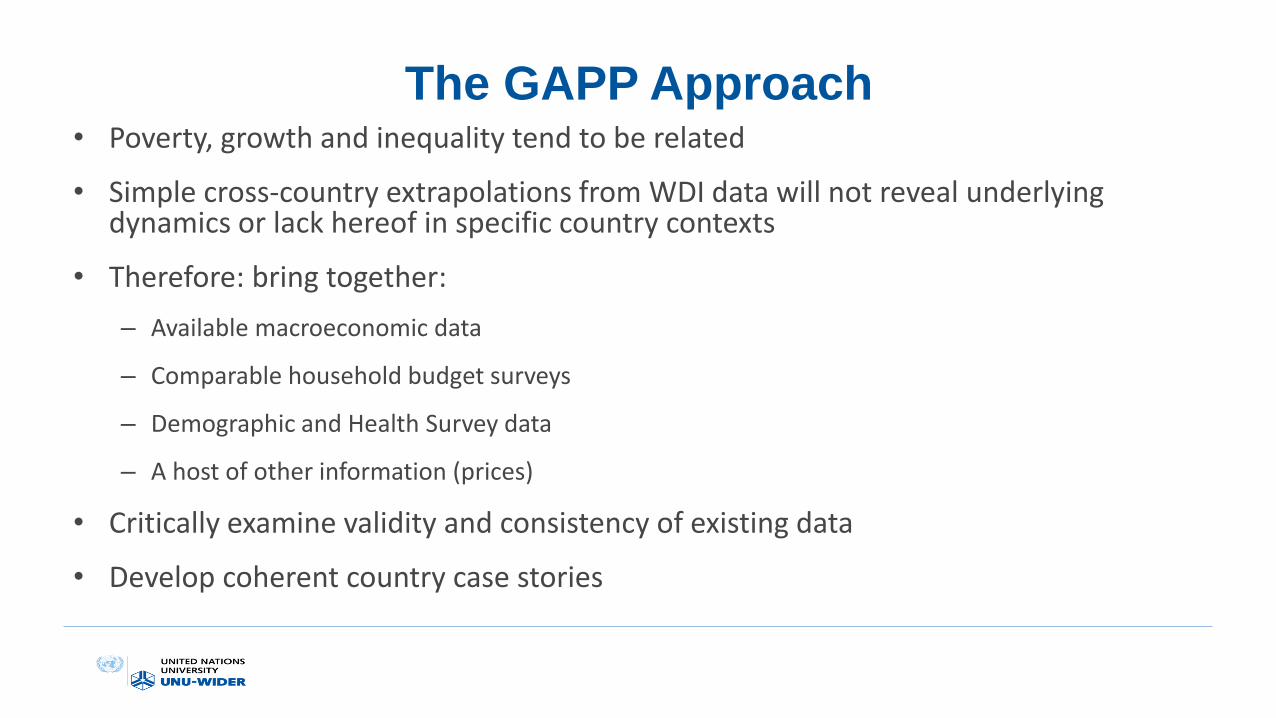
The GAPP Approach• Poverty, growth and inequality tend to be related
• Simple cross-country extrapolations from WDI data will not reveal underlying dynamics or lack hereof in specific country contexts
• Therefore: bring together:
– Available macroeconomic data
– Comparable household budget surveys
– Demographic and Health Survey data
– A host of other information (prices)
• Critically examine validity and consistency of existing data
• Develop coherent country case stories
GAPP
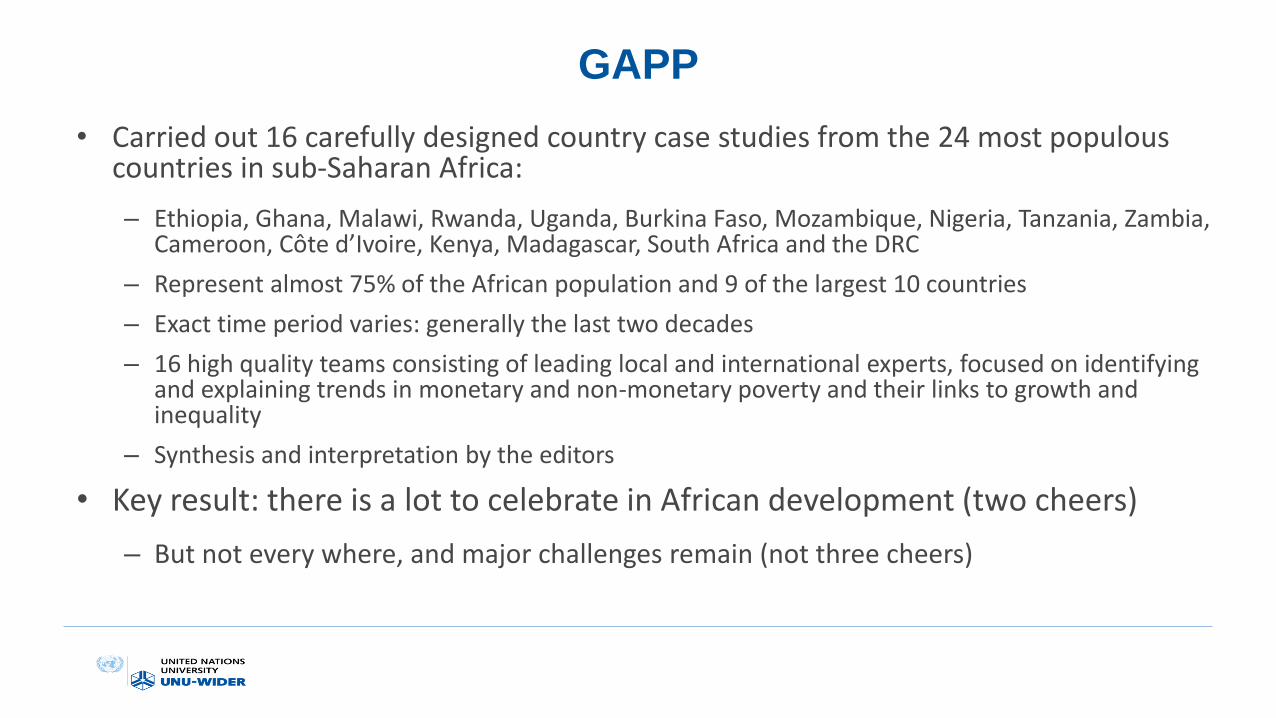
• Carried out 16 carefully designed country case studies from the 24 most populous countries in sub-Saharan Africa:
– Ethiopia, Ghana, Malawi, Rwanda, Uganda, Burkina Faso, Mozambique, Nigeria, Tanzania, Zambia, Cameroon, Côte d’Ivoire, Kenya, Madagascar, South Africa and the DRC
– Represent almost 75% of the African population and 9 of the largest 10 countries
– Exact time period varies: generally the last two decades
– 16 high quality teams consisting of leading local and international experts, focused on identifying and explaining trends in monetary and non-monetary poverty and their links to growth and inequality
– Synthesis and interpretation by the editors
• Key result: there is a lot to celebrate in African development (two cheers)
– But not every where, and major challenges remain (not three cheers)
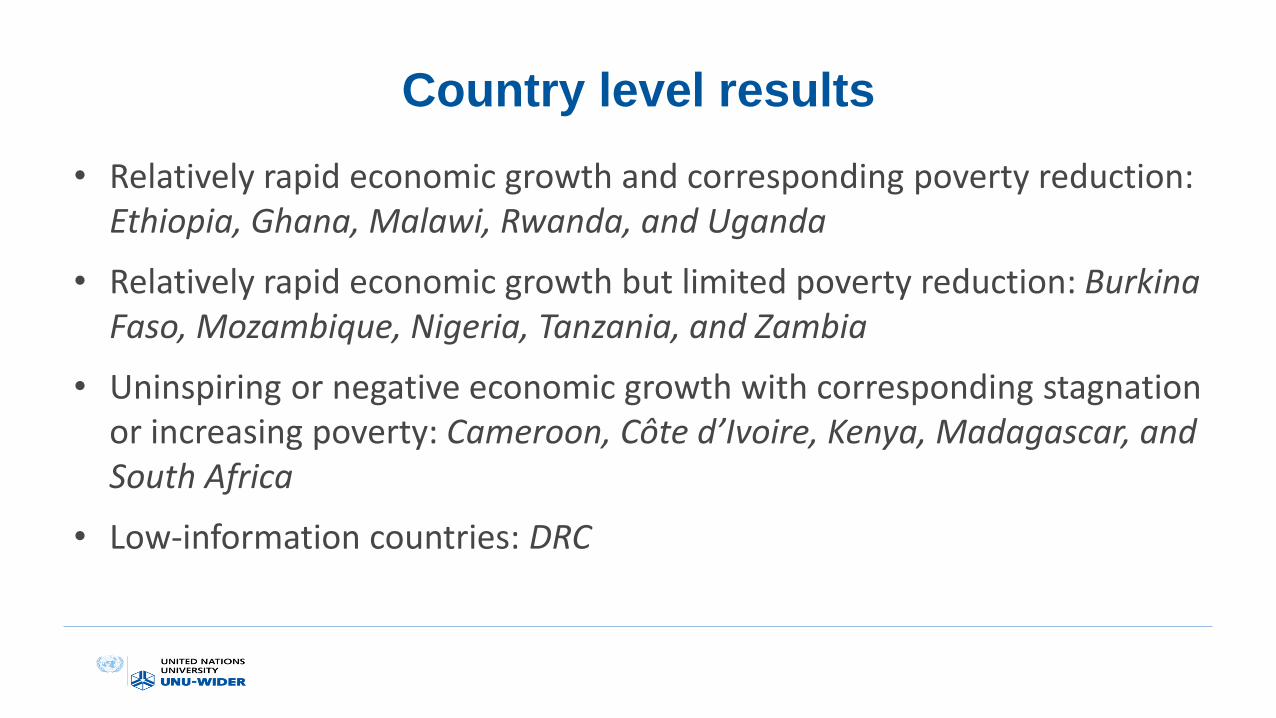
Country level results
• Relatively rapid economic growth and corresponding poverty reduction: Ethiopia, Ghana, Malawi, Rwanda, and Uganda
• Relatively rapid economic growth but limited poverty reduction: Burkina Faso, Mozambique, Nigeria, Tanzania, and Zambia
• Uninspiring or negative economic growth with corresponding stagnation or increasing poverty: Cameroon, Côte d’Ivoire, Kenya, Madagascar, and South Africa
• Low-information countries: DRC
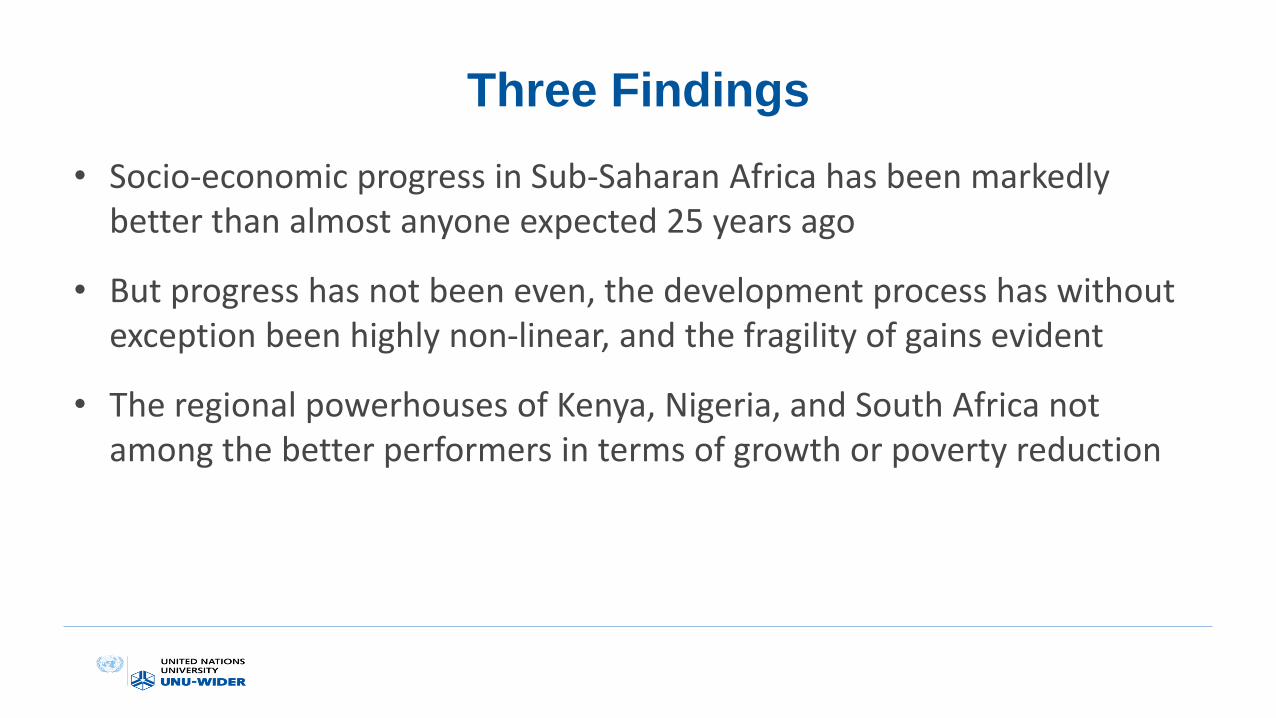
Three Findings
• Socio-economic progress in Sub-Saharan Africa has been markedly better than almost anyone expected 25 years ago
• But progress has not been even, the development process has without exception been highly non-linear, and the fragility of gains evident
• The regional powerhouses of Kenya, Nigeria, and South Africa not among the better performers in terms of growth or poverty reduction
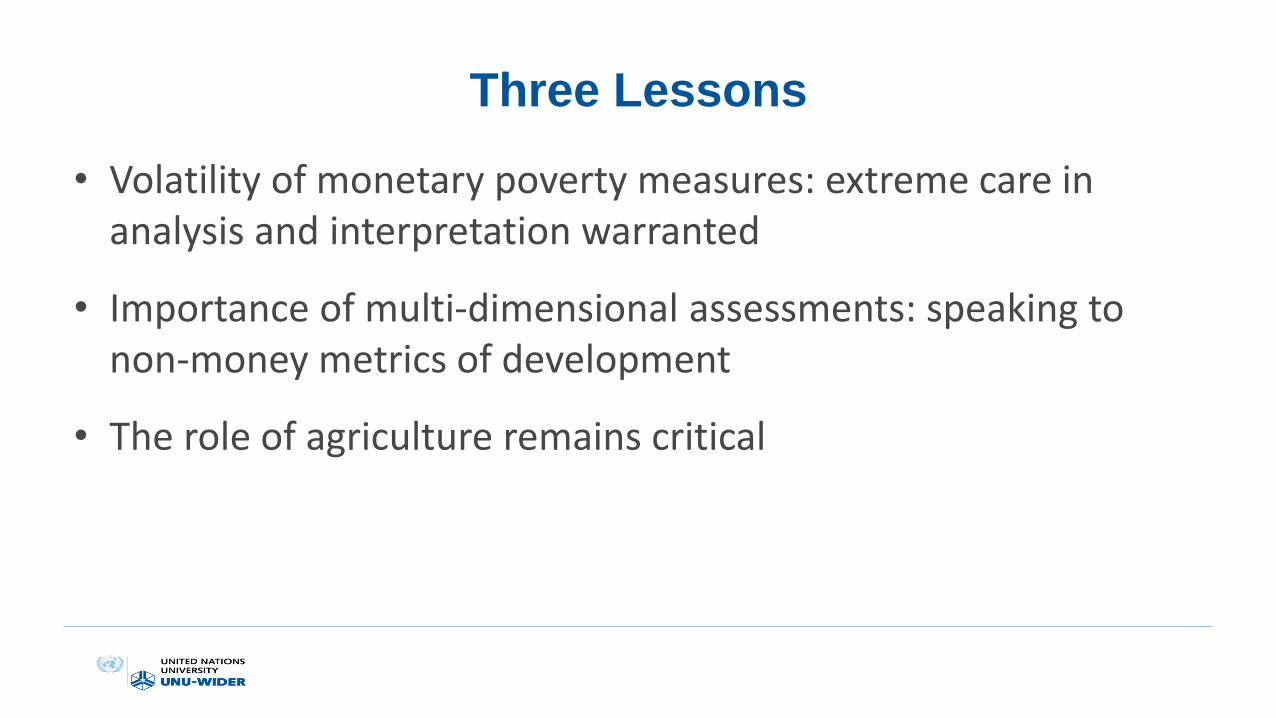
Three Lessons
• Volatility of monetary poverty measures: extreme care in analysis and interpretation warranted
• Importance of multi-dimensional assessments: speaking to non-money metrics of development
• The role of agriculture remains critical
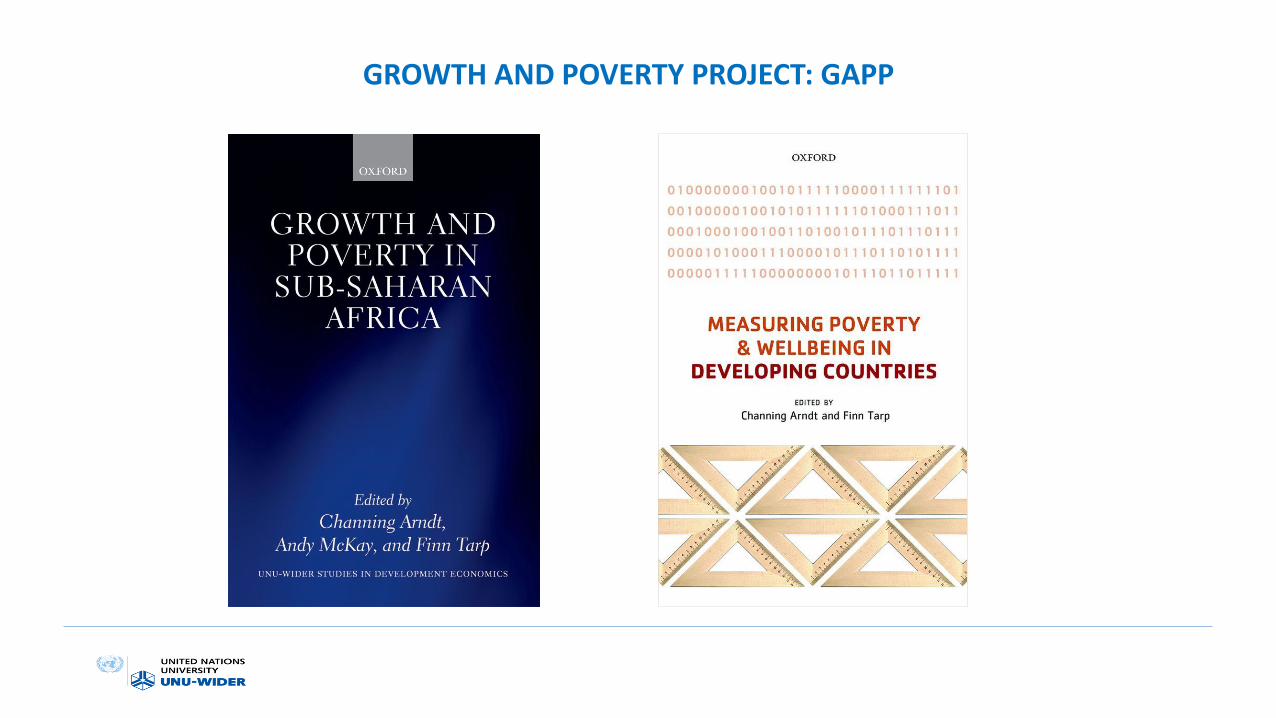
GROWTH AND POVERTY PROJECT: GAPP
Learning to Compete (L2C)
Understanding why there is so little industry in Africa
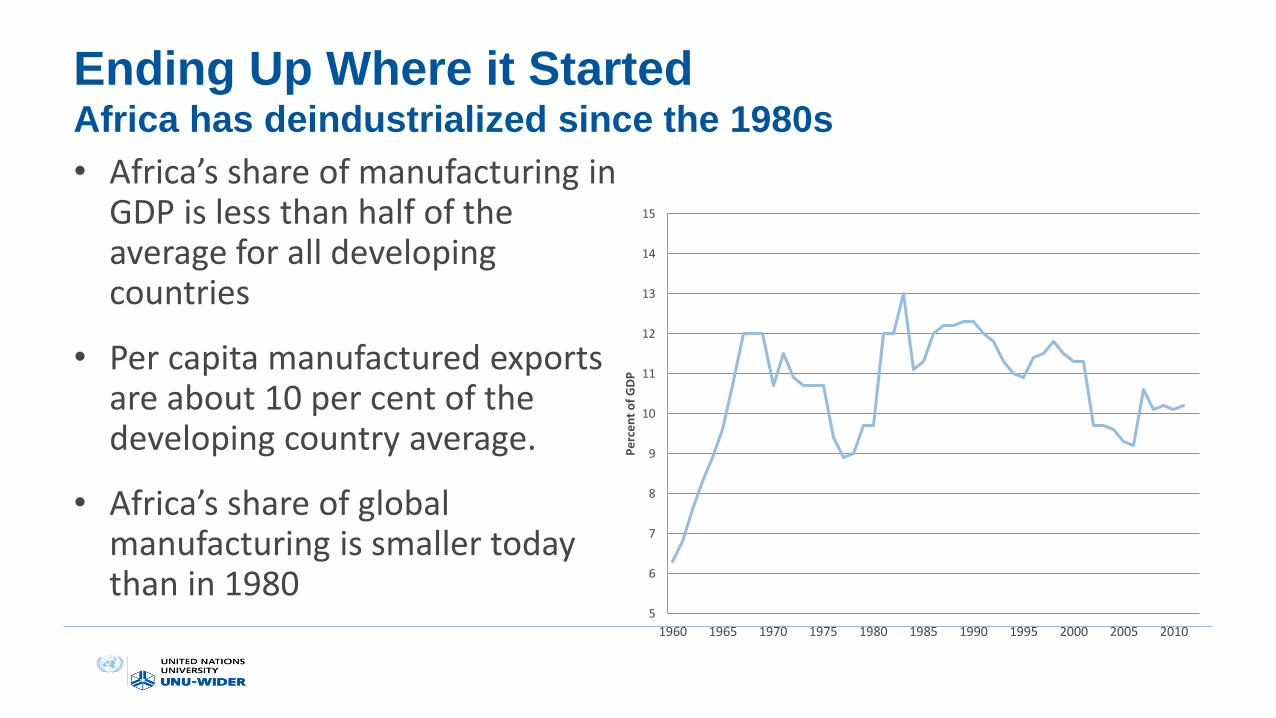
Ending Up Where it StartedAfrica has deindustrialized since the 1980s
• Africa’s share of manufacturing in GDP is less than half of the average for all developing countries
• Per capita manufactured exports are about 10 per cent of the developing country average.
• Africa’s share of global manufacturing is smaller today than in 1980
5
6
7
8
9
10
11
12
13
14
15
1960 1965 1970 1975 1980 1985 1990 1995 2000 2005 2010P
erc
en
t o
f G
DP
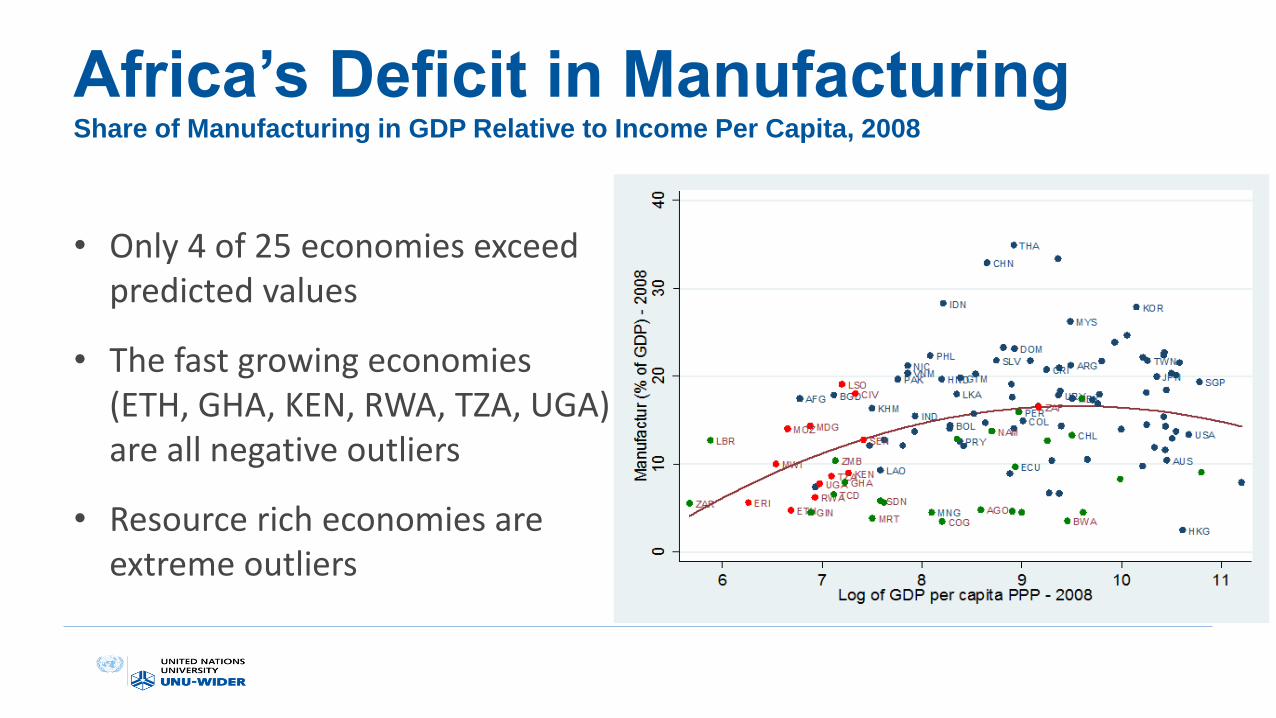
Africa’s Deficit in ManufacturingShare of Manufacturing in GDP Relative to Income Per Capita, 2008
• Only 4 of 25 economies exceed predicted values
• The fast growing economies (ETH, GHA, KEN, RWA, TZA, UGA) are all negative outliers
• Resource rich economies are extreme outliers
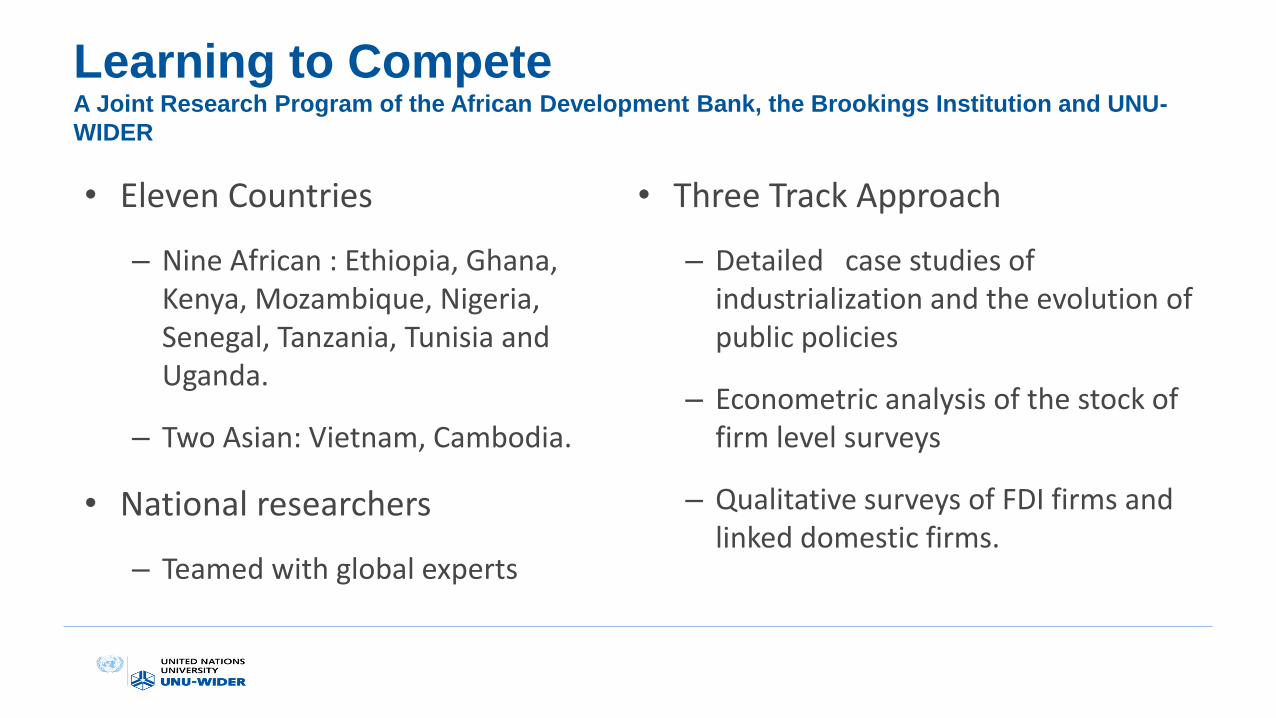
Learning to CompeteA Joint Research Program of the African Development Bank, the Brookings Institution and UNU-
WIDER
• Eleven Countries
– Nine African : Ethiopia, Ghana, Kenya, Mozambique, Nigeria, Senegal, Tanzania, Tunisia and Uganda.
– Two Asian: Vietnam, Cambodia.
• National researchers
– Teamed with global experts
• Three Track Approach
– Detailed case studies of industrialization and the evolution of public policies
– Econometric analysis of the stock of firm level surveys
– Qualitative surveys of FDI firms and linked domestic firms.
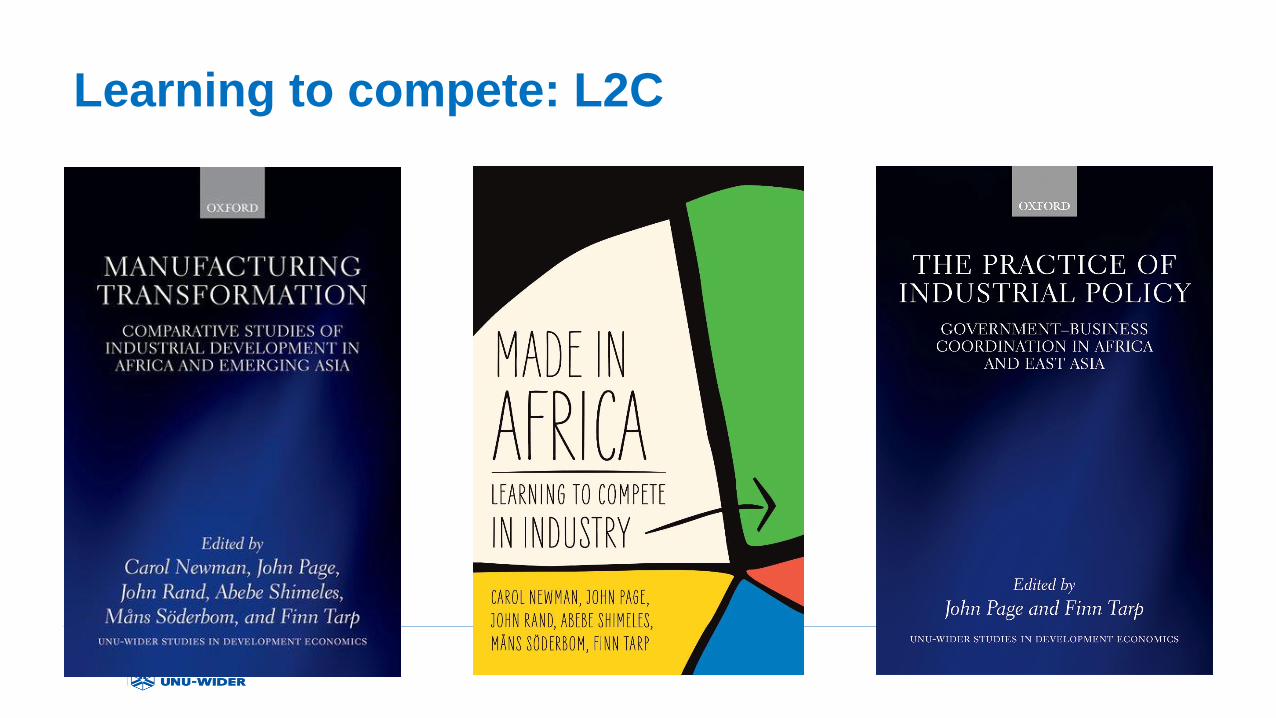
Learning to compete: L2C
Four Drivers of Productivity and Location• The “basics” (AKA the “Investment Climate”)
– Infrastructure and skills– Institutions and regulation
• Exports and competition– Firms in low income countries increase their productivity by exporting– Competition increases productivity through entry and exit
• Firm capabilities– The tacit knowledge and working practices that affect both productivity and quality– Capabilities can spill over to other firms through supply chain links
• Agglomerations– Industrial clusters confer significant productivity gains– Virtually everything we know about agglomeration economies comes from middle and
high income countries
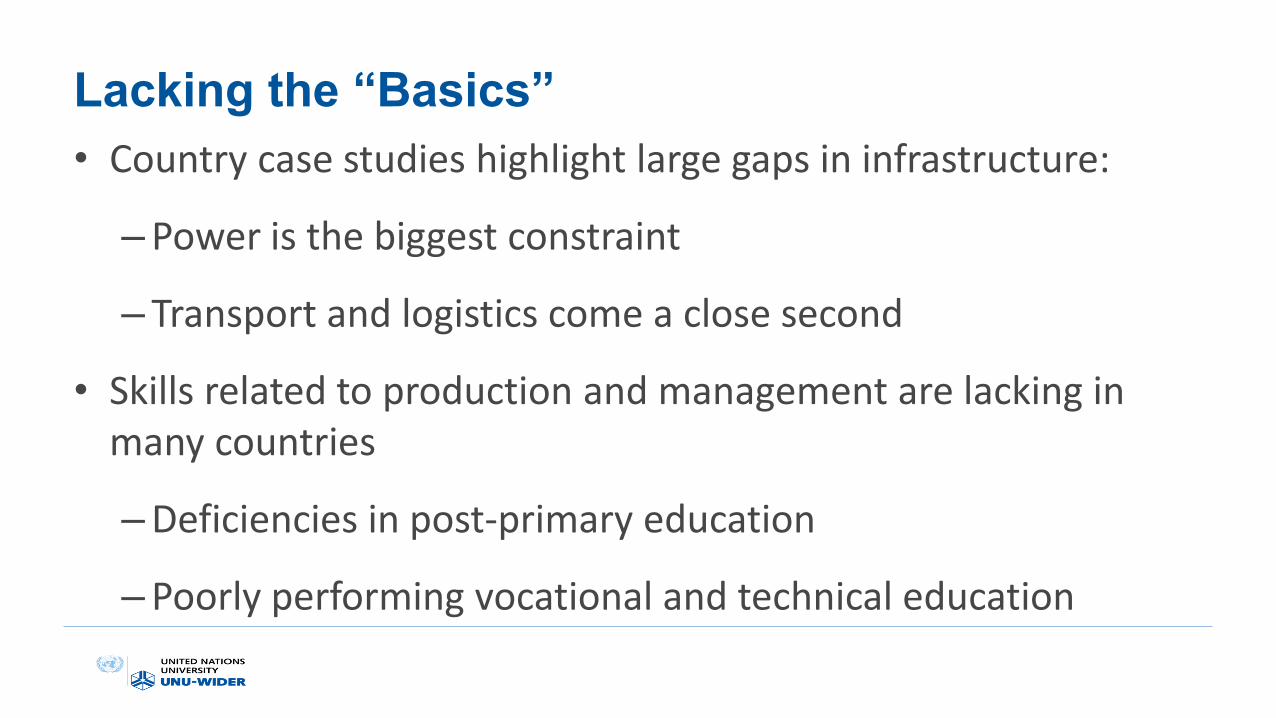
Lacking the “Basics”
• Country case studies highlight large gaps in infrastructure:
–Power is the biggest constraint
– Transport and logistics come a close second
• Skills related to production and management are lacking in many countries
–Deficiencies in post-primary education
–Poorly performing vocational and technical education
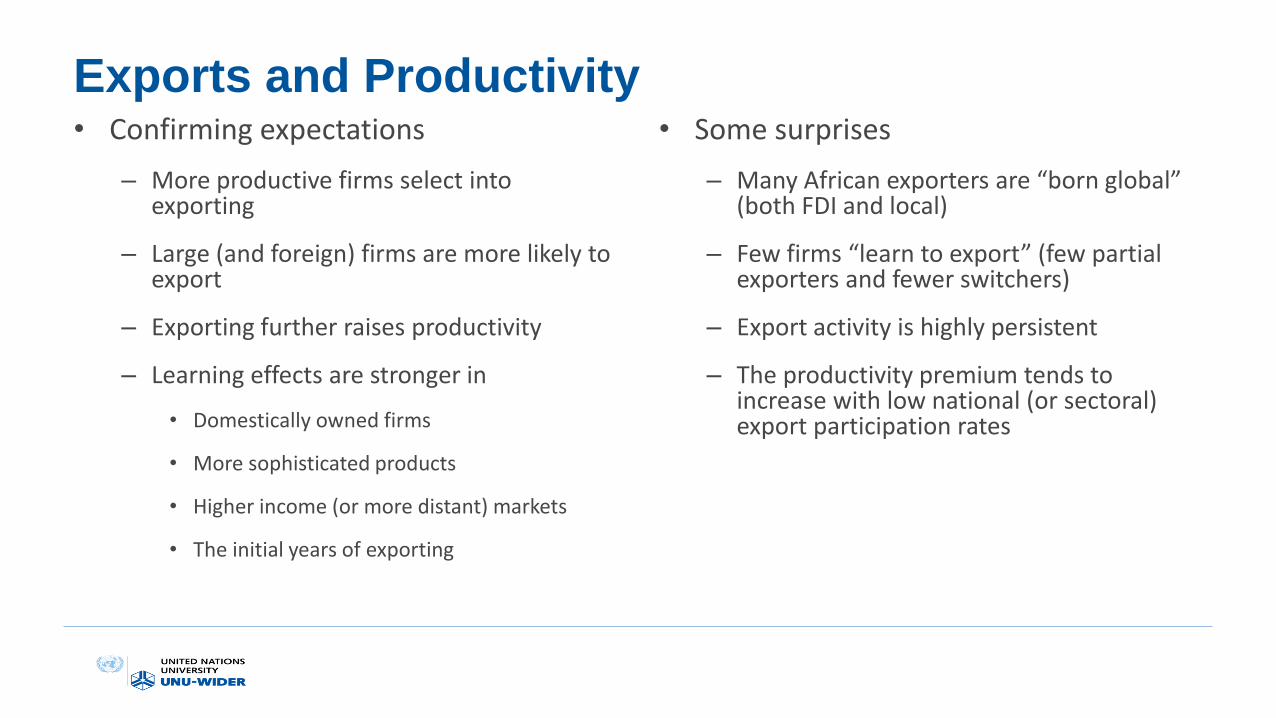
Exports and Productivity• Confirming expectations
– More productive firms select into exporting
– Large (and foreign) firms are more likely to export
– Exporting further raises productivity
– Learning effects are stronger in
• Domestically owned firms
• More sophisticated products
• Higher income (or more distant) markets
• The initial years of exporting
• Some surprises
– Many African exporters are “born global” (both FDI and local)
– Few firms “learn to export” (few partial exporters and fewer switchers)
– Export activity is highly persistent
– The productivity premium tends to increase with low national (or sectoral) export participation rates
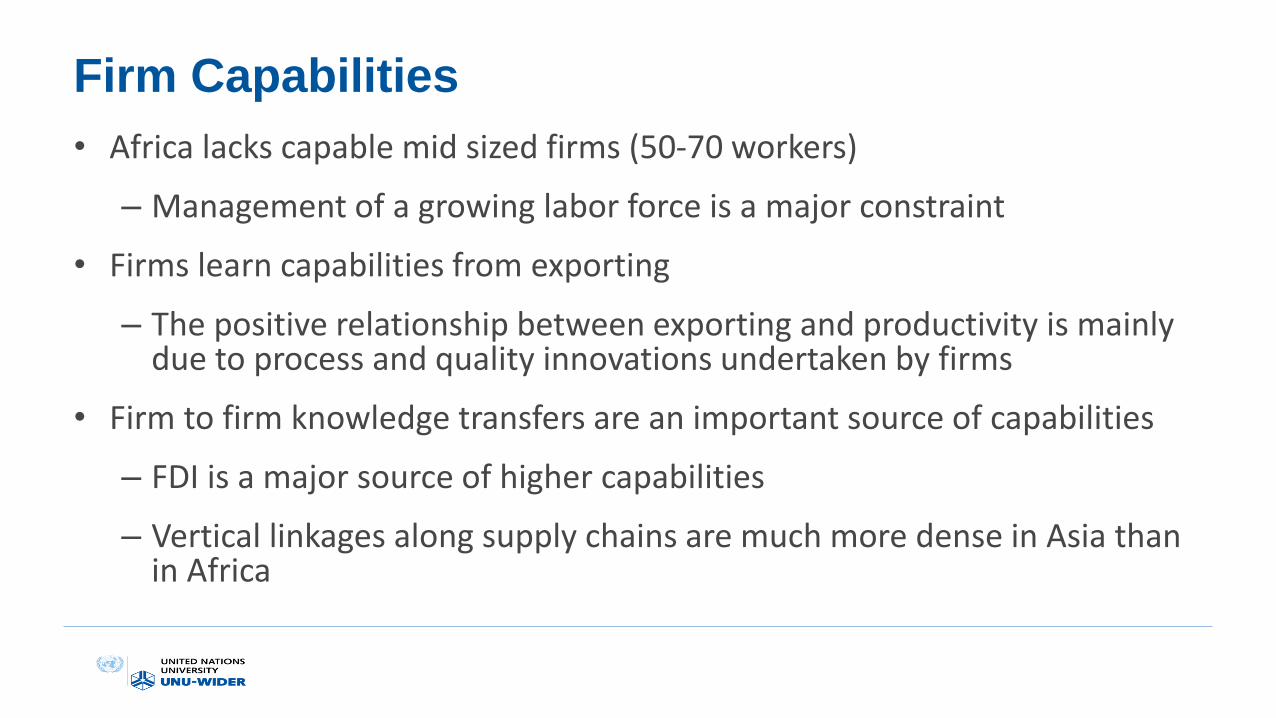
Firm Capabilities
• Africa lacks capable mid sized firms (50-70 workers)
– Management of a growing labor force is a major constraint
• Firms learn capabilities from exporting
– The positive relationship between exporting and productivity is mainly due to process and quality innovations undertaken by firms
• Firm to firm knowledge transfers are an important source of capabilities
– FDI is a major source of higher capabilities
– Vertical linkages along supply chains are much more dense in Asia than in Africa
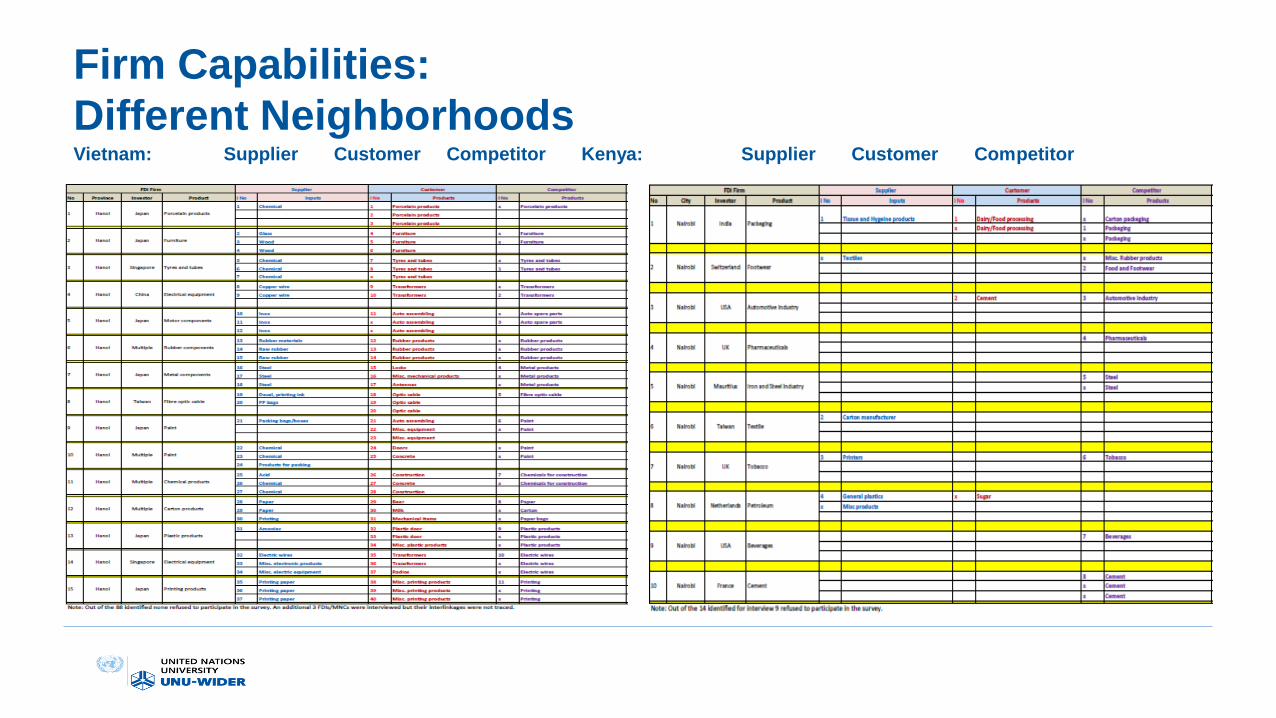
Firm Capabilities:
Different NeighborhoodsVietnam: Supplier Customer Competitor Kenya: Supplier Customer Competitor
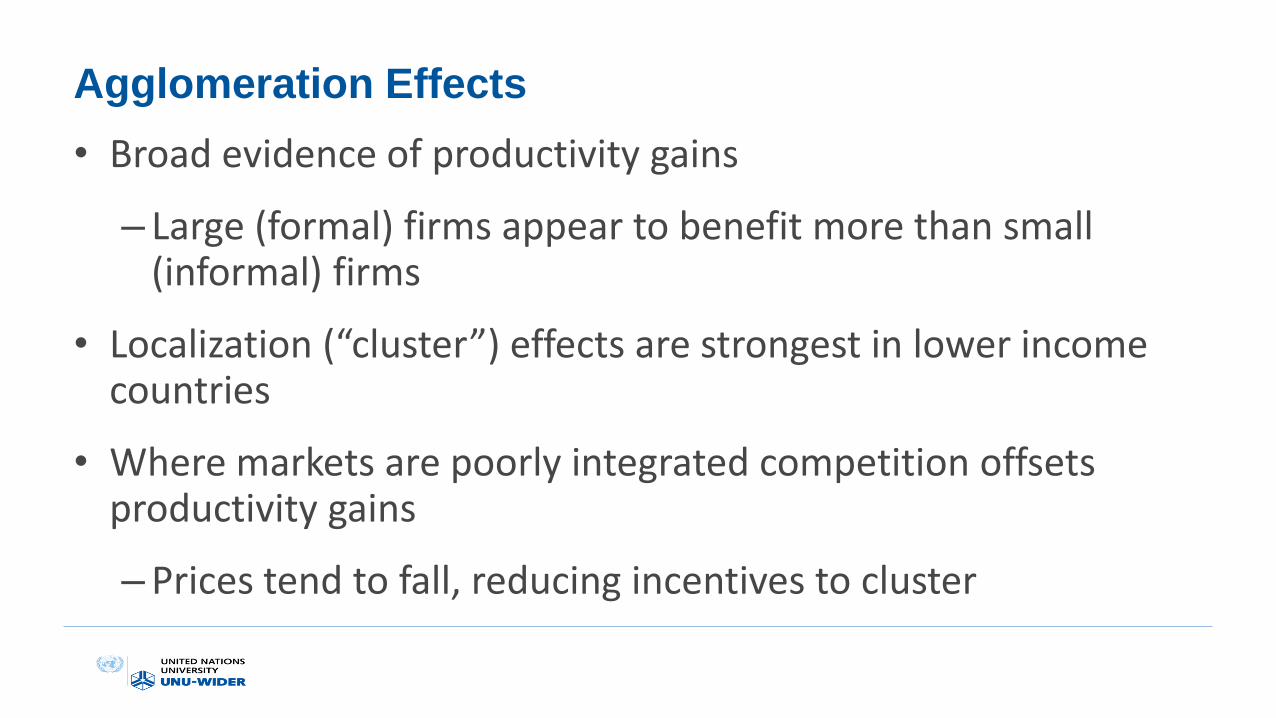
Agglomeration Effects
• Broad evidence of productivity gains
– Large (formal) firms appear to benefit more than small (informal) firms
• Localization (“cluster”) effects are strongest in lower income countries
• Where markets are poorly integrated competition offsets productivity gains
–Prices tend to fall, reducing incentives to cluster
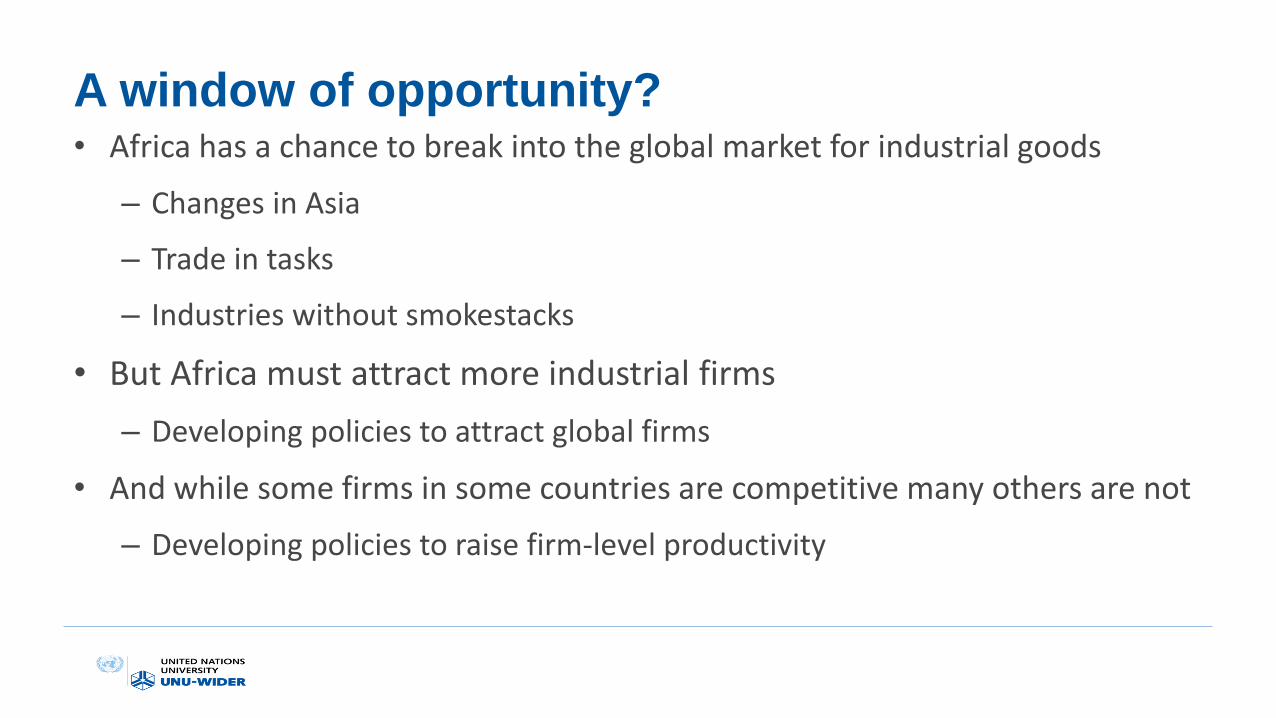
A window of opportunity?• Africa has a chance to break into the global market for industrial goods
– Changes in Asia
– Trade in tasks
– Industries without smokestacks
• But Africa must attract more industrial firms
– Developing policies to attract global firms
• And while some firms in some countries are competitive many others are not
– Developing policies to raise firm-level productivity
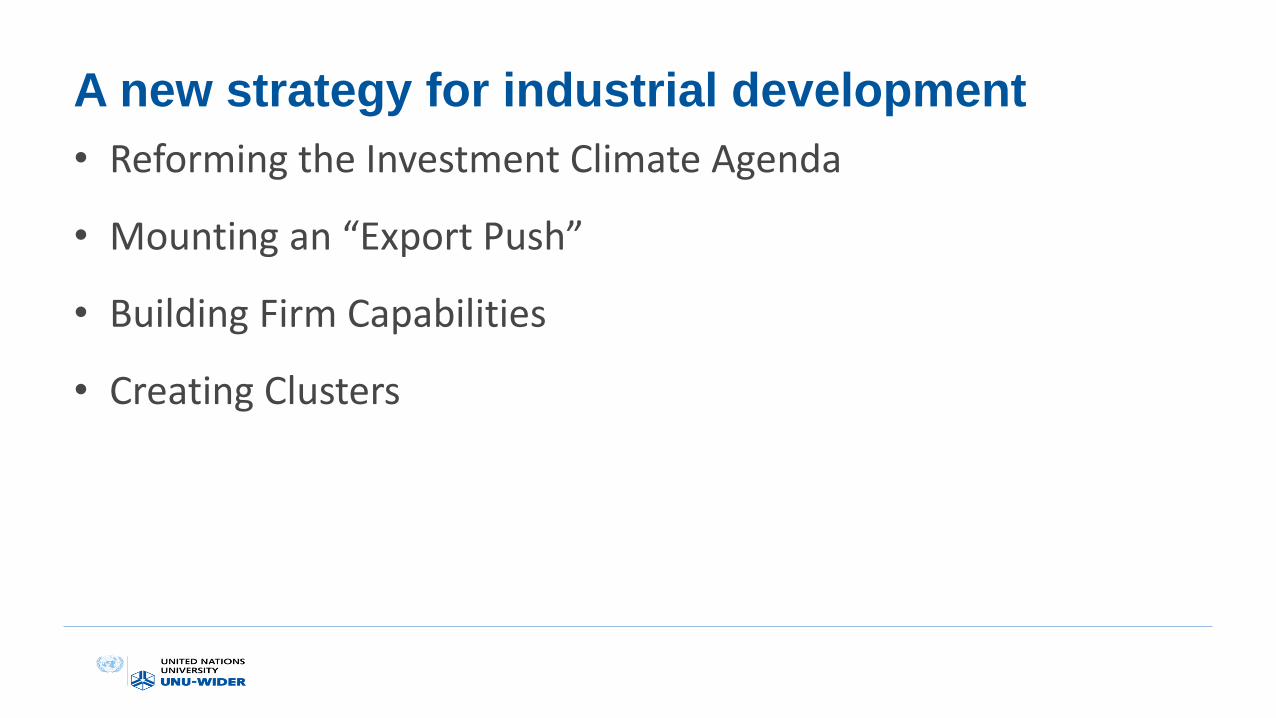
A new strategy for industrial development
• Reforming the Investment Climate Agenda
• Mounting an “Export Push”
• Building Firm Capabilities
• Creating Clusters

Conclusion
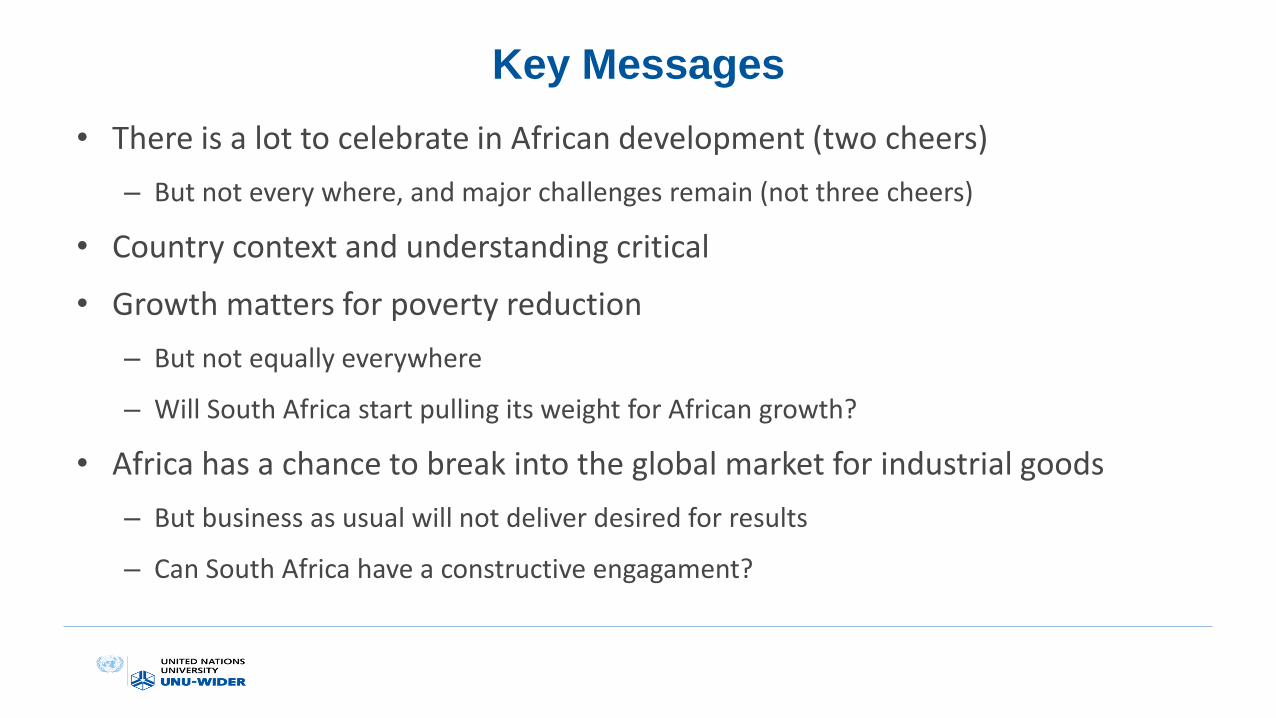
Key Messages
• There is a lot to celebrate in African development (two cheers)
– But not every where, and major challenges remain (not three cheers)
• Country context and understanding critical
• Growth matters for poverty reduction
– But not equally everywhere
– Will South Africa start pulling its weight for African growth?
• Africa has a chance to break into the global market for industrial goods
– But business as usual will not deliver desired for results
– Can South Africa have a constructive engagament?