AFRICAN COFFEE SECTOR€¦ · INVESTMENT AGENDA FOR THE KENYAN COFFEE SECTOR –EXECUTIVE SUMMARY...
35
AFRICAN COFFEE SECTOR addressing national investment agendas on a continental scale Kenya Case Study 1 SEPTEMBER 16 AFRICAN COFFEE SECTOR: ADDRESSING NATIONAL INVESTMENT AGENDAS ON A CONTINENTAL SCALE Sector study conducted by Agri-Logic and Valued Chain by assignment of the Global Coffee Platform Contact: [email protected]
Transcript of AFRICAN COFFEE SECTOR€¦ · INVESTMENT AGENDA FOR THE KENYAN COFFEE SECTOR –EXECUTIVE SUMMARY...

AFRICAN COFFEE SECTORaddressing national investment agendas on a continental scale
Kenya Case Study
1
SEPTEMBER 16AFRICAN COFFEE SECTOR: ADDRESSING NATIONAL INVESTMENT AGENDAS ON A CONTINENTAL SCALE
Sector study conducted by Agri-Logic and Valued Chain by assignment of the Global Coffee PlatformContact: [email protected]

CHALLENGE:
• Currently Africa only supplies 10% of global
coffee volumes, while coffee was first
discovered in Ethiopia.
• In most African origins, yields are low, quality
is inconsistent, and supply chains are
inefficient.
OPPORTUNITIES:
• Buyers value certain coffees from Africa for
their quality, and there is a potential to
increase volumes to meet growing demand.
• Coffee may contribute to sustainable
development in Africa’s rural areas.
2
INTRODUCING NATIONAL COFFEE INVESTMENT AGENDAS FOR AFRICA
INVESTMENT AGENDAS:
• Greater understanding of challenges and
opportunities in mainstreaming sustainable
coffee production.
• Insight into required funding, return on
investment, and possible public and private
contributions.
• Insight into impact of investment based on
quantitative research and stakeholder
consultation. Benchmarks and analysis are
based on 2015 data.
• Full reports available on the GCP website for
Angola, Burundi, Cameroon, Côte d’Ivoire,
Ethiopia, Kenya, Rwanda, Tanzania and
Uganda.
SEPTEMBER 16AFRICAN COFFEE SECTOR: ADDRESSING NATIONAL INVESTMENT AGENDAS ON A CONTINENTAL SCALE

• Executive summary
• Positioning of coffee from origin
• Production areas in origin
• Supply & demand trend and
• Market interest in sustainability
• Value chain structure
• Farm level production systems
• Supply chain efficiency
• Differential competitiveness
3
CONTENT OF THIS REPORT
• Cost of production
• Current farmer business case
• Production and price effects of investments
• Impact, cost and return per intervention
• Effect on farmer business case
• National sector business case
• Proposed public and private contributions
• Conclusion

INVESTMENT OPPORTUNITIES ANALYSIS
• The following slides describe the required investment (cost) and expected returns (revenue), as well
as the expected impact on price, volume, quality and livelihoods.
• Investments are analysed on a sector level: total increased revenue in relation to total additional cost.
On a sector level, all of these opportunities present a positive return on investment.
• Cost and benefits may not be attributed to the same actor in the value chain (e.g. government and
buyers pay for farmer training, while the farmer gains most of the additional revenue from yield
increase).
• Also, specific interventions may not lead to additional value creation, but to a redistribution of value
within the chain (e.g. farmer grouping can lead to higher farm gate price, while export price and GDP
contribution is not affected).
• Investment contributions are indicative based on stakeholder input. Investments and conditions to be
negotiated within national public private platforms taking into account amongst others international
competitiveness, governance, transparency and accountability assurance.
4
SEPTEMBER 16AFRICAN COFFEE SECTOR: ADDRESSING NATIONAL INVESTMENT AGENDAS ON A CONTINENTAL SCALE
INVESTMENT AGENDA FOR THE KENYAN COFFEE SECTOR – EXECUTIVE SUMMARY• Coffee volumes in Kenya are declining, and are currently around 45,000 MT per annum, or 0.5% of
global production.
• The sector is dominated by smallholder on less than 0.5ha. These smallholders are required by
law to join cooperatives. Larger estates exist and even though the number of farms is low, these
estates represent about 40-45% of coffee volume. The volume share of smallholders is increasing,
as estates are sold to real estate projects.
• Cost of production are relatively high, and increasing in line with cost in Brazil. This is a competitive
disadvantage for Kenya compared to other African origins. Productivity is average to low, especially
on small farms. Despite high private sector interest from European and American coffee buyers,
farmers are abandoning coffee in favour of other crops.
• The sector is regulated by the Kenyan government, and 85% of coffee is sold through the Nairobi
Coffee Exchange. Levies of 4% are in line with international benchmark, but licensing cost are reported
to be high.
5
SEPTEMBER 16AFRICAN COFFEE SECTOR: ADDRESSING NATIONAL INVESTMENT AGENDAS ON A CONTINENTAL SCALE
• There is significant potential to increase coffee sector value in Kenya through selective investment
in farmer training, farm rejuvenation, use of inputs and farmer organisation building.
• Volumes could increase to ~75.000 Mt per annum. The increased value largely flows into rural
economy.
• Coffee alone will not provide sufficient income for a full farmer household, under current conditions it
appears unlikely that the gap to the poverty line can be met with agricultural activities. It is unlikely
that farmers will be lifted out of poverty in the short- to mid-term, despite investments.
• Total programme investment amounts to an estimated 198 million USD over 10 years that would
generate a return across the sector of >1 billion USD at current prices.
6
SEPTEMBER 16AFRICAN COFFEE SECTOR: ADDRESSING NATIONAL INVESTMENT AGENDAS ON A CONTINENTAL SCALE
INVESTMENT AGENDA FOR THE KENYANCOFFEE SECTOR – EXECUTIVE SUMMARY

KENYAResilience for improved yields and quality, supply chain efficiency for livelihoods
7
SEPTEMBER 16AFRICAN COFFEE SECTOR: addressing national investment agendas on a continental scale

POSITIONING OF KENYA
Item Value
Total volume (3 year average) 45,800 Mt
% of global production 0.52%
% Arabica – Robusta 100% Arabica
% natural – semi-washed – fully washed 11% natural – 89% washed
Compound Annual Growth Rate of coffee production (2000-2015)
- 4.7%
Main export markets USA, EU
Market segments Rich flavour arabica
GDP 63.4 billion USD
GDP – agriculture 19 billion USD
GDP – coffee 0.22 billion USD
8
SEPTEMBER 16AFRICAN COFFEE SECTOR: ADDRESSING NATIONAL INVESTMENT AGENDAS ON A CONTINENTAL SCALE
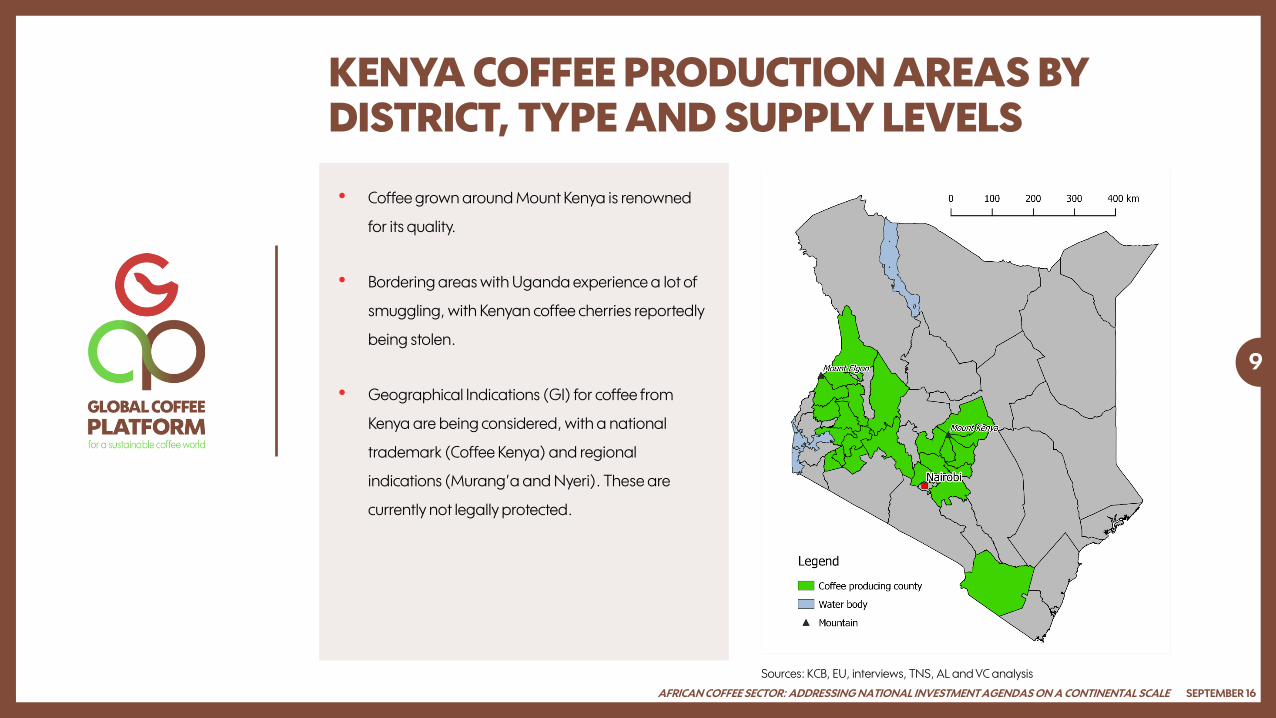
• Coffee grown around Mount Kenya is renowned
for its quality.
• Bordering areas with Uganda experience a lot of
smuggling, with Kenyan coffee cherries reportedly
being stolen.
• Geographical Indications (GI) for coffee from
Kenya are being considered, with a national
trademark (Coffee Kenya) and regional
indications (Murang’a and Nyeri). These are
currently not legally protected.
9
KENYA COFFEE PRODUCTION AREAS BY DISTRICT, TYPE AND SUPPLY LEVELS
SEPTEMBER 16AFRICAN COFFEE SECTOR: ADDRESSING NATIONAL INVESTMENT AGENDAS ON A CONTINENTAL SCALE
Sources: KCB, EU, interviews, TNS, AL and VC analysis
10
VOLATILE PRODUCTION VOLUMES, LITTLE DOMESTIC CONSUMPTION
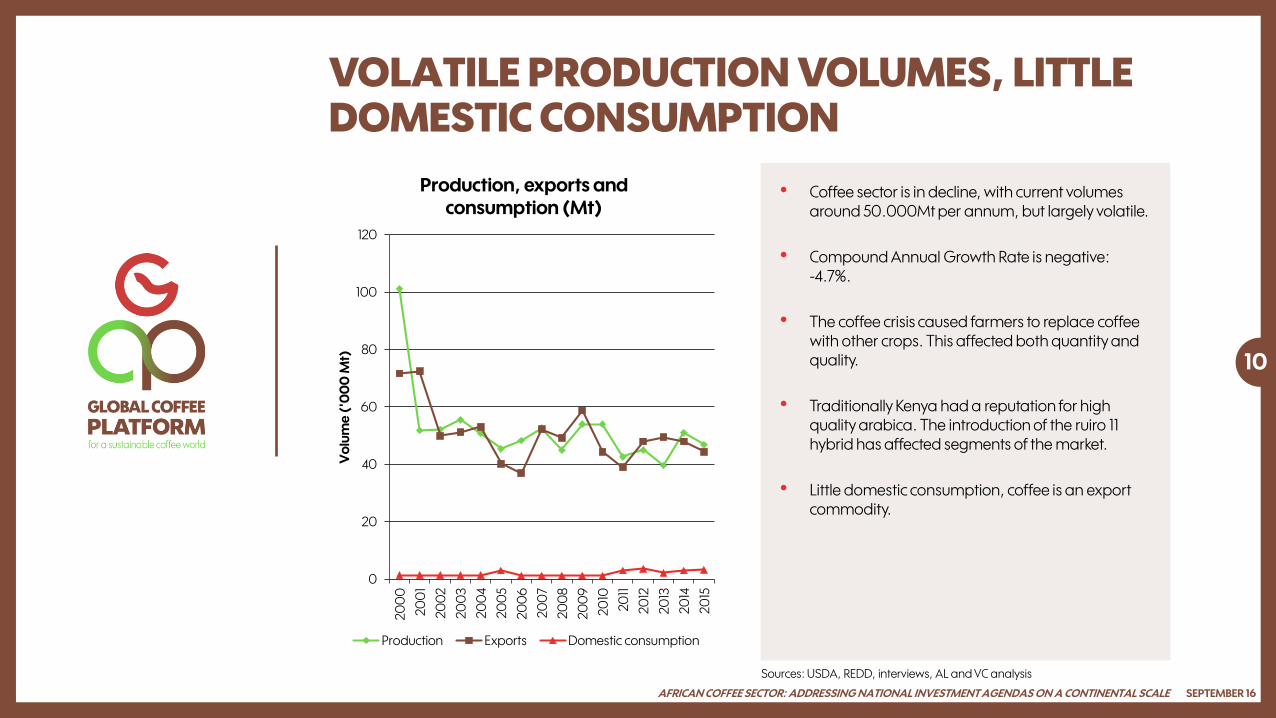
• Coffee sector is in decline, with current volumes around 50.000Mt per annum, but largely volatile.
• Compound Annual Growth Rate is negative: -4.7%.
• The coffee crisis caused farmers to replace coffee with other crops. This affected both quantity and quality.
• Traditionally Kenya had a reputation for high quality arabica. The introduction of the ruiro 11 hybrid has affected segments of the market.
• Little domestic consumption, coffee is an export commodity.
SEPTEMBER 16AFRICAN COFFEE SECTOR: ADDRESSING NATIONAL INVESTMENT AGENDAS ON A CONTINENTAL SCALE
Sources: USDA, REDD, interviews, AL and VC analysis
0
20
40
60
80
100
120
20
00
20
01
20
02
20
03
20
04
20
05
20
06
20
07
20
08
20
09
20
10
20
11
20
12
20
13
20
14
20
15
Vo
lum
e (
'00
0 M
t)
Production, exports and consumption (Mt)
Production Exports Domestic consumption

11
AFRICA LAGGING IN SHARE OF CERTIFIED SUSTAINABLE SUPPLY
SEPTEMBER 16AFRICAN COFFEE SECTOR: ADDRESSING NATIONAL INVESTMENT AGENDAS ON A CONTINENTAL SCALE
0
20,000
40,000
60,000
80,000
100,000
120,000
140,000
160,000
180,000
20
00
20
01
20
02
20
03
20
04
20
05
20
06
20
07
20
08
20
09
20
10
20
11
20
12
20
13
20
14
Vo
lum
e (
'00
0 b
ag
s o
f 6
0k
g)
Year
Global supply (‘000 bags)
Volume certified Volume conventional
Total volume
Sources: USDA, CTA, AL and VC analysis
0% 20% 40% 60% 80%
Africa
Latin america
Asia
Share of total supply and certified supply
Share of certified and verified supply Share of global supply
12
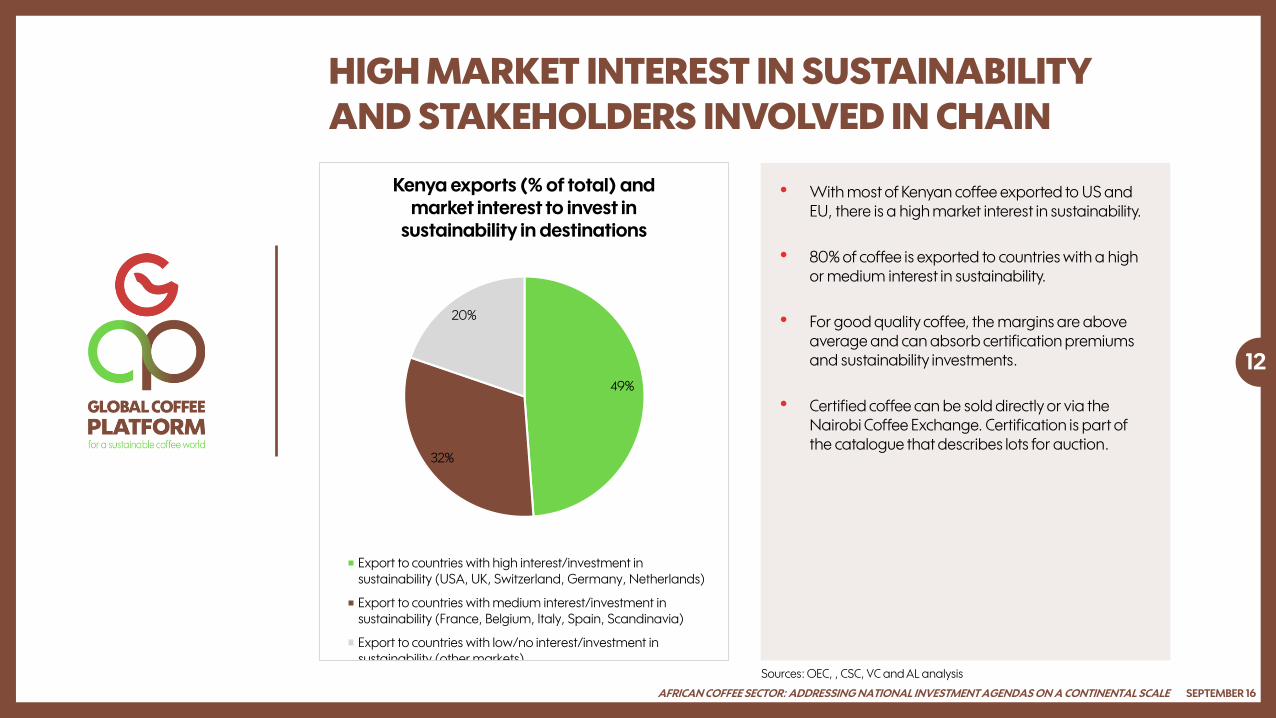
HIGH MARKET INTEREST IN SUSTAINABILITY
AND STAKEHOLDERS INVOLVED IN CHAIN
• With most of Kenyan coffee exported to US and EU, there is a high market interest in sustainability.
• 80% of coffee is exported to countries with a high or medium interest in sustainability.
• For good quality coffee, the margins are above average and can absorb certification premiums and sustainability investments.
• Certified coffee can be sold directly or via the Nairobi Coffee Exchange. Certification is part of the catalogue that describes lots for auction.
SEPTEMBER 16AFRICAN COFFEE SECTOR: ADDRESSING NATIONAL INVESTMENT AGENDAS ON A CONTINENTAL SCALE
Sources: OEC, , CSC, VC and AL analysis
49%
32%
20%
Kenya exports (% of total) and market interest to invest in
sustainability in destinations
Export to countries with high interest/investment insustainability (USA, UK, Switzerland, Germany, Netherlands)
Export to countries with medium interest/investment insustainability (France, Belgium, Italy, Spain, Scandinavia)
Export to countries with low/no interest/investment insustainability (other markets)
,0 ,20 ,40 ,60 ,80 1,0
0
50
100
150
200
250
Usc
ts/l
b
Share of supply in value chain segment
Value chain structure Kenya Arabica 2015
Farm gate price Auction price Market price
13
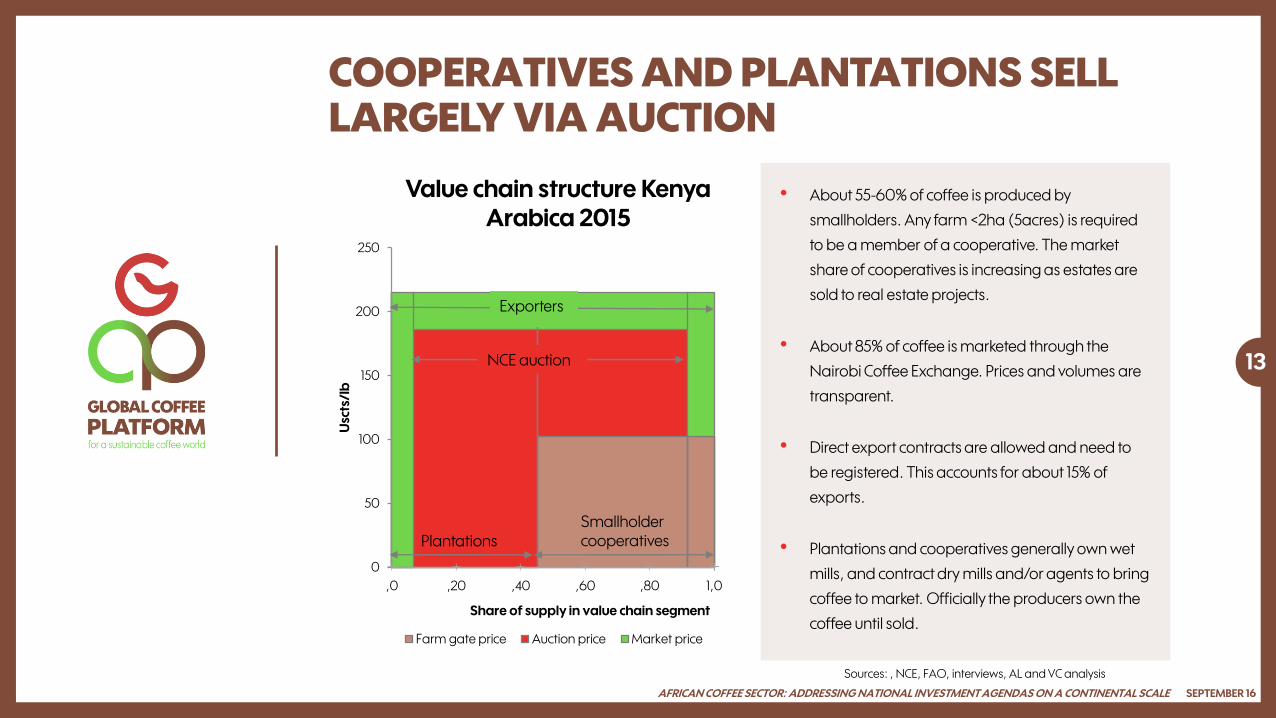
COOPERATIVES AND PLANTATIONS SELL LARGELY VIA AUCTION
• About 55-60% of coffee is produced by
smallholders. Any farm <2ha (5acres) is required
to be a member of a cooperative. The market
share of cooperatives is increasing as estates are
sold to real estate projects.
• About 85% of coffee is marketed through the
Nairobi Coffee Exchange. Prices and volumes are
transparent.
• Direct export contracts are allowed and need to
be registered. This accounts for about 15% of
exports.
• Plantations and cooperatives generally own wet
mills, and contract dry mills and/or agents to bring
coffee to market. Officially the producers own the
coffee until sold.
SEPTEMBER 16AFRICAN COFFEE SECTOR: ADDRESSING NATIONAL INVESTMENT AGENDAS ON A CONTINENTAL SCALE
Sources: , NCE, FAO, interviews, AL and VC analysis
PlantationsSmallholder cooperatives
NCE auction
Exporters

14
SECTOR CONSISTS PREDOMINANTLY OF SMALL-
SIZED FARMS OF LESS THAN 0.5 HA
• Smallholders with <5 acres (<2ha) are required by law to join a cooperative. KNBS indicates 800.000 smallholders organized in 600 cooperatives.
• Farms >5 acres (>2ha) are called estates and are allowed to market their coffee independently. It is estimated that about 3300 medium estates exist, and about 100 large estates.
• Land shortages are prevalent, farm sizes per household have come down significantly as plots are split between siblings when inherited.
SEPTEMBER 16AFRICAN COFFEE SECTOR: ADDRESSING NATIONAL INVESTMENT AGENDAS ON A CONTINENTAL SCALE
Sources: KNBS, interviews, AL and VC analysis
0% 20% 40% 60% 80% 100%
Number of farmers
Acreage (ha)
Nr of farmers and acreage distribution
Small <0.5ha Medium acreage >0.5<3ha Plantations >10ha

15
CURRENT PRODUCTIVITY LEVELS ARE LOW- TO
MID-LEVEL AND COULD GROW
• Productivity of Arabica is on average 350-
400kg green coffee per ha. This is far
below market leader Brazil and other
major origins.
• There is a large difference between estates
and smallholders. Yields at estates are
>600kg/ha whereas smallholders
organized in cooperatives produce on
average 300kg/ha.
• Productivity in Kenya could increase further,
up to 1 Mt/ha appears to be feasible at
least for estates. A major challenge
however is the lack of research capacity
and lack of success in developing new
resistant varieties.
SEPTEMBER 16AFRICAN COFFEE SECTOR: ADDRESSING NATIONAL INVESTMENT AGENDAS ON A CONTINENTAL SCALE
Sources: USDA, FAO, interviews, AL and VC analysis
0.00 0.50 1.00 1.50 2.00
Kenya
Brazil
Colombia
India
Average productivity (Mt/ha)
Arabica productivity (Mt/ha)

16
SUPPLY CHAIN EFFICIENCY BELOW OTHER MAJOR ORIGINS
• Data on farm gate prices is inconsistent, with large variability between sources. Cooperatives and estates receive ~80% of FOB price for processed coffee, but the share that is passed on to the smallholder farmer varies largely between 20-70% of FOB.
• Farm gate price as share of FOB does seem to have increased, but farmers remain dependent on external facilities or cooperatives to process their cherry.
• A 4% levy is applied to all exports. This income is to be used for the marketing bodies, research and infrastructure.
• Several licensing fees apply in order to obtain required permits, which is not visible in displayed value distribution but according to research adds another 2-5% to the cost of supply chain actors. In his April 2016 State of the Nation address, the president announced that licensing fees and levies would be waived.
SEPTEMBER 16AFRICAN COFFEE SECTOR: ADDRESSING NATIONAL INVESTMENT AGENDAS ON A CONTINENTAL SCALE
Sources: KNBS, NCE, FAO, interviews, AL and VC analysis
0%
10%
20%
30%
40%
50%
60%
70%
80%
90%
100%
Kenya Brazil Colombia India
Value distribution Arabica (% of FOB price)
Farm gate Supply chain costs Export tax/Cess

17
GOOD DIFFERENTIAL IN LINE WITH INDIA AND
OTHER AFRICAN ORIGINS
• Average differentials for Kenya arabica are +4
USDct/lb.
• Specific grades attract higher differentials.
Consistency in quality could possibly improve
differentials slightly.
• Kenya coffee is valued for quality over Brazil, and
still competitive in price compared to other
Arabica origins.
SEPTEMBER 16AFRICAN COFFEE SECTOR: ADDRESSING NATIONAL INVESTMENT AGENDAS ON A CONTINENTAL SCALE
Sources: interviews, AL and VC analysis
Kenya
Colombia
India
Brazil
0.0 0.1 0.2 0.3 0.4 0.5 0.6 0.7
-20
-15
-10
-5
0
5
10
15
20
Dif
fere
nti
al (
US
Dct
/lb
)
Share of global supply
Arabica differentials (USDct/lb over ICE) and share of supply (%)

18
PRODUCTION COST ARE HIGH AND INCREASING, SPECIFICALLY ON FARM
SEPTEMBER 16AFRICAN COFFEE SECTOR: ADDRESSING NATIONAL INVESTMENT AGENDAS ON A CONTINENTAL SCALE
• Increasing cost, especially labour and fertiliser, put cost of production in line with Brazil, and set cost above other East
African Arabica origins.
• Cost increase is attributed to high labour cost and climatic challenges affecting both inputs use and yields.
Sources: Rozimina, GroIntel, interviews, AL and VC analysis
0
20
40
60
80
100
120
140
160
2008 2009 2010 2011 2012 2013 2014 2015
Va
lue
(U
SD
ct/l
b)
Arabica cost of production (USDct/lb, ex household labour)
Kenya Brazil
0
50
100
150
2008 2015 2008 2015
Kenya Brazil
Va
lue
(U
SD
ct/l
b)
Arabica cost breakdown (USDct/lb)
Arabica trade export cost
Arabica export processing cost
Arabica farm processing cost
Arabica labor cost
Arabica planting cost
Arabica fertiliser cost

19
COFFEE FARMING IS NOT PROFITABLE FOR SMALLHOLDER FARMERS
• Coffee farmers in most cases just reach break-even on their coffee crop.
• Supply chain actors (cooperatives and agents) absorb most of the profit.
• With an average family-size of 4.4 people per household, net coffee income is far below the poverty line of 1.9 USD/capita/day (adjusted for purchasing power parity).
• Currently coffee is abandoned in favour of other activities.
• Farmer business case can be improved by passing on higher share of price to farmers, as well as increasing yields.
SEPTEMBER 16AFRICAN COFFEE SECTOR: ADDRESSING NATIONAL INVESTMENT AGENDAS ON A CONTINENTAL SCALE
Sources: Interviews, AL and VC analysis
87
0
132
44
200
244
0
200
400
600
800
1,000
1,200
1,400
0
50
100
150
200
250
300
Po
ve
rty
lin
e (
US
D/h
ou
seh
old
)
US
D/y
ea
r
Average farmer business case for Arabica in comparison to poverty
line
Cost Value Poverty line (USD1.9/day)

• Modelling 4 opportunities:
• Farmer training
• Rejuvenation/replanting
• Increasing input application
• Farmer organisation building
• A combination of first 3 interventions could increase total production to ~75.000 Mt.
• These productivity interventions are interrelated and can not be implemented separately.
20
MODELLING INVESTMENT OPPORTUNITIES – PRODUCTION EFFECTS
SEPTEMBER 16AFRICAN COFFEE SECTOR: ADDRESSING NATIONAL INVESTMENT AGENDAS ON A CONTINENTAL SCALE
0
10,000
20,000
30,000
40,000
50,000
60,000
70,000
80,000
90,000
Vo
lum
e (
Mt)
Production effect of investment opportunities
Increase inputs application - net production impact
Rejuvenation/replanting - net production impact
Farmer training - net production impact
Base level

• Assuming weighed average base price stable over time.
• Farmer organisations, if well managed, can add significant value to the farm gate price as a result of improved efficiency.
• Export price would not be affected by these interventions.
• Detailed models for the first 4 opportunities which show a positive business case are shown on the following pages
21
MODELLING INVESTMENT OPPORTUNITIES – PRICE EFFECTS
SEPTEMBER 16AFRICAN COFFEE SECTOR: ADDRESSING NATIONAL INVESTMENT AGENDAS ON A CONTINENTAL SCALE
2,240
2,250
2,260
2,270
2,280
2,290
2017 2018 2019 2020 2021 2022 2023 2024 2025 2026
Va
lue
(U
SD
/Mt)
Farm gate price effect of investment opportunities
Farmer organisation building - farm gate price impact
Base level
0
1,000
2,000
3,000
4,000
5,000
2017 2018 2019 2020 2021 2022 2023 2024 2025 2026
Va
lue
(U
SD
/Mt)
Export price effect of investment opportunities
Base level

22
FARMER TRAINING INVESTMENT CAN GROW CURRENT SUPPLY BY 15%
SEPTEMBER 16AFRICAN COFFEE SECTOR: ADDRESSING NATIONAL INVESTMENT AGENDAS ON A CONTINENTAL SCALE
0
100,000
200,000
300,000
400,000
500,000
600,000
Nu
mb
er
of
farm
ers
Number of farmers enrolled in training program
Annual nr farmers in training programme
Cumulative nr farmers trained -
1,000
2,000
3,000
4,000
5,000
6,000
7,000
8,000
2017 2018 2019 2020 2021 2022 2023 2024 2025 2026
Ad
dit
ion
al s
up
ply
(M
t)
Additional supply from farmer training programme (Mt)

• For training on Good Agricultural Practices to be
effective it needs to be participatory, intensive and
should run for at least 4 years.
• Farmer training can build on existing cooperatives
structure, although training capacity is not currently
present in cooperatives so capacity building would be
part of this investment.
• Against this background we budget 75
USD/farmer/year in training costs, assuming 60% of the
farmers to be motivated, the investment would total 145
million USD over 10 years.
23
FARMER TRAINING OFFERS GOOD RETURNS ON INVESTMENT
Indicator Value (10 years)
Cumulative nr of farmers reached 482,040
Additional volume coffee per annum in steady state (Mt)
7,408
Total investment $ 144,612,000
Total return $ 293,814,698
NPV (10%) $ 74,896,890
NPV (20%) $ 42,127,717
Investment per farmer $ 300
SEPTEMBER 16AFRICAN COFFEE SECTOR: ADDRESSING NATIONAL INVESTMENT AGENDAS ON A CONTINENTAL SCALE

24
REJUVENATION INVESTMENT TAKES A WHILE TO SHOW EFFECTS...
SEPTEMBER 16AFRICAN COFFEE SECTOR: ADDRESSING NATIONAL INVESTMENT AGENDAS ON A CONTINENTAL SCALE
-
1,000
2,000
3,000
4,000
5,000
6,000
2017 2018 2019 2020 2021 2022 2023 2024 2025 2026
Ad
dit
ion
al s
up
ply
(M
t)
Additional supply from rejuvenation (Mt)
0
2,000
4,000
6,000
8,000
10,000
12,000
14,000
16,000
2017 2018 2019 2020 2021 2022 2023 2024 2025 2026
Vla
ue
(h
a)
Acreage rejuvenated (ha)

• Replanting is necessary, especially with estates moving away from coffee. However with current low farmer incomes, the investment is not likely coming from the farmers and adoption rate is estimated at 20%.
• Some existing projects have realized good results with community or cooperative nurseries, and grafting support. These are relatively cost efficient methods of rejuvenation.
• Return on investment is excellent for those producers that can afford or get access to finance, but due to low expected adoption rates the overall volume effect is ~10%.
• Replanting can also increase resilience with resistant varieties.
25
RETURN ON INVESTMENT IS POSITIVE FOR THOSE THAT CAN AFFORD
SEPTEMBER 16AFRICAN COFFEE SECTOR: ADDRESSING NATIONAL INVESTMENT AGENDAS ON A CONTINENTAL SCALE
Indicator Value (10 years)
Cumulative acreage replanted (ha)
13,620
Additional volume coffee per annum in steady state (Mt)
5,407
Total investment $ 2.451,600
Total return $ 142,081,653
NPV (10%) $ 67,943,544
NPV (20%) $ 36,018,641
Investment per ha $ 180

26
INPUT SUPPLY INVESTMENT HAS LARGE IMPACT
SEPTEMBER 16AFRICAN COFFEE SECTOR: ADDRESSING NATIONAL INVESTMENT AGENDAS ON A CONTINENTAL SCALE
-
5,000
10,000
15,000
20,000
25,000
30,000
35,000
40,000
vla
ue
(h
a)
Acreage with enhanced input use (ha)
-
2,000
4,000
6,000
8,000
10,000
12,000
14,000
16,000
18,000
20,000
Ad
dit
ion
al s
up
ply
(M
t)
Additional supply from input use (Mt)

• Small-scale farmers tend to be risk averse as one failed crop is enough to undermine their living conditions.
• Fertiliser investment can be risky, but farmers would have to finance 20%-30% from equity.
• Limited extra use of inputs can be promoted to match risk appetite of farmers and generate additional production.
• Only farmers that are part of the training programme should make use of the additional input supply investment to ensure optimal use.
• Several projects in Kenya have successfully demonstrated use of organic fertilizer from on farm livestock.
27
INPUT USE STILL LOW, BUT COULD GROW AS FARMERS’ EQUITY INCREASES
SEPTEMBER 16AFRICAN COFFEE SECTOR: ADDRESSING NATIONAL INVESTMENT AGENDAS ON A CONTINENTAL SCALE
Indicator Value (10 years)
Acreage using additional inputs in steady state (ha)
34,050
Additional volume coffee per annum in steady state (Mt)
17,228
Total investment $ 20,217,188
Total return $ 632,833,365
NPV (10%) $ 336,917,079
NPV (20%) $ 204,195,305
Investment per ha per year $ 75

28
STRENGTHENING COOPERATIVES IMPROVES
SUPPLY CHAIN EFFICIENCY
SEPTEMBER 16AFRICAN COFFEE SECTOR: ADDRESSING NATIONAL INVESTMENT AGENDAS ON A CONTINENTAL SCALE
• Smallholders with <5 acres (<2ha) are required by law to join a cooperative. KNBS indicates 800.000 smallholders organized in 600 cooperatives. We estimate that about 50% of these cooperatives has the need and potential to improve.
• Main objective of the farmer organisation building program is to improve supply chain efficiency: better utilization of processing assets and increase of farmer share of coffee price.
0
100,000
200,000
300,000
400,000
500,000
0
200,000
400,000
600,000
800,000
1,000,000
Baseline 2017 2018 2019 2020 2021 2022 2023 2024 2025 2026
Nu
mb
er
of
farm
ers
in p
rog
ram
Nu
mb
er
of
farm
ers
org
an
ize
d
Number of farmers in farmer organisations
Cumulative nr of farmers in organisation building programme
Membership of farmer organisations with limited improvement potential
Baseline membership base
Annual nr of farmers in organisation building programme

29
COOPERATIVES WILL INCREASE VOLUMES
FOLLOWING INCREASED FARM YIELDS
• Expert judgements from the sector set the
investment in improving farmer organisations at
around 20USD/farmer/year.
• Since smallholder are currently only allowed to sell
through cooperatives, the supply rate is not
expected to change.
• Productivity improvements from other
interventions help to grow supply through
cooperatives.
SEPTEMBER 16AFRICAN COFFEE SECTOR: ADDRESSING NATIONAL INVESTMENT AGENDAS ON A CONTINENTAL SCALE
0%
10%
20%
30%
40%
50%
60%
0
5,000
10,000
15,000
20,000
25,000
30,000
35,000
40,000
45,000
50,000
1 2 3 4 5 6 7 8 9 10
Fa
rme
rs'
sup
ply
ra
te (
%)
Vo
lum
e (
Mt)
Volume marketed through farmer organisations (Mt) and farmers'
supply rate (%)
Annual volume marketed through farmer organisations
Baseline volume farmer organisations
Share of farmers' supply exported through farmerorganisations

30
COMMERCIALLY, INVESTMENT IN FARMER
ORGANISATIONS IS NOT VIABLE
SEPTEMBER 16AFRICAN COFFEE SECTOR: ADDRESSING NATIONAL INVESTMENT AGENDAS ON A CONTINENTAL SCALE
Indicator Value (10 years)
Number of farmers in improved farmer organizations in steady state
800,000
Volume of coffee marketed through farmer organizations in steady state (Mt)
46,872
Additional farm gate value per annum in steady state
$ 507,163
Total investment $ 31,131,750
Total value redistribution $ 3,745,785
NPV (10%) $ -20,168,346
NPV (20%) $ -15,266,565
• Improved supply chain efficiency through
cooperatives can significantly increase farm gate
price.
• This investment does not create additional value
at sector level, but rather redistributes existing
value in the chain with improved farm gate prices
as a result.
• Donors that do not seek a commercial return on
their investment would be required for this type of
intervention.

• The 4 combined interventions show a positive impact on the farmer business case, improving revenues by 64% from both price and yield improvement, and increasing profit by factor 2.6.
• Total producer income would then increase to 318 USD/household per year.
• This however is still not sufficient for a full farming family in relation to the poverty line (value of home consumption of other crops not factored in).
• To lift farmers out of poverty, further income is needed but seems currently unlikely.
• The business case for medium to large estates is significantly better than the business case for smallholder farmers.
31
SIGNIFICANT POSITIVE IMPACT ON FARMERS, BUT POVERTY PERSISTS
SEPTEMBER 16AFRICAN COFFEE SECTOR: ADDRESSING NATIONAL INVESTMENT AGENDAS ON A CONTINENTAL SCALE
0
200
400
600
800
1,000
1,200
1,400
0
50
100
150
200
250
300
350
400
Va
lue
(U
SD
/ye
ar)
Improved farmer business case for Arabica in comparison to poverty
line
Programme effect
Income
Cost
Poverty line (USD1.9/day/person, PPP adjusted)

• Investment in coffee can significantly increase the
sector value for all actors in the value chain. The
majority of value flows into the rural economy.
• As productivity improves, local supply chains
benefit, primarily from additional supply.
• Additionally, an improved supply chain efficiency
should bring additional value to farmers.
32
NATIONAL BUSINESS CASE: SIGNIFICANT INCREASE IN SECTOR VALUE FOR ALL
SEPTEMBER 16AFRICAN COFFEE SECTOR: ADDRESSING NATIONAL INVESTMENT AGENDAS ON A CONTINENTAL SCALE
Summary USD over 10 years
Total investment $ 198,412,538
Total return $ 1,068,729,715
NPV (10%) $ 457,561,793
NPV (20%) $ 265,866,332
0
50
100
150
200
250
300
350
400
Baseline sector value Target sector value
Va
lue
(m
illio
n U
SD
)
Impact of investment on national sector value in steady state (M$)
Farmers Local supply chain Government tax revenue

• A large share (54%) of the investment should come from grants.
• This could also be invested by Kenyan government in addition to reserving part of export tax.
• This will be initial seed funding to fill the funding gap and allow investment in farmer organisation building.
• This can however leverage industry funding by attracting roasters and banks.
• Due to low profitability, only a small portion of farmers would be able to invest.
33
INVESTMENT SHARED BY NATIONAL GOVERNMENT, PRIVATE SECTOR, GRANTS
SEPTEMBER 16AFRICAN COFFEE SECTOR: ADDRESSING NATIONAL INVESTMENT AGENDAS ON A CONTINENTAL SCALE
Summary Value
ACF revolving fund size $ 16,731,420
Required grant funding $ 106,716,206
Required grant funding % 54%
Required national budget (% export tax)
50% Co
ntr
ibu
tion
s a
re in
dic
ativ
e b
ase
d o
n s
take
ho
lde
r in
pu
t. In
vest
me
nts
an
d c
on
diti
on
s to
be
n
eg
otia
ted
with
in n
atio
na
l pu
blic
priv
ate
pla
tfo
rms
taki
ng
into
acc
ou
nt a
mo
ng
st o
the
rs
inte
rna
tion
al c
om
pe
titiv
en
ess
, go
vern
an
ce, t
ran
spa
ren
cy a
nd
acc
ou
nta
bili
ty a
ssu
ran
ce.
0
10,000,000
20,000,000
30,000,000
40,000,000
50,000,000
60,000,000
Vla
ue
(U
SD
)
Public and private programme contributions
Required seed funding grants
Export tax earmarked for programme
Private sector investment
Farmer investment via fund
Annual programme cost
Required cumulative grants
Required total revolving fund

CONCLUSIONS
• The coffee sector in Kenya is in decline, and would need investments of both private and public sector
if it is to be revived. Currently farmers are abandoning coffee is favour of other crops.
• There is significant potential to increase coffee sector value in Kenya through selective investment in
farmer training, farm rejuvenation, use of inputs and farmer organisation building. Volumes could
increase to ~75.000 Mt per annum. The increased value largely flows into rural economy.
• Coffee alone will not provide sufficient income for a full farmer household, under current conditions it
appears unlikely that the gap to the poverty line can be met with agricultural activities. It is unlikely that
farmers will be lifted out of poverty in the short- to mid-term, despite investments.
• Total programme investment amounts to an estimated 198 million USD over 10 years that would
generate a return across the sector of >1 billion USD at current prices.
34
SEPTEMBER 16AFRICAN COFFEE SECTOR: ADDRESSING NATIONAL INVESTMENT AGENDAS ON A CONTINENTAL SCALE

35
SEPTEMBER 16AFRICAN COFFEE SECTOR: addressing national investment agendas on a continental scale
SourcesGlobal Coffee Platform, Olam, GroIntelligence, The Economist, Coffee Sustainability Catalogue, Varqa, Rozimina
DataKenya National Bureau of Statistics, Nairobi Coffee Exchange, US Department of Agriculture, Food and Agriculture Organisation, International Coffee Organisation, USAID, 4C Association, UTZ Certified, Agri-Logic
About the Global Coffee PlatformThe GCP is a collaboration between the 4C Association and the Sustainable Coffee Program of IDH – The Sustainable Trade Initiative. The Global Coffee Platform is an inclusive multi-stakeholder sustainability platform aligning the activities of a diverse network of stakeholders to set into action the global commitments made through Vision 2020 and create a thriving and sustainable coffee sector.
About Agri-LogicAgri-Logic – management, consultancy and research - operates where agricultural production, development, international trade and consumer markets intersect. We combine a thorough understanding of farm level reality and commodity trade with scientific research skills and a track record in sustainability strategy design and implementation, to help clients deal with sustainability challenges and market requirements.
About Valued ChainValued Chain is an independent consultancy. We support organizations in understanding their value chain and stakeholders, identification and mitigation of risks, and realization of opportunities. We believe in integrating commercial objectives with sustainability of the business and its stakeholders. Working from Amsterdam and Lagos, we connect Europe and Africa.