Africa Market Update March 2015
35
Market Update - Africa This report includes economies of Nigeria, Kenya, Tanzania, Uganda, Rwanda and Ethiopia March.2015
-
Upload
kostya-mak -
Category
Documents
-
view
60 -
download
1
Transcript of Africa Market Update March 2015
Market Update - Africa This report includes economies of Nigeria, Kenya, Tanzania, Uganda, Rwanda and Ethiopia
March.2015

2 | StratLink Africa Ltd. www.stratlinkglobal.com
MARKET UPDATE – AFRICA | March 2015
01. NigeriaPre-Election Special Issue:
Counting The Cost

StratLink Africa Ltd.| 3 www.stratlinkglobal.com
MARKET UPDATE – AFRICA | March 2015
POLITICAL OUTLOOKBoko Haram: This Time it’s DifferentThe threat from the Boko Haram militia and the widening domestic division follow-ing postponement of the election to March 2015 will keep the country’s political risk outlook fragile and investors cautious in the near term. Despite claims by the Indepen-dent National Electoral Commission that the postponement was driven by security challenges, concern abounds among oppo-sition factions that the state is buying time to consolidate its voting bloc ahead of what promises to be a hotly contested race.
This is bound to deepen division along po-litical lines domestically. Boko Haram has been active since 2009, and the 2011 elec-tion took place despite its threats, there-fore the postponement is bound to stoke high risk perception among investors. The detonation of a suicide bomb at the end of one of incumbent President Goodluck Jona-than’s campaigns on February 3rd, 2015 fur-ther signified grave security challenges.
An estimated 550 persons were killed in separate attacks by Boko Haram in 20111.
7,500 Troops: Short vs Long-term ImpactThe January 2015 African Union Heads of State Summit approved deployment of 7,500 troops from West African states to help combat Boko Haram. Whereas the im-mediate impact of the move would be to prop up confidence ahead of the election, long-term investors are sure to question the strength of Nigeria’s military capacity, especially given that Boko Haram has been a long standing domestic threat. Interven-tion of comparatively smaller states such as Chad, in the long-term, is likely to cast a dimmed perception of Nigeria. We, how-ever, reiterate that in the immediate future, the deployment will be seen as a boost to-wards a stable environment conducive for free and fair election.
PDP vs APC: A Contest of Bruised FactionsThe two main contenders, the ruling Peo-ple’s Democratic Party (PDP) and the oppos-
1 Business Monitor International 2015
ing All Progressives Congress (APC), have suffered setbacks in the race. Former presi-dent, Olusegun Obasanjo’s decision to quit PDP on February 17th 2015, came as a blow to the party, given his clout locally and in-ternationally, and could detract from PDP’s popularity. Coming on the back of Obasan-jo’s recurring criticism of the handling of the Boko Haram crisis, it is likely to be perceived as an indictment of Goodluck Jonathan’s ca-pacity to deal with the militia. In the same breath, the fact that APC’s presidential can-didate, Muhammadu Buhari, has lost three elections before (2003, 2007 and 2011) could present more headwinds than tail-winds to his party. Buhari’s second Achilles’ heel could be his age – at 72 years (against the 58 year old Jonathan), he is disadvan-taged in courting the youthful voting bloc.
Campaign attacks: Mounting RiskWe further foresee likely risk pressures mounting from the incident of an explosion on February 17th, 2015 in River State during an APC rally. Recurrence of such incidents could widen divisions along political lines while deteriorating investor risk perception from a democratic space perspective.
Despite claims by the Independent National Electoral Commission that the postponement was driven by security challenges, concern abounds among opposition factions that the state is buying time to consolidate its voting bloc ahead of what promises to be a hotly contested race.

4 | StratLink Africa Ltd. www.stratlinkglobal.com
MARKET UPDATE – AFRICA | March 2015
Beyond the Election: Policy OutlookWhichever party wins, there is unlikely to be significant policy variation. Economic growth faces headwinds from depressed global oil prices that will see the new gov-ernment focus on beefing up domestic rev-enue mobilization to ease the fiscal strain. Restoration of confidence in the country’s security apparatus will also be topping the in-tray for the next government. We expect to see a semblance of changing tact in the country’s war on terror aimed at creating a positive psychological impact amongst the citizenry.
ECONOMIC OUTLOOKPlummeting Oil Prices Batter the NairaForeign exchange risk is bound to top inves-tors’ consideration in the coming months as the Naira continues to weather a beating from plummeting oil prices. The local unit has continued to depreciate since the low-ering of Central Bank’s Naira exchange rate floor by 10.0% to 176.0 units against the USA dollar.
Naira vs USD Spot Exchange
Source: Bloomberg, StratLink Africa
We expect the USD 38.0 – 40.0/barrel range to be a psychological mark amongst inves-tors and policy makers. This is because dur-ing the 2008 tumble, prices bottomed out at USD 38.6 and could be deemed by many as a threshold.
Nigeria Naira vs USD Exchange
Source: Bloomberg, StratLink Africa
BUSINESS NEWS ENVIRONMENTThe roll out of a USD 1.1 billion credit facility targeting Small and Medium Enterprises (SMEs2) comes as a strategic buffer in view of likely jitters by foreign investors ahead of elections. Despite accounting for about 95.0% of Nigerian business, the contribution of SMEs to the economy remains low at about 1.0% of GDP. SMEs accounted for a modest 5.0% of total commercial bank lending as at September 20143, with majority citing high cost of credit as an impediment to expan-sion. The credit line, subject to favourable terms, should help catalyse investment by SMEs in the coming months and sup-port economic growth momentum. This comes in succession to approval of a USD 500.0 mil-lion credit line to SMEs by the World Bank (September 2014) potentially indicating increased urgency in bolstering the sector’s vibrancy.
New Pact Targets Non-oil sectorThe councils of Investment and Export promotion have signed a pact aimed at boosting the non-oil sector. Going forward, we expect to see a lot more focus dedicated to boosting the non-oil sector in view of the vulnerability occa-sioned by the decline of global oil prices. The country still has enormous potential for scaling up domestic consumption, pitching the Fast Moving Consumer Goods as a viable target for investors. Whereas Nigeria is Africa’s largest economy, the share of its population living below the USD 1.25 per day abject pov-erty threshold is estimated at 54.4%, compared to 46.0% in Kenya and 28.6% in Ghana. As such, Nigeria has enormous headroom to increase consumption given aggressive poverty eradication.2 Enterprises that employ 10 – 199 persons and have assets valued between USD 25,516.8 and USD 2.6 million3 World Bank 2014
We expect the USD 38.0 – 40.0/barrel range to be a psychological mark amongst investors and policy makers.

StratLink Africa Ltd.| 5 www.stratlinkglobal.com
MARKET UPDATE – AFRICA | March 2015
The Naira will also be susceptible to ten-sions emanating from the political environ-ment in view of the election.
Naira and Political Risk Susceptibility
Source: Bloomberg, StratLink Africa
Short-term: Sharp Focus on Monetary PolicyDespite the November 2014 100.0 bps hike in the benchmark lending rate to 13.0%, we expect potential monetary tightening to be at the top of policy decisions. The Central Bank will not only monitor the slash’s trans-mission effect, but also be keen to cushion the Naira from pressures unfavourable for investment.
Broad Money Growth vs Inflation
Source: Bank of Nigeria, StratLink Africa
Inflation between November and Decem-ber 2014 held steady at 8.0% and could be a pointer of favourable results from the benchmark rate hike.
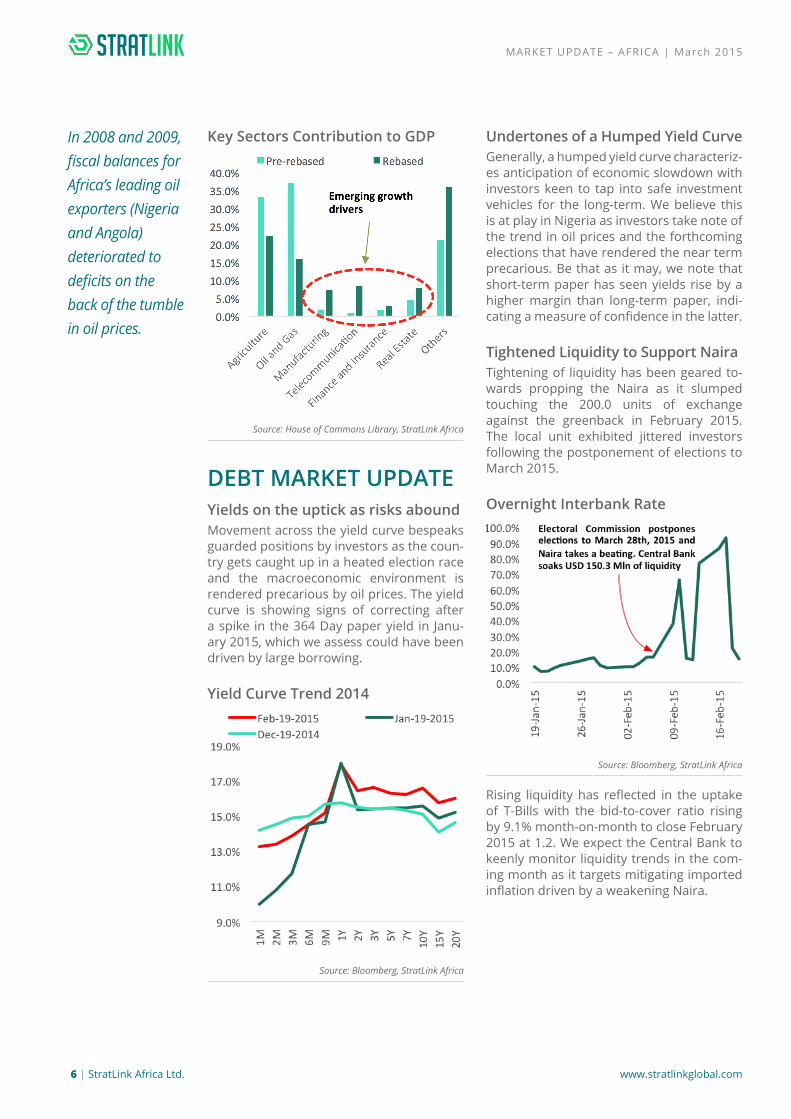
Fiscal Vulnerability Mounts Ahead of ElectionWith oil exports accounting for 57.0% of government revenue and 95.0% of export earnings4, investors will be conscious of the fiscal vulnerability to which the country will be exposed given further decline in oil pric-es. In 2008 and 2009, fiscal balances for Af-rica’s leading oil exporters (Nigeria and An-gola) deteriorated to deficits on the back of the tumble in oil prices.
Fiscal Balance (Including Grants) as % of GDP
Source: IMF 2014, StratLink Africa
Oil prices, at USD 53.97/barrel5, stand 16.9% below Nigeria’s fiscal break-even for 20156, indicating the country could already be fac-ing a strain in meeting planned expenditure.
Rebased Economy offers HopeThis notwithstanding, the fact that rebased data scaled down the oil sector’s contribu-tion to the economy from 37.0% to 15.8% augurs well for long-term investors. In 2013, non-oil GDP growth stood at 8.4%, 290.0 bps higher than aggregate economic growth.
4 Economics Intelligence Unit November 2014 5 OPEC Crude Oil Basket Price February 2015 average6 Business Monitor International
With oil exports accounting for 57.0% of government revenue and 95.0% of export earnings, investors will be conscious of the fiscal vulnerability to which the country will be exposed given further decline in oil prices.
6 | StratLink Africa Ltd. www.stratlinkglobal.com
MARKET UPDATE – AFRICA | March 2015
Key Sectors Contribution to GDP
Source: House of Commons Library, StratLink Africa
DEBT MARKET UPDATEYields on the uptick as risks aboundMovement across the yield curve bespeaks guarded positions by investors as the coun-try gets caught up in a heated election race and the macroeconomic environment is rendered precarious by oil prices. The yield curve is showing signs of correcting after a spike in the 364 Day paper yield in Janu-ary 2015, which we assess could have been driven by large borrowing.
Yield Curve Trend 2014
Source: Bloomberg, StratLink Africa
Undertones of a Humped Yield CurveGenerally, a humped yield curve characteriz-es anticipation of economic slowdown with investors keen to tap into safe investment vehicles for the long-term. We believe this is at play in Nigeria as investors take note of the trend in oil prices and the forthcoming elections that have rendered the near term precarious. Be that as it may, we note that short-term paper has seen yields rise by a higher margin than long-term paper, indi-cating a measure of confidence in the latter.
Tightened Liquidity to Support NairaTightening of liquidity has been geared to-wards propping the Naira as it slumped touching the 200.0 units of exchange against the greenback in February 2015. The local unit exhibited jittered investors following the postponement of elections to March 2015.
Overnight Interbank Rate
Source: Bloomberg, StratLink Africa
Rising liquidity has reflected in the uptake of T-Bills with the bid-to-cover ratio rising by 9.1% month-on-month to close February 2015 at 1.2. We expect the Central Bank to keenly monitor liquidity trends in the com-ing month as it targets mitigating imported inflation driven by a weakening Naira.
In 2008 and 2009, fiscal balances for Africa’s leading oil exporters (Nigeria and Angola) deteriorated to deficits on the back of the tumble in oil prices.

StratLink Africa Ltd.| 7 www.stratlinkglobal.com
MARKET UPDATE – AFRICA | March 2015
91 Day T-Bill Bid-to-cover Ratios
Source: Central Bank of Nigeria, StratLink Africa
Investor appetite has been fairly high for bonds.
Bonds Market Summary
Tenor Bid-to-cover Ratio
Feb-11-2015 3 Year 3.2
Feb-11-2015 5 Year 1.7
Feb-11-2015 10 Year 1.2
Feb-11-2015 20 Year 1.1
Source: Central Bank of Nigeria, StratLink Africa
EQUITY MARKET UPDATENigeria Stock Exchange All Share Index
Source: Bloomberg, StratLink Africa
Nigeria Stock Exchange All Share Index Month-on-Month
Source: Bloomberg, StratLink Africa
The market has remained under immense pressure owing to the prevailing economic climate that has left investors jittery over high risk assets such as equities. Listed counters in the oil sector exhibited the greatest positive response to the ratings, lifting market performance. We, however, expect the uptick to be anaemic based on vulnerabilities stemming from the forth-coming elections and perceived security risks.
-24.3%All Share Index
change month-on-month
-1.5%
All Share Index change year-on-year
There was an uptrend in the middle of February 2015 likely driven, principally, by Standard & Poor’s retention of Nigeria’s sovereign rating at ‘BB- with a negative watch’ (February 13th, 2014) at a time when most investors anticipated a downgrade.

8 | StratLink Africa Ltd. www.stratlinkglobal.com
MARKET UPDATE – AFRICA | March 2015
Bloomberg Nigeria Oil and Gas Index
Source: Bloomberg, StratLink Africa
Nigeria Breweries Buoys Investor Sentiment
At the same time, Nigeria Breweries ush-ered in the earnings season with the finan-cial year 2014 results indicating that the company’s net profit has declined margin-ally by 1.3%, while the revenue declined by 0.8%. The declaration of USD 0.02 in full year dividends could also have served to excite investor sentiment. Consumer goods companies have, however, posted a less up-beat trend in February 2015 likely indicating investors’ anticipation of depressed aggre-gate demand in the coming months.
This could be based on expectation that the government plans to adopt austerity mea-sures owing to depressed oil prices. We be-lieve the tightened monetary policy could further lend credence to this view.
Bloomberg Consumer Goods Index
Source: Bloomberg, StratLink Africa
Finance Counters to Remain Bearish Despite UptickDespite an uptick from mid-February 2015, counters listed from the banking and fi-nance segment are poised to post bear-ish trends in the coming months. This will be driven by an environment of tightened monetary policy; regulatory changes that raised the Cash Reserve Requirement by 500.0 bps to 20.0% and depressed oil prices (about 25.0% of commercial bank lending is extended to companies in the oil sector).
Bloomberg Banking Index
Source: Bloomberg, StratLink Africa
The declaration of USD 0.02 in full year dividends could also have served to excite investor sentiment. Consumer goods companies have, however, posted a less upbeat trend in February 2015 likely indicating investors’ anticipation of depressed aggregate demand in the coming months.

StratLink Africa Ltd.| 9 www.stratlinkglobal.com
MARKET UPDATE – AFRICA | March 2015
02. Kenya

10 | StratLink Africa Ltd. www.stratlinkglobal.com
POLITICAL OUTLOOKTeething Hurdles for Devolved GovernmentSteering the devolved government con-tinues to present a pressure point for the country’s investment climate. January 2015 was characterized by unrest in Narok Coun-ty as a section of legislators led protests against alleged misappropriation of funds by the county government. The country is also staring at the possibility of the pioneer dissolution of a county government, follow-ing the establishment of a commission of in-quiry into the recurrent stalemate between Makueni’s county government executive and legislature. Similar challenges continue to bedevil Embu County, whose governor was impeached in February 2014 before being reinstated by the High Court in April 2014.
The Real Challenge: Development ParalysisKenya has only two years to the next elec-tion cycle and, in our view, the biggest chal-lenge is that development has suffered the back foot in certain counties owing to recur-rent friction between organs that should work hand in hand. Given that counties were ideally aimed at catalysing the trickle down of development and investment, this is likely to be a major setback to Kenya’s in-vestment outlook if not addressed. We fur-ther note that at 63.0% of budget absorp-tion and only ten counties allocating at least 30.0% of funds to capital expenditure, de-velopment is quite likely to lag behind7.
Local Level Taxes Threaten GrowthFurther, a number of counties have adopted a raft of new taxes aimed at generating rev-enue to complement central government al-location. The net effect, however, has been engendering of a punitive environment to investors through rising costs. In Mombasa County, for instance, concern is rife over proposed new levies on imports.
7 World Bank December 2014
ECONOMIC OUTLOOKCost of Credit: Kenya Trails Lucky Seven PeersKenya trails its peer ‘Lucky Seven economies’ (Economies ranked by Fortune Magazine as seven best positioned to succeed the BRICS as the next growth frontiers) as far cost and accessibility of credit is concerned. This is an area that the country’s monetary policy will be keen to exploit in the coming years with a view to boosting investment. Given historic lows of a 200.0 - 210.0 bps margin between the benchmark rate and commer-cial bank lending rates between 2012 and 2014, monetary policy could well be geared towards nudging bank lending rates to as low as 10.0% - 11.0% in the next five years before pursuing single digit targets.
Benchmark Rate minus Commercial Lending Rate Margin
Source: Bloomberg, StratLink Africa
KBRR and CBK Rate at ConvergenceThe 59.0 bps slash of Kenya Banks’ Refer-ence Rate (KBRR) to 8.54% in January 2015 marked, arguably, the strongest indication by the Central Bank to have commercial banks reflect monetary policy changes in loan pricing. KBRR and the monetary policy rate now stand at a convergence point (8.5%) in what should serve to emphasize need for enhanced transmission of monetary policy signals through the commercial bank mar-ket. Going by traditional trends, commercial banks are, however, likely to exert rigidity in reducing rates citing high operational cost.
Kenya has only two years to the next election cycle and, in our view, the biggest challenge is that development has suffered the back foot in certain counties owing to recurrent friction between organs that should work hand in hand.

StratLink Africa Ltd.| 11 www.stratlinkglobal.com
MARKET UPDATE – AFRICA | March 2015
BUSINESS ENVIRONMENTKenya’s ranking amongst the top seven economies8 poised to succeed the BRICS as growth frontiers augurs well for the country’s business environment. This reinforces our long-held view that Kenya pres-ents a favourable growth market for long-term investors. Kenya’s domestic consumption grew by 33.6%, between 2003 and 2013 to USD 34.3 billion placing it ahead of Nigeria (26.3% to USD 145.1 billion)9 and South Africa (21.6% to USD 214.2 billion) . This indicates that even among Africa’s giant econo-mies and regional hubs, Kenya fares well and should be of key interest to investors going forward.
Investment Momentum Reassuring Foreign Direct Investment (FDI) flows also point to the fact that Kenya is in good standing amongst the ‘Lucky Seven’ economies. Kenya’s FDI acceleration between 2003 and 2013 was 206.9% (CAGR), placing it second to Indonesia and ahead of stellar economic growth performers such as Malaysia.
FDI Growth 2003 – ‘13
2013 USD Mln Growth
Indonesia 18,444.0 1,413.3%
Kenya 258.6 206.9%
Colombia 16,771.7 87.3%
India 28,119.4 55.7%
Malaysia 12,305.7 42.7%
Mexico 38,285.7 17.7%
Poland 6,058.6 -16.3%
Source: UNCTAD 2014, StratLink Africa
We expect Kenya to leverage on this position and the fact that it is the only African country in the list to at-tract investment in the coming months. From an ease of doing business standpoint, Kenya faces an opportunity and challenge in equal mea-
sure. The opportunity is that it ranks at the bottom of the ‘Lucky Seven’ rankings and has enormous headroom for measures to improve its position and attract more investment. The challenge is that major-ity of frontier economies are undertaking bold mea-sures to improve their investment climate thereby creating a competitive environment.On February 4th, 2015, Ethiopia rolled out the pilot phase of East and Central Africa’s first mass light rail transit system that should ease labour mobility around the capital city.
World Bank Ease of Doing Business Index
2014 2015
Malaysia 6 18
Poland 45 32
Colombia 43 34
Mexico 53 39
Indonesia 120 114
Kenya 129 136
India 134 142
Source: World Bank, StratLink Africa
Streamlining LogisticsThe import export logistics arena presents fertile ground for boosting Kenya’s ease of doing business. On average, Kenya’s export clearance takes four days costing USD 375.0 compared to Malaysia’s single day procedure costing USD 60.010. Similarly, import clearance takes an average three days in Kenya costing USD 510.0 compared to Malaysia’s single day At USD 60.0 . This efficiency and cost disparity places Kenya at a disadvantage.Adoption of the Single Window Electronic System (an information sharing platform between logistics clearance agencies) beginning 2014 should play a central role in remedying such hiccups faced in trade logistics in the medium to long-term. Streamlining logistics is especially critical for Kenya given its posi-tioning as the commercial hub of East Africa and the gateway to the landlocked markets.
8Fortune Magazine ranked the economies based on economic growth and reforms. Other economies include Indonesia, Mexico, Malaysia, Poland and Columbia9Business Monitor International 10World Bank Ease of Doing Business 2015

12 | StratLink Africa Ltd. www.stratlinkglobal.com
MARKET UPDATE – AFRICA | March 2015
Interest Rate Spread (Lending Minus Deposit - BPS)
Source: World Bank, StratLink Africa
Kenya posts the highest spread between lending and deposit rates amongst the ‘Lucky Seven’ economies – 62.0 bps higher than the average spread of 508.0 bps. This presents a challenge in the economy’s com-petitiveness as it impedes credit access.
Non-performing LoansIn February 2015, the International Mon-etary Fund raised concern over growing non-performing loans and the capacity of banks to shield themselves from concomi-tant shocks. We are of the view that an im-provement in the overall macroeconomic cli-mate and sustained downward pressure on the cost of credit will be the best safeguards against potential shocks from mounting bad debts.
Non-performing Loans to Gross Loans
Source: Central Bank of Kenya, StratLink Africa
The rise in the ratio of non-performing loans to gross loans between 2011 and 2013 re-flects the general climate that was charac-terized by a slowdown in business owing to the election cycle and a surge in the spread between commercial bank lending rates and the benchmark monetary policy rate.
We are of the view that an improvement in the overall macroeconomic climate and sustained downward pressure on the cost of credit will be the best safeguards against potential shocks from mounting bad debts.
DEBT MARKET UPDATEThe yield curve continues on an uptrend in what is driven by government borrowing. In January 2015, the market saw the govern-ment’s appetite for short-term borrowing soar after a dip in December 2014.
Treasury Bills Accepted Bids (USD Mln)
Source: Business Monitor International, StratLink Africa
This trend is likely to be have been replicat-ed in February 2015 as the revenue author-ity reported falling below its mobilization target by 700.0 bps having raked in USD 2.6 billion in between July and September 2014 against a target of USD 2.8 billion.
Bloomberg BVAL Yields Index
Source: Bloomberg, StratLink Africa
A favourable inflation outlook is, however, likely to exert benign downward pressure on the yield curve as investors look to infla-tion trending within the 5.0% +/- 2 band of the Central Bank.

StratLink Africa Ltd.| 13 www.stratlinkglobal.com
MARKET UPDATE – AFRICA | March 2015
Inflation Trend
Source: Central Bank of Kenya, StratLink Africa
Benchmark Rate Held Firm at 8.5%The Central Bank retained the benchmark rate at 8.5% in what we believe was driven by a focus on propping the shilling against pressure from the strengthening green-back. The benchmark has also been re-tained given the slight rise in inflation (to 5.6% in February 2015) for the first time in five months.
Kenya Shilling vs USD Exchange
Source: Bloomberg, StratLink Africa
The Central Bank has been aggressive in the money market mopping up excess liquidity, thereby occasioning resilience in the local unit through February 2015 sterilizing USD 339.1 million from the market in the week to February 13th, 2015.
Liquidity is likely to continue easing and the interbank expected to stabilize in the
6.0% - 7.0% range driven by government payments. As such, we anticipate the Cen-tral Bank to closely monitor liquidity trends with a view to keeping the local unit resilient against major currencies.
Interbank Rate
Source: Central Bank of Kenya, StratLink Africa
Rising liquidity was reflected in the uptake of long-term papers as indicated by the re-opened two and ten year bonds in February 2015.
Bonds Reopening February 2015
Description Value
Offered (USD) 273.6
Received (USD) 559.6
Two Year YTM 11.5%
Ten Year YTM 12.8%
Performance rate 204.5%
Source: Central Bank of Kenya, StratLink Africa
-5.8%Shilling change
year-on-year
+0.4%Shilling change
month-on-month

14 | StratLink Africa Ltd. www.stratlinkglobal.com
MARKET UPDATE – AFRICA | March 2015
EQUITY MARKET UPDATENSE 20 Share Index Trend
Source: Bloomberg, StratLink Africa
NSE 20 Share Index Month-on-Month
Source: Bloomberg, StratLink Africa
Market Upbeat Despite Profit WarningsIt has been a bullish spell at the exchange despite a higher than usual number of firms issuing profit warnings ahead of the first quarter and full year (2014) earnings sea-son. The majority of companies headed for below target performance are in the Agri-culture and Industrial and Allied segments of the exchange, pointing at a tough year in 2014. We note that this comes against the backdrop of a four years consecutive de-cline of Kenya’s exports to the East African Community (portending negative impact on manufacturing), while prices of key agricul-ture commodities (tea and coffee) were de-pressed for the better part of 2014.
Bullish Expectations on Select CountersInvestors have been upbeat about finan-cial services provider, Britam, based on two fronts – the Q1,2015 earnings season and the partnership between the firm and two banks (Equity Bank and Family Bank) aimed at marketing its pension scheme to small and medium enterprises.
Compared to its African peers, the banking sector in Kenya leads in lending to SME’s and the deal marks a potential milestone for Britam given Equity Bank’s large cus-tomer base.
Proportion of Net Income from SME’s Lending
Country Proportion
Kenya 20.5%
Tanzania 16.0%
South Africa 15.0%
Source: World Bank Survey 2013, StratLink Africa
The company’s share was on an uptick at the start of February 2015 before moderat-ing in the latter phase of the month.
Britam Share Performance
Source: Bloomberg, StratLink Africa
Safaricom Rallies Ahead of EarningsMobile service provider, Safaricom Ltd, has also seen its share price rally in the last month in what we assess has been driven by investors’ anticipation of the 2014 full
Compared to its African peers, the banking sector in Kenya leads in lending to SME’s and the deal marks a potential milestone for Britam given Equity Bank’s large customer base.
+ 5.9%NSE 20 Share Index change month-on-
month
+13.7%
NSE 20 Share Index change year-on-year

StratLink Africa Ltd.| 15 www.stratlinkglobal.com
MARKET UPDATE – AFRICA | March 2015
year ending March 31st, 2014 results. In the forthcoming results, we expect continued growth in the company’s non-voice revenue as a share of total revenue as Safaricom continues its gain from internet/data up-take and mobile money uptake.
Safaricom Share Performance
Source: Bloomberg, StratLink Africa

16 | StratLink Africa Ltd. www.stratlinkglobal.com
MARKET UPDATE – AFRICA | March 2015
03. Tanzania

StratLink Africa Ltd.| 17 www.stratlinkglobal.com
MARKET UPDATE – AFRICA | March 2015
The country’s political risk profile has come under sharp focus following the with-holding of budget support by development partners including Japan, United Kingdom and the World Bank.
POLITICAL OUTLOOKCracking the Whip: Business Unusual The cabinet reshuffle by President Jakaya Kikwete came as a clear indicator that it will be business unusual as the government seeks to rid itself of growing risk from the USD 122.0 million energy scandal. The re-shuffle came on the back of resignations by the Attorney General, the Energy Minister and the sacking of the Lands Minister. The country’s political risk profile has come un-der sharp focus following the with-holding of budget support by development partners including Japan, United Kingdom and the World Bank.
Where Does this Leave the Ruling Party?Coming ahead of the October 2015 general election, the graft case leaves the ruling par-ty, Chama Cha Mapinduzi (CCM), vulnerable to criticism from the opposition. Kikwete came to power in 2005 with the promise to fight corruption in government and the scandal could serve to detract from CCM’s track record through the last decade.
Coupled with the forthcoming referendum and general election, the graft scandal is likely to render investors cautious about Tanzania’s political risk outlook.
ECONOMIC OUTLOOKRising Food Prices to Nudge Inflation UpwardDespite trending at favourable single dig-its (below 5.0% between October 2014 and January 2015) inflation is expected to expe-rience upward pressure in the medium to long-term driven by rising food prices. We expect inflation to remain bound within the 4.0% - 6.0% margin in the near term
Inflation versus Food Index
Source: National Bureau of Statistics, StratLink Africa
The food index accounts for 49.0% of the Consumer Price Index (CPI) basket and is likely to exert upward pressure on inflation going forward. There has been a discernible lag effect between food index and inflation in the recent past and this could play out in the course of Q2, 2015.
This will, however, also be subject to trends in global oil prices.
BUSINESS ENVIRONMENTThe business climate is set for a potentially major face-lift as the government plans to navigate business licensing to the digital platform in the course of 2015. In the 2015 Ease of Do-ing Business Index, Tanzania dropped by six places to 124 in the ease of starting a business ranking compared to Rwanda’s position 112. We expect the centralization of manual process-es involved in starting a business to boost investor perception upon fruition, and help accelerate investor interest.The move is timely and can leverage on the growing penetra-tion and use of internet in Tanzania and across the region.
Internet Penetration (% of Population)
Source: Internet
Statistics 2014,
StratLink Africa

18 | StratLink Africa Ltd. www.stratlinkglobal.com
MARKET UPDATE – AFRICA | March 2015
OPEC Basket Price Month-on-Month Decline
Source: National Bureau of Statistics, StratLink Africa
Money Supply to Add Pressure on InflationGrowth in money supply has also accelerat-ed in the recent past, with the year-on-year change averaging 17.4% in Q4, 2014, 320.0 bps higher than the Q1, 2014 average. This uptick could add further upward pressure on inflation in the economy, especially in view of the election cycle, which is typically characterized by high expenditure.
Year-on-Year Money Supply Growth
Source: Bank of Tanzania, StratLink Africa
In this regard, we expect the country’s mon-etary policy to remain tightened in the near term with a view to mitigating potential in-flationary risks. Monetary policy will also be geared towards arresting fragility of the shilling (remaining tight) against major cur-rencies.
DEBT MARKET UPDATEYields corrected further in February 2015 and are approaching levels last seen at the start of Q4, 2014. Fixed income dealers at-tribute the correction to rising competition for government paper following liberaliza-tion of the market towards the end of 2014 that is likely to have attracted more inves-tors.
T-Bill Accepted Bids (USD Mln)
Source: Bank of Tanzania, StratLink Africa
In September 2014, the government lifted caps on foreign investor participation in the bonds market allowing East Africans, hence-forward, to purchase up to 40.0% of govern-ment paper. Investor appetite for T-Bills has been on the rise.
Average Bid-to-Cover Ratios
Source: Bank of Tanzania, StratLink Africa
Investor appetite has been buoyed by im-proving liquidity conditions which have seen the interbank rate drop by 560.0 bps, month-on-month, to close February 2015 at 3.3%.
The rise in liquidity could be the result of the Central Bank having eased its tightening exercise following the bout of appreciation towards the end of January 2015.

StratLink Africa Ltd.| 19 www.stratlinkglobal.com
MARKET UPDATE – AFRICA | March 2015
Interbank Rate and Volumes
Source: Bank of Tanzania, StratLink Africa
The rise in liquidity could be the result of the Central Bank having eased its tighten-ing exercise following the bout of apprecia-tion towards the end of January 2015. The local unit has been under pressure in the last month driven by the strengthening dol-lar and rising liquidity, which have counter-vailed gains that would been made from a favourable oil import bill.
Tanzania Shilling vs USD Exchange
Source: National Bureau of Statistics, StratLink Africa
EQUITY MARKET UPDATEDar es Salaam All Share Index
Source: Bloomberg, StratLink Africa
Dar es Salaam All Share Index Month-onMonth
Source: Bloomberg, StratLink Africa
The market remained on a bullish path buoyed by release of positive results by Na-tional Microfinance Bank Ltd. In the full year 2014, the bank’s net profit grew by 16.0%, year-on-year, to USD 84.9 million. The bank’s performance was driven by a 19.0% growth in fees and commissions to USD 64.1 mil-lion, while the ratio of non-performing loans to gross loans declined marginally to 2.6%.
+1.7%All Share Index
month-on-month change
+43.2%All Share Index
year-on-year change

20 | StratLink Africa Ltd. www.stratlinkglobal.com
MARKET UPDATE – AFRICA | March 2015
National Microfinance Bank
Source: Bloomberg, StratLink Africa
On the whole, counters in the Industrial and Allied segment of the market have re-mained at the vanguard of the bullish curve.
Industry Indices Comparison (Year-on-Year)
Source: Bloomberg, StratLink Africa
12 International Monetary Fund Region Outlook October 2014

StratLink Africa Ltd.| 21 www.stratlinkglobal.com
MARKET UPDATE – AFRICA | March 2015
04. Uganda

22 | StratLink Africa Ltd. www.stratlinkglobal.com
MARKET UPDATE – AFRICA | March 2015
POLITICAL OUTLOOKBallot 2016: The Age QuestionNational Resistance Movement (NRM) leg-islators are reported to be planning a con-stitutional amendment aimed at lifting the present age limit stipulated for presidential hopefuls. Factions of the opposition have termed the alleged move as one aimed at consolidating President Museveni’s bid in the 2016 race.
Is History Repeating Itself?If true, the move will be reminiscent of the 2003 NRM conference to which many attri-bute the subsequent scraping of Presiden-tial term limits that have allowed Museveni to remain in power. In this wider context, Uganda is bound to be widely perceived as experiencing systematic diminution of democratic space thereby heightening the country’s political risk perception.
The Constitutional QuestionWe note, however, that Museveni will be 72 years old by the next election and the letter of the constitution is specific only to barring persons aged 75 and above from assuming office. In the case of Museveni, the opposi-tion could advance an argument, albeit po-tentially frail, on the silence of the constitu-tion on the scenario in which one turns 75 while in office.
ECONOMIC OUTLOOKFiscal Improvement buoys Outlook
The Uganda Revenue Authority registered 99.5% revenue mobilization performance in the first half of 2014/15 (July 2014 – De-cember 2014) raking in USD 1.6 billion. This translates to an elevated fiscal position that could improve execution of projects aimed at boosting the country’s investment cli-mate. It could also serve as an indicator of improved year-on-year economic growth momentum given that 2013/14’s mobiliza-tion underperformance was largely attrib-uted to below target economic growth.
Tax Reforms Drive PerformanceThe performance was expected in view of the raft of reforms proposed in budget 2014/15, which among other changes, intro-duced tax on agricultural inputs.
Revenue Mobilization Performance
Source: Revenue Authority, StratLink Africa
We believe this performance has been cen-tral in Fitch’s upward revision of long-term foreign and local currency issuer default rat-ings from ‘B’ to ‘B+’ (Stable Outlook) in Janu-ary 2015.
Mitigating Fiscal VulnerabilityDespite steady improvement in revenue mobilization over the last decade, closing in on the target versus actual gap has been a challenge for Uganda. As such, 99.5% in the period under review marks a critical milestone in Uganda’s revenue mobilization growth path.
BUSINESS ENVIRONMENT
Focus continues to be skewed towards the country’s energy infrastructure with the latest development being a USD 10.0 million capital injection towards the Energy Revolving Fund. Since it targets increasing elec-tricity penetration in the rural areas, the capital injection is expected to impact the Small and Medium Enterprise invest-ment climate favourably reducing the challenge of electricity downtime.
The capital is expected to connect an additional 68,000 persons to the national grid.
Source: World Bank, StratLink Africa
Electricity Penetration

StratLink Africa Ltd.| 23 www.stratlinkglobal.com
MARKET UPDATE – AFRICA | March 2015
Net Revenue Collected (USD Bln)
Source: Revenue Authority, StratLink Africa
Tax revenue as a proportion of total budget has surged from 58.0% in 2004/05 to 71.5% in 2013/14. This growth is crucially impor-tant in boosting investor perception of the country’s capacity to cushion fiscal risks go-ing forward.
The impact of the 2012/13 aid shock on Rwanda’s economic performance reinforc-es the urgency for East African economies to scale down reliance on budget support from development partners.
Fiscal Balance as % of GDP
Source: IMF 2014, StratLink Africa
DEBT MARKET UPDATEYields continue to nudge upwards despite a buoyed fiscal position and low inflation pressures. It is our assessment that inves-tors are anticipating monetary policy ef-forts to be geared towards inflicting upward movement in inflation, which stood at an all-time low of 1.3% in January 2015. The country’s food index has been on a down-trend and Bank of Uganda could loosen its policy rate in the coming months to avert further decline in inflation to disconcerting single digits.
T-Bill Yields
Source: Bank of Uganda, StratLink Africa
Domestic borrowing is likely to be low in the coming months as the government realizes its revenue mobilization targets for 2014/15 through adjustments in its tax regime.
Inflation vs Food Index
Source: Bank of Uganda, StratLink Africa
Volatile Trend in the Money MarketLiquidity has been volatile in the money market in the recent past with Bank of
- 0.6%Uganda Shilling
month-on-month change
- 16.9%Uganda Shilling
year-on-year change
The impact of the 2012/13 aid shock on Rwanda’s economic performance reinforces the urgency for East African economies to scale down reliance on budget support from development partners.

24 | StratLink Africa Ltd. www.stratlinkglobal.com
MARKET UPDATE – AFRICA | March 2015
Uganda reporting the latest interbank rate figure at 7.0%. In January 2015, interbank rate oscillated between a high of 14.4% and a low of 5.4%.
Overnight Interbank Rate
Source: Bank of Uganda, StratLink Africa
Rising liquidity is likely to subject the Ugan-da Shilling to further depreciation, which has in the recent past been driven, princi-pally, by the strengthening USA dollar and deterioration of the balance of payment.
Uganda Shilling vs USD Exchange
Source: Bank of Uganda, StratLink Africa
EQUITY MARKET UPDATEUganda Stock Exchange All Share Index
Source: Bloomberg, StratLink Africa
UGSE All Share Month-on-month
Source: Bloomberg, StratLink Africa
It has been a bullish season at the exchange as investors look towards release of Q1, 2015 results. Counters in the financial ser-vices have been especially bullish in the last month in February 2015. Stanbic Uganda’s rally comes on the back of the signing of a USD 85.0 million loan facility from a consor-tium of banks in the United Arab Emirates. The facility is expected to help Stanbic fur-ther its penetration in the market.
+48.0%All Share Index
year-on-year change
+ 4.8%All Share Index
month-on-month change

StratLink Africa Ltd.| 25 www.stratlinkglobal.com
MARKET UPDATE – AFRICA | March 2015
Stanbic Uganda Share Performance
Source: Bloomberg, StratLink Africa

26 | StratLink Africa Ltd. www.stratlinkglobal.com
MARKET UPDATE – AFRICA | March 2015
05. Rwanda

StratLink Africa Ltd.| 27 www.stratlinkglobal.com
MARKET UPDATE – AFRICA | March 2015
POLITICAL OUTLOOKCampaign against FDLR: Exercise in Limbo?Rwanda’s push for disarmament of FDLR11
rebels in the Democratic Republic of Congo (DRC) has suffered a setback following the United Nation’s suspension of intervention in the exercise in February 2015. FDLR has been a key destabilizing force in the Great Lakes region notably in strained relations between Rwanda and DRC over recurrent border conflict. Whereas DRC claims to have capacity to lead the operation against FDLR, we note that the rebels’ defiance of the six months ultimatum to wilfully surren-der and demobilize (by January 02nd, 2015) raises doubt over such prospects. Presently, Rwanda’s political risk outlook is favourable, but will be subject to the handling of the FDLR question in the coming months.
M23 Precedent: A Case for Concerted EffortsThe defeat of M23 Rebels in November 2013 was made possible only by concerted efforts between the DRC and international actors such as the UN. This precedent, in a sense, lends credence to the need for joint effort in addressing the FDLR question and securing political stability in the Great Lakes region.
ECONOMIC OUTLOOKOn Mission to Catalyse Inflation?The government has stated there is ‘room for accommodative monetary policy’ signal-ling a potential slash in the benchmark lend-ing rate in the coming months.
We believe this augments our view that the government would be pressed to push infla-tion upward following its advance towards the 0.0% mark. Our December 2014 update, expressed concern over Rwanda’s pace of disinflation that had seen, at the time, the rate fall 320.0 bps below target.
Inflation Trend
Source: National Bureau of Statistics, StratLink Africa
Pulling the Money Supply StringFurther expansion of monetary policy will serve to stoke inflationary pressures through increased money supply. In the event of change, we anticipate a low margin (0 – 50.0 bps) slash in the benchmark lend-ing rate informed by two considerations:
1) Economy is back to Pre-crisis Growth Momentum The economy has bounced back to pre-crisis (the 2012 – 13 donor aid suspension shock) growth momentum. As such, the government is likely to deem it necessary to expand monetary policy at a rate equalling
We believe the June 2014 surge in money supply was driven by the twin effects of improvement in aid disbursement to the economy and a slash in the benchmark rate. The government will be keen to mitigate recurrence of the same given resumed aid flows into the economy.
BUSINESS ENVIRONMENTAgribusiness and manufacturing remain the key target for cred-itors eyeing the business landscape with the latest credit line coming from the European Investment Bank. The USD 115.7 million facility signals confidence in the country’s private sector, driven by a robust and growing Small and Medium Enterprise segment.
Bullish Outlook by InvestorsThis signifies bullish expectations by investors on the country’s consumption growth. Rwanda’s domestic consumption has grown (CAGR) by 42.4% between 2003 and 2013 to USD 6.1 bil-lion compared to Guinea’s (its peer by population size) 18.2% to USD 3.6 billion12. This view is further backed by the country’s per capita income whose growth, in the same period, averaged 34.2% to USD 640.0 compared to Ethiopia’s (its peer in economic growth momentum) 39.6% to USD 424.0.
12 Business Monitor International11Democratic Forces for the Liberation of Rwanda

28 | StratLink Africa Ltd. www.stratlinkglobal.com
MARKET UPDATE – AFRICA | March 2015
DEBT MARKET UPDATEYields in the T-Bill market continue to regis-ter marginal downward movement in what is likely to be investors’ response to all time low inflation that stood at 1.7% as of Janu-ary 2015 as well as increased liquidity in the money market. Rwanda now posts the sec-ond lowest inflation rate in the region (after Uganda’s 1.3% as at January 2015) and the lowest T-Bill yields across all tenors.
T-Bill Yields
Source: Bank of Rwanda, StratLink Africa
Low yields have occasioned increased gov-ernment uptake of Treasury Bills and this is expected to remain high as yields remain low in the near term.
Amount Borrowed through T-Bills (USD Mln)
Source: Bank of Rwanda, StratLink Africa
Uptake of debt instruments has been mod-est with the 91 Day bid-to-cover ratio aver-aging 1.7 in February 2015. We note, howev-er, that this stands far higher than January 2015’s 1.0 reflecting a rise in liquidity in the money market also evidenced by the sharp decline in the interbank rate.
or less than the slash taken in June 2014, at the height of the recovery phase. We expect full year growth in 2014 to stand between 6.8% and 7.3%.
Q1 – Q3 Average GDP Growth
Source: National Bureau of Statistics, StratLink Africa
2) Latest Slash Yielded ‘Abnormal’ Surge in Money SupplyThe June 2014 50.0 bps slash in the policy rate saw the quarter-on-quarter money supply surge by 16.9% compared to 8.6% in the same period a year earlier.
Quarter-on-Quarter Money Supply Growth
Source: Bank of Rwanda, StratLink Africa
We believe the June 2014 surge in money supply was driven by the twin effects of im-provement in aid disbursement to the econ-omy and a slash in the benchmark rate. The government will be keen to mitigate recur-rence of the same given resumed aid flows into the economy.
Uptake of debt instruments has been modest with the 91 Day bid-to-cover ratio averaging 1.7 in February 2015. We note, however, that this stands far higher than January 2015’s 1.0 reflecting a rise in liquidity in the money market also evidenced by the sharp decline in the interbank rate.

StratLink Africa Ltd.| 29 www.stratlinkglobal.com
MARKET UPDATE – AFRICA | March 2015
RSE All Share Index Month-on-month
Source: Bloomberg, StratLink Africa
A significant boost for the market in Feb-ruary 2015 came from the cross-listing of Kenya’s largest bank by customer base, Eq-uity Bank, on February 13th, 2015 at the ex-change. The bank’s strategic outlook in the coming years includes venturing into the lu-crative mobile money space and the health sector through a chain of clinics. In view of the push, across the region, for lower lend-ing rates, Equity Bank’s diversification of its revenue streams from interest income au-gurs well for investors.
Equity Bank Evolution of Revenue Streams
Source: Bloomberg, StratLink Africa
Interbank Rate
Source: National Bureau of Statistics, StratLink Africa
The franc remains volatile against the greenback in what could be an indicator of changes in the country’s foreign exchange reserves. The local unit is likely to remain depressed by rising liquidity in the money market.
Rwanda Franc vs USD Exchange
Source: Bloomberg, StratLink Africa
EQUITY MARKET UPDATERwanda Stock Exchange All Share Index
Source: Bloomberg, StratLink Africa
-2.0%Rwanda franc year-on-year depreciation
-2.6%Rwanda franc
month-on-month depreciation
+0.1%All Share Index
month-on-month change
- 4.4%All Share Index
year-on-year change

30 | StratLink Africa Ltd. www.stratlinkglobal.com
MARKET UPDATE – AFRICA | March 2015
06. Ethiopia

StratLink Africa Ltd.| 31 www.stratlinkglobal.com
MARKET UPDATE – AFRICA | March 2015
POLITICAL OUTLOOKRacing to the PollsCampaigns for the general election kicked off on February 14th, 2015 and are ex-pected to wrap up on May 21st, 2015, four days ahead of the voting exercise. The en-vironment has been characterised by rela-tive calm in February 2015 with potential pressure points predicted to emerge from constrained media freedom. In the next two months, investor focus is expected to shift to management of the election cycle, nota-bly relations between the ruling Ethiopian People’s Ruling Democratic Front (EPRDF) and the opposition.
Constrained Space to Decelerate Opposition MomentumIn view of the constrained democratic space, it will be of great interest to see how the main opposition parties (Unity for De-mocracy and Justice Party, Blue Party, All Ethiopia Unity Party and All Ethiopia Demo-cratic Party) stage a contest against EPRDF. We, however, anticipate minimal challenge given EPRDF’s advantage of incumbency and a strong economic growth record that could endear it to voters.
ECONOMIC OUTLOOKWhy Demographic Forecast Bodes wellThe Central Statistical Agency forecasts the country’s population growing by 10.0 million to 100.9 million by 2025. In view of demographic shifts in Ethiopia in the last
two decades, we are of the view this trend is bound to stoke investor interest in the economy in the coming years. The country’s dependency ratio (the proportion of per-sons aged 0 – 15 years and 55+ years to the total working age population) declined by 650.0 bps to 91.3% between 1990 and 2010. This points at greater capacity for scaling up economic output given a growing propor-tion of the country’s economically produc-tive population.
Dependency Ratio Comparison
Source: Business Monitor International, StratLink Africa
The country’s poverty incidence (percent-age of population living below the extreme poverty line of USD 1.25/day) has declined from 55.0% in 2000 to 31.0% in 201115. This sends a favourable trickle down indicator of the country’s decade of robust econom-ic growth, 2003 – 2013, that saw real GDP growth average 9.5%16.
06. Ethiopia
BUSINESS ENVIRONMENTMobile money platforms, which received the operation greenlight in 2014, are catch-ing momentum, raising sights for financial sector deepening in the country. Between December 2014 and January 2015, the platform dubbed M-Birr is reported to have generated 5,000 – 6,000 subscribers13 painting a favourable picture for uptake by consumers. Ethiopia’s financial services sector is largely state driven (public banks account for 67.0% of deposits and 55.0% of loans and advances14) and the entry of private micro-finance and banking institutions into the mobile money space sends a favourable signal on the days to come.13www.2merkato.com14Making Finance Work for Africa - Ethiopia
Between December 2014 and January 2015, the platform dubbed M-Birr is reported to have generated 5,000 – 6,000 subscribers painting a favourable picture for uptake by consumers.
15World Bank Ethiopia Poverty Assessment 201516Business Monitor International

32 | StratLink Africa Ltd. www.stratlinkglobal.com
MARKET UPDATE – AFRICA | March 2015
The Urban Drift: Unlocking ConsumptionUrban centres typically serve as hubs of consumption and wealth creation thereby stimulating economic growth. In this regard, Ethiopia’s urbanization trajectory is promis-ing for investors.
Urbanization Rate
Source: Business Monitor International, StratLink Africa
Between 1990 and 2010, Ethiopia’s urban-ization rate grew by 550.0 bps to 18.1%. This pace of urbanization, however, falls below Kenya’s 890.0 bps growth to 25.6% in the same period. Per capita income, despite re-maining low by regional standards, are on a path promising higher consumption going forward.
GDP per Capita Income (USD) Forecast17
Source: Business Monitor International, StratLink Africa
Given the metrics considered, a popula-tion of 100.9 million people potentially portends a favourable market for investors eyeing frontier markets. The economy is be-coming gradually liberalized and adopting measures to boost business attractiveness
such as agency banking (December 2014). Monetary policy has also kept inflation at favourable levels and mitigated foreign ex-change volatility.
Birr vs USD Exchange Rate
Source: Bloomberg, StratLink Africa
The Birr has come under immense pres-sure against major currencies in the recent past owing to deterioration of balance of payments that has seen the current ac-count deficit deteriorate from 6.5% of GDP in 2011/12 to an estimated 7.3% in 2014/15. We anticipate this trend to prevail in the near term as coffee (28.0% of export rev-enue) prices remain depressed in the global market.
17Forecast based on an average 14.4% average growth in per capita income between 2003 and 2013
- 5.9%Birr depreciation
year-on-year
- 0.4%Birr depreciation month-on-month

33 | StratLink Africa Ltd. www.stratlinkglobal.com
MARKET UPDATE – AFRICA | March 2015
Stratlink Africa Ltd - Who We AreStratLink is an Africa focused financial advisory company with Capital Raising Advisory, Corporate Advisory and Market Research as our core business lines. We believe in the growth potential of sub-Saharan African economies and partner with our clients to execute their vision by providing quality services and access to capital. We recognize opportuni-ties in the region and connect the fastest growing middle market companies with leading global investment banks, private equity firms and family offices. We value the importance of making informed decisions and leverage our regional knowledge to the advantage of our clients.
Sub-Saharan Africa: In-depth macro and microeconomic researchWithin our purview of coverage are nine economies – Kenya, Tanzania, Uganda, Rwanda, Ethiopia, Nigeria, Ghana, Angola and Gabon. We undertake incisive research and analysis of each of the countries’ macro and microeconomic environment, debt and equity markets. We also conduct sector specific research and analysis shedding insight on market land-scape, existing gaps and opportunities as well as potential challenges.
Our guarantee: Competent team, reliable dataOur research is anchored in a competent and versatile team traversing the fields of eco-nomics and finance with qualifications from globally recognized institutions. The team is backed by subscription to reliable databases such as Business Monitor International, Bloomberg, Thomson One Research, World Economics and The World Today. As such, our guarantee is reliable and up to date data in an increasingly dynamic region. Further, we reach out to relevant bodies in concerned markets including Central Banks, ministries and state departments.
Authoritative voice on regional economicsStratLink has become an authoritative voice for commentary and opinion on issues per-taining Sub-Saharan African economies and investment. Reputable media including CNBC Africa, Nation Media Group, CCTV and Bloomberg have reached out to the company for opinion and analysis.
Where we are basedOur head office is in Nairobi, Kenya with satellite offices in New York, Kampala and Kuala Lumpur.

StratLink Africa Ltd.| 34 www.stratlinkglobal.com
MARKET UPDATE – AFRICA | March 2015
StratLink-Africa Team
Konstantin Makarov – Managing Director
Dina Farfel – Partner
Fredd Kambo – Director Transaction Advisory Services
Poonam Vora - Associate
Samuel Odero - Analyst
Lewis Muguro - Analyst
Julians Amboko – Research Analyst

StratLink Africa Ltd.| 35 www.stratlinkglobal.com
MARKET UPDATE – AFRICA | March 2015
The material prepared by StratLink Africa Ltd (“StratLink “) is our opinion. StratLink believes that it fairly and accurately represents the subject matter reported upon. This report does not include a personal recommendation and does not constitute an offer, or the solicitation of an offer for the sale or purchase of any finan-cial product, service, investment or security mentioned herein. The text, images, and other materials contained or displayed on any StratLink product, service, report, e-mail, or website are pro-prietary to StratLink and constitute valuable intellectual property. This report is issued only for the information of, and may only be distributed to professional investors, or major institutional inves-tors (as defined in Rule 15a-6 of the US Securities Exchange Act of 1934), and dealers in securities. This publication is confidential and for the information of the addressee only and may not be re-produced in whole or in part, nor copies circulated to any party, without the prior written consent of StratLink. StratLink accepts no liability for any loss resulting from the use of the material pre-sented in this report. This disclaimer of liability may be prohibited, or limited, by specific statutes, laws, or regulations. StratLink af-filiates, shareholders, directors, officers, partners, and consultants shall have no liability, contingent or otherwise, for any claims or damages arising in connection with any errors, omissions, or inac-curacies. This report is not to be relied upon in substitution for the exercise of independent judgment.
The investments and strategies discussed here may not be suit-able for all investors; if you have any doubts you should consult your investment advisor. The investments discussed may fluctuate in price or value. Whilst every care has been taken in preparing this presentation, StratLink does not give any representation, warranty or undertaking and accepts no responsibility or liability as to the accuracy, or completeness, of the information in this report
StratLink may have issued, and may in the future issue, reports that are inconsistent with, and which reach different conclusions than, the information presented in this report. Reports may reflect different assumptions, views, analytical methods, and analysts who prepared them, and no part of the analysts compensation was, is, or will be, directly or indirectly related to the specific rec-ommendations or views expressed in this report. All views, opin-ions, and estimates contained in this document may be changed
after publication at any time without notice. Past performance is not indicative of future results and should not be taken as an indi-cation or guarantee of future performance. No warranty, express or implied, is made regarding such performance. The investments and strategies discussed here may not be suitable for all investors or any particular class of investors; if you have any doubts you should consult your investment advisor. All representations, infor-mation, opinions, and estimates contained in this report reflect a judgment of the analyst, effective as of its original date of publica-tion by StratLink, and are subject to change without notice. The price, value of, and income from any of the securities mentioned in this report can fall as well as rise. The value of securities is subject to exchange rate fluctuation that may have a positive or adverse effect on the price or income of such securities. Investors in securi-ties and other instruments, the values of which are influenced by currency volatility, must assume this risk. StratLink personnel, or other professionals, may provide oral or written commentary or trading strategies to our clients that reflect opinions that are their own and are contrary to the opinions expressed in StratLink’s re-search. StratLink is under no obligation to ensure that such other reports are brought to the attention of any recipient of any report. StratLink and its respective affiliates, officers, directors, partners, and consultants, including persons involved in the preparation or issuance of this report may, from time to time (i) have positions in, and buy or sell, the securities of companies referred to in this re-port (or in related investments); (ii) have a consulting, investment banking or broking relationship with a company referred to in this report; and (iii) to the extent permitted under applicable law, have acted upon or used the information contained or referred to in this report including effecting transactions for their own account in an investment (or related investment) in respect of any com-pany referred to in this report, prior to or immediately following its publication. To the extent applicable and permitted by law or regulation, StratLink believes that the direct author of this report has no position in, fiduciary interest proscribed, nor has been compensated by the subject(s) of this report, or other entities for the content, other than through direct compensation by StratLink.
©StratLink Africa Limited 2015
Disclaimer Notice