AfrAsia Bank Africa Wealth Report 2017 · Wealth statistics, on the other hand, take all of these...
40
AfrAsia Bank Africa Wealth Report 2017 © New World Wealth Page 1
Transcript of AfrAsia Bank Africa Wealth Report 2017 · Wealth statistics, on the other hand, take all of these...
AfrAsia Bank Africa Wealth Report 2017
© New World Wealth Page 1
ho-

AfrAsia Bank Africa Wealth Report 2017
© New World Wealth Page 2
TABLE OF CONTENTS
TABLE OF CONTENTS ............................................................................................................. 2
LIST OF TABLES....................................................................................................................... 3
LIST OF FIGURES ..................................................................................................................... 3
1 Introduction ........................................................................................................................ 4
1.1 What is this Report About? ....................................................................................................... 4
1.2 Definitions .................................................................................................................................. 5
1.3 Sources ...................................................................................................................................... 5
2 Country statistics ............................................................................................................... 6
2.1 Benchmarking Africa’s Wealth in Context ............................................................................... 6
2.1.1 World statistics.......................................................................................................................................... 6
2.1.2 Africa statistics .......................................................................................................................................... 6
2.2 Wealth per capita rankings ....................................................................................................... 8
2.3 Total wealth rankings .............................................................................................................. 10
2.4 HNWI rankings ......................................................................................................................... 11
2.5 HNWI trends over the past 10 years ....................................................................................... 12
2.6 HNWI trends over the past year .............................................................................................. 14
2.7 HNWI forecasts to 2026 ........................................................................................................... 15
3 City statistics .................................................................................................................... 16
3.1 Top African cities for HNWIs ................................................................................................... 16
3.2 HNWI city trends over the past year ....................................................................................... 17
3.3 HNWI city forecasts to 2026 .................................................................................................... 18
3.4 Spotlight on South African cities ............................................................................................ 19
4 Spending habits of African HNWIs ................................................................................. 20
4.1 Behavioral mapping................................................................................................................. 20
4.2 Collectables ............................................................................................................................. 21
4.3 Prime real estate ...................................................................................................................... 24
4.4 Second homes abroad ............................................................................................................ 25
4.5 Largest luxury markets ........................................................................................................... 27
4.6 Luxury clothing & accessory brands ..................................................................................... 28
4.7 Luxury cars .............................................................................................................................. 29
4.8 Luxury hotels & lodges ........................................................................................................... 31
4.9 Exclusive liquor ....................................................................................................................... 33
4.10 HNWI wardrobe ........................................................................................................................ 34
4.11 Private jets ............................................................................................................................... 35
5 Wealth management in Africa ......................................................................................... 36
5.1 Top wealth management companies in Africa ....................................................................... 36
5.2 Family offices ........................................................................................................................... 37
AfrAsia Bank Africa Wealth Report 2017
© New World Wealth Page 3
5.3 Foundations and venture capital companies linked to HNWIs ............................................. 37
5.4 Best ways of getting to HNWIs ............................................................................................... 38
6 About the author .............................................................................................................. 39
LIST OF TABLES
Table 1: Africa: HNWI wealth band and group definitions ..........................................................................................................................................4
Table 2: Africa: Wealth per capita rankings, 2015 - 2016 ...........................................................................................................................................8
Table 3: Africa: Total wealth rankings, 2016 .............................................................................................................................................................10
Table 4: Africa: HNWIs by country, 2016 ..................................................................................................................................................................11
Table 5: Africa: HNWI growth by country, 2006-2016 ...............................................................................................................................................12
Table 6: Africa: HNWI growth by country, 2015-2016 ...............................................................................................................................................14
Table 7: Africa: HNWI growth forecasts by country, 2016-2026 ...............................................................................................................................15
Table 8: Africa: Top cities for HNWIs, 2016 ..............................................................................................................................................................16
Table 9: Africa: HNWI growth rates by city, 2015-2016 ............................................................................................................................................17
Table 10: Africa: HNWI growth rate forecasts by city, 2016-2026 ............................................................................................................................18
Table 11: Africa: Popular classic cars for HNWIs, 2016 ...........................................................................................................................................22
Table 12: Africa: Major cities ranked by US$ per square meter, 2016 ....................................................................................................................24
Table 13: World: Top second homes hotspots for African HNWIs (outside of Africa), 2016 ...................................................................................25
Table 14: South Africa: Foreign investment in SA top-end real estate, 2006–2026 ................................................................................................26
Table 15: Africa: Largest luxury markets by revenue, 2016 ....................................................................................................................................27
Table 16: Africa: Luxury brand stores, 2016..............................................................................................................................................................28
Table 17: Africa: Upcoming luxury brand stores, 2016 .............................................................................................................................................29
Table 18: Africa: Top selling luxury cars, 2016 .........................................................................................................................................................29
Table 19: Africa: Popular SUVs for HNWIs, 2016 .....................................................................................................................................................30
Table 20: Africa: Popular sports cars for HNWIs, 2016 ............................................................................................................................................30
Table 21: Africa: Most visited countries by the super-rich, 2016 ..............................................................................................................................31
Table 22: Africa: Top rated hotels for HNWIs, 2016 .................................................................................................................................................32
Table 23: Africa: Top rated safari lodges for HNWIs, 2016 ......................................................................................................................................32
Table 24: Africa: Top rated small hotels for HNWIs, 2016 ........................................................................................................................................33
Table 25: Africa: Popular drinks for HNWIs, 2016 ....................................................................................................................................................33
Table 26: Africa: Items commonly found in the wardrobe of a HNWI, 2016 ............................................................................................................34
Table 27: Africa: Private jet usage by country, 2016.................................................................................................................................................35
Table 28: Africa: Wealth management companies by AuM, 2016............................................................................................................................36
Table 29: Africa: Top rated brokers for HNWIs, 2016 ...............................................................................................................................................38
Table 30: Africa: Top rated equity funds for HNWIs, 2016 .......................................................................................................................................38
LIST OF FIGURES
Figure 1: Africa: Asset Price Performance (US$ terms), 2006–2016 .........................................................................................................................7
Figure 2: Africa: Behavioral Mapping of HNWIs, 2016 .............................................................................................................................................20

AfrAsia Bank Africa Wealth Report 2017
© New World Wealth Page 4
1 Introduction
1.1 What is this Report About?
This report is the result of New World Wealth’s extensive research covering the wealth market in
Africa.
The report covers wealth, luxury, prime property, collectable and wealth management trends on the
continent from 2006 to 2016, with projections to 2026.
Figures mentioned in the report are from New World Wealth unless otherwise stated.
The following table breaks down the various wealth bands that we look at.
Table 1: Africa: HNWI wealth band and group definitions
Wealth band Definition
Billionaires Billionaires are those HNWIs with net assets of US$1 billion or more.
Centimillionaires Centimillionaires are those HNWIs with net assets of between US$100 million and US$1 billion.
Affluent Millionaires Affluent millionaires are those HNWIs with net assets of between US$30 million and US$100 million.
Mid-Tier Millionaires Mid-tier millionaires are those HNWIs with net assets of between US$5 million and US$30 million.
Lower-Tier Millionaires Lower-tier millionaires are those HNWIs with net assets of between US$1 million and US$5 million.
Wealth group Definition
UHNWIs (Ultras) Those individuals with net assets of US$30 million or more.
Multi-millionaires Those individuals with net assets of US$10 million or more (i.e. double digit millionaires).
Millionaires (HNWIs) Those individuals with net assets of US$1 million or more.
Mass Affluent Those individuals with net assets of between US$100,000 and US$1 million.
Source: New World Wealth
AfrAsia Bank Africa Wealth Report 2017
© New World Wealth Page 5
1.2 Definitions
“Wealth” refers to the net assets of a person. It includes all their assets (property, cash, equity,
business interests) less any liabilities.
For the purposes of this report, local HNWIs include all individuals that are working or living in each
country, including expats.
The “review period” refers to the 10 years from the end of 2006 to the end of 2016.
The “forecast period” refers to the 10 years from the end of 2016 to the end of 2026.
“Wealth management” or “private banking” is defined as the provision of banking services to wealthy
individuals and their families. It generally involves the management of trusts, inheritance and the
allocation of client funds.
“Wealth management companies” encompass private banks, wealth managers and family offices.
A “family office” is defined as a wealth management company that focuses on a single or small group
of selected HNW clients.
“Assets under Management” or “AuM” refers to the market value of all the funds being managed by
a wealth management company on behalf of its clients.
“Collectables” include any luxury item that holds its value reasonably well over time (examples: art,
classic cars).
1.3 Sources
Sources include:
The New World Wealth HNWI database, which includes detailed profiles on over 10,000 African
HNWIs.
Regular interviews with intermediaries (wealth managers, financial advisors, property agents and art &
classic car dealers).
Property registers and property sales statistics in each country.
Income distribution stats in each country.
Stock market statistics in each country.
Tracking of HNWI movements in the media.
Interviews with over 800 global HNWIs a year (mainly used for ratings and surveys).

AfrAsia Bank Africa Wealth Report 2017
© New World Wealth Page 6
2 Country statistics
2.1 Benchmarking Africa’s Wealth in Context
2.1.1 World statistics
At the end of 2016:
Worldwide wealth held by individuals amounted to approximately US$192 trillion.
The average individual had net assets of US$27,000 (wealth per capita).
There were 13.6 million HNWIs in the world and worldwide HNWI wealth stood at US$69 trillion.
There were 522,000 multi-millionaires in the world.
2.1.2 Africa statistics
At the end of 2016:
The average African individual had net assets of approximately US$2,000 (wealth per capita).
Total individual wealth held on the continent amounted to US$2.2 trillion.
There were approximately 145,000 HNWIs living in Africa, with combined wealth holdings of
approximately US$800 billion.
There were 7,010 multi-millionaires living in Africa.
Growth rate trends:
African HNWI numbers have increased by 19% during the review period (2006-2016).
2016 was a bad year for African HNWIs. Their numbers decreased by 2% during the year.
HNWI numbers in Africa are expected to rise by 36% over next 10 years, reaching approximately
198,000 by 2026.

AfrAsia Bank Africa Wealth Report 2017
© New World Wealth Page 7
The following table summarizes how major HNWI asset classes have performed over the review period in US
dollar terms.
As is evident, the South African stock market (which is the largest stock exchange in Africa) performed
moderately over this period (in US$ terms).
Figure 1: Africa: Asset Price Performance (US$ terms), 2006–2016
Source: EIU, The Economist
-12,8%
4,2%
26,9%
94,8%
-100,0% -50,0% 0,0% 50,0% 100,0% 150,0%
Oil
South African Stock Market
MSCI World Index
Gold
US dollar indices

AfrAsia Bank Africa Wealth Report 2017
© New World Wealth Page 8
2.2 Wealth per capita rankings
The following table ranks major African countries by average wealth per person (wealth per capita). As
reflected, Mauritians are the wealthiest individuals in Africa with an average wealth of US$25,700 per person,
whilst people in living in Zimbabwe are the poorest with US$200 per person. Interestingly, North African
countries such as Algeria, Egypt and Morocco all rank high on the list despite recent instability.
Note: “wealth per capita” refers to the average wealth of a person living in each country. It excludes
government held wealth.
It should be noted that all these figures are below the global average of US$27,000. Top ranked worldwide
countries such as Switzerland and Australia have wealth per capita’s of over US$200,000.
Table 2: Africa: Wealth per capita rankings, 2015 - 2016
Ranked by wealth Wealth per capita, 2015 (US$) Wealth per capita, 2016 (US$)
Mauritius 21 400 25 700
South Africa 10 800 11 300
Namibia 10 200 10 800
Botswana 6 300 6 700
Egypt, Arab Rep. 4 000 3 700
Angola 3 800 3 600
Algeria 3 500 3 300
Morocco 3 500 3 300
Kenya 2 000 2 200
Ghana 2 000 2 200
Cote d'Ivoire 1 700 1 900
Nigeria 2 000 1 600
Tanzania 1 100 1 200
Zambia 1 200 1 200
Uganda 900 1 000
Mozambique 800 800
Ethiopia 500 600
Congo, Dem. Rep. 400 400
Zimbabwe 200 200
Note: Numbers rounded to nearest 100.
Source: New World Wealth
AfrAsia Bank Africa Wealth Report 2017
© New World Wealth Page 9
Notably, back in 2000, Zimbabwe was one of the wealthiest countries in Sub Saharan Africa on a wealth per
capita basis, ranked ahead of the likes of Nigeria, Kenya, Angola, Zambia and Ghana. However, now it is
ranked well behind these countries.
Contributing factors to Zimbabwe’s poor performance since 2000 include:
The erosion of ownership rights in the country. Ownership rights are key to facilitating wealth creation.
In Zimbabwe, business owners are unsure as to whether their businesses or property will still belong
to them a year down the line, which creates a situation where no one will take the chance of investing
in the country.
Ongoing political intimidation and the alleged fixing of elections in 2002, 2005, 2008 and 2013.
The banning of the independent media in the early 2000’s, which has created a situation where it is
impossible for investors to tell what is happening there. Foreign journalists are also not allowed inside
Zimbabwe. The only TV footage that comes out of Zimbabwe comes from state-owned TV stations.
Around 20% of Zimbabweans have fled the country since 2000, taking their remaining wealth with
them. This has also led to a brain drain.
Interesting note: GDP per capita vs. wealth per capita measures
Reasons why wealth per capita is a better measure of financial health than GDP per capita:
GDP counts items multiple times (for instance, if someone is paid $100 for a product/service and
they then pay someone else that $100 for another product/service, then that adds $200 to a country’s
GDP even though only $100 has been produced at the start). This is why some analysts prefer using
export figures or GDP generated from primary sectors as a measure of financial health.
GDP ignores the efficiency of the local banking sector and the local stock market at retaining wealth
in a country.
GDP disregards income levels in a country.
In certain countries, a large portion of GDP flows to the government and therefore has little impact
on private wealth creation (example: Zimbabwe, Bahrain).
Wealth statistics, on the other hand, take all of these factors into account, which makes ‘per capita wealth’ a
far better measure of the financial health of an economy than ‘per capita GDP’.
AfrAsia Bank Africa Wealth Report 2017
© New World Wealth Page 10
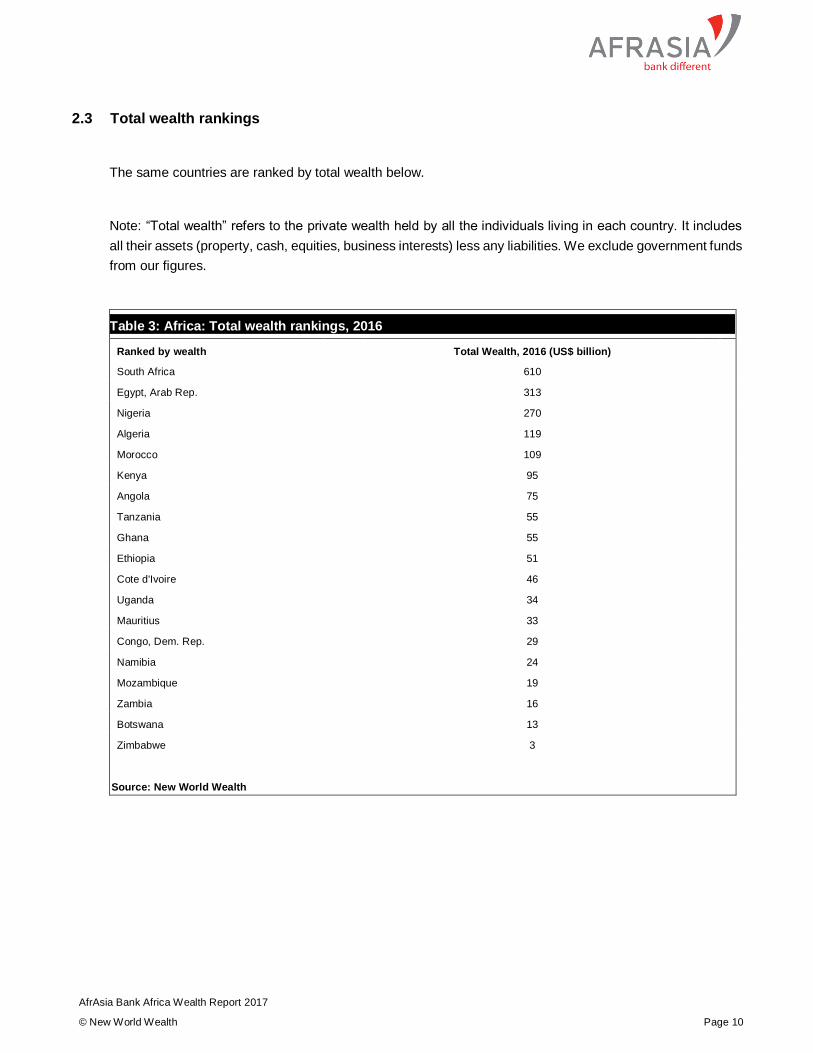
2.3 Total wealth rankings
The same countries are ranked by total wealth below.
Note: “Total wealth” refers to the private wealth held by all the individuals living in each country. It includes
all their assets (property, cash, equities, business interests) less any liabilities. We exclude government funds
from our figures.
Table 3: Africa: Total wealth rankings, 2016
Ranked by wealth Total Wealth, 2016 (US$ billion)
South Africa 610
Egypt, Arab Rep. 313
Nigeria 270
Algeria 119
Morocco 109
Kenya 95
Angola 75
Tanzania 55
Ghana 55
Ethiopia 51
Cote d'Ivoire 46
Uganda 34
Mauritius 33
Congo, Dem. Rep. 29
Namibia 24
Mozambique 19
Zambia 16
Botswana 13
Zimbabwe 3
Source: New World Wealth

AfrAsia Bank Africa Wealth Report 2017
© New World Wealth Page 11
2.4 HNWI rankings
The following table ranks major African countries by number of HNWIs (millionaires). As reflected, South
Africa is home to the most HNWIs on the continent. Despite recent turmoil, Egypt ranks second on the list.
Table 4: Africa: HNWIs by country, 2016
Ranked by HNWIs Number of HNWIs, 2016 Number of multi-millionaires, 2016
South Africa 40 400 2 130
Egypt, Arab Rep. 18 100 950
Nigeria 12 300 620
Kenya 9 400 370
Angola 6 100 320
Morocco 4 600 210
Algeria 4 500 180
Mauritius 3 800 170
Namibia 3 300 120
Ethiopia 3 100 150
Ghana 2 900 120
Botswana 2 800 100
Cote d'Ivoire 2 500 100
Tanzania 2 400 90
Uganda 1 400 60
Mozambique 1 100 50
Zambia 1 000 40
Rwanda 600 30
Congo, Dem. Rep. 600 30
Note: Rounded to nearest 100 and nearest 10 respectively.
Source: New World Wealth
AfrAsia Bank Africa Wealth Report 2017
© New World Wealth Page 12
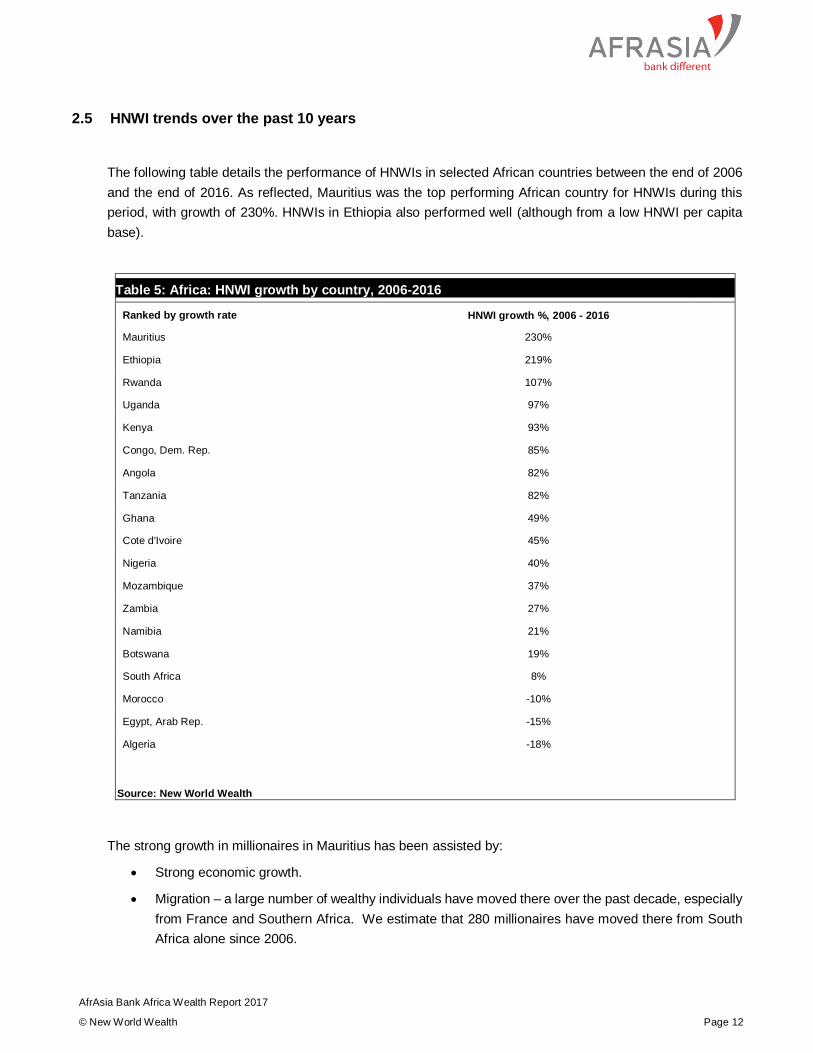
2.5 HNWI trends over the past 10 years
The following table details the performance of HNWIs in selected African countries between the end of 2006
and the end of 2016. As reflected, Mauritius was the top performing African country for HNWIs during this
period, with growth of 230%. HNWIs in Ethiopia also performed well (although from a low HNWI per capita
base).
Table 5: Africa: HNWI growth by country, 2006-2016
Ranked by growth rate HNWI growth %, 2006 - 2016
Mauritius 230%
Ethiopia 219%
Rwanda 107%
Uganda 97%
Kenya 93%
Congo, Dem. Rep. 85%
Angola 82%
Tanzania 82%
Ghana 49%
Cote d'Ivoire 45%
Nigeria 40%
Mozambique 37%
Zambia 27%
Namibia 21%
Botswana 19%
South Africa 8%
Morocco -10%
Egypt, Arab Rep. -15%
Algeria -18%
Source: New World Wealth
The strong growth in millionaires in Mauritius has been assisted by:
Strong economic growth.
Migration – a large number of wealthy individuals have moved there over the past decade, especially
from France and Southern Africa. We estimate that 280 millionaires have moved there from South
Africa alone since 2006.
AfrAsia Bank Africa Wealth Report 2017
© New World Wealth Page 13
A thriving and growing financial services sector, particularly in offshore banking, fund management
and private banking.
Automatic permanent residency if one buys a US$500,000+ home in the country. This encourages
wealthy people to move there.
Secure ownership rights. This is the most critical component of successful wealth creation globally.
Ownership rights are very strong in Mauritius, which encourages locals and foreigners to invest in
property and businesses in the country. Neighboring Zimbabwe offers a case in point as to what
happens when ownership rights are stripped – once assets are taken away they tend to lose value
as no one is willing to buy anything.
Low taxes which encourage business formation and appeal to retirees. Company and personal
income tax rates are only 15%, with no inheritance or capital gains tax.
Low level of government regulation in the business sector (when compared to nearby countries such
as South Africa which has exchange controls, high taxes, big trade unions and BEE hiring
requirements).
Lifestyle - beaches, weather, golf courses and scenery.
Low crime rate.
Ease of doing business in the country (Mauritius ranked 1st in Africa in the World Bank’s 2016 Doing
Business Report).
Low jobless rate and low inflation rate.
It has a well-developed banking system and stock exchange. This encourages people to invest their
money within the country and grow their wealth locally. It also ensures that any economic growth
filters through to wealth creation.
Individuals living in Mauritius are free to invest overseas (with no exchange controls) – this
encourages wealthy people to use the country as a business and investment hub.
It has a well-developed free media. This prevents government from getting away with wrong doing.
It is a convenient base for investing and doing business in Southern and East Africa.
Safety – Mauritius was recently rated by New World Wealth as the safest country in Africa.
Some additional factors that are encouraging wealthy people to move to the island include:
Good schools such as Northfields and International Preparatory School (IPS).
Access to first class food & produce – prime shopping centers, food lovers market.
AfrAsia Bank Africa Wealth Report 2017
© New World Wealth Page 14
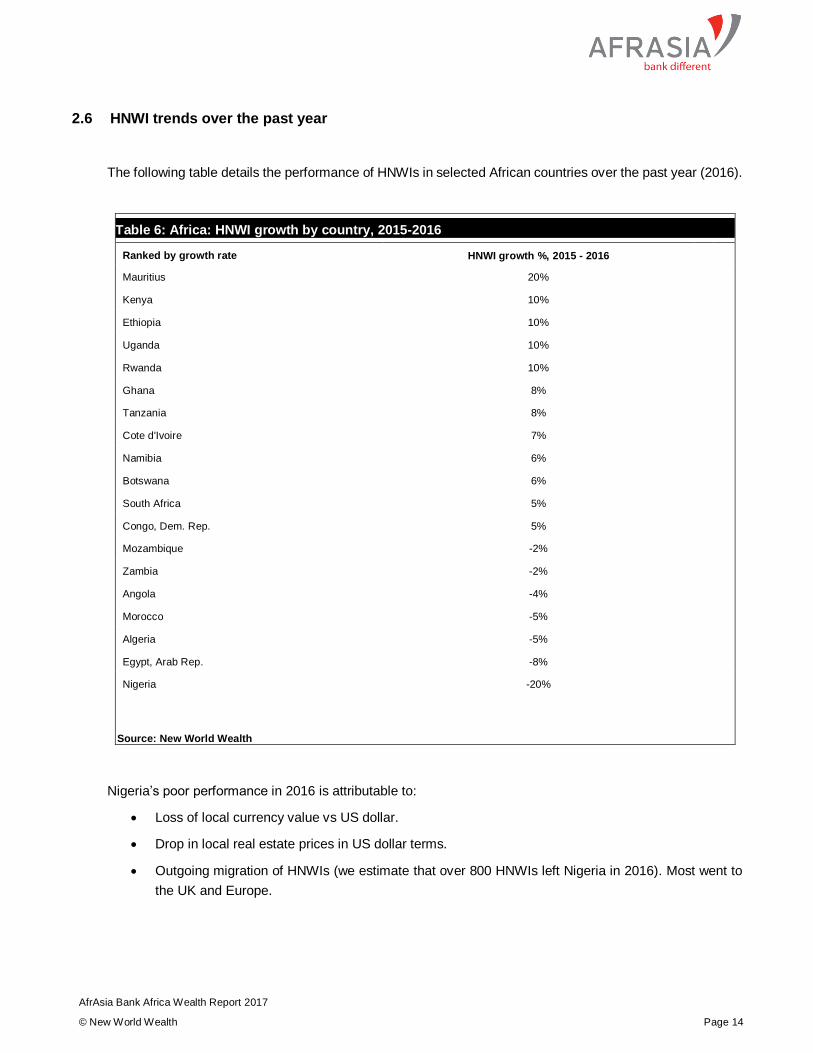
2.6 HNWI trends over the past year
The following table details the performance of HNWIs in selected African countries over the past year (2016).
Table 6: Africa: HNWI growth by country, 2015-2016
Ranked by growth rate HNWI growth %, 2015 - 2016
Mauritius 20%
Kenya 10%
Ethiopia 10%
Uganda 10%
Rwanda 10%
Ghana 8%
Tanzania 8%
Cote d'Ivoire 7%
Namibia 6%
Botswana 6%
South Africa 5%
Congo, Dem. Rep. 5%
Mozambique -2%
Zambia -2%
Angola -4%
Morocco -5%
Algeria -5%
Egypt, Arab Rep. -8%
Nigeria -20%
Source: New World Wealth
Nigeria’s poor performance in 2016 is attributable to:
Loss of local currency value vs US dollar.
Drop in local real estate prices in US dollar terms.
Outgoing migration of HNWIs (we estimate that over 800 HNWIs left Nigeria in 2016). Most went to
the UK and Europe.
AfrAsia Bank Africa Wealth Report 2017
© New World Wealth Page 15
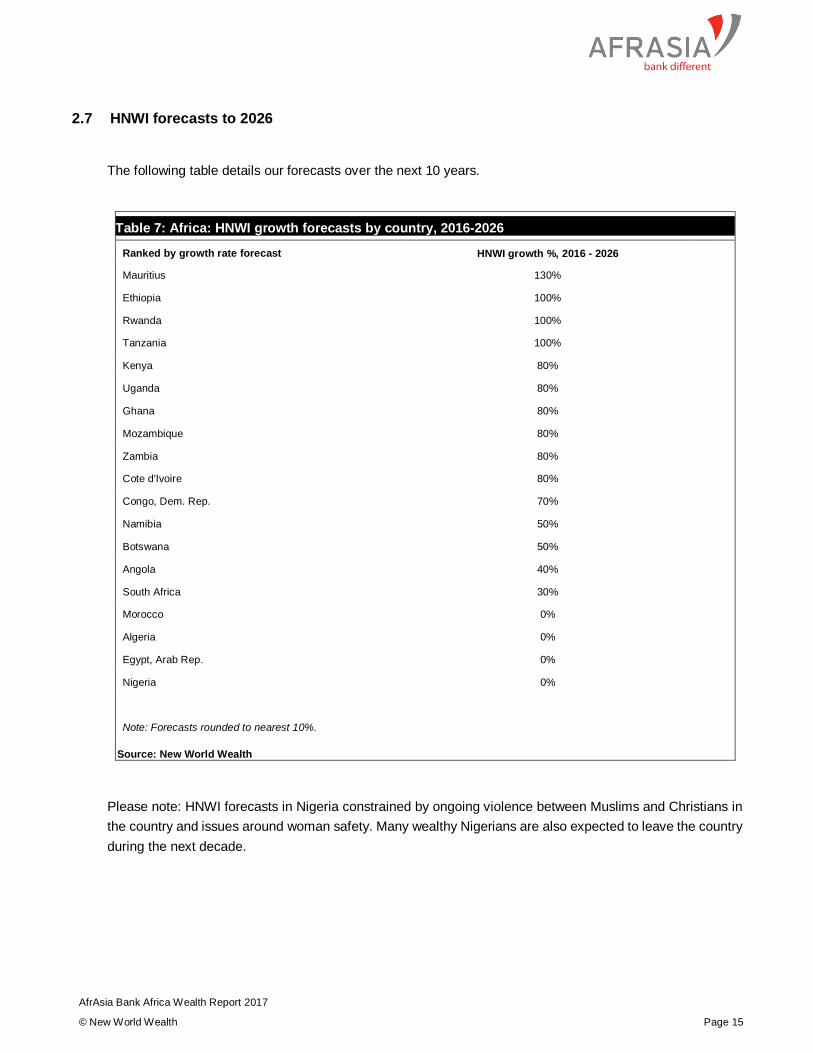
2.7 HNWI forecasts to 2026
The following table details our forecasts over the next 10 years.
Table 7: Africa: HNWI growth forecasts by country, 2016-2026
Ranked by growth rate forecast HNWI growth %, 2016 - 2026
Mauritius 130%
Ethiopia 100%
Rwanda 100%
Tanzania 100%
Kenya 80%
Uganda 80%
Ghana 80%
Mozambique 80%
Zambia 80%
Cote d'Ivoire 80%
Congo, Dem. Rep. 70%
Namibia 50%
Botswana 50%
Angola 40%
South Africa 30%
Morocco 0%
Algeria 0%
Egypt, Arab Rep. 0%
Nigeria 0%
Note: Forecasts rounded to nearest 10%.
Source: New World Wealth
Please note: HNWI forecasts in Nigeria constrained by ongoing violence between Muslims and Christians in
the country and issues around woman safety. Many wealthy Nigerians are also expected to leave the country
during the next decade.
AfrAsia Bank Africa Wealth Report 2017
© New World Wealth Page 16
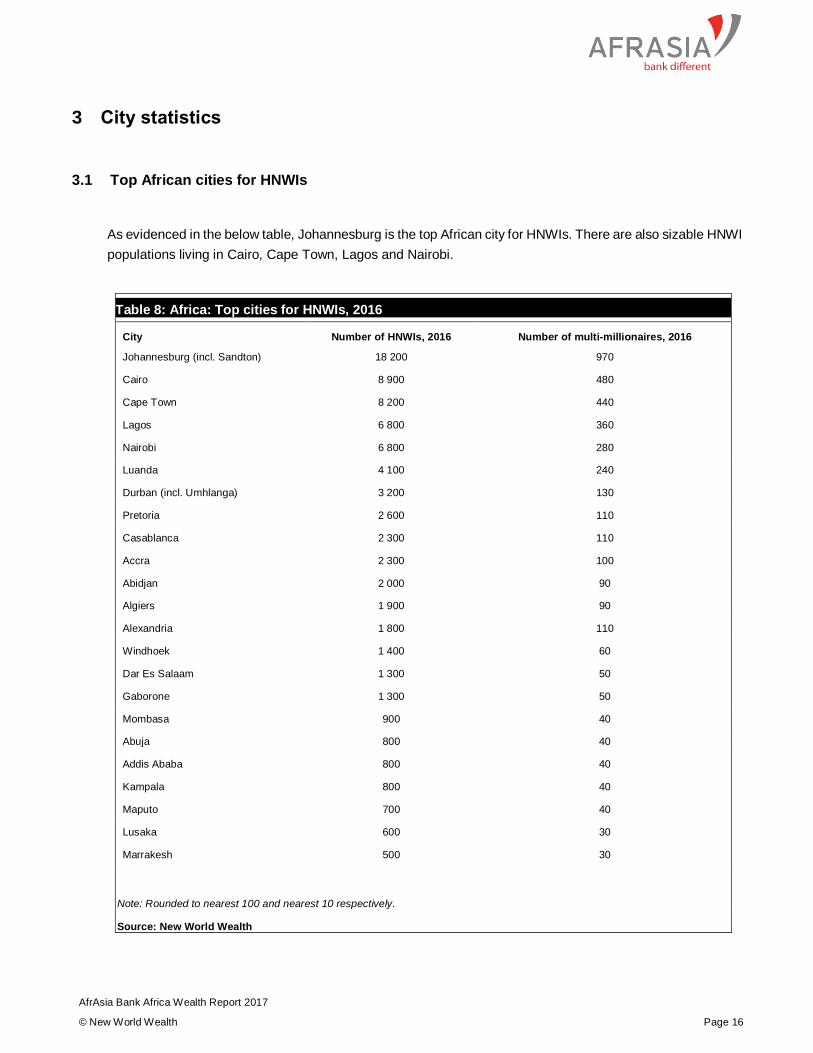
3 City statistics
3.1 Top African cities for HNWIs
As evidenced in the below table, Johannesburg is the top African city for HNWIs. There are also sizable HNWI
populations living in Cairo, Cape Town, Lagos and Nairobi.
Table 8: Africa: Top cities for HNWIs, 2016
City Number of HNWIs, 2016 Number of multi-millionaires, 2016
Johannesburg (incl. Sandton) 18 200 970
Cairo 8 900 480
Cape Town 8 200 440
Lagos 6 800 360
Nairobi 6 800 280
Luanda 4 100 240
Durban (incl. Umhlanga) 3 200 130
Pretoria 2 600 110
Casablanca 2 300 110
Accra 2 300 100
Abidjan 2 000 90
Algiers 1 900 90
Alexandria 1 800 110
Windhoek 1 400 60
Dar Es Salaam 1 300 50
Gaborone 1 300 50
Mombasa 900 40
Abuja 800 40
Addis Ababa 800 40
Kampala 800 40
Maputo 700 40
Lusaka 600 30
Marrakesh 500 30
Note: Rounded to nearest 100 and nearest 10 respectively.
Source: New World Wealth

AfrAsia Bank Africa Wealth Report 2017
© New World Wealth Page 17
3.2 HNWI city trends over the past year
The following table details the performance of HNWIs in major African cities over the past year (2016). As
reflected, Nairobi in Kenya was the top performing African city for HNWIs during the year.
Table 9: Africa: HNWI growth rates by city, 2015-2016
City HNWI growth %, 2015 - 2016
Nairobi 11%
Addis Ababa 10%
Kampala 10%
Dar Es Salaam 8%
Accra 8%
Mombasa 8%
Abidjan 7%
Windhoek 6%
Gaborone 6%
Cape Town 6%
Durban 6%
Johannesburg 5%
Pretoria 5%
Marrakesh -1%
Maputo -2%
Lusaka -2%
Luanda -4%
Casablanca -5%
Algiers -5%
Cairo -8%
Alexandria -9%
Abuja -17%
Lagos -20%
Source: New World Wealth

AfrAsia Bank Africa Wealth Report 2017
© New World Wealth Page 18
3.3 HNWI city forecasts to 2026
Addis Ababa, Dar Es Salaam, Nairobi and Kampala are all expected to grow strongly going forward. On the
other hand, cities in Nigeria and North Africa are expected to struggle.
Table 10: Africa: HNWI growth rate forecasts by city, 2016-2026
City HNWI growth %, 2016 - 2026
Addis Ababa 110%
Dar Es Salaam 100%
Nairobi 90%
Kampala 90%
Accra 80%
Maputo 80%
Lusaka 80%
Abidjan 80%
Mombasa 70%
Windhoek 50%
Gaborone 50%
Luanda 40%
Cape Town 30%
Durban 30%
Johannesburg 30%
Pretoria 30%
Marrakesh 10%
Abuja 10%
Casablanca 0%
Algiers 0%
Cairo 0%
Alexandria 0%
Lagos 0%
Note: Forecasts rounded to nearest 10%.
Source: New World Wealth
AfrAsia Bank Africa Wealth Report 2017
© New World Wealth Page 19
3.4 Spotlight on South African cities
South Africa dominates the Africa city wealth list, with four cities featuring in the top 10.
Top cities:
Johannesburg: Total wealth held in the city amounts to US$245 billion. Home to 18,200 millionaires
and 2 billionaires. Our figures for Johannesburg include Sandton. Major sectors in the city include:
financial services (banks, accountancies, insurance), professional services (law firms), construction,
telecoms and basic materials.
Cape Town: Total wealth held in the city amounts to US$135 billion. Home to 8,200 millionaires and
2 billionaires. Major sectors in the city include: real estate, financial services (fund management),
retail and tourism.
Durban: Total wealth held in the city amounts to US$46 billion. Home to 3,200 millionaires and 1
billionaire. Our figures for Durban include Umhlanga, Ballito, Zimbali and La Lucia. Major sectors in
the city include: real estate, finance, healthcare, construction, retail and transport.
Pretoria: Total wealth held in the city amounts to US$42 billion. Home to 2,600 millionaires. Major
sectors in the city include: basic materials, manufacturing and financial services.
There are also a number of emerging areas in South Africa. They include:
Paarl, Franschoek and Stellenbosch: Total wealth held in the area amounts to US$44 billion.
Home to 3,000 millionaires. Fastest growing region in the country (in terms of private wealth creation
over the past decade).
The Garden Route: Stretches from Mossell Bay to Storms River on the South Coast of South Africa.
Notable towns on the route include: George, Knysna, Plettenberg Bay and Wilderness. Total wealth
held in the area amounts to US$38 billion. Home to 2,900 millionaires. A large number of wealthy
retirees live on the Garden Route. It is also a 2nd home hotspot for the wealthy and there are a number
of exclusive golf & lifestyle estates in the area.
Affluent suburbs/towns in SA include:
Johannesburg: Sandhurst, Hyde Park, Bryanston, Houghton, Westcliff, Parktown, Saxonwold and
Atholl.
Cape Town: Camps Bay, Bishopscourt, Constantia, Clifton, Bantry Bay, Fresnaye, St James and
Llandudno.
Exclusive estates: Zimbali, Fancourt, Pearl Valley, Val die Vie, Pezula (golf and pvt), Whalerock
Ridge, Steenberg, Erinvale, De Zalze, Simola, Blair Atholl, Silverhurst, Dainfern, Waterfall
Equestrian, Steyn City and Arabella.
AfrAsia Bank Africa Wealth Report 2017
© New World Wealth Page 20
4 Spending habits of African HNWIs
4.1 Behavioral mapping
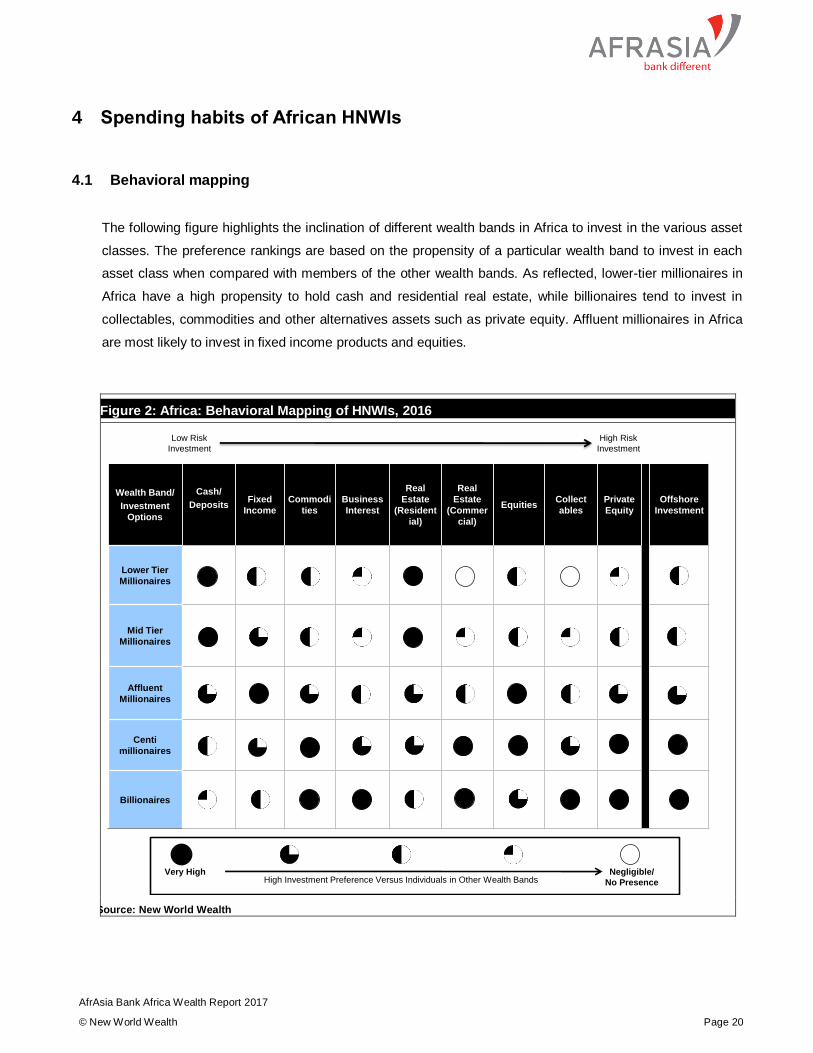
The following figure highlights the inclination of different wealth bands in Africa to invest in the various asset
classes. The preference rankings are based on the propensity of a particular wealth band to invest in each
asset class when compared with members of the other wealth bands. As reflected, lower-tier millionaires in
Africa have a high propensity to hold cash and residential real estate, while billionaires tend to invest in
collectables, commodities and other alternatives assets such as private equity. Affluent millionaires in Africa
are most likely to invest in fixed income products and equities.
Figure 2: Africa: Behavioral Mapping of HNWIs, 2016
Source: New World Wealth
Wealth Band/
Investment
Options
Cash/
DepositsFixed
Income
Commodi
ties
Business
Interest
Real
Estate
(Resident
ial)
Real
Estate
(Commer
cial)
EquitiesCollect
ables
Private
Equity
Offshore
Investment
Lower Tier
Millionaires
Mid Tier
Millionaires
Affluent
Millionaires
Centi
millionaires
Billionaires
Low Risk
Investment
High Risk
Investment
Very High Negligible/
No PresenceHigh Investment Preference Versus Individuals in Other Wealth Bands
AfrAsia Bank Africa Wealth Report 2017
© New World Wealth Page 21
4.2 Collectables
Collectables, especially art, wine and classic automobiles are an increasingly popular way for African HNWIs
to store their wealth. Collectables accounted for 1.1% or US$8.8 billion of the assets of African HNWIs in
2016, compared to only 0.6% in 2006.
Art in Africa
New World Wealth estimates that African HNWIs held US$870 million worth of fine art at the end of 2016.
Globally, fine art prices have risen by 3% over the past 10 years, whilst African fine art prices have risen by
22% (source: NW-Wealth US$ collectables index).
South Africa is the largest fine art market in Africa. Leading artists in SA include Irma Stern, Thomas Baines,
JH Pierneef, Alexis Preller, Pieter Wenning, Gerard Sekoto, Maggie Laubser, Hugo Naude, Portchie, Isabel
le Roux and Dimitrov. The value of these artists has risen appreciably – an Irma Stern painting that sold for
US$20,000 in 1995 fetched over US$2 million in 2011. The majority of major art galleries are located in
Johannesburg and Cape Town and in second-home hotspots such as Stellenbosch. Major dealers include
Stephan Welz and Strauss & Co.
Nigeria, Egypt, Kenya and Morocco also have significant fine art markets.
Fine wine
Prior to the review period, the global fine wine market recorded tremendous growth, with prices paid for certain
vintages of Lafite Rothschild having increased more than tenfold in the 10 years from 1996 to 2006. Heavy
buying by the Chinese in the Hong Kong market was the main driver of this growth. As a result of this boom,
portfolio managers that specialized solely in fine wine investments began to crop up and offer unique wine-
denominated investments.
During the review period, global fine wine price continued to rise (although not at the same rate) - they rose
by 72% during the 2006 to 2016 period. 2016 was a particularly good year, with prices rising by over 20%.
Wheels
Over the review period, classic car prices rose by a strong 180%, making it the best performing investment
class for HNWIs over this period.

AfrAsia Bank Africa Wealth Report 2017
© New World Wealth Page 22
However, it should be noted that the global classic car market is showing signs of slowing down. The most
recent Pebble Beach Concours d’Elegance auction held in August 2016 recorded sales of US$340 million,
down from US$396 million the year before.
Popular classic cars for African HNWIs are listed below.
Table 11: Africa: Popular classic cars for HNWIs, 2016
Ranked by price Years produced Price US$*
Ferrari 250 GTO 1960s 24 000 000
Ferrari 250 GT California Spider 1960s 20 000 000
Ferrari 250 Testa Rossa 1950s 18 000 000
Bugatti Type 41 Royale 1930s 16 000 000
McLaren F1 1990s 8 000 000
Porsche 550 Spyder 1950s 2 000 000
Mercedes Gullwing 300sl 1950s 1 700 000
Porsche 959 1980s 1 500 000
Aston Martin DB4 1950s 1 300 000
Aston Martin DB5 1960s 1 000 000
Lamborghini Miura 1970s 800 000
Lamborghini Countach 1980s 500 000
Jaguar E Type 1960s 300 000
Ferrari Dino 1970s 250 000
Porsche 911 1960s 120 000
Morgan Roadster 1960s 100 000
*US$ price if car in good and working condition.
Source: New World Wealth
Other collectables
Collectables also include antiques, stamps and super-luxury watches (i.e. any luxury item that holds its value
reasonably well over time). It should be noted that collectables do not include: yachts, private jets and new
cars as these items are unlikely to hold their value.
AfrAsia Bank Africa Wealth Report 2017
© New World Wealth Page 23
Super luxury watches
Super-luxury watches is a particularly fast growing collectable segment in Africa. According to our estimates,
U$$46 million was generated in African sales of these watches in 2016, up from U$$13 million in 2006.
Note: we only consider hand-made (non-battery operated) watches with a base price of over US$10,000 per
watch as ‘super-luxury’.
Major players in this space include: Patek Philippe, Frank Muller, Breguet, Vacheron Constantin, Ulysse
Nardin, Blancpain, Audemars Piguet, A Lange & Sohne and Richard Mille.
There are a number of possible reasons for the rapid growth in this segment in Africa over the past few years,
including:
Local stores did not used to stock these watches prior to 2010.
Watch collecting has become a prominent pastime for many HNWIs in Africa and worldwide.
Watches can be bought with cash without arousing suspicion, as a pose to cars, yachts and property
purchases which may have tax implications.
Top-end watches hold their value reasonably well over time, much like art or classic cars.
Portability. For instance, a wealthy Nigerian can buy a watch in the UK and easily transport it back
to Nigeria. This would not be the case for a car.
AfrAsia Bank Africa Wealth Report 2017
© New World Wealth Page 24
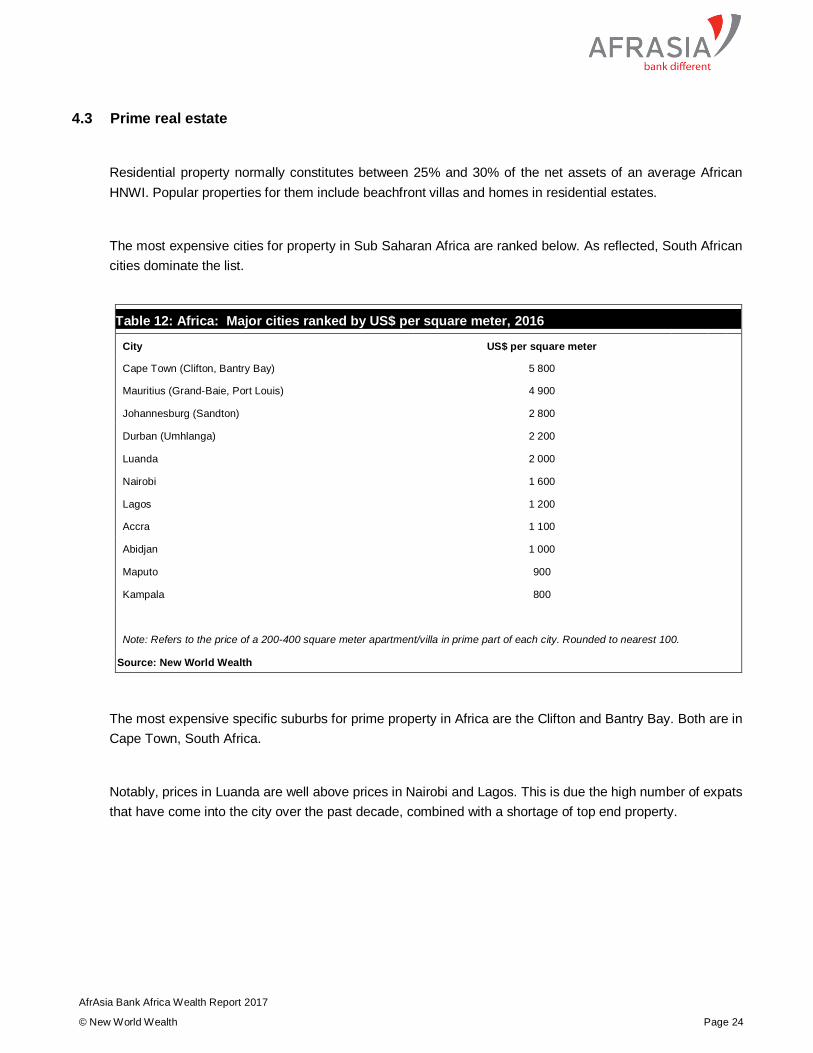
4.3 Prime real estate
Residential property normally constitutes between 25% and 30% of the net assets of an average African
HNWI. Popular properties for them include beachfront villas and homes in residential estates.
The most expensive cities for property in Sub Saharan Africa are ranked below. As reflected, South African
cities dominate the list.
Table 12: Africa: Major cities ranked by US$ per square meter, 2016
City US$ per square meter
Cape Town (Clifton, Bantry Bay) 5 800
Mauritius (Grand-Baie, Port Louis) 4 900
Johannesburg (Sandton) 2 800
Durban (Umhlanga) 2 200
Luanda 2 000
Nairobi 1 600
Lagos 1 200
Accra 1 100
Abidjan 1 000
Maputo 900
Kampala 800
Note: Refers to the price of a 200-400 square meter apartment/villa in prime part of each city. Rounded to nearest 100.
Source: New World Wealth
The most expensive specific suburbs for prime property in Africa are the Clifton and Bantry Bay. Both are in
Cape Town, South Africa.
Notably, prices in Luanda are well above prices in Nairobi and Lagos. This is due the high number of expats
that have come into the city over the past decade, combined with a shortage of top end property.

AfrAsia Bank Africa Wealth Report 2017
© New World Wealth Page 25
4.4 Second homes abroad
Our research shows that 34% of African HNWIs owned second homes in other countries at the end of 2016.
Popular cities for such homes are listed below, ranked by price per square meter.
Table 13: World: Top second homes hotspots for African HNWIs (outside of Africa), 2016
City (ranked by price per square meter) US$ per square meter
London 41 500
New York 33 000
Geneva 29 500
Sydney 20 800
Paris 19 300
Melbourne 15 000
Tel Aviv 9 800
Dubai 8 200
Note: Prices refer to 200 square meter apartment in prime part of each city. Rounded to nearest 100.
Source: New World Wealth
Findings:
London, New York, Sydney, Melbourne and Tel Aviv second homes are popular for South African
HNWIs.
London, Geneva and Paris second homes are popular among Nigerian HNWIs.
Dubai is an especially popular second home destination for Egyptian, Nigerian, Algerian and
Moroccan HNWIs.
A large number of African HNWIs also buy homes in other African countries, most notably South Africa. The
following table gives an indication of the origin of foreign buyers (of R10 million homes) in South Africa in
2006 and 2016 with projections for 2026. As reflected, African citizens made up the largest share of the
foreign market in 2016 and their share was up significantly from 2006.
The bulk of African HNWIs buying in SA come from Angola, Ghana and Nigeria.

AfrAsia Bank Africa Wealth Report 2017
© New World Wealth Page 26
Table 14: South Africa: Foreign investment in SA top-end real estate, 2006–2026
Origin 2006 2016 2026
UK 35% 22% 9%
Germany 27% 16% 8%
Rest of Africa 7% 28% 60%
Other* 31% 35% 23%
Total 100% 100% 100%
Note: only includes properties sold for over R10 million to foreigners.
*other buyers mainly from Switzerland, France, China, India, Russia, Israel and UAE.
Source: New World Wealth
Wealthy Africans buying in SA are particularly interested in the Sandton area (Sandhurst, Hyde Park,
Houghton), central Cape Town (Greenpoint, City Bowl) and the “big 5” Atlantic seaboard luxury hotspots in
Cape Town (namely Fresnaye, Bantry Bay, Llandudno, Clifton and Camps Bay). Things that may be
attracting them to SA include:
Good private healthcare system.
Top class private schools for their children.
Over 50 luxury residential estates.
Nature, weather and scenery.
Exclusive shopping centers (examples: Sandton City, Gateway, Montecasino, V&A and Hyde Park).
English speaking country.
There is very little religious violence (when compared to countries like Nigeria).
Good transport infrastructure.
Fully developed luxury market, where most of the major luxury brands are available.
Large number of luxury holiday destinations within country (examples: Cape Town, Sabi Sands,
Plettenberg Bay and Umhlanga).
High-end food stores such as Woolworths, which appeal to wealthy consumers.

AfrAsia Bank Africa Wealth Report 2017
© New World Wealth Page 27
4.5 Largest luxury markets
We estimate that the African luxury sector generated approximately US$5.9 billion in revenue in 2016. The
main components of this were: luxury cars, yachts, private jets, personal luxury goods (which includes
watches, clothing, accessories and jewelry) and luxury hotels & lodges.
Breakdown of luxury sales by country below. As reflected, South Africa, Nigeria, Egypt and Angola all
experienced drops in luxury sales in 2016, whilst luxury sales in Kenya were up.
Note: Kenya places above Nigeria mainly due to the large luxury tourism industry there.
Table 15: Africa: Largest luxury markets by revenue, 2016
Country 2015 revenue (US$ billion) 2016 revenue (US$ billion)
South Africa 2,4 2,3
Kenya 0,4 0,5
Nigeria 0,6 0,4
Angola 0,3 0,2
Egypt 0,3 0,2
Morocco 0,2 0,2
Ghana 0,2 0,2
Algeria 0,1 0,1
Other countries 1,8 1,8
Africa total 6,3 5,9
Source: New World Wealth
AfrAsia Bank Africa Wealth Report 2017
© New World Wealth Page 28
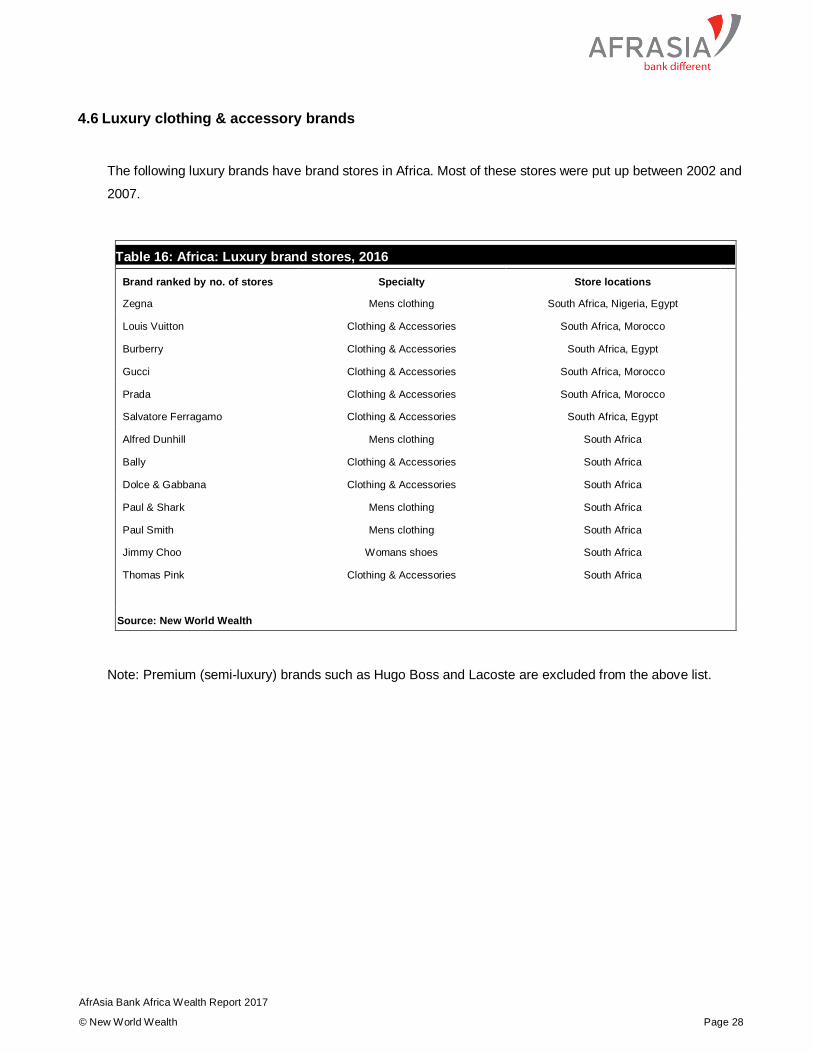
4.6 Luxury clothing & accessory brands
The following luxury brands have brand stores in Africa. Most of these stores were put up between 2002 and
2007.
Table 16: Africa: Luxury brand stores, 2016
Brand ranked by no. of stores Specialty Store locations
Zegna Mens clothing South Africa, Nigeria, Egypt
Louis Vuitton Clothing & Accessories South Africa, Morocco
Burberry Clothing & Accessories South Africa, Egypt
Gucci Clothing & Accessories South Africa, Morocco
Prada Clothing & Accessories South Africa, Morocco
Salvatore Ferragamo Clothing & Accessories South Africa, Egypt
Alfred Dunhill Mens clothing South Africa
Bally Clothing & Accessories South Africa
Dolce & Gabbana Clothing & Accessories South Africa
Paul & Shark Mens clothing South Africa
Paul Smith Mens clothing South Africa
Jimmy Choo Womans shoes South Africa
Thomas Pink Clothing & Accessories South Africa
Source: New World Wealth
Note: Premium (semi-luxury) brands such as Hugo Boss and Lacoste are excluded from the above list.

AfrAsia Bank Africa Wealth Report 2017
© New World Wealth Page 29
The following luxury brands are likely to open brand stores in Africa over the next decade.
Table 17: Africa: Upcoming luxury brand stores, 2016
Brand (alphabetical) Specialty
Canali Mens clothing
Chanel Clothing & Accessories
Christian Dior Clothing & Accessories
Christian Louboutin Womans Shoes
Hermes Clothing & Accessories
LK Bennett Womans accessories
Mulberry Clothing & Accessories
Source: New World Wealth
4.7 Luxury cars
Luxury car brands with dealerships in Africa are listed below, ranked by African revenue.
Table 18: Africa: Top selling luxury cars, 2016
Brand ranked by African revenue Dealership locations
Porsche South Africa, Kenya, Egypt, Nigeria, Angola, Mauritius
Ferrari South Africa
Bentley South Africa
Rolls Royce South Africa
Maserati South Africa
Aston Martin South Africa
Lamborghini South Africa
Mclaren South Africa Note: Excludes semi-luxury brands such as Mercedes, Jaguar and Land Rover.
Source: New World Wealth

AfrAsia Bank Africa Wealth Report 2017
© New World Wealth Page 30
Luxury SUVs are especially popular with Africa's super-rich. Reasons for their popularity include:
High road clearance. SUVs handle potholes and bad roads better than luxury sedans and sports cars.
Safety aspects.
Space for children.
Useful for holidays – off road, game reserves etc.
Popular models are listed below.
Table 19: Africa: Popular SUVs for HNWIs, 2016
Model Price US$
Porsche Cayenne Turbo 110 000
Range Rover 5.0L V8 100 000
BMW X6 70 000
Mercedes GLE Coupe 70 000
Source: New World Wealth
The following sports cars are also popular, especially in South Africa.
Table 20: Africa: Popular sports cars for HNWIs, 2016
Model Price US$
Rolls-Royce Phantom 420 000
Ferrari F12 Berlinetta 310 000
Rolls Royce Ghost 295 000
Ferrari 458 Italia 240 000
Ferrari California 205 000
Bentley Continental 200 000
Aston Martin DB9 198 000
Porsche 911 Turbo 160 000 Mercedes-Benz AMG SL 140 000
Porsche 911 Carrera 4 90 000
Source: New World Wealth

AfrAsia Bank Africa Wealth Report 2017
© New World Wealth Page 31
4.8 Luxury hotels & lodges
Africa received approximately 48,000 multi-millionaire visitors in 2016, up from 43,000 in 2015.
South Africa was the most popular African destination for the super-rich, with approximately 15,000 multi-
millionaires visiting the country during the year. Major destinations for them within South Africa included: Cape
Town, Johannesburg, the Garden Route, the Whale Coast, Umhlanga, Durban, Paarl, Franschoek,
Stellenbosch and Kruger Park (mainly around Sabi Sands).
Major destinations for them in the rest of Africa included: Marrakech in Morocco, Casablanca in Morocco,
Cairo in Egypt, Nairobi in Kenya, the Serengeti in Tanzania, Sharm El Sheikh in Egypt, the Masai Mara in
Kenya, Livingstone in Zambia and the Okavango Swamps in Botswana. Gorilla safaris in the Virunga
Mountains and the Bwindi Forest (Uganda) were also popular.
Table 21: Africa: Most visited countries by the super-rich, 2016
Country No. of multi-millionaire visitors in 2016
South Africa 15 000
Morocco 5 000
Botswana 4 000
Kenya 4 000
Mauritius 3 000
Seychelles 3 000
Tanzania 2 000
Egypt 2 000
Uganda 1 000
Zambia 1 000
Mozambique 1 000
Nigeria 1 000
Note: Figures rounded to nearest 1,000.
Source: New World Wealth
AfrAsia Bank Africa Wealth Report 2017
© New World Wealth Page 32
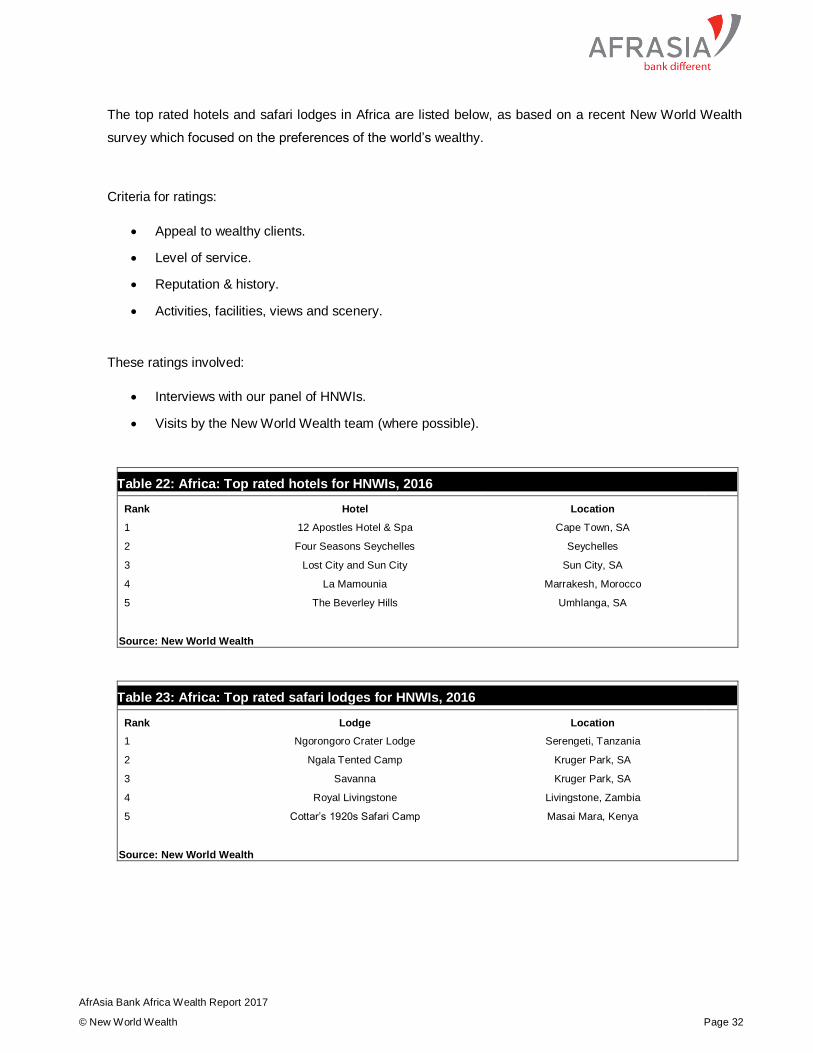
The top rated hotels and safari lodges in Africa are listed below, as based on a recent New World Wealth
survey which focused on the preferences of the world’s wealthy.
Criteria for ratings:
Appeal to wealthy clients.
Level of service.
Reputation & history.
Activities, facilities, views and scenery.
These ratings involved:
Interviews with our panel of HNWIs.
Visits by the New World Wealth team (where possible).
Table 22: Africa: Top rated hotels for HNWIs, 2016
Rank Hotel Location
1 12 Apostles Hotel & Spa Cape Town, SA
2 Four Seasons Seychelles Seychelles
3 Lost City and Sun City Sun City, SA
4 La Mamounia Marrakesh, Morocco
5 The Beverley Hills Umhlanga, SA
Source: New World Wealth
Table 23: Africa: Top rated safari lodges for HNWIs, 2016
Rank Lodge Location
1 Ngorongoro Crater Lodge Serengeti, Tanzania
2 Ngala Tented Camp Kruger Park, SA
3 Savanna Kruger Park, SA
4 Royal Livingstone Livingstone, Zambia
5 Cottar’s 1920s Safari Camp Masai Mara, Kenya
Source: New World Wealth
AfrAsia Bank Africa Wealth Report 2017
© New World Wealth Page 33
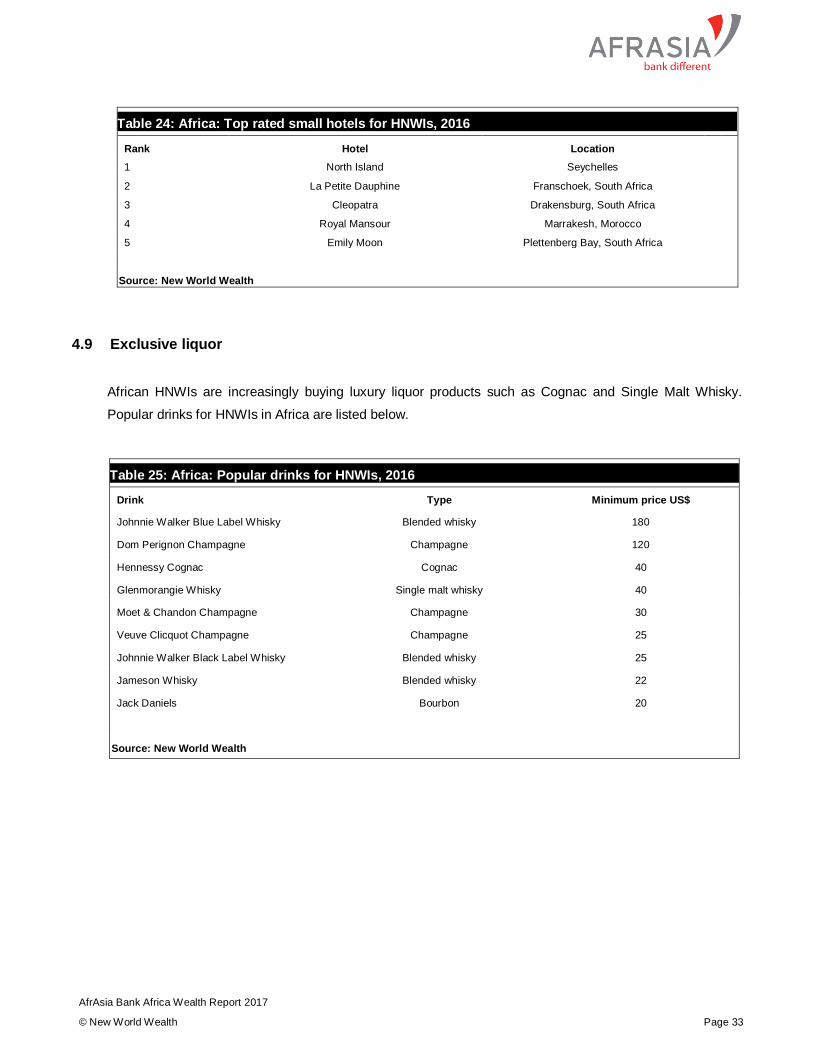
Table 24: Africa: Top rated small hotels for HNWIs, 2016
Rank Hotel Location
1 North Island Seychelles
2 La Petite Dauphine Franschoek, South Africa
3 Cleopatra Drakensburg, South Africa
4 Royal Mansour Marrakesh, Morocco
5 Emily Moon Plettenberg Bay, South Africa
Source: New World Wealth
4.9 Exclusive liquor
African HNWIs are increasingly buying luxury liquor products such as Cognac and Single Malt Whisky.
Popular drinks for HNWIs in Africa are listed below.
Table 25: Africa: Popular drinks for HNWIs, 2016
Drink Type Minimum price US$
Johnnie Walker Blue Label Whisky Blended whisky 180
Dom Perignon Champagne Champagne 120
Hennessy Cognac Cognac 40
Glenmorangie Whisky Single malt whisky 40
Moet & Chandon Champagne Champagne 30
Veuve Clicquot Champagne Champagne 25
Johnnie Walker Black Label Whisky Blended whisky 25
Jameson Whisky Blended whisky 22
Jack Daniels Bourbon 20
Source: New World Wealth
AfrAsia Bank Africa Wealth Report 2017
© New World Wealth Page 34
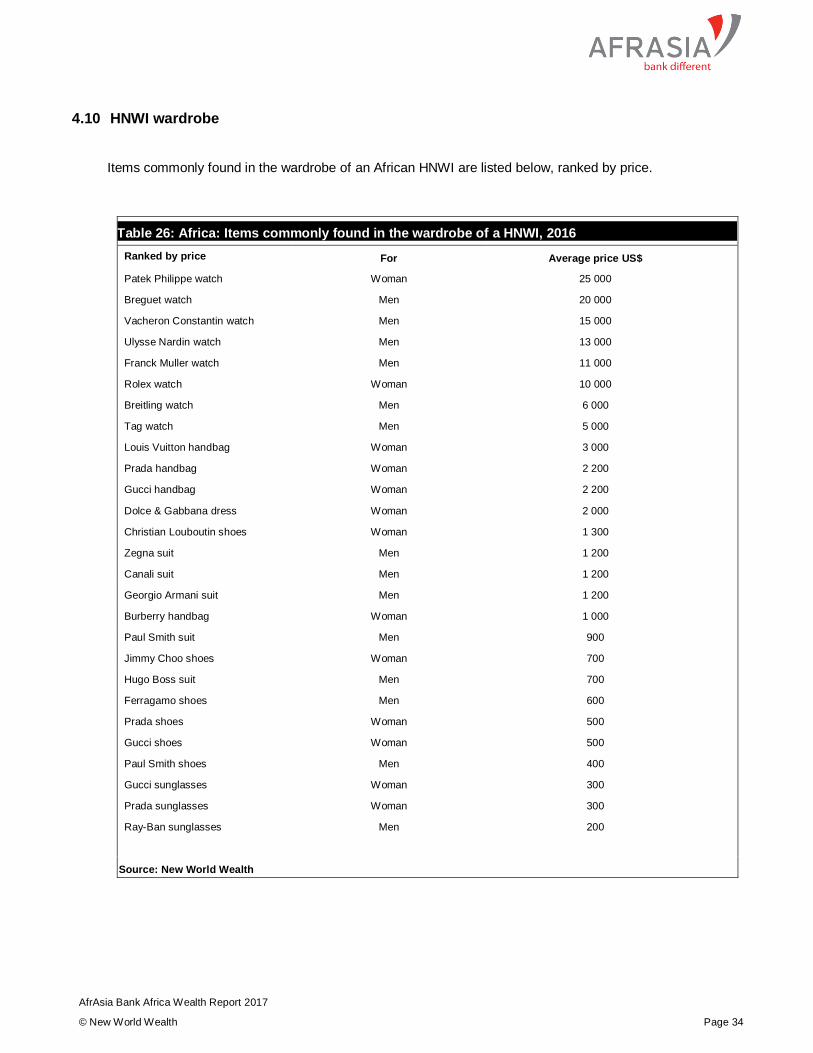
4.10 HNWI wardrobe
Items commonly found in the wardrobe of an African HNWI are listed below, ranked by price.
Table 26: Africa: Items commonly found in the wardrobe of a HNWI, 2016
Ranked by price For Average price US$
Patek Philippe watch Woman 25 000
Breguet watch Men 20 000
Vacheron Constantin watch Men 15 000
Ulysse Nardin watch Men 13 000
Franck Muller watch Men 11 000
Rolex watch Woman 10 000
Breitling watch Men 6 000
Tag watch Men 5 000
Louis Vuitton handbag Woman 3 000
Prada handbag Woman 2 200
Gucci handbag Woman 2 200
Dolce & Gabbana dress Woman 2 000
Christian Louboutin shoes Woman 1 300
Zegna suit Men 1 200
Canali suit Men 1 200
Georgio Armani suit Men 1 200
Burberry handbag Woman 1 000
Paul Smith suit Men 900
Jimmy Choo shoes Woman 700
Hugo Boss suit Men 700
Ferragamo shoes Men 600
Prada shoes Woman 500
Gucci shoes Woman 500
Paul Smith shoes Men 400
Gucci sunglasses Woman 300
Prada sunglasses Woman 300
Ray-Ban sunglasses Men 200
Source: New World Wealth

AfrAsia Bank Africa Wealth Report 2017
© New World Wealth Page 35
4.11 Private jets
The top private jet markets in Africa are listed below.
Table 27: Africa: Private jet usage by country, 2016
Country
No. of multi-millionaires that own private jets
No. of multi-millionaires that use private jets
South Africa 160 420
Nigeria 90 310
Egypt, Arab Rep. 50 140
Kenya 30 110
Note: Numbers rounded to nearest 10.
Source: New World Wealth
AfrAsia Bank Africa Wealth Report 2017
© New World Wealth Page 36
5 Wealth management in Africa
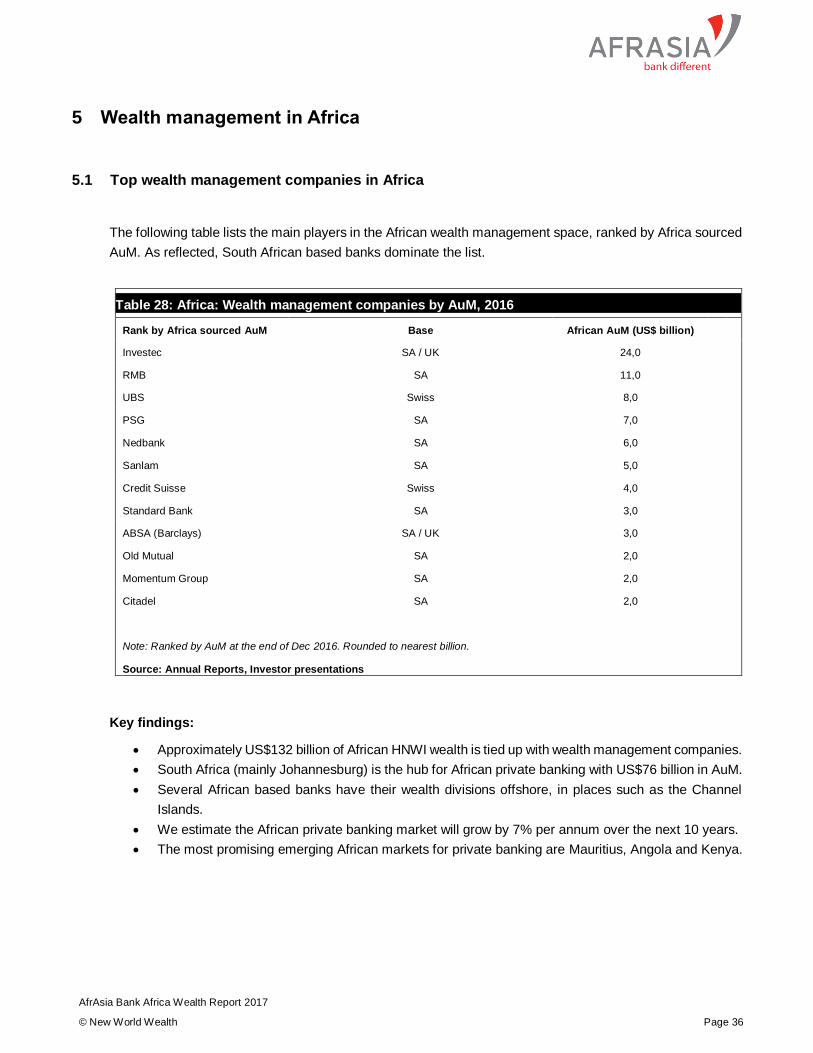
5.1 Top wealth management companies in Africa
The following table lists the main players in the African wealth management space, ranked by Africa sourced
AuM. As reflected, South African based banks dominate the list.
Table 28: Africa: Wealth management companies by AuM, 2016
Rank by Africa sourced AuM Base African AuM (US$ billion)
Investec SA / UK 24,0
RMB SA 11,0
UBS Swiss 8,0
PSG SA 7,0
Nedbank SA 6,0
Sanlam SA 5,0
Credit Suisse Swiss 4,0
Standard Bank SA 3,0
ABSA (Barclays) SA / UK 3,0
Old Mutual SA 2,0
Momentum Group SA 2,0
Citadel SA 2,0
Note: Ranked by AuM at the end of Dec 2016. Rounded to nearest billion.
Source: Annual Reports, Investor presentations
Key findings:
Approximately US$132 billion of African HNWI wealth is tied up with wealth management companies.
South Africa (mainly Johannesburg) is the hub for African private banking with US$76 billion in AuM.
Several African based banks have their wealth divisions offshore, in places such as the Channel
Islands.
We estimate the African private banking market will grow by 7% per annum over the next 10 years.
The most promising emerging African markets for private banking are Mauritius, Angola and Kenya.
AfrAsia Bank Africa Wealth Report 2017
© New World Wealth Page 37
5.2 Family offices
Family offices are a fast growing wealth management segment in Africa and throughout the world.
Family offices traditionally provide a more customized offering than wealth managers and private banks.
Services they offer include: managing household staff, property management, philanthropy coordination,
managing family education, intergenerational transfer and legal and tax services, on top of the usual
investment services.
Typically family offices are exclusively for family members and their related trusts, foundations, charities, non-
profit organizations and family-related investment vehicles.
Single-family offices (SFO)
Single-family offices generally take the form of a private company that manages the investments and trusts
of ultra-wealthy individuals (normally with net assets of more than US$100 million) and their extended family.
Typically, an SFO has a small team consisting of a lawyer, an investment specialist and an accountant.
Multi-family offices (MFO)
There are a significant number of families with between US$30 million and US$100 million in assets that do
not have the economies of scale to establish stand-alone family offices. MFOs cater to these families and
allow them to share administrative costs. Stonehage Fleming is a notable MFO with a presence in Africa.
5.3 Foundations and venture capital companies linked to HNWIs
In Africa, around US$32 billion is tied up in venture capital companies and foundations that are linked to the
wealthy. These companies are often run by the children of the HNWIs, who normally draw a salary and control
investment decisions.
Many HNWIs use these vehicles as a way to transfer money to the next generation.
AfrAsia Bank Africa Wealth Report 2017
© New World Wealth Page 38
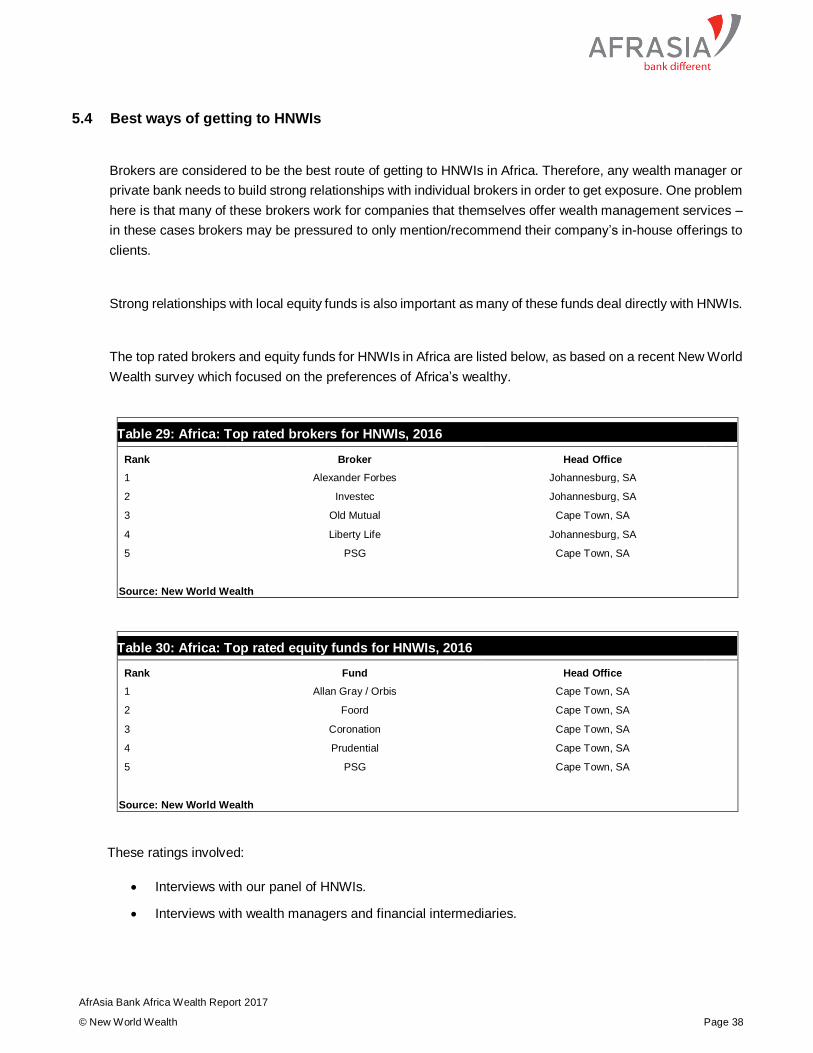
5.4 Best ways of getting to HNWIs
Brokers are considered to be the best route of getting to HNWIs in Africa. Therefore, any wealth manager or
private bank needs to build strong relationships with individual brokers in order to get exposure. One problem
here is that many of these brokers work for companies that themselves offer wealth management services –
in these cases brokers may be pressured to only mention/recommend their company’s in-house offerings to
clients.
Strong relationships with local equity funds is also important as many of these funds deal directly with HNWIs.
The top rated brokers and equity funds for HNWIs in Africa are listed below, as based on a recent New World
Wealth survey which focused on the preferences of Africa’s wealthy.
Table 29: Africa: Top rated brokers for HNWIs, 2016
Rank Broker Head Office
1 Alexander Forbes Johannesburg, SA
2 Investec Johannesburg, SA
3 Old Mutual Cape Town, SA
4 Liberty Life Johannesburg, SA
5 PSG Cape Town, SA
Source: New World Wealth
Table 30: Africa: Top rated equity funds for HNWIs, 2016
Rank Fund Head Office
1 Allan Gray / Orbis Cape Town, SA
2 Foord Cape Town, SA
3 Coronation Cape Town, SA
4 Prudential Cape Town, SA
5 PSG Cape Town, SA
Source: New World Wealth
These ratings involved:
Interviews with our panel of HNWIs.
Interviews with wealth managers and financial intermediaries.
AfrAsia Bank Africa Wealth Report 2017
© New World Wealth Page 39
6 About the author
New World Wealth is a global market research group, based in Johannesburg, South Africa. We provide
customized services to: wealth managers, family offices, real estate professionals, migration platforms and
fund managers.
Services on offer include:
Wealth statistics on 120 countries and 180 cities worldwide.
Country & regional wealth reports.
Political & economic analysis.
Ratings and surveys.
Migration statistics.
Custom research.
HNWI surveys*
*We interview over 800 HNWIs every year in order to determine their preferences.
Our wealth statistics leverage off our in-house HNWI database, which comprises dossiers on over 150,000
HNWIs from around the world.
For more information on New World Wealth please visit www.nw-wealth.com.
AfrAsia Bank Africa Wealth Report 2017
© New World Wealth Page 40
Contact Us
Andrew Amoils
New World Wealth
+27 11 706 1185
www.nw-wealth.com
Suneeta Motala
AfrAsia Bank
+230 403 5500
www.afrasiabank.com