
AFI E.D. Alfred Hannig Presentation at the 40th anniversary of the Banco de Moçambique
27
The Role of Financial Inclusion on Economic Growth: Challenges and Perspectives May 17, 2015
-
Upload
alliance-for-financial-inclusion -
Category
Economy & Finance
-
view
654 -
download
0
Transcript of AFI E.D. Alfred Hannig Presentation at the 40th anniversary of the Banco de Moçambique
Bringing smart policies to life
The Role of Financial Inclusion on Economic
Growth: Challenges and Perspectives
May 17, 2015
Bringing smart policies to life
Executive Director
“Financial inclusion can be a
powerful agent for strong and
inclusive growth by empowering
individuals and families to cultivate
economic opportunities.”
Bringing smart policies to life
Executive Director
—Christine Lagarde,
Managing Director, IMF
Bringing smart policies to life
What we mostly know….
Bringing smart policies to life
GDP per capita (USD)
Access
indicator
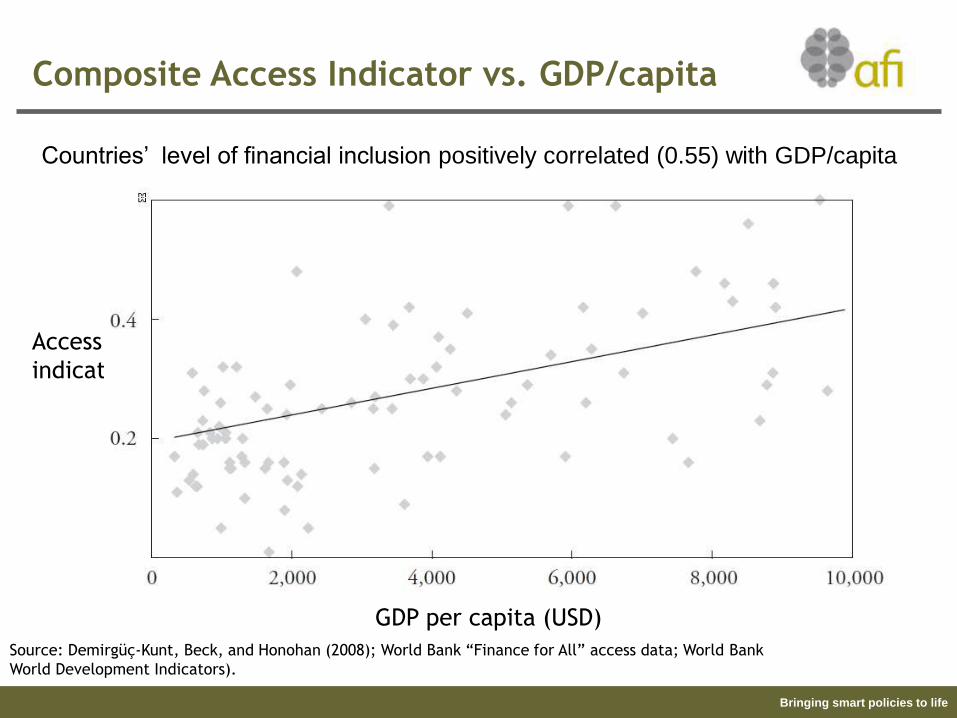
Composite Access Indicator vs. GDP/capita
Source: Demirgüç-Kunt, Beck, and Honohan (2008); World Bank “Finance for All” access data; World Bank
World Development Indicators).
Countries’ level of financial inclusion positively correlated (0.55) with GDP/capita

Bringing smart policies to life
A World Bank analysis of Mexico’s drive to increase
financial inclusion shows…
6
Financial inclusion has made a difference
10% increase in
financial inclusion
leads to
Source: World Bank – “The Economic Impact of Banking the Unbanked: Evidence from Mexico”
5% increase in
new businesses
7% increase in
employment
3% increase in
GDP

Bringing smart policies to life
7
Source: Innovations for Poverty Action: Prina, S. 2013. “”Banking the Poor via Savings Accounts: Evidence from a Field Experiment.” Working Paper ,
Brune, L., J. Goldberg, X. Giné, D. Yang. 2013. “Commitments to Save: A Field Experiment in Rural Malawi.” Working paper
Financial inclusion has made a difference
IPA analyses show:

Bringing smart policies to life
Executive Director
Improving access to Finance for SMEs supports job creation and employment
Relieve Access to Finance
Constraints
Entrepreneurship Capital
Investments
Risk Management
Indirect Effects
Job CreationPoverty
Reduction
A sample of 100 MSMEs that had obtained loans from Sri Lanka’s largest
private bank created 2,650 permanent jobs between 2009 and 2012,
showed an annual job growth rate of 12%. It was estimated that they may
have created between 140,000 and 340,000 jobs over three years. The
study estimated that between 10-31 jobs were created for every
$100,000 of loans provided to MSMEs.
Source: International Finance Corporation, IFC Jobs Study: Assessing Private Sector Contributions to Job Creation and Poverty Reduction (2013); Global
Partnership for Financial Inclusion, SME Finance: New Findings, Trends and G20/GPFI Progress (2015)
Bringing smart policies to life
What is less known to us…

Bringing smart policies to life
Percentage of adults with formal accounts (ppt) in 2014
GDP/
capita in
2014 (%)
Financial inclusion and GDP/capita
Source: Data from World Bank Global Findex, compiled by AFI
0
2000
4000
6000
8000
10000
12000
14000
16000
0 20 40 60 80 100
N developing countries = 94
Countries’ level of financial inclusion is positively correlated (0.6) with GDP/capita
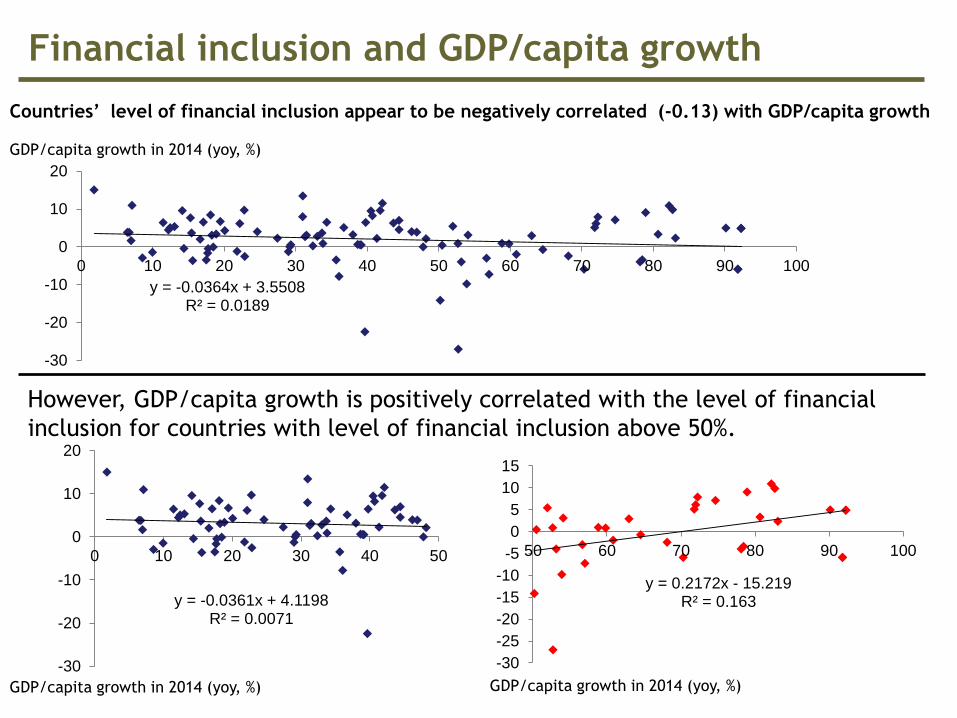
Financial inclusion and GDP/capita growth
Countries’ level of financial inclusion appear to be negatively correlated (-0.13) with GDP/capita growth
y = -0.0364x + 3.5508R² = 0.0189
-30
-20
-10
0
10
20
0 10 20 30 40 50 60 70 80 90 100
GDP/capita growth in 2014 (yoy, %)
y = -0.0361x + 4.1198R² = 0.0071
-30
-20
-10
0
10
20
0 10 20 30 40 50
y = 0.2172x - 15.219R² = 0.163
-30
-25
-20
-15
-10
-5
0
5
10
15
50 60 70 80 90 100
GDP/capita growth in 2014 (yoy, %) GDP/capita growth in 2014 (yoy, %)
However, GDP/capita growth is positively correlated with the level of financial
inclusion for countries with level of financial inclusion above 50%.

Bringing smart policies to life
Financial inclusion and growth
Some correlation exists between financial inclusion and change in GDP
in SADC countries.
FI % Change GDP % Change
Angola -26.6% 19.3%
Botswana 62.4% -3.8%
DRC 194.6% 26.5%
Malawi -2.4% -34.2%
Mauritius 2.6% 6.0%
Tanzania 9.8% 31.0%
Zambia 46.3% 13.0%
Zimbabwe -56.7% 23.1%
South Africa 28.4% -12.1%
Source: World Bank Global Financial Inclusion Database, 2011 & 2014; World Bank Data Catalogue, 2011 & 2013. No Findex data available for Lesotho, Mozambique, Namibia, Swaziland, Seychelles.

Bringing smart policies to life
Member engagement and financial inclusion
Source: Data from World Bank Global Findex, compiled by AFI; AFI Member Engagement Index 2014
0.5
1.5
2.5
3.5
-20 -10 0 10 20 30 40
The increase in financial inclusion is positively correlated (0.35) with members’
level of engagement with AFI
AFI Member
engagement
index
Increase in percentage of adults with formal accounts (ppt)
N AFI members = 65
*Cambodia, Mauritius N/A

Bringing smart policies to life
Maya Declaration commitments and financial
inclusion
Source: Data from World Bank Global Findex, compiled by AFI; AFI Maya Declaration Report 2014
AFI members that have adopted Maya Declaration increased financial inclusion by
9.5 ppts, compared to 8.4 ppts for AFI members without Maya Declaration
Increase in %
of adults with
accounts from
2011-2014
(ppt)
9.58.9
0
5
10
Median
Adopted Maya declaration No Maya Declaration
N Maya = 48
N No Maya = 42
Bringing smart policies to life
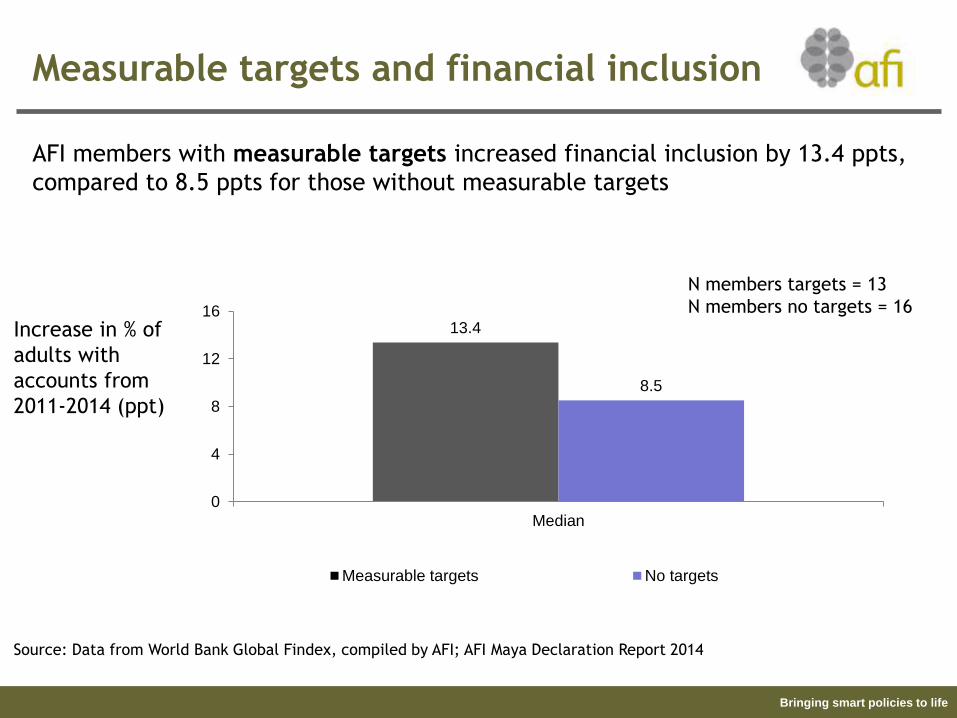
Measurable targets and financial inclusion
Source: Data from World Bank Global Findex, compiled by AFI; AFI Maya Declaration Report 2014
13.4
8.5
0
4
8
12
16
Median
Measurable targets No targets
AFI members with measurable targets increased financial inclusion by 13.4 ppts,
compared to 8.5 ppts for those without measurable targets
Increase in % of
adults with
accounts from
2011-2014 (ppt)
N members targets = 13
N members no targets = 16
Bringing smart policies to life
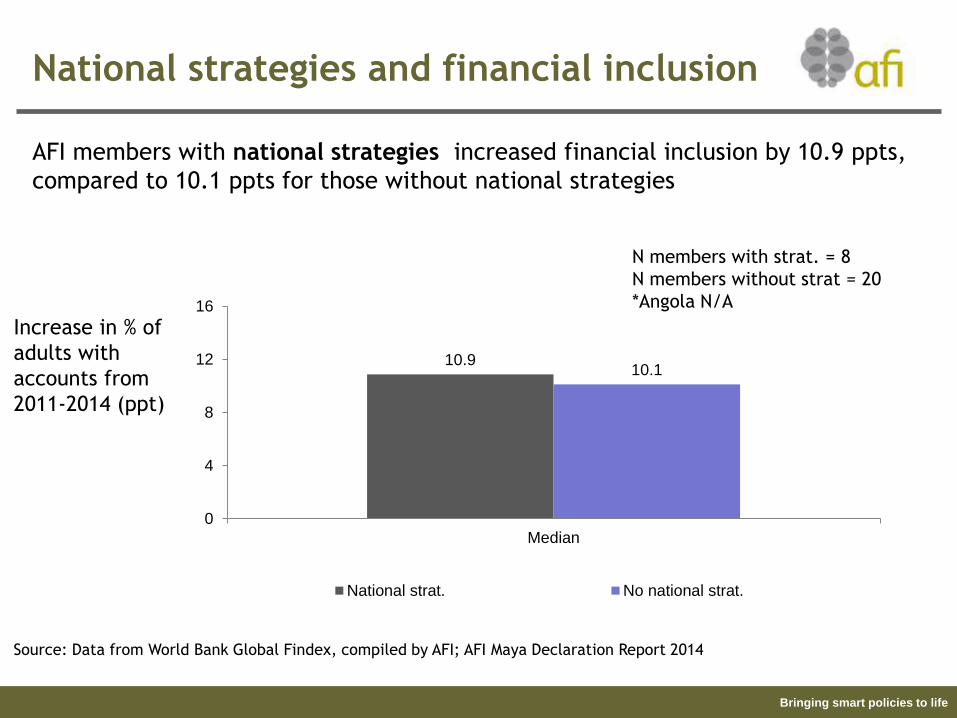
National strategies and financial inclusion
10.910.1
0
4
8
12
16
Median
National strat. No national strat.
AFI members with national strategies increased financial inclusion by 10.9 ppts,
compared to 10.1 ppts for those without national strategies
Increase in % of
adults with
accounts from
2011-2014 (ppt)
N members with strat. = 8
N members without strat = 20
*Angola N/A
Source: Data from World Bank Global Findex, compiled by AFI; AFI Maya Declaration Report 2014

Bringing smart policies to life
Executive Director
Financial Inclusion in Mozambique
Commitment to develop national
financial inclusion strategy
Strategy published by
Council of Ministers
Update strategy to include
quantifiable targets
On track to increase financial
inclusion to 25% by 2019
2012 2013 2014

Bringing smart policies to life
Financial inclusion growth
Source: World Bank Global Financial Inclusion Database, 2011 & 2014; World Bank Data Catalogue, 2011 & 2013. No Findex data available for Lesotho, Mozambique, Namibia, Swaziland, Seychelles.
Of the five countries with the largest financial inclusion
increase in percentage of population included, four of
them are AFI members:
Kenya: 32.3%
Uganda: 24%
El Salvador: 23%
Tanzania: 22.5%
Bringing smart policies to life
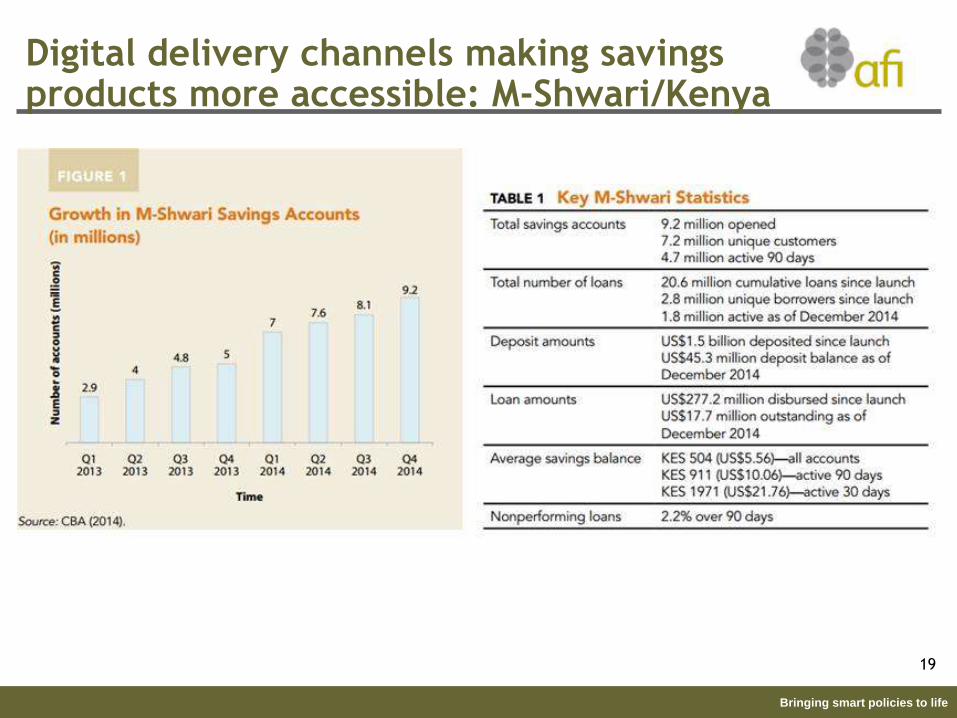
Digital delivery channels making savings products more accessible: M-Shwari/Kenya
19

Bringing smart policies to life
Dramatic Mobile Money growth: Tanzania
Source: Bank of Tanzania
Mid-2014:
12.3 million active mobile money accounts….
reaching 55% of the population
…..via 138,000 agents….

Bringing smart policies to life
Financial inclusion becoming part of regulators’ mandate
• Financial inclusion is no longer only a development concern but a
cornerstone of economic development framework and model
• Financial inclusion is a policy goal complementary to stability, integrity
and consumer protection
• Financial inclusion is understood in a broad framework including access,
usage and quality of a range of financial services.
No. of
Countries
Have dedicated financial inclusion strategy 31
Created a dedicated financial inclusion unit 22
21

Bringing smart policies to life
Is financial inclusion a
mandated objective for your institution?
Source: GPF 2013 electronic voting results for the session, Driving Policies for Optimal Impact
30%
18%
46%
5%
1%
Mandated objective
A mandated objective, butsecondary to others
Not a mandated objective,but recognized as important
Not recognized as anobjective
Other

Bringing smart policies to life
SADC and financial inclusion
“Financial inclusion is no longer something
nice to do, but is now an essential part of
the global economic development agenda.
It is a public policy issue that regulators
cannot shy away from”
Professor Njuguna Ndung’u,
Former Governor CB Kenya and AFI Chair,
September 2011
Bringing smart policies to life
Executive Director“We recognize the critical importance of
financial inclusion for inclusive growth and
development that places shared prosperity at
the center of development in developing and
emerging economies. We concur policy and
regulatory bodies must include financial
inclusion in their mandate.”
—Dili Consensus on Financial
Inclusion in the Pacific Islands,
8 May 2015
Financial inclusion becoming part of regulators’ mandate
Bringing smart policies to life
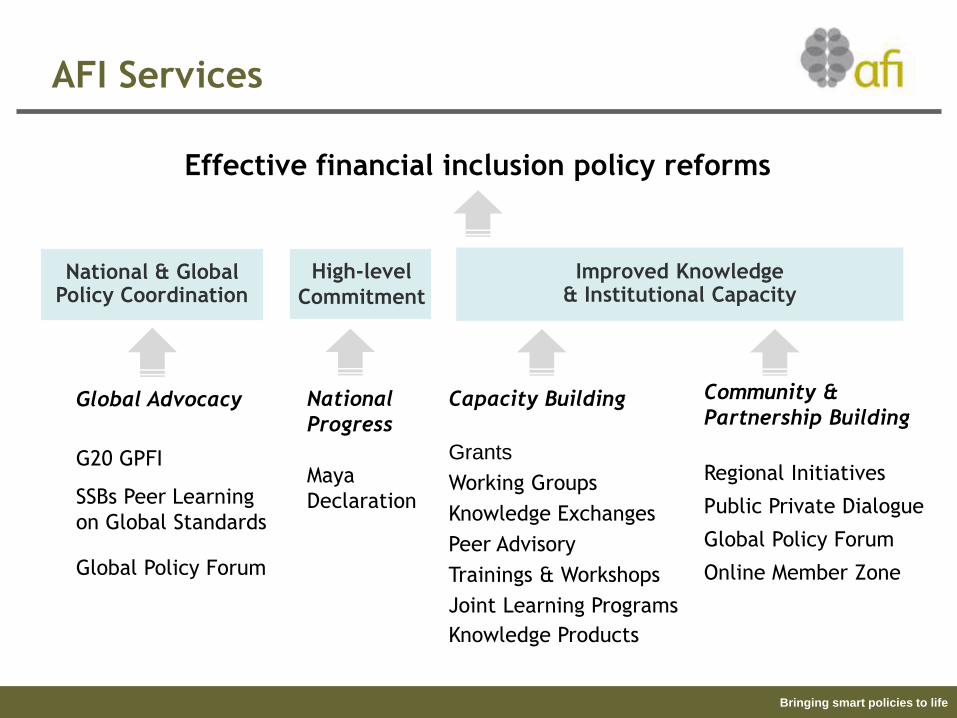
Effective financial inclusion policy reforms
Improved Knowledge & Institutional Capacity
High-level
Commitment
National & Global Policy Coordination
National
Progress
Maya
Declaration
Capacity Building
Grants
Working Groups
Knowledge Exchanges
Peer Advisory
Trainings & Workshops
Joint Learning Programs
Knowledge Products
Global Advocacy
G20 GPFI
SSBs Peer Learning
on Global Standards
Global Policy Forum
Community &
Partnership Building
Regional Initiatives
Public Private Dialogue
Global Policy Forum
Online Member Zone
AFI Services
Bringing smart policies to life
Executive Director“Financial inclusion is important to the
economy, it improves the welfare of the
poor and contributes to financial
stability”
—Professor Benno Ndulu,
Governor, Bank of Tanzania, AFI Vice-Chair
December 2013