
Afghanistan - Public Expenditure and Financial ...
164
Transcript of Afghanistan - Public Expenditure and Financial ...


1
Fiscal Year: December 22 – December 21CURRENCY EQUIVALENTS
Currency Unit = Afghani (AFN)US$1 = AFN 70.7 (as of May 12, 2018)
AfghanistanPublic Expenditure and Financial
Accountability (PEFA) Performance Assessment Report
Based on PEFA Framework 2016 Baseline Report
June 2018

Public Expenditure and Financial Accountability (PEFA) Performance Assessment Report2
Table of contentsAcronyms and Abbreviations......................................................................................................................................... 4Executive Summary............................................................................................................................................................ 10
Chapter 1 1.1 Assessment Rationale ....................................................................................................................................... 17 1.2 Assessment Management and Quality Assurance ............................................................................... 18 1.3 Assessment Methodology ............................................................................................................................... 19
Chapter 2 2.1 Country Economic Situation............................................................................................................................ 24 2.2 Fiscal and Budgetary Trends ........................................................................................................................... 25 2.3 Legal and Regulatory Arrangements for PFM .......................................................................................... 28 2.4 Institutional Arrangement for PFM .............................................................................................................. 30
Chapter 3 Pillar I: Budget reliability................................................................................................................................................ 37 PI-1 Aggregate expenditure outturn.................................................................................................... 37 PI-2 Expenditure composition outturn............................................................................................... 39 PI-3 Revenue outturn.................................................................................................................................. 40 Pillar II: Transparency of public Finances................................................................................................................ 43 PI-4 Budget classification......................................................................................................................... 43 PI-5 Budget documentation.................................................................................................................... 45 PI-6 Central government operations outside financial reports................................................ 47 PI-7 Transfers to subnational governments...................................................................................... 48 PI-8 Performance information for service delivery......................................................................... 50 PI-9 Public access to fiscal information............................................................................................... 53 Pillar III: Management of assets and liabilities................................................................................................... 55 PI-10 Fiscal risk reporting............................................................................................................................ 55 PI-11 Public investment management.................................................................................................. 58 PI-12 Public asset management............................................................................................................... 60 PI-13 Debt management............................................................................................................................. 62 Pillar IV: Policy-based fiscal strategy and budgeting......................................................................................... 64 PI-14 Macroeconomic and fiscal forecasting...................................................................................... 64 PI-15 Fiscal strategy....................................................................................................................................... 66 PI-16 Medium-term perspective in expenditure budgeting........................................................ 67 PI-17 Budget preparation process........................................................................................................... 68 PI-18 Legislative scrutiny of budgets...................................................................................................... 71 Pillar V: Predictability and control in budget execution................................................................................... 73 PI-19 Revenue Administration.................................................................................................................. 73 PI-20 Accounting for revenue.................................................................................................................... 77 PI-21 Predictability of in-year resource allocation............................................................................. 79 PI-22 Expenditure arrears............................................................................................................................ 81 PI-23 Payroll controls..................................................................................................................................... 83 PI-24 Procurement management............................................................................................................ 84 PI-25 Internal controls on non-salary expenditure........................................................................... 89 PI-26 Internal audit........................................................................................................................................ 91

Table of Contents 3
Pillar VI: Accounting and reporting........................................................................................................................... 93 PI-27 Financial data integrity..................................................................................................................... 93 PI-28 In-year budget reports...................................................................................................................... 94 PI-29 Annual financial reports.................................................................................................................. 96 Pillar VII: External scrutiny and audit....................................................................................................................... 97 PI-30 External audit....................................................................................................................................... 97 PI-31 Legislative scrutiny of audit reports............................................................................................ 99
Chapter 4 4.1 Integrated Assessment of the PFM Performance................................................................................. 104 4.2 Effectiveness of the Internal Control Framework................................................................................. 108 4.3 PFM Strengths and Weaknesses.................................................................................................................. 108 4.4 Performance Changes since the 2013 Assessment............................................................................. 110
Chapter 5 5.1 Approach to PFM Reforms.............................................................................................................................. 113 5.2 Recent and Ongoing Reform Actions......................................................................................................... 113 5.3 Institutional Considerations......................................................................................................................... 114
Annex 1 Performance Indicator Summary.......................................................................................................... 117
Annex 2 Summary of Observations on the Internal Control Framework...................................... 128
Annex 3 Source of Information .............................................................................................................................. 134
Annex 4 Summary of Changes in Performance Based on 2011 PEFA Methodology..................... 138
Annex 5 Calculation sheets for PI-1, PI-2, and PI-3.......................................................................................... 156

Public Expenditure and Financial Accountability (PEFA) Performance Assessment Report4
Acronyms and Abbreviations
ACD Afghanistan Customs Department
AFMIS Afghanistan Financial Management Information System
ANPDF Afghanistan National Peace and Development Framework
ANDS Afghanistan National Development Strategy
ARD Afghanistan Revenue Department
ARDS Afghanistan Reconstruction and Development Services
ARTF Afghanistan Reconstruction Trust Fund
ASYCUDA Automated System for Customs Data
BC-1 Budget Call Circular 1
BC-2 Budget Call Circular 2
BCG Budgetary Central Government
COFOG Classification of Functions of Government
CPI Consumer Price Index
CS-DRMS Commonwealth Secretariat Debt Reporting and Management System
CSO Civil Society Organization
DAB Da Afghanistan Bank
DFID U.K. Department for International Development
DG Director General
DSA Debt Sustainability Analysis
EITI Extractive Industries Transparence Initiative
FARI Fiscal Analysis for Resource Industries
FMC Financial Management and Control
FPIP Fiscal Performance Improvement Plan

Acronyms and Abbreviations 5
FSP Fiscal Strategy Paper
GCMU Grant and Contract Management Unit
GDP Gross Domestic Product
GFSM Government Fiscal Statistics Manual
GoIRA Government of the Islamic Republic of Afghanistan
HOOAC High Office of Oversight and Anti-corruption
HR Human Resources
HRM Human Resources Management
IMF International Monetary Fund
IPSAS International Public Sector Accounting Standards
ISSAI International Standards of Supreme Audit Institutions
IT Information Technology
KM Kabul Municipality
KPI Key Performance Indicator
LM Line Ministry
LTO Large Taxpayer Office
M&E Monitoring and Evaluation
MFPD Macro Fiscal Performance General Directorate
MoAIL Ministry of Agriculture, Irrigation, and Livestock
MoC Ministry of Culture
MoCI Ministry of Commerce and Industry
MoCIT Ministry of Communications and Information Technology
MoEc Ministry of Economy
MoEW Ministry of Energy and Water

Public Expenditure and Financial Accountability (PEFA) Performance Assessment Report6
MoF Ministry of Finance
MoTCA Ministry of Transport and Civil Aviation
MoUD Ministry of Urban Development
MTBF Medium-term Budgeting Framework
MTEF Medium-term Economic Framework
MTFF Medium-term Fiscal Framework
NGO Nongovernmental Organization
NPA National Procurement Authority
NPC National Procurement Commission
NR Not Rated
O&M Operations and Maintenance
PAC Public Accounts Committee
PCN Project Concept Note
PEFA Public Expenditure and Financial Accountability
PFEM Public Finance and Expenditure Management
PFM Public Financial Management
PFMA Public Financial Management and Accountability
PFMR Public Financial Management Reform
PI Performance Indicator
PMIS Procurement Management Information System
PMT Performance Management Team
PPP Public-Private Partnership
SAO Supreme Audit Office
SDG Sustainable Development Goals

Acronyms and Abbreviations 7
SDU Special Disbursement Unit
SIGTAS Standard Integrated Government Tax Administration System
SOC State-owned Corporation
SOE State-owned Enterprise
SY Solar Year
TMAF Tokyo Mutual Accountability Framework
UNDB United Nations Development Business
VAT Value Added Tax
WCO World Customs Organization
WTO World Trade Organization

Public Expenditure and Financial Accountability (PEFA) Performance Assessment Report8
AfghanistanPublic Expenditure and Financial Accountability (PEFA)
Performance Assessment ReportBased on PEFA 2016 Framework
Baseline report June 2018
The quality assurance process followed in the production of this report satisfies all the requirements of the PEFA Secretariat and hence receives the ‘PEFA CHECK’.
PEFA SecretariatJune 16, 2018

Executive Summary Executive Summary 9
Executive Summary

Public Expenditure and Financial Accountability (PEFA) Performance Assessment Report10
1. Afghanistan’s Public Financial Management (PFM) systems have significantly improved since the reconstruction efforts commenced in the year 2002. Afghanistan has transitioned from a state of emergency arrangements to a largely disciplined PFM system. The major achievements include establishing the legal, institutional and operational framework for PFM and ancillary functions, and introducing the modern budget tools and automated payments. These improvements have gradually strengthened confidence in PFM, leading to the increased use of national systems by the Development Partners (DP).
2. The Government and the DPs use PEFA assessments to monitor the outcomes of Afghanistan’s PFM reforms. High-level PFM benchmarks were established in the Tokyo Mutual Accountability Framework (TMAF, 2012). Most recently, the Government outlined the PFM reforms in the Fiscal Performance Improvement Program (FPIP, 2016). This PEFA Assessment has been completed as a joint Government and DP initiative to inform relevant stakeholders on the extent to which national PFM systems and practices support the achievement of the fiscal and budgetary outcomes.
3. The coverage of the PEFA assessment is central government fiscal operations, extra budgetary units and state-owned enterprises. This includes centralized accounting entities, namely line ministries and other central government agencies for which budget is approved by the national legislature and expenditure is processed through the Afghanistan Financial Management Information System (AFMIS). Public enterprises and extra-budgetary units are covered to the extent of financial reporting and allocations from the national budget.
4. The assessment was carried out as a joint government and donors’ initiative. Key development partners engaged with GoIRA in supporting the PFM reforms collaborated in the
review. The World Bank administered the review and a Steering Committee comprising of the key stakeholders in GoIRA provided oversight of the assessment. A comprehensive quality assurance mechanism was put in place comprising the sector specialists at the World Bank and the external peer reviewers that included the PEFA Secretariat, DFID and EU delegation.
5. This PEFA assessment covers the period of FY 1393 to FY 1395 (2014-2016). Afghanistan’s Fiscal Year (FY) runs from December 22 to December 21. The PEFA review period covered FY 1393 (ending December 21, 2014), FY1394 (ending December 21, 2015), and FY1395 (ending December 20, 2016, leap year). Data and information of FY1396 (2017) was used for some dimensions requiring the review of the last FY.
6. The current PEFA assessment illustrates the persistence of PFM challenges. Significant issues are identified throughout the PFM cycle, including low budget credibility, imperfect disclosure of public finances, poor asset and liability management, anomalies in budget execution, low standard of financial reporting, and lack of audit independence. However, there are noteworthy bright spots of high performance, such as macroeconomic and fiscal forecasting, and procurement management.
7. Several scores have declined since the last assessment, however, the PEFA methodology and context have also changed. The new PEFA Framework published in 2016, upgraded the methodology and scoring criteria and has been strictly applied. Contextual challenges included Presidential Elections in 2014 and subsequent delays in the Cabinet formation. The security transition in 2014 and provincial security issues impeding budget execution in some cases. The withdrawal of a significant number of technical advisors in 2015 created capacity gaps, particularly in the Line Ministries (LMs). At the same time, significant
Executive Summary

Executive Summary Executive Summary 11
DP resources have been shifted on-budget in both the security and non-security sectors.
Impact of PFM performance on budgetary and fiscal outcomes
8. The results of the current PEFA assessment are presented to explain how the PFM performance in Afghanistan has influenced the three fiscal and budgetary outcomes – aggregate fiscal discipline, strategic allocation of resources and the efficiency in service delivery
i. Aggregate Fiscal Discipline
9. Afghanistan has displayed ability to control expenditure to prevent unexpected deficits but the low predictability of donor resources impact fiscal discipline. Execution of the budget for the domestic revenue is robust. However, there are major problems below the aggregate budget level and with the predictability of the flow of donor resources. This undermined the overall credibility of the budget as evidenced in the high expenditure deviations. A large proportion of expenditure is through donor financed and executed projects, over which the government has little control. The lack of timely availability of indicative planning figures, the weaknesses in budget execution and the lack of effective monitoring of the extra budgetary units and corporations also negatively influenced fiscal discipline.
10. Weak budget expenditure execution is the result of poor project selection and uninformed budget allocation decisions. The lack of a robust public investment management framework impacts fiscal discipline and lowers the productivity of development expenditures. Projects are selected in the development budget without due-diligence for cost implications and development impacts, as political imperatives take precedence. Failure to integrate procurement planning in the budget process has also led to arbitrary budget allocations and the
resultant expenditure deviations.
11. Although the prescribed internal control framework is reasonably detailed, compliance is varied. The auditors have reported issues of non-compliance with the prescribed controls related to segregation of duties, lack of audit trail, management override and non-adjustment of advances. Internal auditors have been recruited and guidelines and toolkits have been developed. The focus of internal audit is largely on financial compliance. Internal audit is not yet risk-based and does not address system strengthening and quality assurance. The weak capacity limits effective control environment.
12. The control systems for payroll are insufficient and represent a major weakness for a significant proportion of expenditure. Personnel management practices are uneven. In some agencies, records are manually managed while in others there are IT systems. However, there is no underlying IT architecture that supports integration with central systems. In effect, there is no HRMIS linking personnel records to the payroll system. As a result, the integrity of payroll data is undermined and third-party verification is challenging. Data cleaning, introduction of an integrated HRMIS and payroll audits are critical to improving payroll management.
13. The lack of requisite data in the budget documents hinders performance evaluation. The performance indicators for the budget (recurrent and development) are not linked to the annual budget allocations. Consequently, performance reviews cannot be carried out with respect to what and how much was achieved against the budgetary allocations. The legislative oversight process is weak and comprehensive procedures for legislative scrutiny have not been defined.

Public Expenditure and Financial Accountability (PEFA) Performance Assessment Report12
ii. Strategic allocation of resources
14. The ANPDF defines high-level policy priorities, but these are not reliably translated into expenditures through the budget. Development of coherent sector strategies for ANPDF implementation has been uneven. Some sector strategies remain to be developed (e.g. infrastructure development), while the implementation of sector strategies in the social sectors has been mixed, largely owing to the lack of required financing and uninformed budget allocation decisions.
15. Limited adoption of modern budgeting practices undermines allocative efficiency. The budget allocation mechanism is largely incremental, while the budget estimation for the recurrent and development budgets is fragmented, and thus impedes the linkages between the selected programs and policy priorities. The lack of indicative planning figures during budget preparation cycles does not provide a medium-term perspective, and thus compels the LMs to follow a randomized and incremental budgeting system.
16. To achieve value for money in public investments, better data and analysis is required while instituting a robust PIM is vital for strategic resource allocations. The absence of adequate project-related information at the planning stage undermines implementation and results in time and cost overruns. The sustainability of national programs should be considered in the context of current and projected revenues. Without data and systems, effective liability management and transparency of public investments is limited. The current PIM framework has inadequacies on the entire PIM cycle—project preparation, project appraisal, execution and monitoring and evaluation. With project proposals not passing through a systematic filtering and gate-keeping process, and with the lack of complete project information for closer monitoring and evaluation, the allocative efficiency of development budget becomes significantly impaired. Large resources
have been set aside for poorly-prepared and underperforming projects that have not been processed under a PIM regime. The remaining limited fiscal space has often led to token budget allocations to better performing projects.
iii. Efficient use of resources for service delivery
17. Lack of performance information hinders operational efficiency in public service delivery. The budget documents lack the required performance information; the Chart of Accounts does not facilitate information availability to the service delivery units; and there are no performance plans for service delivery. Consequently, the performance orientation of the entire budget formulation and execution process is undermined. The service delivery units have virtually no role in budget planning and execution.
18. Centralized powers and processes are aimed to achieve value for money but impedes efficiency. The strengthening of public procurement has improved transparency and procurements are made on competitive prices. However, the centralized processing and approval of large procurements add time to award contracts. Although over 70 percent of the total budget is allocated to recurrent budget, the lack of delegated commitment authority has created spending rigidities, hampering innovations in service delivery. Over the last three fiscal years, approximately half of the development budget remained unspent. Prevailing optimism in budget planning, procedural complexities in budget execution, lack of integrated systems and implementation capacity have hindered budget utilization and impacted service delivery efficiency and effectiveness.
Comparison with last PEFA assessment (2013)
19. While the revisions in the PEFA Framework (2016) provides for a deeper analysis, it hinders a direct comparison with the prior reviews. The current assessment

Executive Summary Executive Summary 13
provides results based on the 2016 framework. It also presents performance rating changes since the 2013 PEFA assessment using the prior PEFA framework (2011).
20. The comparator offers results between the prior (2013) and the current PEFA, however the results have to be viewed with a perspective. The statistical results show the rating for 64 percent of the indicators remained the same, 11 percent displayed improvements while 25 percent showed decline. However, it is vital to consider the over optimism and the need for corrections in the PEFA 2013, for an objective comparison. There was notable performance improvement in revenue planning, public procurement, external audit follow-up and legislative scrutiny of audit reports. The fragmented and deficient payroll system, potential fiscal risks stemming from lack of oversight of the SOEs and SOCs remain significant challenges with unchanged performance ratings. The scores for aggregate expenditure outturn and monitoring of arrears declined in comparison to 2013 assessment.
PFM reform agenda
21. PFM reform has been a priority of the National Unity Government. The reform agenda was informed by the diagnosis of the functionality of the PFM system in developing a program of reforms to better use the budget as a tool for development. The assessment highlighted key challenges in the current PFM system, including fragmented and the pitfalls of incremental budgeting, weakness of budget and policy links to development priorities, weak procurement practices, and inadequate internal controls.
22. Recent reforms have generally addressed key PFM priorities and have skewed emphasis on budget formulation. The recent emphasis on revenue reforms has reflected the urgent need to raise domestic revenues in the context the 2014 transition and the prospect of declining international aid support. Similarly, a
focus on strengthening procurement processes and addressing corruption were vital to improve the integrity of the PFM system and to provide donors with sufficient confidence to continue using country systems. The current emphasis on budget formulation is not balanced by measures to improve budget execution. There is a need for greater consideration of budget execution realities, especially at the level of service-delivery units, where payroll and procurement delays continue to impede service delivery, and budget execution for projects remains poor.
23. The breadth and ambition of reforms included in the FPIP requires greater selectivity and prioritization. FPIP targets are informed by achieving high scores against international benchmark indicators throughout the PFM cycle, including those measured through the PEFA framework. Achievement of current aspirational PEFA targets would enable Afghanistan to out-perform many comparable country groups in PEFA scores. While establishing clear aspirational goals may serve an important purpose, it also poses a risk that high levels of ambition in all areas may prevent careful and explicit identification of the highest priorities for improved macroeconomic management and service delivery. Establishing clear relative priorities among many PFM reform agenda is vital for ensuring that scarce capacity and resources are put to their best use.

Public Expenditure and Financial Accountability (PEFA) Performance Assessment Report14
Table 1. PEFA Assessment Summary of Scores 2018
PFM Performance IndicatorScoring method Dimension ratings 2018
Scorei. ii. iii. iv.
Pillar I. Budget reliability
PI-1 Aggregate expenditure outturn D D
PI-2 Expenditure composition outturn M1 D D C D+
PI-3 Revenue outturn M2 D D D
Pillar II: Transparency of public finances
PI-4 Budget classification C C
PI-5 Budget documentation C C
PI-6Central government operations outside financial reports
M2 D* D* D D
PI-7 Transfers to subnational governments M2 NA NA NA
PI-8 Performance information for service delivery M2 B C D D D+
PI-9 Public access to fiscal information D D
Pillar III: Management of assets and liabilities
PI-10 Fiscal risk reporting M2 D D D D
PI-11 Public investment management M2 C C D D D+
PI-12 Public asset management M2 C D D D+
PI-13 Debt management M2 A D D D+
Pillar IV: Policy-based fiscal strategy and budgeting
PI-14 Macroeconomic and fiscal forecasting M2 A B A A
PI-15 Fiscal strategy M2 B C C C+
PI-16Medium-term perspective in expenditure budgeting
M2 C D D D D
PI-17 Budget preparation process M2 C C C C
PI-18 Legislative scrutiny of budgets M1 C C C C C
Pillar V: Predictability and control in budget execution
PI-19 Revenue administration M2 C C D D D+
PI-20 Accounting for revenue M1 B A C C+
PI-21 Predictability of in-year resource allocation M2 C A B C B
PI-22 Expenditure arrears M1 D* D D
PI-23 Payroll controls M1 D D D C D+
PI-24 Procurement management M2 B A B B B+
PI-25 Internal controls on non-salary expenditure M2 C C C C
PI-26 Internal audit M1 A C B C C+
Pillar VI: Accounting and reporting
PI-27 Financial data integrity M2 B B D B C+
PI-28 In-year budget reports M1 D C C D+
PI-29 Annual financial reports M1 C D C D+
Pillar VII: External scrutiny and audit
PI-30 External audit M1 C A B D D+
PI-31 Legislative scrutiny of audit reports M2 B A C D C+

Chapter 1. Introduction 15
Chapter 1Introduction

Public Expenditure and Financial Accountability (PEFA) Performance Assessment Report16
Table of conents (Chapter 1 - Introduction)
1.1 Assessment Rationale ....................................................................................................................................... 17
1.2 Assessment Management and Quality Assurance ................................................................................ 18
1.3 Assessment Methodology ............................................................................................................................... 19

Chapter 1. Introduction 17
1. Chapter 1 outlines the rationale and purpose of the Public Expenditure and Financial Accountability (PEFA) assessment, the management and quality assurance process, and the methodology used in undertaking the assessment.
1.1 Assessment Rationale
2. After about three decades of war and internal conflicts, the reconstruction efforts commenced in Afghanistan in 2002, following the Bonn agreement (December 2001) stipulating interim arrangements in Afghanistan pending the reestablishment of permanent state institutions. The needs for financing the infrastructure development were immense while substantial financing was required to run the government machinery amid a fragile security environment with continuous threat from the non-state actors. In 2002–03, the Government of the Islamic Republic of Afghanistan (GoIRA) pitched its total budget estimates for revenue collection efforts at AFN 2.8 billion while its operating expenditure needs for running the government machinery for the same year were AFN 15.6 billion. With a very low revenue base, the reconstruction efforts were mainly foreign aid driven, and with donors’ low confidence in the national public financial management (PFM) systems, the matter got complicated with the use of systems parallel to that of the government.
3. Over the passage of time, on the global arena, strengthening the local PFM systems came to the fore triggered by the Paris Declaration (2005), Accra Agenda for Action (2008), and other high-level forums. In consonance, the commitment of the GoIRA leadership complemented the reform efforts. The flow of international finances to Afghanistan has played a significant role. While its abundance provided the much-needed finances in the ‘reconstruction decade’, its crunch particularly after the withdrawal of the international forces in 2014 created an impetus for GoIRA to strengthen public expenditure management and improve its own-source revenue.
4. The literature on governance recognizes the long gestation 1period of reforms, and in practice, ‘developed countries’ provide evidence to the long and arduous journey of PFM reforms. Developed countries have practiced traditional budgeting for centuries and have reached the current level after an uninterrupted and continued focus on PFM. The key to the success, besides technical aspects, is the government’s resolve. GoIRA has invested heavily in the development of systems and capacity building and has taken laudable measures for improving PFM. From almost a nonexistent system and manual payment processing to the introduction of modern budgeting tools, automated payments, and so on was a difficult journey that has been realized with the GoIRA’s resolve to strengthen PFM. The continuity of this commitment and support from the development partners will aid in successfully filling the gaps.
5. With this backdrop, a comprehensive review of performance and the inhibiting factors is the logical first step toward strengthening PFM. Additionally, owing to the revisions in the international standards and the PEFA Framework, the decision makers in GoIRA considered it an opportune time to conduct PFM assessment. Since 2005, GoIRA relied on the application of the PEFA Framework to take stock of the reform efforts and facilitate evidence-based decision making for strengthening PFM. The prior three PEFA assessments conducted in 2005, 2008, and 2013 recognized
1 UNDP (2011) ‘Governance Principles, Institutional Capacity and Quality’ [accessed on 11 April 2018] Uncertainty http://www.undp.org/content/dam/undp/library/Poverty%20Reduction/Inclusive%20development/Towards%20Human%20Resilience/Towards_SustainingMDGProgress_Ch8.pdf
Chapter 1

Public Expenditure and Financial Accountability (PEFA) Performance Assessment Report18
the government’s continuous efforts toward developing a well-defined legal, institutional, and operational framework that underpins the PFM system. The cross-country comparison to other fragile states and other low-income countries on all dimensions except budget credibility provided evidence of better results in Afghanistan. The current fiscal performance improvement program (FPIP) is based on the PEFA (2013) results.
6. The upgraded PEFA Framework (2016) provides a deeper and wider perspective to PFM practices and also includes a comparator on the prior methodology. Therefore, it was considered beneficial to take stock of the reform measures on the PEFA Framework (2016). This Public Financial Management and Accountability (PFMA) assessment has relied on the PEFA Framework (2016) to have a deeper insight of the PFM practices and provides a baseline for subsequent assessments to create performance trajectories facilitating the monitoring of reform efforts. It also supports the identification of weaknesses and gaps in the PFM system that will assist GoIRA and the development partners to collaborate for strengthening PFM in Afghanistan.
1.2 Assessment Management and Quality Assurance
7. The PEFA Assessment was requested by GoIRA and funded from the World Bank budget. The European Union provided parallel financing for the local consultant who supported the team with data gathering and administration. The assessment was a joint effort of GoIRA, the World Bank and the development partners, overseen by the government steering committee comprising senior-level officials of relevant ministries involved in PFM and led by the Performance Management Team in the Ministry of Finance (MoF). The Performance Management Team (MoF) provided high-level coordination of the assessment process, reviewed and approved the concept note, provided substantial inputs to the draft report, and drafted Chapter 5 of this report, Government PFM Reform Program. The MoF and Performance Management Team also made substantial inputs to other chapters that came from the government steering team.
8. The management and quality assurance arrangements and participating individuals are presented in Box 1. A cross-sectoral team from GoIRA and the World Bank carried out the assessment. The diverse group of reviewers of both draft and final versions of the Concept Note and the Assessment Report comprised PFM experts and professionals from the Afghan Government, World Bank, and other development agencies.
Box 1. Assessment Management and Quality Assurance Arrangements
Oversight Team: Khalid Payenda, Deputy Minister Finance, MoF Hameedullah Sherani, Head, Performance Management Team & 2016
PEFA Assessment Steering Committee Chair Hafizullah Omerkhail, PFM Specialist, PMT Ahmed Khalid, PFM Specialist, PMT Mohamad Haroon, Office of Chief of Staff Hanan Maroof, Supreme Audit Office (SAO) Naveed Ahmad Niaz, Budget General Directorate, MoF Mohamad Hameed Nekzad, Revenue General Directorate, MoF Sayed Bilal Hashimi, Treasury General Directorate, MoF Mohamad Abid Amiri, Office of Policy Deputy Minister, MoF Barbara Egger, European Union Romal Sanjeeda, U.K. Department for International Development (DFID)

Chapter 1. Introduction 19
Assessment Manager:
Ismaila B. Ceesay, Practice Manager, World Bank
Assessment Team Leader and Team Members: Syed Waseem Kazmi (Team Leader) Adenike Sherifat Oyeyiola (Team Leader) Bogdan Constantinescu (Senior Financial Management Specialist) Rahimullah Wardak (Senior Procurement Specialist) Tobias Akhtar Haque (Senior Economist) Bernard Haven (Public Sector Specialist) Saurabh Shome (Economist) Ahmad Rafi Otofat (Program Assistant) Mian Asif Shah (Consultant) Stephen Emasu (Consultant) Ahmed Shah Ahmadzai (Consultant)
Concept Note Review: The Concept Note review meeting was on March 27, 2017; the final Concept Note was issued on May 1, 2017. All invited reviewers provided comments.
Reviewers: Hafiz Momandi, Senior Economist, MFPD, MoF Richard Spencer Hogg, Program Leader, SACKB World Bank Pazhayannur Subramanian, Lead Financial Management Specialist, GGO20 World Bank Manvinder Mamak, Senior Financial Management Specialist, GGO24 World Bank Gael Griette, Task Manager, Economic Development, European Union
PEFA Secretariat
Assessment Report Review:
The virtual decision meeting for the draft assessment report continued from January-June 2018 comprising of two rounds of peer reviews. All invited reviewers provided comments.
Reviewers: Hafiz Momandi, Senior Economist, MFPD, MoF Richard Spencer Hogg, Program Leader, SACKB World Bank Saeeda Sabah Rashid, Senior Public Sector Specialist, GGOIS, World Bank Manvinder Mamak, Senior Financial Management Specialist, GGO24 World Bank Guillaume Barraut, Economist and Policy Analyst, Southeast Asia and the
Pacific, European Union PEFA Secretariat
1.3 Assessment Methodology
9. This PFMA Assessment is based on the PEFA Framework (2016), which reviews seven critical pillars of performance using a set of 31 performance indicators (PIs) and associated dimensions. It introduces four new indicators on management of assets and liabilities, refines the existing indicators, and introduces a stronger focus on internal controls and a policy perspective to fiscal strategy. The last assessment in Afghanistan was published in August 2013 that was conducted on the PEFA (2011) Framework.
10. As an objective, indicator-led assessment of the PFM system, the PEFA methodology brings about results in a concise and standardized manner. It is aimed at establishing the status of PFM performance that correlates with an updated understanding of the overall fiduciary

Public Expenditure and Financial Accountability (PEFA) Performance Assessment Report20
environment, identifies the development that has taken place since the previous PEFA assessment in 2013, and provides a credible basis for the preparation of a robust PFM strategy. It informs the PFM initiatives that are supported by development partners, including the European Union, DFID, and the World Bank.
11. The PEFA Assessment covered the budgetary central government fiscal operations including the accountability institutions - the legislature and supreme audit institution. While the extra-budgetary units, corporations and the municipalities were assessed to the extent of the monitoring of the fiscal operations and the fiscal risks. The GoIRA does not have subnational government as defined in the PEFA framework and GFSM 2014 therefore the relevant dimensions are rated ‘not applicable’.
12. The assessment team carried out extensive data collection and consulted with a range of stakeholders, including government officials and development partner representatives. Annex 3B lists the persons consulted and Annex 3C provides the main sources of information. Sources are provided for all data tables, figures, and boxes, and specific references are provided in the main text.
13. The review cutoff date was December 21, 2016. The Afghanistan fiscal year runs from December 22 to December 21. The assessed dimensions were based on the last three completed fiscal years—fiscal years ending December 21, 2014 (SY1393), December 21, 2015 (SY1394), and December 21, 2016 (SY1395). The analysis of the PIs in Chapter 3 is based on the latest data available in each case. The coverage has been clearly indicated under each PI description.

Chapter 1. Introduction 21
14. The assessment was conducted in the following stages:
Table 1.1. Chronology(a) June 18, 2016 Government requests PFM review
(b) April 1, 2017 Approval of Concept Note
(c) July–December 2017 Data gathering
(d) July 23–August 3, 2017 First PEFA Mission
(e) August 3, 2017 Formal launch workshop
(f) October 2–12, 2017 Second PEFA Mission (2 weeks)
(g) October 18, 2017 Raw draft report without scores to validate narratives
(h) November 12, 2017 Comments from the Steering Committee on the narratives
(i) December 11–18, 2017 Third PEFA Mission
(j) December 11, 2017 Workshop on draft report with scores
(k) December 23, 2017 Presentation of full draft report to the Steering Committee
(l) January 10, 2018 Receipt of written comments from the government
(m) January 29, 2018 Submission of the draft report to peer reviewers
(n) February 10, 2018 Peer review (First round)
(o) June 04, 2018 Peer Review second round and decision meeting
(p) June 16, 2018 PEFA Check
(q) July 25, 2018 Government authorization to publish the PEFA Report

Public Expenditure and Financial Accountability (PEFA) Performance Assessment Report22
Chapter 2Country Background Information

Chapter 2. Country Background Information 23
Table of conents (Chapter 2 - Country Background Information)
2.1 Country Economic Situation ........................................................................................................................... 24
2.2 Fiscal and Budgetary Trends ............................................................................................................................ 25
2.3 Legal and Regulatory Arrangements for PFM ........................................................................................... 28
2.4 Institutional Arrangement for PFM ............................................................................................................. 30

Public Expenditure and Financial Accountability (PEFA) Performance Assessment Report24
15. To view the PFM performance measurement in a wider context, Chapter 2 provides information about the core characteristic of the government’s PFM system. This includes the country’s economic, fiscal, and budgetary trends; legal and regulatory framework governing PFM; and institutional arrangements for PFM.
2.1 Country Economic Situation 2
16. Afghanistan is a poor, fragile state, heavily dependent on aid and with a narrow productive base. Afghanistan has experienced civil conflict for over 40 years, with a devastating impact on society, infrastructure, and institutions. Afghanistan’s population of around 36 million is predominantly rural and very young, with an estimated 400,000 Afghans entering the workforce every year. The private sector is extremely narrow, with employment concentrated in low-productivity agriculture (44 percent of the total workforce works in agriculture and 60 percent of households derive some income from agriculture). Economic activity is constrained by political instability, weak institutions, inadequate infrastructure, widespread corruption, and a difficult business environment (Afghanistan was ranked 183rd of 190 countries in the 2017 Doing Business Survey). Foreign grants are currently equal to 37 percent of gross domestic product (GDP).
17. Afghanistan faces daunting challenges in accelerating growth, generating jobs, and reducing poverty. Following a period of rapid economic growth following the fall of the Taliban, Afghanistan has experienced slow growth, increasing poverty, and some declines in access to services since 2014. The economy grew by just 2.6 percent in 2017, following a sluggish growth of 1.3 percent and 2.4 percent in 2015 and 2016, respectively. The recent economic slowdown was driven by reduced demand arising from the drawdown of international security forces, political instability in the wake of contested 2014 elections, and deteriorating security amid a mounting insurgency. While revenue reforms have helped support a balanced budget, and inflation remains stable at around 5 percent, macroeconomic stability remains dependent on aid inflows, which finance 60 percent of the budget, and a trade deficit of around 33 percent of GDP. Poverty is estimated to have increased from 39 percent to 55 percent between 2013 and 2017. The recent influx of returnees from Pakistan and Iran and a large internally displaced population pose additional challenges for livelihoods and access to services.
18. While substantial progress has been achieved since 2001, Afghanistan remains subject to pervasive capacity constraints and institutional weaknesses. Since the fall of the Taliban in 2001, Afghanistan has achieved major progress in building core government institutions and capacity within the public sector. Nonetheless, institutions remain extremely weak, with Afghanistan ranked among the lowest in the world against measures of government effectiveness and prevalence of corruption. While the presence of international advisors in the MoF and other key agencies has been dramatically reduced over recent years, public service remains heavily dependent on local consultant support in the form of National Technical Assistance positions, which fulfill key roles throughout the government but remain outside the civil service structure.
2 The data for this section relies on the Afghanistan Development Update (2017) by the World Bank.
Chapter 2

Chapter 2. Country Background Information 25
Table 2.1. Selected Economic Indicators:2014 2015 2016
GDP (unless otherwise noted)Real economyNominal GDP (AFN, billions)1 1,183 1,228 1,321Nominal GDP (US$, billions)1 20.6 20.0 19.5GDP per capita (US$) 629 593 563Population (millions) 32.8 33.7 34.6Real GDP growth1 2.7 1.3 2.4PricesConsumer price index (CPI) inFlation (period average) 4.6 1.5 4.4External Sector Exports of goods (US$, millions)2 783 667 687Imports of goods (US$, millions)3 8,711 7,867 7,986Trade balance 38.5 36.0 37.5Net current transfers 40.8 40.6 41.7Current account balance 2.3 4.6 4.2Gross foreign exchange reserves (US$, millions) 7,360 6,864 7,255Gross foreign exchange reserves (months of imports) 9.8 9.0 9.5External debt 8.7 9.1 6.5Exchange rate (AFN/US$, period average) 57.4 61.4 67.9MonetaryBroad money 34.9 34.4 35.1Total deposits 16.6 15.9 17.4Credit to private sector, commercial banks 3.8 3.9 4.2
Note: 1. National Accounts data exclude opium value added;
2. Exclude sales of goods to nonresidents in the country;
3. Include estimated unofficial trade or smuggling;
2.2 Fiscal and Budgetary Trends
19. Afghanistan has maintained broadly balanced budgets over recent years. The budget is divided between development and recurrent budgets. Both are funded by a combination of aid and own-source revenues. The under execution of development projects has led to significant volatility in overall budget execution, including donor grants and aid-financed project expenditures. The recurrent budget, however, is typically fully executed, with aid support to the recurrent budget more predictable and less volatile. In 1396, the execution rate was 92 percent for the recurrent bud-get and 67 percent for the development budget. Given the underdeveloped domestic debt market, no access to international commercial debt markets, access to grants from most major donors, and constraints to concessional borrowing under the International Monetary Fund (IMF) program and other donor policies, the budget has generally come close to balance after grants. The overall bud-get balance showed a small surplus in 1395 and 1396 (around 1 percent of GDP) and small deficits in the two preceding years.

Public Expenditure and Financial Accountability (PEFA) Performance Assessment Report26
20. Reforms have driven substantial improvements in revenue performance. Economic and political disruptions in 2014 drove a dramatic deterioration of revenue performance to a low of 8.5 percent of GDP. Since then, revenues have steadily recovered to a new high of 11.9 percent of GDP, driven by a range of reforms. Risk-based audit and the Standard Integrated Government Tax Administration System (SIGTAS), an information technology (IT) system, have been progressively implemented in all major provinces. A revised Income Tax Law was submitted to Parliament in late 2017, reflecting tax policy recommendations from the World Bank and the IMF. Risk-based compliance measures have been introduced in customs leading to a substantial reduction in mis-declarations. Efforts to recover arrears have been intensified, leading to significant recoveries.
21. Afghanistan remains heavily reliant on aid. The growing non-security expenditure reflects the maintenance of current service levels to a growing population, essential infrastructure, and necessary maintenance of aid-financed assets recently transferred to government ownership. If the government can sustain recent improvements in compliance and administration, domestic revenues are projected to reach 12.1 percent of GDP by 2020. A fiscal sustainability analysis undertaken by the World Bank suggests that non-security aid commitments will be sufficient to meet growing expenditure needs, but only if these resources are tightly aligned with government priorities and with a growing proportion delivered through the budget. At current expected aid levels, there is very limited fiscal space over coming years for programs to stimulate aggregate demand and spur increased growth. Any significant decline in aid from the committed levels would have severe consequences for fiscal sustainability.
22. While public debt remains at negligible levels, Afghanistan is classiFied at ‘high’ risk of debt distress under the World Bank-IMF Debt Sustainability Framework. The most recent World Bank-IMF debt sustainability analysis (DSA) (December 2017) finds Afghanistan at high risk of debt distress despite very low levels of public debt (8 percent of GDP in 2016), nearly all of which is external and comprises mostly highly concessional debt to multilaterals. The ‘high’ risk rating is driven by the inclusion of a customized ‘low grant’ scenario, which illustrates the sensitivity of Afghanistan’s debt sustainability to the continued availability of external grants. The customized scenario illustrates that, despite low levels of debt and no breaches of thresholds under the baseline, Afghanistan’s external debt sustainability remains subject to substantial downside risks, including aid shortfalls, the fragile security situation, political uncertainty, domestic revenue shortfalls, and exchange rate depreciation. Domestic debt currently comprises promissory notes issues by the MoF. Work is ongoing to establish a legal and regulatory framework for the issuance of shariah-compliant domestic bonds (sukuk).

Chapter 2. Country Background Information 27
Table 2.2. Aggregate fiscal Data2014 2015 2016
In percent GDPTotal revenues 24.5 25.6 27.6
Domestic revenues 8.5 10.0 11.6Direct taxes 3.0 3.1 4.0Indirect taxes 3.6 4.2 4.5Nontax revenues 1.9 2.6 3.1Donor grants 16.0 15.6 16.0Security 8.9 8.7 8.0Civilian 7.1 6.9 8.0
Total expenditures 25.4 25.9 26.8Overall balance 0.9 0.3 0.8Overall balance excluding grants 17.0 15.9 15.2Borrowing 0.2 0.1 0.1Change in government deposits 0.8 0.2 0.9
Table 2.3. Functional and Economic Classification of Expenditure2014 (%) 2015 (%) 2016 (%)
General public services 5.9 7.1 11.1
Defense 27.0 25.0 24.3
Public order and safety 18.4 18.0 19.0
Economic affairs 17.6 19.7 19.1
Environmental protection 0.1 0.1 0.3
Housing and community amenities 0.6 0.7 1.1
Health 4.3 4.6 4.6
Recreation, culture, and religion 0.5 0.7 0.8
Education 14.9 14.1 13.1
Social protection 6.5 5.5 6.4
Other 4.1 4.6 0.3
Wages and salaries 49.9 47.9 46.5
Goods and services 28.1 28.9 29.2
Interest and debt service 0.3 0.4 0.5
Subsidies and grants 6.5 6.3 6.9
Acquisition of assets 15.1 16.5 16.9

Public Expenditure and Financial Accountability (PEFA) Performance Assessment Report28
23. Security expenditures continue to dominate the budget, squeezing out expenditure on development priorities accounting for around 43 percent of total expenditures in 2016. Over coming years, an increasing proportion of security expenditure is expected to be delivered on budget. High security needs are placing pressure on development expenditures and basic social services. Low health expenditures reflect the use of a nongovernmental organization (NGO) based delivery model that relies heavily on off-budget aid support. Compensation of employees’ accounts for around 47 percent of total expenditures, with goods and services expenditures and capital investment accounting for 29 percent and 17 percent, respectively.
2.3 Legal and Regulatory Arrangements for PFM
24. The Constitution of the Islamic Republic of Afghanistan (2004) stipulates a unitary system of government. The President is the Head of State and is directly elected to a five-year term, for a maximum of two terms. A Cabinet of Ministers, nominated by the President and endorsed by the Wolesi Jirga (House of People) supports the President in carrying out the executive functions. The Parliament consists of a Lower House (directly elected) and Upper House (appointed by provincial councils, district councils, and the President). Though not provided for in the Constitution, the 2014 formation of the National Unity Government saw the appointment of a Chief Executive Officer, who chairs the Council of Ministers, which deliberates on all government policy issues before the Cabinet.
25. A range of laws, several of which have been recently revised, guides the PFM. The main laws guiding the PFM framework are (a) the Public Finance and Expenditure Management (PFEM) Law (2005), which includes provisions relating to treasury functions, protection of public assets, borrowing and lending, budget preparation and approval, budget execution, amendments of appropriations and allotments, and accounting and control; (b) the Income Tax Law (2005, amended 2017), the Customs Law (2005), and the Tax Administration Law (2016), which provide the legislative policy and administrative basis for taxation; (c) the Procurement Law (2017), which guides all procurement activities; (d) the State-Owned Enterprise Law (Tassady Law) (2005), which establishes the definition and governance arrangements for SOEs; (e) the Supreme Audit Office Law (2013), which establishes the legislative basis and role of the SAO; and (f) the Civil Service Law (2008), which provides the legal framework for the administration of the civil service. Recent changes to the legislative framework for PFM include (a) the new Tax Administration Law (2016), which provides a legislative basis for tax administration and (b) revisions to the Income Tax Law (2017), which introduce a range of policy changes to reduce compliance costs.
26. A range of legal and regulatory arrangements has been established to maintain internal control. Initial pre-audit control is established through a system of Financial Controllers in budgetary units. The PFEM Law mandates the establishment of Internal Audit Departments in all ministries and state agencies. As described in the following table, control in procurement is provided through the provisions of the Procurement Law and centralization of high-value procurement functions with the National Procurement Commission (NPC). SAO conducts external audit as mandated by its law.
27. Information to support control is provided by the Afghanistan Financial Management Information System (AFMIS) - a customized Integrated Financial Management Information System based on Freebalance. AFMIS records accounting transactions for all primary and secondary budgetary units. Different levels of authority are granted to access and use AFMIS to ensure data integrity.

Chapter 2. Country Background Information 29
Table 2.4. Legislative and Regulatory Framework for PFM
PFM Areas Constitution Laws Rules, Regulations, and GuidelinesPlanning • Afghanistan National Peace and Development
Framework (ANPDF), 2017–21
Budgeting Article 98 PFEM Law (2005). Chapters 6, 7 and 8, Articles 27, 29, 30, and so on
• Budget Manuals• Budget call circular and budget guidelines• Annual budget workshops• Provincial budgeting policy
Intergovernmental fiscal relations
• Provincial Budgeting Policy
Revenue functions Article 42 Income Tax Law, Tax Administration Law, and PFEM Law
• Income Tax Manual• Tax Administration Manual• Ruling referring to enforcement• Regulation on Tax Administration Law• Tax Accountants Ruling Law• Ruling on Collecting Rental Property Tax• Ruling on Implementation of Article 35 of Tax
Administration Law• Ruling on Distribution and Presenting of Tax
Return
Budget execution PFEM Law (Articles 48–49)
• Financial Regulations: Articles 28, 29, 30, 33, 34, and 40
Accounting Article 98 PFEM Law (Articles 53–55)
• Financial Regulations: Articles 4, 5, 7, 46, 49, 58, 59, 60, and 79–96
• Accounting Manual
Internal control PFEM Law (Article 62)
• Financial Regulations: Articles 7, 8, 9, 10, 11, 12, 44, 45, 50, 52, and 53
• Accounting Manual
Internal audit PFEM Law • Public Expenditure and Financial Regulation• Revenue Audit Manuals• Treasury Audit Manual• Custom Audit Manual• Mustofiat Audit Manual• IT Audit Manual• Follow-up Audit Manual• Quality Assurance Audit Manual• Process Audit Manual• Project Audit Manual
Budget reporting and monitoring (accountability)
PFEM Law (Article 54)Budget 1396, Budget execution guideline (Article 31)
• Accounting Manual
Procurement Afghanistan Procure-ment Law (2017)
• Public Procurement Rules, Circulars, and Man-ual
Debt management Article 90(3), Article 97, and Article 98
PFEM LawArticles 17–21
• Financial Regulations: Articles 62–69• Accounting Manual
Asset management • Financial Regulations: Articles 70–78• O&M Policy• Auction procedures
Treasury functions Article 42 and Article 75(4)
PFEM LawArticles 7, 8, 9, 10, 11, 13, 14, and 15
• Financial Regulations: Articles 4, 29, 30, 38, 39, 43, 45, 55, 56, 57, 58, 60, 61, and 82
Performance monitoring
• Program budget structure and related budget manuals
External audit SAO Law (2013) • SAO Regulations and Audit Manual

Public Expenditure and Financial Accountability (PEFA) Performance Assessment Report30
2.4 Institutional Arrangement for PFM
28. There are 64 primary budget entities in Afghanistan. These include 26 ministries; 2 constitutional agencies (Office of the President and the Supreme Court); and 36 councils, committees, offices, and independent agencies. The subnational government consists of 34 provinces, 376 districts, and 165 municipalities, which have very limited tasks and funds. The provinces, districts, and the municipalities are not budget entities and—at the review date—did not receive any grants or subventions from the central government. Public investments initiated at the provincial level are the responsibility of the respective line ministries (LMs) and approved through the central budget process. Afghanistan has 36 financial SOEs, 16 SOCs, and three state-owned commercial banks. All SOEs are 100 percent state-owned, while the government holds varying shares in SOCs. SOE and SOC revenues account for around 4.5 percent of GDP and provide less than 10 percent of government revenues.
29. The Constitution outlines overall responsibilities for the budget. The Constitution stipulates that the budget will be prepared by the government and approved by the Parliament. The Constitution also provides for temporary appropriations in the event of delays in approval of the budget. The Rules of Procedure of the Mesharano Jirga (House of Elders/Senate) and the Wolesi Jirga (House of People) provide for the legislative scrutiny of the budget and oversight on fiscal operations through the Commission on Finance, Budget, Public Accounts, and Banking Affairs in the House of People and the Commission on National Economic, Finance, Budget, and General Accounts in the Senate.
30. The MoF plays a key role in the budget process and the PFM system. The MoF is structured under four Policy Areas, each of which is assigned to a Deputy Minister who is appointed directly by the President. There is at least one General Directorate under each Policy Area. The four Policy Areas are: Finance (responsible for budget and treasury functions); Revenues and Customs (responsible for customs, revenue, and revenue planning); Policy (responsible for macro-fiscal policy and performance monitoring); and Administration (responsible for the SOEs, government properties, human resources [HR], coordination, state printing, insurance, and other administrative matters). The Afghanistan Revenue Department (ARD) is responsible for the collection of income tax, sales tax, and fixed taxes, while the Afghanistan Customs Department (ACD) collects customs duties. The General Directorate of Budget is responsible for the budget processes, including budget commencement, budget proposal reviews, budget proposal consolidation, and its submission to the Parliament for legislative scrutiny. There are two directorates responsible for budget policy and preparation and budget execution. The General Directorate of Treasury manages the treasury functions with its extended offices in the provinces called mustofiats. The Finance controllers (employees of the Treasury or mustofiats) posted in the line ministries (LMs) provide the pre-audit controls of all accounting transactions. The Special Disbursement Unit (SDU) within the Treasury Directorate is responsible for processing payment requests for donor grants/loans and accounting thereof. The MFPD prepares fiscal strategies and monitors the current FPIP.
31. The Ministry of Economy (MoEc) plays a role in economic planning and project appraisal. The MoEc provides the strategic direction for economic development. It is a coordinating body for the Sustainable Development Goals (SDG) and other international commitments for

Chapter 2. Country Background Information 31
regional economic integration and development. MoEc is also mandated to oversee the public sector development portfolio of the LMs and plays a complementary role to the MoF in the appraisal of the budget proposals and monitoring and evaluation (M&E) of the public sector investment portfolio.
32. Procurement and external audit functions are undertaken by dedicated agencies. The National Procurement Authority (NPA) is the procurement policy-making, monitoring, and facilitation body and acts as a secretariat to the NPC. The NPC holds the responsibility to review and approve contracts above specified thresholds. (Different thresholds have been set for services, goods, and works, depending on the applied procurement method.) For procurements below the threshold, the procuring entities carry out the procurement function.
33. The SAO is responsible for external audit. The SAO audits Government Financial Statements, conducts regular compliance audits, and has recently begun a program of performance audits in key sectors/functions.
Table 2.5. Structure of the Public Sector
2017
Number of Entities and Financial TurnoverGovernment Sub-sector Social
SecurityFinancial Public Corporations*Budgetary Units Extrabudgetary
Units
Central government
64
(AFN 429 Billion)
6 social protection sections (AFN 15 Billion)
22 government financial enterprises and 13 corporation
Provinces (Wolayat)
3414 government financial enterprises and 3 corporations
Districts (Uluswali)
3763 None
Municipalities 1654
1 financial enterprise, Makroryan Maintenance Enterprise, belongs to the Kabul Municipality (KM)
Note: The list is prepared from various sources. Fiscal transfers do not take place to provinces rather are centrally managed through de-concentrated units. Consolidated and complete information not available, PI 6 and 10 rating reflects the gaps.
34. Table 2.6 and 2.7 provides the financial position of the overall public sector. Afghanistan is a unitary form of government with highly centralized system therefore transfers to and from other units is not applicable. The funding to municipalities is contingent to legal provisions and takes the form of budget allocations like any other budgetary unit than intergovernmental fiscal transfers. The own source revenues of the municipal governments remains outside the central government fiscal operations.
3Official number of districts is 376 but 10 additional districts are not yet officially recognized (source: IDLG).4In total there are 200 municipalities (33 provincial and 167 district) but only 165 (33 provincial and 132 district) are functional and have approved budget (source: IDLG).

Public Expenditure and Financial Accountability (PEFA) Performance Assessment Report32
TABLE 2.6: Financial structure of central government—budget estimates (in AFN 000)
Year 1396Central Government
Budgetary Unit Extrabudgetary Units
Social security funds
Total aggregated
Revenue 436,940,910 Not Available Not Available 436,940,910
Expenditure 429,308,272 Not Available 15,298,484 444,606,756
Transfers to (-) and from (+) other units of general government
Not applicable
Liabilities Cumulative data not available
Financial assets
TABLE 2.7: Financial structure of central government—Actual Expenditure (in AFN 000)
Year 1396Central Government
Budgetary Unit Extrabudgetary Units
Social security funds
Total aggregated
Revenue 353,783,014 Not Available Not Available 353,783,014
Expenditure 316,123,302 Not Available 14,664,179 330,787,481
Transfers to (-) and from (+) other units of general government
Not applicable
Liabilities 110,713,867 Not Available Not Available 110,713,867
Financial assets 75,484,670 Not Available Not Available 75,484,670
Financial assets Cumulative data not available
2.5 Other Key Features of PFM and Its Operating Environment
35. The PFM system is highly centralized. There is limited delegation from the central government to frontline service units and an excessive duplication of effort aimed at ensuring control. This introduces redundancy and delays and limits the autonomy of line agencies in responding to local realities and demands. Recent work on the Provincial Budgeting Policy aims to allow for increased bottom-up input on budget allocation decisions, but the policy remains in its early stages of implementation.

Chapter 2. Country Background Information 33
36. Overall, rule of law is weak and individuals cannot always be held to account. Afghanistan is ranked 177th out of 180 countries in the global Corruption Perceptions Index. Traditional governance mechanisms are relied on to mediate disputes and provide justice across much of the country. Political and economic elites have historically escaped sanction for corruption and theft. The government is committed to reducing corruption and strengthening the rule of law. Corruption has recently been criminalized through additions to the criminal code. Asset declaration measures have been introduced. A National Strategy for Combating Corruption was recently approved. The High Office of Oversight and Anticorruption (HOOAC) is the highest office for the coordination and monitoring of the implementation of the Anticorruption Strategy and for the implementation of administrative procedural reform in the country. This office is independent in carrying out its duties and reports directly to the President.
37. MoF’s budget planner includes a schedule for interactions with the Civil Society Organizations (CSOs) and the media. In this regard, MoF holds consultations to share the budget priorities at the budget formulation stage. However, open budget survey identifies gaps with respect to incorporation of CSOs feedback in the budget as the interaction is largely for information only. The citizen’s budget is prepared to present the government’s fiscal plans for achievement of the development objectives in a simplified way. The timely public disclosure of the budget proposals and enacted budgets, and the recent enactment of the right to information act have facilitated public fiscal disclosures.
38. An ambitious PFM reform agenda is underway. In September 2015, GoIRA issued a new strategy for PFMR II. The strategic vision of PFMR II is ‘to possess a PFM system that will demonstrate fiscal sustainability and discipline, strategically allocate resources to national priorities, and be driven by a performance management culture’. PFMR II is underpinned by a detailed five-year rolling plan for implementation called the Fiscal Performance Improvement Plan (FPIP). The FPIP utilizes a team-based performance management approach under which broad targets are established for the program (primarily articulated in terms of improved ratings against PEFA and other benchmark indicators), and specific reform actions and key performance indicators (KPIs) are articulated at the level of individual teams. Policy details of the reform plan are presented in Chapter 5.

Public Expenditure and Financial Accountability (PEFA) Performance Assessment Report34
Chapter 3Assessment of PFM Performance

Chapter 3. Assessment of PFM Performance 35
Table of conents (Chapter 3. Assessment of PFM Performance)
Pillar I: Budget reliability..................................................................................................................................................... 37
PI-1 Aggregate expenditure outturn.....................................................................................................................37
PI-2 Expenditure composition outturn................................................................................................................ 39
PI-3 Revenue outturn.................................................................................................................................................. 40
Pillar II: Transparency of public Finances..................................................................................................................... 43
PI-4 Budget classification.......................................................................................................................................... 43
PI-5 Budget documentation..................................................................................................................................... 45
PI-6 Central government operations outside financial reports................................................................. 47
PI-7 Transfers to subnational governments....................................................................................................... 48
PI-8 Performance information for service delivery.......................................................................................... 50
PI-9 Public access to fiscal information............................................................................................................... 53
Pillar III: Management of assets and liabilities................................................................................................ ........ 55
PI-10 Fiscal risk reporting............................................................................................................................................. 55
PI-11 Public investment management................................................................................................................... 58
PI-12 Public asset management............................................................................................................................... 60
PI-13 Debt management............................................................................................................................................. 62
Pillar IV: Policy-based fiscal strategy and budgeting.............................................................................................. 64
PI-14 Macroeconomic and fiscal forecasting....................................................................................................... 64
PI-15 Fiscal strategy........................................................................................................................................................ 66
PI-16 Medium-term perspective in expenditure budgeting......................................................................... 67
PI-17 Budget preparation process............................................................................................................................ 68
PI-18 Legislative scrutiny of budgets....................................................................................................................... 71
Pillar V: Predictability and control in budget execution........................................................................................ 73
PI-19 Revenue Administration................................................................................................................................... 73
PI-20 Accounting for revenue..................................................................................................................................... 77

Public Expenditure and Financial Accountability (PEFA) Performance Assessment Report36
PI-21 Predictability of in-year resource allocation............................................................................................. 79
PI-22 Expenditure arrears............................................................................................................................................ 81
PI-23 Payroll controls...................................................................................................................................................... 83
PI-24 Procurement management............................................................................................................................. 84
PI-25 Internal controls on non-salary expenditure........................................................................................... 89
PI-26 Internal audit......................................................................................................................................................... 91
Pillar VI: Accounting and reporting................................................................................................................................ 93
PI-27 Financial data integrity...................................................................................................................................... 93
PI-28 In-year budget reports....................................................................................................................................... 94
PI-29 Annual financial reports................................................................................................................................... 96
Pillar VII: External scrutiny and audit........................................................................................................................... 97
PI-30 External audit........................................................................................................................................................ 97
PI-31 Legislative scrutiny of audit reports............................................................................................................. 99

Chapter 3. Assessment of PFM Performance 37
39. This chapter details the assessment of the key elements of the PFM system based on 31 PIs clubbed under 7 pillars and, where applicable, reports on the progress made in improving the key elements. The PIs are assigned ratings of ‘A’ to ‘D’ based on the scoring criteria for each indicator defined as follows:
A Represents performance that meets good international practice; the criteria for the indicator are met in a complete, orderly, accurate, timely, and coordinated way.
B Represents a level of performance ranging from good to medium by international standards.
C Represents a level of performance ranging from medium to poor.
D Indicates either that a process or procedure does not exist at all or that it is not functioning effectively.
Pillar I: Budget reliability
40. Pillar I assesses whether the government budget is realistic and implemented as intended. Realism and reliability underpin good fiscal management and are essential for long-term fiscal sustainability. Implementing the budget as approved portrays the government’s ability to de-liver public services as expressed in the budget. This pillar assesses the credibility of the budget by calculating the extent to which actual aggregate expenditure deviates from the original budget for the last three years of available data (including expenditures financed externally by grants reported in the budget, contingency votes, and interest payments).
PI-1 Aggregate expenditure outturn
41. This indicator measures the extent to which aggregate budget expenditure outturn reflects the amount originally approved, as defined in government budget documentation and fscal reports.
Indicator/Dimensions Scores Explanation
PI-1 Aggregate expenditure outturn D
Aggregate expenditure outturn was 70.3%, 73.1%, and 79.6% of the original approvd budget in the fiscal years 2014, 2015, and 2016 (equivalent to solar years 1393, 1394, and 1395, respectively).
42. The core budget of GoIRA consists of (a) operating budget; and (b) development budget. The operating budget is presented based on appropriations to primary budgetary units (ministries, agencies, and other entities) for the major economic codes5 and consists mainly of wages and salaries, goods and services, and contingencies. The development budget is presented and appropriated based on projects to each primary budget unit and consists of acquisition of assets and goods and services. It includes discretionary6 projects (funded from GoIRA’s own revenues) and nondiscretionary projects (funded by donors) and some contingency items.
5 Code 21- wages and salaries; Code 22 - services and goods; Code 25 - acquisition of assets. Funding under Code 23 (interests & repayments of loans) and Code 24 (subsidies, grants, and social benefits) is appropriated as contingency items in budget, and funding becomes available when the budgetary units request reallocation during the fiscal year.
6 In an effort to channel foreign grants through national systems, few foreign grants allow full discretion to GoIRA.
Chapter 3

Public Expenditure and Financial Accountability (PEFA) Performance Assessment Report38
43. Actual and originally budgeted expenditure data are summarized in Table 3.1. The assessment is based on the budget and actual expenditure for SY1393 (FY2014), SY1394 (FY2015), and SY1395 (FY2016).
Table 3.1. Total Budget and Actual Expenditure SY1393 (2014) SY1394 (2015) SY1395 (2016)
Budget (AFN in thousand) 428,378,639 436,172,870 444,606,756
Actual (AFN in thousand) 300,986,114 318,798,014 353,783,014
Aggregate outturn (percentage) 70.3 73.1 79.6
Composite variance by administrative head (percentage) 36.0 19.6 20.1
Composition variance by economic classification (percentage)
30 28.5 23.7
Absolute deviation 108,292,320 62,493,106 70,876,011Source: MoF Treasury Department Approved Budget and Audited Financial Statements.
44. Table 3.1 shows aggregate expenditure outturn was 70.3 percent, 73.1 percent and 79.6 percent in the three years assess respectively. The results of the three years under review were not influenced by any natural disaster or other unexpected macroeconomic shocks; however, the ongoing security situation and the unpredictability of international finances for development were the key contributing factors affecting the expenditure outturns. Owing to more than 15 percent variation in the outturns during the review period, the indicator is scored ‘D’.
45. The expenditure outturn became more acute after 2013. The long drawn Presidential elections and the security transition immensely influenced the budget performance. In 2015 and 2016, unpredictability of the foreign inflows, withdrawal of the technical advisors and the precarious security situation were the key contributing factors to lower expenditure outturns.
Source: PEFA reports and MoF budget books. * The government changed the fiscal year; as a result, 2012 was shortened to nine months in a fiscal year.
46. GoIRA has taken measures for improving PFM with strategy and policy formulation that will contribute towards budget credibility. The reform measures adopted are relatively comprehensive, and with a focus on improving the procedural deficits, strengthening systems and capacity particularly at the LMs will reap dividends for GoIRA’s reform efforts. The current approach adopted by GoIRA for strengthened monitoring of PFM and the ancillary practices enunciated in the FPIP are expected to contribute towards budget credibility.

Chapter 3. Assessment of PFM Performance 39
PI-2 Expenditure composition outturn
47. This indicator measures the extent to which reallocations between the main budget categories during execution have contributed to variance in expenditure composition.
Indicator/Dimensions Scores ExplanationPI-2 Expenditure composition outturn D+ Overall rating based on M1 methodology
2.1 Expenditure composition outturn by function
D
Variance in expenditure composition by program, administrative or functional classification was 36%, 20%, and 20% in fiscal years 2014, 2015, and 2016, respectively.
2.2 Expenditure composition outturn by economic type
DVariance in expenditure composition by economic classification was 30%, 29%, and 24% in fiscal years 2014, 2015, and 2016, respectively.
2.3 Expenditure from contingency reserves CActual expenditure charged to a contingency vote was on an average 9% of the original budget.
2.1 Expenditure composition outturn by function
48. This dimension measures the variance between budgeted and actual expenditure at the disaggregated ministry/department/agency level. It compares the composition of the approved budget with actual expenditures by budget entities of GoIRA. Complete working tables on expenditure composition outturn by budget entities for each of the last three completed fiscal years are in Annex 5. For this calculation, the contingency reserve and interest payments are netted from the MoF.
Table 3.2. Results Matrix
Year Total Expenditure Deviation (%) Composition Variance (Program Classification) (%)
2014 70.3 36
2015 73.1 20
2016 79.6 20
49. Variance in expenditure composition by administrative classification ranged between 20 percent and 36 percent during the last three completed fiscal years. The dimension is scored ‘D’.
2.2 Expenditure composition outturn by economic type
50. Expenditure composition is measured with regard to the composition of the approved budget by economic category as compared to the composition of actual expenditures. The complete working table on expenditure classification variance for each of the last three completed fiscal years is in Annex 5. Variance ranged between 24 percent and 30 percent during the last three completed fiscal years and the dimension is scored ‘D’. The weak score here is a cause of concern because the wages and salaries budget that consumes a considerable size is a relatively straightforward calculation and predictable and yet results in significant variation at the budget execution stage.

Public Expenditure and Financial Accountability (PEFA) Performance Assessment Report40
Table 3.3. Results Matrix
Year Composition Variance (Economic Classification) (%)
2014 30
2015 29
2016 24
2.3 Expenditure from contingency reserves
51. The PFEM Law, Article 32, states that the appropriation for contingencies should not exceed 3 percent of total planned expenditures. The Financial Regulation No. 873 includes rules regarding contingencies and policy reserves, and Sections 3.2 and 3.3 require the MoF to issue allotment advice related to these resources. The following, among others, are required: (a) contingency reserve (a state of emergency has been declared for the country or affected area) and/or (b) policy reserve (the expenditure is urgent and could not be predicted before the budget was adopted by the Parliament).
52. Contingency included in the budgets for SY1393 (2014), SY1394 (2015), and SY1395 (2016) accounted for 5 percent, 2 percent, and 4 percent, respectively, of the budgeted expenditure for each year. However, the actual contingency share was 9 percent, 7 percent, and 11 percent of the total budget expenditure in the respective years (See as indicated in Table 3.4).
53. The contingencies in all three years were not used for emergency purposes or for urgent and/or unpredicted reasons. They were appropriated to specific organizational codes, based on requests from the LMs and approved by the MoF. The contingency share in each of the three assessed years exceeded the provision in the PFEM Law, Article 32, of maximum appropriation of 3 percent of total expenditures. The dimension is scored ‘C’.
Table 3.4. Budgeted and Actual Contingency ReservesFiscal Year for Calculation of Contingency Share of Budget
- PI-2.3
Total Budgeted Expenditure
(AFN)
Budgeted Contingency
(AFN)
Actual Contingency
(AFN)
Contingency Share (%)
SY1393 (2014) 428,378,539 20,922,000 36,844,015 9
SY1394 (2015) 436,172,870 9,242,000 31,749,391 7
SY1395 (2016) 444,606,756 15,602,026 48,795,158 11
Average for 3 completed fiscal years 9Source: Total budgeted expenditure and budgeted contingency extracted from approved budget. Actual contingency pro-vided by the Budget Policy Unit in the MoF.
PI-3 Revenue outturn
54. This indicator measures the change in revenue between the original approved budget and end-of-year outturn.

Chapter 3. Assessment of PFM Performance 41
Indicator/Dimensions Scores ExplanationPI-3 Revenue outturn D Overall rating based on M2 methodology3.1 Aggregate revenue outturn
DActual revenue collection was 66%, 58%, and 76% of budgeted reve-nues in the fiscal years 2014, 2015, and 2016, respectively.
3.2 Revenue composition outturn
DVariance in revenue composition was 23%, 44%, and 23% in fiscal years 2014, 2015, and 2016, respectively.
55. This indicator, according to the PEFA Framework (2016), includes both domestic and external sources. The revenue components considered in assessing this PI are listed below. Data on revenue estimates is based on the original approved budget and actual revenue collection is based on the audited financial statements from the SAO.
3.1 Aggregate revenue outturn
56. Revenue outturn measures the total value of all revenues received compared to the original budget plan. The revenue budget and outturn for the last three completed years is shown in Table 3.5. The overall variance was between 66 percent and 76 percent in SY1393, SY1394, and SY1395 (FY2014, FY2015, and FY2016, respectively). The dimension is scored ‘D’. (For calculation sheets, refer Annex 5).
SY1393 (2014) SY1394 (2015) SY1395 (2016)Budget Actual Budget Actual Budget Actual
Total revenue (AFN)
407,528,970 268,230,480 424,616,916 245,168,051 436,940,910 330,787,481
Actual as % of budget
66 58 76
Revenue composi-tion outturn (%)
23 44 23
Income, profits, and capital gains Payroll and workforcePropertyGoods and services
Grants from foreign governmentsInternational organizationsOther government units
Property incomeSale of goods and services Fines and penaltiesInternational trade and transactions
TaxesNon-tax Revenue
Grants Social security contributions

Public Expenditure and Financial Accountability (PEFA) Performance Assessment Report42
3.2 Revenue composition outturn
57. Revenue composition is measured with regard to composition of the approved budget by revenue type as compared to the composition of actual revenues received. Revenue by type and composition variance for each of the last three completed fiscal years is shown in Annex 5.
58. During the period under review, the budgeted revenue targets showed considerable variation; therefore, the dimension is scored ‘D’. The indicator rating has largely been influenced by the trend in the foreign inflows. The volatility in external grants manifests the needs for improving the government’s own-source revenues that would allow greater autonomy and predictability in the use of funds.
59. Thevariationinthedomesticrevenuecollectionwassizeableinthefirstyearlargelyowing to the impact of the long-drawn Presidential election process and security transition. In the subsequent two years the variation in the domestic revenue collection receded in comparison with the foreign grants that displayed volatility in all three years in terms of actual funds availability. The relatively greater volume and large variation in the external grants affected the overall performance.
Figure 3.2. Aggregate Foreign Grants and Domestic Revenue Outturns
Source: Calculation sheets of PI-3.
60. The domestic revenue outturns in the years 2015 and 2016 was under 5 percent, indicating improvements in the revenue planning and collection. However, it does not imply that the revenue potential has been achieved; rather, gaps remain evident from the six years’ year-on-year trend (Figure 3.3). In the PEFA review period (2014–16), variation in the indirect taxes and other revenues had a particularly high outturns trend but are overshadowed owing to its small volume of collection in relation to the direct taxes and the customs duty. The taxes on property are constantly and considerably under budgeted. USIP 7 (2016) reports the market saturation particularly in the large taxpayers and subsequent increase in tax collection will largely depend on the revival of economic activity. In a situation fraught with the risk of declining aid inflows, lean financial sector and increasing expenditure needs, tapping all revenue sources would be vital for augmenting domestic revenues.
7 United States Institute of Peace (2016), https://www.usip.org/sites/default/files/PB201-Afghanistans_Revenue_Turn-around_In_2015.pdf

Chapter 3. Assessment of PFM Performance 43
Figure 3.3. Domestic Revenue Composition Trend (as % of Total Revenue)
Source: Calculation sheets of PI-3.
Pillar II: Transparency of public Finances
61. Pillar II assesses the comprehensiveness, accessibility, and consistency of the PFM-related information. This is achieved through comprehensive budget classification; the transparency of all government revenue and expenditure, including intergovernmental transfers; published information on service delivery performance; and ready access to fiscal and budget documentation.
62. Improved transparency supports the achievement of desirable budget outcomes by giving the legislature and citizens the information they need to hold the executive accountable for budget policy decisions and for the management of public funds more generally. Greater transparency enables stakeholders to examine whether the resources provide value for money. Comprehensive information is necessary to provide a complete and accurate picture of public finances, enabling decision makers and other stakeholders to make balanced and well-informed judgments. If important information is not made available, it could lead to biased and poorly informed decisions.
PI-4 Budget classification
63. This indicator assesses the extent to which the government budget and accounts classification system is consistent with international standards. The assessment is based on the classification system used in the FY1395 (2016) for budget estimates, in-year budget execution reports and audited annual financial statements, as the last completed fiscal year.

Public Expenditure and Financial Accountability (PEFA) Performance Assessment Report44
Indicator/Dimensions Scores Explanation
PI-4 Budget classification C Budget formulation, execution, and reporting are based on administrative, program, and economic classification using the GFSM 2001 classification standards. The Chart of Accounts is yet to be updated to comply with GFSM 2014.
Functional classification has been adopted and will be used for SY1397 (2018) when there is a dedicated functional classifica-tion.
There is a Chart of Accounts showing the structure that is not supported by detailed explanations for the codes.
The Chart of Accounts was last revised in 1395; however, is not fully compliant with the GFSM 2014.
64. The Chart of Accounts has six segments and 60 digits at the core. In addition to these core segments, which are used for planning and classifying all transactions in the budget and accounts, the Chart of Accounts has no dedicated functional classification and no spare segments. The Chart of Accounts, maintains a certain structure of adherence to international standards (Table 3.6).
Table 3.6. Chart of Accounts StructureSegment Sub segment Digits
Fund
Fund type 1
Fund 2
Sub-fund 4
Fund componenet 5
Organization Ministries and independent agencies 2
Sub-organization 4
Unit 5
ProgramProgram 3
Subprograms 4
Activities 5Project Project 6
Location Provinces 2
Districts 4
Object (economic)
Major (account class) 2
Sub-major (item) 3
Minor (subitem) 3
Object (sub-subitem) 5Total digits 60
65. Ministries, departments, and agencies formulate and present their budgets based on guidelines issued by the MoF using integrated forms that have economic codes of five digits. There are separate forms for revenue that are also completed. For the provinces, there are also separate forms with economic codes for operating and development budgets.
66. The Chart of Accounts captures general government budget and expenditure, including provinces and municipalities as well as development expenditure. Budget

Chapter 3. Assessment of PFM Performance 45
formulation and presentation use administrative, economic, and program classification without functional classification (Table 3.7). Funding sources for development projects were presented using administrative classification. The dimension is Scored ‘C’.
Table 3.7. Classification Used in Key Financial ResourcesAdministrative Economic Functional Program
Budget Estimates a a r a
Execution Reports a a r a
Financial Statements a a r a
Chart of Accounts a a r aSource: GoIRA Budget 1396
PI-5 Budget documentation
67. This indicator assesses the comprehensiveness of the information provided in the annual budget documentation. The assessment is based on the documentation for the SY1396 (2017) budget, which was the last budget presented to the Parliament.
Indicator/Dimensions Scores Explanation
PI-5 Budget documentation C GoIRA provides 3 basic elements and 2 additional elements (Details in Table 3.8)
68. Article 30 of the PFEM Law provides that the annual budget prepared by the MoF include budget overview information, a revenue and expenditure plan, assets and expenditure commitments information, and draft annual budget procedures. Additionally, it is further provided in Articles 31–33 to include information about the economic environment, budget deficit, deficit financing, and debt (loans, guarantees, and contingent liabilities). The comprehensiveness of the information included in the SY1396 (2017) budget documents in terms of PI-5 is shown in Table 3.8.
Table 3.8. Status of Information Provided in the Budget DocumentationItem Status Source and Comments
Basic elements
1Forecast of fiscal deficit or surplus or accrual operating result
YesBudget speech/approved estimates of revenue and expen-diture
2Previous year’s budget outturn, presented in the same format as the budget proposal
YesPrevious year’s budget outturn, presented in the same format as the budget proposal
3
Current year’s budget pre-sented in same format as the budget proposal. This can be either the revised budget or the estimated outturn.
No
Both in the budget speech and in the approved estimates of revenue and expenditure

Public Expenditure and Financial Accountability (PEFA) Performance Assessment Report46
Item Status Source and Comments
4
Aggregated budget data for both revenue and expenditure according to the main heads of the classifications used including data for the current and previous years with a detailed breakdown of revenue and expenditure estimates Yes
The National Budget (1396) includes aggregate-level main revenue type data segregated by tax, non-tax, other domestic resources, and grants for the budget year (1396), the prior year (1395), and three projected years. (Reference budget decree 1396; page 6 [revenue outlook]; page 8 [MTBF], page 68 [MTFF Table 1 and Table 6]). Operating budget at aggregate major economic code-wise (for three projected years) and at the ministry level (for the budget year) is presented without further details. Aggregate development expenditure budget data are presented for three outer years at the aggregate level while the project-level and ministry-level data are presented for the budget year and the prior year only without further details. (Refer to Table 8, 1396 budget.) Revenues from extractive industries are shown separately as a one-line item.
Additional elements
5
Deficit financing, describing its anticipated composition
No
Presented in the budget speech and approved budget estimates without a description of its composition and financing.The deficit amount is shown in the budget document but does not include the financing plan.
6
Macroeconomic assumptions, including at least estimates of GDP growth, inflation, interest rates, and the exchange rate
Included in the Budget Statement is the Macroeconomic Policy Framework as part of the Background to the Bud-get—GDP growth rate, inflation, and interest rates. Exchange rate projections were excluded from the SY1396 Framework.
7
Debt stock, including details at least for the beginning of the current year, presented in accordance with GFS or other comparable standard
No
The national budget includes the debt management report covering the commitments, the debt stock at the beginning of the period, the repayments during the year, the currency valuations, and the debt stock at the end of the period. However, the report included in the budget (1396 and 1397) was only for the second quarter of each fiscal year; therefore, the status is not complied with.
8
Financial assets, including details at least for the beginning of the current year, presented in accordance with GFS or other comparable standard
No
Only cash and cash equivalents are presented in the budget but other financial assets such as receivables and investments in the extrabudgetary units are not included.
9
Summary information of fiscal risks, including contingent liabilities such as guarantees, and contingent obligations embedded in structured financing instruments such as PPP contracts, and so on
No
Not presented

Chapter 3. Assessment of PFM Performance 47
Item Status Source and Comments
10
Explanation of budget implications of new policy initiatives and major new public investments, with estimates of budgetary impact of all major revenue policy changes and/or major changes to expenditure programs
No
The effect of new policies on public finances is not discussed or published.
11Documentation on the medium-term framework.
YesBudget speech, MTBF - Macro-fiscal Outlook for SY1396–1399
12Quantification of tax expenditures
NoNot presented
Source: MoF.Note: GFS = Government Financial Statistics; MTBF = Medium-term budgeting framework; MTFF = Medium-term fiscal
framework; PPP = Public-private partnerships.
69. Budget documentation fulfills three basic elements and two additional elements as shown earlier. The dimension is scored ‘C’.
PI-6 Central government operations outside financial reports
70. The indicator measures the extent to which government revenue and expenditure are reported outside central government financial reports.
Indicator/Dimensions Score ExplanationPI-6 Central government operations outside financial reports
D Overall rating based on M2 methodology
6.1 Expenditure outside financial reports
D* GoIRA does not have a mechanism to determine the exact size of expenditure outside financial reports for the extra budgetary units and the expenditure of externally funded off-budget projects.
6.2 Revenue outside financial reports D* GoIRA does not have a centralized mechanism to determine the exact size of the revenue outside fiscal reports.
6.3 Financial reports of extra-budget-ary units
D Detailed financial reports of extra budgetary units are not submitted to the government annually within 9 months of the end of the fiscal year.
71. The categorization of extra budgetary units according to the domestic laws is not in sync with the PEFA Framework. The MoF describes entities established under Tassady Law 2005 with 100 percent GoIRA capital as extra budgetary units (also referred as SOEs), whereas PEFA Framework adopts the definition of GFSM 2014. The MoF provided a list of entities that they consider extra budgetary units but majority of these entities are commercial organizations that do not meet the GFSM 2014 criteria of extra budgetary unit (for detailed criteria, please refer chapter 2 of GFSM 2014).

Public Expenditure and Financial Accountability (PEFA) Performance Assessment Report48
72. The assessment team was unable to establish the completeness of the extra budget units in Afghanistan. Certain extra budgetary units, which were not included in the list provided by MoF also came to the attention of the assessment team. For example, Afghanistan Telecommunication Regulatory Authority established under an act to regulate the telecom sector is not considered an extra budgetary unit.
6.1 Expenditure outside Financial reports
73. GoIRA does not have a system to establish the exact number and expenditure of extra budgetary units. As a result the size of the expenditure outside financial reports could not be determined therefore the dimension is scored ‘D*’.
6.2 Revenue outside Financial reports
74. According to Article 9 of the PFEM Law (2005), revenues are public money if they are taxes or fees imposed in accordance with the provisions of law or proceeds received from leasing or selling any rights controlled by state administrations, including spectrum rights. The revenues for this dimension include ‘those received by extra budgetary units from budgetary transfers or other revenues, revenue from donor-funded projects, and fees and charges outside the type or amounts approved by the budget’. The complete data to determine the size of revenue outside the government financial reports was not available; therefore, this dimension is rated ‘D*’.
6.3 Financial reports of extra-budgetary units
75. This dimension is assessed based on the available information of the entities listed by the MoF as extra budgetary units. Financial reports of none of the unit were available for review. Therefore, this dimension is rated ‘D’.
PI-7 Transfers to subnational governments
76. This indicator assesses the transparency and timeliness of transfers from the central government to subnational governments with a direct financial relationship. It considers the basis for transfers from central government and whether subnational governments receive information on their allocations in time to facilitate budget planning.
Indicator/Dimensions Score ExplanationPI-7 Transfers to subnational gov-ernments NA Overall scoring based on M2 methodology
7.1 Systems for allocating transfers NA There are no pre-determined transfers from the Treasury to the provinces other than for activities and programs incorporated in the budgets of LMs.Thus, this dimension is not applicable as there are no direct transfers to provinces, districts, and municipalities
7.2 Timeliness of information on transfers
NA Not applicable
Note: NA = Not applicable.
77. Article 1 of the Constitution stipulates a unitary state, and the administrative structure is derived from Article 136 providing for the central administration to be divided into several administrative units, each headed by a Minister. The central administration comprises 64 primary

Chapter 3. Assessment of PFM Performance 49
budget entities in Afghanistan. These include 26 ministries; 2 constitutional agencies (Office of the President and the Supreme Court); and 36 councils, committees, offices, and independent agencies. Currently, there are 34 provinces, 376 districts, 165 municipalities, and 38,600 villages. The provinces, districts, and municipalities are not budget entities and—at the review date—did not receive any grants or subventions from the central government.
78. Article 137, while preserving the principles of the centralism, provides for the transfer of necessary powers to the local administrations to accelerate and improve economic, social, and cultural matters and foster peoples’ participation in developing national life. However, in practice, the de-concentrated units serve as the secondary budget units of the central administration. Article 138 and 140 provide for provincial councils (four-year term) and district and village councils (three-years term) with directly elected members to perform their duties in cooperation with the provincial administration.
79. Article 141 provides for the creation of municipalities to administer city affairs with a directly elected mayor and the members of the municipal council. Effectively, however, most of the service delivery function throughout the country occurs under the provincial directorates/departments of the LMs while municipalities deal with city services and property taxes. 8 The municipalities are governed by the Municipal Law (2000) that accords special status to the KM and, besides the injunctions in the Constitution (2004) for direct elections of the Mayor, the KM enjoys a special legal status because it ranks equivalent to the ministry and the mayor is directly appointed by the President, who serves as a Cabinet-level position. Currently, there are 165 municipalities in Afghanistan including the KM. The municipalities are envisioned as self-sustaining entities with dedicated own source revenues; however, according to Article 15 of the Municipal Law (2000) in the event the municipality cannot finance its operating expenditure from its own revenues for two successive years, the MoF can provide support subject to the President’s endorsement. Financial assistance from the central government to the municipalities’ development plan is envisaged only under exceptional circumstances.
80. The Governor supported with the respective secretariats heads each province. The only reference to the Governor in the Constitution is Article 151 indicating the state functionaries should not engage in any profitable business. In practice, the appointing and removal authority for the Governor is the President.
Table 3.9. Relevance of the Subnational Structure in Afghanistan
Subnational structure
Corporate body (having a legal status to enter into contract and it can sue
and be sued)
Perform public functions within their territorial
jurisdictions
Have their own (often
elected) politi-cal leadership
IAutonomy in Preparing and approval of its own budgets
Provincial Line Directorates
No Yes No No
Governors’ offices No Yes No No
Provincial and District Councils
No No Yes* No
Municipalities Yes Yes No No
Note: * True for Provincial Councils, only KM Mayor is not directly elected.
⁸ Popal, A. B. 2014. “Municipalities in Afghanistan.” Research Paper, [Available at http://dmm.gov.af/Content/files/Municipalities%20in%20Afghanistan_final(1).pdf]

Public Expenditure and Financial Accountability (PEFA) Performance Assessment Report50
7.1 Systems for allocating transfers
81. There is neither a law nor a formal and established system for allocating transfers to provinces, districts, and municipalities. Budgets for provinces and districts are part of the LMs and independent agencies of the central government. Municipalities are independent and have their own revenue sources to finance their expenditure. However, the KM has been receiving grants in development budget from the central budget and donor funding as well. Therefore, this dimension is not applicable.
7.2 Timeliness of information on transfers
82. In line with Dimension 7.1, this dimension is also not applicable.
PI-8 Performance information for service delivery
83. This indicator examines the service delivery performance information in the executive’s budget proposal or its supporting documentation, in year-end reports, and in audit reports or performance evaluation reports. It determines whether performance audits or evaluations are carried out. It also assesses the extent to which information on resources received by service delivery units is collected and recorded.
Indicator/Dimensions Score ExplanationPI-8 Performance information for service delivery D+ Overall rating based on M2 methodology
8.1 Performance plans for service delivery
B GoIRA adopted program-based budgeting and the notified structure allows the budget to include the program ob-jectives, outcomes, and outputs and PIs. This structure is followed across the central government budgetary units. In practice, all but three budgetary units submitted the budget proposal on the notified structure.
8.2 Performance achieved for service delivery
C The information on achievements provided in the budget is largely qualitative and that too in summary form. It lags a link with the performance indicators identified in the prior year’s budget.
8.3 Resources received by service delivery units
D There is no evidence that information on resources re-ceived by frontline service delivery units is collected and recorded.
8.4 Performance evaluation for service delivery
D Independent evaluations and performance audits have been conducted for a few ministries and Kabul municipali-ty in the years 2014, 2015 and 2016.
8.1 Performance plans for service delivery
84. GoIRA adopted program-based budgeting in 2006 on a pilot basis linked with the national development framework (called the Afghanistan National Development Strategy [ANDS] followed by the ANPDF) that provided a strategic direction and facilitated cascading the different budget proposals to an overarching development objective. The issuance of Budget Call Circular 1 (BC-1) triggers the budgeting process, and the LMs are required to specify

Chapter 3. Assessment of PFM Performance 51
their priorities and provide input in terms of the estimated baseline costs and costs of proposed new activities, which aids in the development of the MTFF/Pre-Budget Statement.
85. Subsequently the Budget Call Circular 2 (BC-2) with indicative planning figures is issued by the MoF. The LMs are required to submit detailed budget estimates, accompanied by definitive program and subprogram narratives. These estimates are to be prepared within a budget ceiling, which represents the maximum sum. Once program and subprogram activities have been fully described and costed, they are submitted to the MoF and presented in a budget document. 86. The LMs then draft narratives for the new programs indicating the program objectives, outcomes, and outputs accompanied by PIs for each level. Activities for each subprogram are determined and then costed to determine the cost of each program. For existing programs, a review process is notified, and in case amendments are needed, a similar approach is adopted.
87. All ‘service delivery’ related ministries prepared budgets as notified by the MoF that facilitates the submission of the budget on the structure shown in Table 3.10:
Table 3.10. Performance Elements in GoIRA Budget Structure
Program Key outcomes Indicator BaselineTarget
Projected Year 1
Target Projected
Year 2
Target Projected
Year 3
Key Outputs Indicator YearQuantity (% or #)
Source: National budget (1397) Budget book 3, Annex for outcomes and outputs. Additional information on ministry-wise and province-wise project details and program-specific details are available in the document titled Annex project book,
Budget book
88. The dimension is scored ‘B’ with regard to the inclusion of performance indicators of all but three entities (Budget 1396) for outcomes and outputs in the budget according to PEFA Field guide 8:1:1. However, the specifications of the outputs and outcomes, the performance indicators, the link in the program structure, and activity costing have deficiencies. The budget allocation to the corresponding programs or service delivery is provided in the BC-2 submissions to the MoF. However, the budget documents submitted to the legislature lack this information restraining analytical work like determining whether the planned outputs and outcomes are consistent with the level of budget resources. The source of information and the method of calculation are also not provided for the performance indicators.
8.2 Performance achieved for service delivery
89. The ministry-wise annual performance was presented in the annual budget 1396 in the section ‘1396 budget and 1395 achievements - By sectors (pages 15–30)’. The achievements are categorized sector-wise while ministry-specific details are provided within. The achievements are presented in a narrative form only where the outputs are identified but are not linked to the PIs of the 1395 budget, nor is a separate analytical report prepared. Therefore, the dimension is scored ‘C’. GoIRA, with the introduction of program budgeting, has developed the foundations. The development and institutionalization of such analytical reports reflecting on the performance (indicators) can further improve the budget practices.

Public Expenditure and Financial Accountability (PEFA) Performance Assessment Report52
8.3 Resources received by service delivery units
90. Owing to the centralized systems, the current Chart of Accounts or the budget codes do not identify the service delivery unit–level budget-related information. The budget documents provide information segregated by economic function (major code), ministry, province, and district but do not reflect information at the service delivery unit level. Thus, collection and processing of information demonstrating that resources were actually received (in cash and kind) by frontline service delivery units—in relation to the overall resources made available to the budgetary unit—are not made available. Ad hoc surveys have been conducted during the last three fiscal years, but the coverage is inadequate and reports are not made public. Owing to its limited scope and coverage the dimension is scored ‘D’.
8.4 Performance evaluation for service delivery
91. This dimension assesses whether there have been independent evaluations of efficiency and effectiveness of service delivery carried out and published for some ministries at least once within the last three years. The M&E Framework in Afghanistan consists of the following: (a) M&E units at the LMs; (b) M&E conducted through the MoEc; (c) Performance audits by the SAO, authorized under Section 5 of the Supreme Audit Law; (d) Internal audit at all LMs with the coordinating unit at the MoF; (e) The legislative commissions mandated to monitor the service delivery functions; and
92. The following reports have been prepared in the PEFA review period (2014–16):
Table 3.11. Independent Evaluation Reports
Ministry Program/Services Evaluated
Date of Evaluation Report Author Service Delivery
Expenditure Covered
Ministry of Public Works
Roads projects: 1. Bagrami to Sapari road asphalting project2. Asphalt project - Oni Ko-tal road to Bamian Center3. Kabul ring road asphalt project
2014 SAO
1. US$50.5 million2. €55.0 million
3. US$1.0 million
KM Select municipal services December 2015 SAO AFN 1.4 Billion
M&E Reports MoE SAO
93. The performance audit reports by the SAO and M&E reports by the MoEc are published on their respective websites, in local language. Two reports on the implementation reviews of the national development strategy and national priority programs were available on MoEc website.
94. During the period under review, performance evaluation was conducted for only a few projects and services, the value of which was less than 50 percent of the total value of expenditure devoted to service delivery. Therefore, the dimension is scored ‘D’.

Chapter 3. Assessment of PFM Performance 53
PI-9 Public access to fiscal information95. This indicator assesses the comprehensiveness of fiscal information available to the public.
Indicator/Dimensions Score Explanation
PI-9 Public access to fiscal information D
The government makes available to the public 3 basic elements and 3 additional elements, in accordance with the specified timeframes (see Table 3.12).
96. Table 3.12 sets out the basic and additional elements of Fiscal information that are desirable for transparent PFM and the availability and timing of such information.
Table 3.12. Public Access to Fiscal InformationItem and Criteria Status of Availability Source
Basic elements
1
Annual Executive Budget Proposal Docu-mentation:A complete set of executive budget proposal documents (as presented by the country in PI-5) is available to the public within one week of the executive submitting them to the legislature.
Yes - The Executive Budget Proposal referred to as draft budget in PDF and the relevant Excel tables are published on the MoF website within one week of its submission to the legisla-ture. The draft budget is actively debated in the media as well.
www.budgetmof.gov.afDraft Budget SY1396
2
Enacted budget: The annual budget law approved by the legislature is publicized within two weeks of the passage of the law.
Yes - Enacted budget is made public within 2 weeks of its enactment. The President’s assent is part of the law-making process (see Articles 94 and 98 of the Constitution); therefore, the duration is counted from the President’s assent of the Finance Bill.
www.budgetmof.gov.af Approved Budget/Bud-get Decree SY1396Open Budget Survey results (2017)
3
In-year budget execution reports: The reports are routinely made available to public within one month of their issuance, as assessed in PI-27.
No - Budget execution reports and fiscal bulletins are made public with a delay of more than one month.
www.budgetmof.gov.af Open budget Survey results (2017)
4Annual budget execution report: The report is made available to the public within six months of year-end.
No - Not presented within 6 months of year-end.
Open budget survey results (2017)
5
Audited annual Financial report, incorporat-ing or accompanied by the external auditor’s report: The report(s) are made available to the pub-lic within 12 months of year-end.
Yes – Qatia audit reports are made available within 12 months of year-end.
www.sao.gov.afQatia Audit Reports

Public Expenditure and Financial Accountability (PEFA) Performance Assessment Report54
Item and Criteria Status of Availability Source Adttional elements
6
Pre budget Statement: The broad parameters for the executive bud-get proposal regarding expenditure, planned revenue, and debt are made available to public at least four months before the start of the fiscal year.
Yes – Pre budget statement issued in accordance with time-lines stipulated in the budget calendar, which is at least 4 months before start of the fiscal year.
www.budgetmof.gov.afPre budget Document
7
Other external audit reports: All non-confidential reports on central gov-ernment consolidated operations are made available to the public within six months of submission.
No - Audited financial state-ments of SOEs and compliance audit reports are not made public within 6 months of sub-mission.
SAO
8
Summary of the budget proposal: A clear, simple summary of the Executive’s Budget Proposal or the Enacted Budget accessible to the non-budget experts—of-ten referred to as a ‘citizens’ budget’ and where appropriate translated into the most commonly spoken local language—is publicly available within two weeks of the Executive Budget Proposal being submitted to the legis-lature and within one month of the budget’s approval, respectively.
Yes - Citizens’ budget made pub-licly available within one month of approval.
www.budgetmof.gov.afCitizens’ Budget
9
Macroeconomic forecasts: As assessed in PI-14.1, forecast is available within one week of its endorsement.
Yes - Budget Statement: Macro Economic Outlook is made available to the public within one week of endorsement by the Parliament.
www.budgetmof.gov.af
97. The legislative and regulatory basis for public access to the different budgetary and Fiscal documents is as follows:• Annual budget documentation - The MoF must publish the annual budget upon approval (PFEM
Law, Article 52).• In-year budget execution reports - The MoF must submit quarterly progress reports of GoIRA to
the President and publish these (PFEM Law, Article 54).• Year-end financial statements - The MoF must submit a final budget reconciliation report and a
set of financial statements of GoIRA to the President within six months of year-end and publish these (PFEM Law, Article 55).
• External audit reports - The SAO must prepare an annual audit report within six months of year-end and submit it to the President and later to the Parliament whereupon it is to be made publicly available (PFEM Law, Article 59).
98. All documents are prepared in two leading local languages (Dari and Pashto), which are hosted on the MoF websites. The budget and related information like the strategies, execution reports and fiscal bulletins, and so on are available on the website of each general directorate within the MoF. The layout of most of the documents is generally informative; the Citizens’ Budget provides good summary of the otherwise voluminous budget documentation. The media runs talk shows and debates during the budget review by the legislature.

Chapter 3. Assessment of PFM Performance 55
Pillar III: Management of assets and liabilities
99. The pillar assesses the processes and practices to manage fiscal risks, public investments, government assets and public debt. Effective management of assets and liabilities ensures that risks are adequately identified and monitored, public investments provide value-for-money, financial investments offer appropriate returns, asset maintenance is well planned, and asset disposal follows clear rules. It also ensures that debt service costs are minimized and fiscal risks are adequately monitored so that timely mitigating measures may be taken.
PI-10 Fiscal risk reporting
100. This indicator measures the extent to which fiscal risks to the central government are reported. Fiscal risks can arise from adverse macroeconomic situations, financial positions of subnational governments, public corporations, and contingent liabilities from the central government’s own programs and activities, including extra budgetary units. They can also arise from other implicit and external risks such as market failure and natural disasters.
Indicator/Dimensions Score ExplanationPI-10 Fiscal risk reporting D Overall rating based on M2 methodology10.1 Monitoring of public corporations
D
There is neither evidence that audited annual financial statements for all SOEs and SOCs are published within six months of the end of the fiscal year nor are consolidated reports on the financial performance of SOEs and SOCs published by the central government annually.
10.2 Monitoring of subnational gov-ernment D
This indicator is assessed from municipalities’ perspective. Neither audited nor unaudited financial reports of the mu-nicipalities are published.
10.3 Contingent liabilities and other fiscal risks D
No report is published by the central government annu-ally that quantifies and consolidates information on all significant contingent liabilities and other fiscal risks of the central government.
10.1 Monitoring of public corporations
101. There are 2 types of public enterprises in Afghanistan: (a) SOEs and (b) SOCs.
(a) SOEs:
102. ThelawforSOEs,TassadyLaw2005,definesSOEsaslegalentitieswith100percentofits capital owned by GoIRA. At the time of the PEFA Assessment, there were 36 SOEs operating in various business sectors (including fuel import, coal mining, transport, construction, hotel, printing, grain storage, fertilizer production, and cotton spinning).
103. Each SOE is formally controlled and supervised by a respective LM, although the shares in the SOEs are held by the MoF on behalf of GoIRA. The ministry has a representative on the Supreme Council (Board) of each SOE. According to the Tassady Law, the minimum profit levels payable to the Treasury are determined in agreement with the MoF. A majority of SOEs have remitted dividends on declared profits to the MoF in the past, with a few of them such as North Coal being the most profitable of all others in the recent past. Table 3.13 lists 36 SOEs owned for GoIRA. MoF neither received financial reports from any of the 36 SOEs for 2016 (FY 1395) nor prepared a consolidated financial report on the performance of the SOEs.

Public Expenditure and Financial Accountability (PEFA) Performance Assessment Report56
Table 3.13. SOEs Established under Tassady Law1. Macrorayan Keeping & Maintenance 2. Marif Printing Press
3. Azadi Printing Press 4. Milli Bus
5. Afghan Tour 6. Central Shipping
7. Hotels 8. Public Protection Force
9. Helmand Construction 10. Balkh Silo
11. Metallic Elements 12. Balkh Textile
13. Banyai Construction 14. Mazar Fertilizers & Electricity
15. Afghani Construction 16. Balkh Cotton & Vegetable Oil
17. House Construction 18. Pul Khumari Silo
19. Food Stuff 20. North Coal Mining
21. Fuel and Liquid Gas 22. Kandahar Weaving
23. Slaughter 24. Kandahar Fruit
25. Defense Construction 26. Kandahar Textile
27. Central Silo 28. Helmand Boost
29. Modified Seeds 30. Spinzar Kunduz
31. Pharmacy 32. Afghan Gas
33. Prisons Industries 34. JabalSeraj Cement
35. Sukuk Printing Press 36. Sher Khan Port
(b) SOCs
104. There are several commercial corporations that are registered and operating under the Commercial Code 1955, and GoIRA has shares in each of them through respective LMs. Table 3.14 lists the SOCs whose financial statements were available, providing total expenditure for the year, and confirmation if their contingent liabilities and expenditure were included in financial and consolidated reports. Table 3.15 shows the responsible LMs and shareholders for the SOCs.
Table 3.14. Financial Reports of SOCs, Contingent Liabilities, and Consolidated Report
SOCDate of Audited
Financial Statement
Total Expenditure
(AFN)
SOCs Financial Reports include
Contingent Liabilities (Y/N)
Included in a Consolidated
Report?
Ariana Afghan Airlines 31/6/1395 3,086,568,008 N None
Hotel Inter-Continental 10/10/1394 190,438,786 N None
Afghan National Insurance Company
(MoF)
30/9/1395 288,662,309N None
Afghan Telecom 30/9/1393 8,929,167,546 N None
Da Afghanistan Breshna Sherkat 29/12/1393 16,348,948,794 N None
Afghanistan Urban Water Supply &
Sewerage Corp.
SY1395 49,800,834N None
Afghan Card SY1395 22,927,257 N None
Afghan Textile SY1395 59,397,078 N None
Afsotar SY1395 126,161,721 N None
Esteras SY1395 385,935,962 N None

Chapter 3. Assessment of PFM Performance 57
SOCDate of Audited
Financial Statement
Total Expenditure
(AFN)
SOCs Financial Reports include
Contingent Liabilities (Y/N)
Included in a Consolidated
Report?
Afghan Wireless Communication
Company
11/10/1395 10,122,573,864 N None
Afghan Poultry Company SY1395 7,390,000 N None
Helmand Joined Aragonite & Wood
Work Factory
SY1395 10,042,000N None
Afghan Handicraft SY1395 3,349,000 N None
Table 3.15. Responsible LMs for SOCs and Other ShareholdersState Corporation LM Shareholders (%)
Ariana Afghan Airlines MoTCA MoF 57.5%; MoEc 30%; Pashtani Bank 6.25%; and Afghan National Bank 6.25%
Hotel Inter-Continental MoFMoF 64.79%; Pashtani Bank 6.44%; Aryana Airline Co. 12.14%; Afghan National Insurance 2.91%; and others 13.72%
Afghan National Insurance Company MoF
MoF 60.63%; Afghan National Bank 7.66%; Pass tani Bank 7.66%; Afghan Textile Co 6.97%; Aryana Airline Co 2.79%; Carpet Export Co 2.37%; Spenzer Co 1.8%; Sugar Co 1.05%; Serves Co 1.05%; Textile Carpet 1.05%; and Qaraqol Export Co 6.97%
Afghan Telecom MoCIT MoCIT 100%
Da Afghanistan Breshna Sherkat MoEW MoF 45%; MoEW 35%; MoEc 10%; and MoUD 10%
Afghanistan Urban Water Supply & Sewerage Corporation
MoF MoF 40%; MoUD 35%; MoEc 10%; NEPA 10%; and Minis Platy 5%
Helmand Joined Aragonite & Wood Work Factory. MoCI MoCI 49% and Eshaq Firoz Co. 51%
Afghan Card MoCI MoCI 88.5%; MoF 3.89%; Pashtany Bank 1.47%; and Tradesman 6.10%
Afghan Textile MoF MoF 9.2%; National Bank 54.25%; Pashtany Bank 0.35%; and others 37.35%
Afsotar MoCI Russia Federative 49%; CO (STRAS) 10%; Torghundi 10%; Sherkhan Port Services 5%; and MoCI 26%
Esteras MoCI Russia Federative 40% and Afghanistan 60%
Afghan Poultry Company MoCI MoF 70% and rest is mixed
New Baghlan Sugar MoAIL MoAIL 60%; MoF 20%; MoCI 10%; and MoEc 10%
Afghan Wireless Communication Company MoCIT TSI Co 80% and Afghanistan 20%
105. The financial and operational oversight role of the MoF (which has been assigned to the SOE Department) are spelled out in Article 79 of the Tassady Law. This includes reviewing the financial operations of SOEs based on quarterly progress reports and annual balance sheets. Owing to the lack of capacity, oversight in relation to the SOEs is inadequate. Confusion exists with regard DG Enterprise (MoF) over SOCs as the latter have own oversight governance bodies and report to the respective line ministries.

Public Expenditure and Financial Accountability (PEFA) Performance Assessment Report58
106. This dimension is scored ‘D’. The SOE Department has not received or collected audited financial statements from SOEs and SOCs undermining effective monitoring of fiscal risks. The audited financial statements of SOEs and SOCs are not published and do not disclose contingent liabilities, guarantees, and other fiscal risks. MoF also did not prepare and publish a consolidated report on the financial performance of the SOEs and SOCs.
10.2 Monitoring of subnational government
107. This dimension in line with PI-7 is not applicable from the sub national government perspective, however is assessed with the consideration of monitoring of the municipalities. Although municipalities are not strictly subnational governments, they may pose a financial risk to the central government through running expenditure arrears and through MoF-authorized borrowings.
108. The arrangements for the monitoring of fiscal risks in the municipalities are not DEFINED. Presently, the IDLG internal audit department on a sample basis conducts internal audit of the municipalities. The financial statements/reports for municipalities are not published therefore the dimension is scored ‘D’.
10.3 Contingent liabilities and other fiscal risks
109. The MoF lacks systems and capacity to capture and report on the contingent liabilities and other Fiscal risks emanating from the state-owned corporations and banks, and the transactions under pubic private partnerships. Therefore, this dimension is scored ‘D’.
PI-11 Public investment management
110. This indicator assesses the economic appraisal, selection, costing, and monitoring of public investment projects by the government, with emphasis on the largest and most signiFicant projects. The assessment is based on FY1395 (2016) the last completed fiscal year.
Indicator/Dimensions Scores ExplanationPI-11 Public investment management D+ Overall rating is based on M2 methodology
11.1 Economic analysis of investment proposals
C
There are presently no economic appraisal manuals prepared for all sectors. Detailed and methodical economic analyses are carried out for donor-funded projects. In FY 1396, of the total development portfolio, 53 percent comprised of the non-discretionary (donor) grants.
11.2 Investment project selection
CBefore their inclusion in the budget, most major investment projects are prioritized by a central entity, however without a comprehensive and published criterion for project selection.
11.3 Investment project costing
DThe total cost of the project for the budget and the subsequent year are not included in the budget.
11.4 Investment project monitoring
DAnnual monitoring reports covering both physical and financial progress and providing causes for variation in the original and revised costs are not prepared.
Note: MTEF = Medium-term economic framework
.

Chapter 3. Assessment of PFM Performance 59
111. The MoEc is responsible for providing the strategic direction to public investment management in Afghanistan currently anchored in the ANPDF.9 In addition, the MoEc carries out project appraisals and prioritization and M&E of project investments. MoEc is structured around two key functional areas (Technical and Administrative) each headed by a Deputy Minister to support the Minister of Economy. The technical directorates are organized around five sectoral directorates for public investment management. The eight government-wide sectoral structures are assigned to the five sectoral directorates.
112. The role of the MoEc in the budget process commences with the issuance of the BC-1 by the MoF. Pursuant to the issuance of the BC-1 the primary budgetary units are required to submit the preliminary project proposals for appraisal to the MoEc. This process feeds into the formulation of the MTFF. Subsequently, the MoEc participates in the budget hearings for the BC-2 submissions. The changes in the portfolio management in 2016 assigned the infrastructure development to two ministries—the MoUD (vertical infrastructure) and the Ministry of Public Works (horizontal infrastructure). The MoEc is authorized to review the analysis.
113. The BC-1 process begins without an indicative planning figures constraining informed project preparation process. Moreover, majority of the LMs do not provide the requisite basic information in their preliminary project proposals, constraining a robust project appraisal. During BC-2 and the budget hearing the LMs are required to complete the project preparation and budget estimation in line with the indicative planning figures. However, the time accorded in the budget calendar for this stage is inadequate and therefore majority of projects do not follow the appraisal framework during the budget process.
114. The public sector development portfolio is largely donor driven that pass through a robust project preparation system. To reflect on the government systems, the approach of selection of major public investments was blended with the assessment of the national project selection and appraisal system.
11.1 Economic analysis of investment proposals
115. The Planning Guidelines were developed based on Regulation 883 of 31st Hamal 1385 (2004) that assigned the planning-related responsibilities and authority to the MoEc, under Presidential Decree 45 issued on 5th Asad 1391 (2012). In February 2017, the MoEc developed Provincial Development Planning Guidelines, which are used for project initiation, appraisal, approval, and monitoring. However, the compliance with the guidelines is varied as some of the LMs (e.g. MAIL) have developed separate manuals and guidelines as per their own requirements.
116. The access to information is limited. Neither are the results of the major public investments published nor do the budget documents, particularly the development budget sections, provide sufficient information. GoIRA could improve the access to information by improving the data availability on its public sector investments. A summary investment plan containing key information on projects may be included in the budget while the remaining details could be retained in various policy documents at the ministries and requisitioned upon request.
⁹ The national development framework in the post reconstruction period commended with the ANDS (2008–13). After a brief hiatus, the ANPDF (2017–21) was formulated providing a strategic direction to the development and growth efforts.

Public Expenditure and Financial Accountability (PEFA) Performance Assessment Report60
117. GoIRA has not been able to provide estimates of those projects that are domestically financed and were subject to independent economic analysis based on the national systems. At present, economic appraisal manuals have not been prepared for all sectors to provide guidance on economic analysis. However, for donor-funded projects, economic analysis is carried out and disclosed by the donors as part of project documents. The total non-discretionary grants were 53 percent of the total development budget in FY 1397. The dimension is scored ‘C’.
11.2 Investment project selection
118. The ANPDF is the tool for project prioritization and selection, allowing a qualitative assessment of whether the project fits strategically or not. However, that is clearly not a detailed criterion that can guide investment decisions. Project lists (i.e. the project portfolio) are in many cases only headlines of project names, ideas or concepts where no project preparation or appraisal has been done yet.
119. The MoEc in collaboration with MoF sets investment priorities by comparing the project lists provided by the LMs with the ANPDF. The absence of standardized project selection and evaluation tools does not allow for comparison and prioritization between projects. The investments projects (development budget) are presented to the Council of Ministers presided over by the Chief Executive Officer of the government before a final approval by the Cabinet (presided over by the President). The dimension is scored ‘C’.
11.3 Investment project costing
120. The national budget (1396) decree includes MTFF Table 1 that only includes aggregate development budget figures segregated by discretionary and nondiscretionary expenditure for the budget year and three outer years. In Table 8 (ministry-level aggregate) and Table 9 (project-level aggregate) budget is provided for the projected year (1396) only and includes the budget data for the previous year (1395). Ordinary budget is presented by economic code only. The budget documentation does not include medium-term projections of ‘investment projects’ on a full-cost basis, and the information for capital and recurrent spending is not integrated. Therefore, this dimension is scored ‘D’.
11.4 Investment project monitoring
121. The MoEc just perform physical monitoring of the projects and the MoF is responsible for the Financial monitoring, but both systems are not linked. The MoEc prepares periodic progress reports aggregating projects’ progress data that is mostly qualitative. The MoF mainly reviews the financial progress as part of mid year budget review. However, no consolidated report including both physical and financial progress of projects is prepared. Moreover, no formal M&E systems have been established in LMs. Amongst the implementing agencies, MoPW has made summary information on physical and financial progress made public in 1394 only. Moreover, the progress information is neither provided in the national budget nor is a separate monitoring report that includes information on variation in the original and revised costs and the explanation for variation. Therefore, the dimension is scored ‘D’.

Chapter 3. Assessment of PFM Performance 61
PI-12 Public asset management
122. This indicator assesses the management and monitoring of government assets and transparency of asset disposals. The assessment is based on SY1395 (2016), the last completed fiscal year.
Minimum Requirements (Scoring Method M2)Indicator/Dimensions Scores Explanation
PI-12 Public asset management D+ Overall rating is based on M2 methodology
12.1 Financial asset moni-toring
C
The government maintains a record of its holdings in major categories of financial assets. Fair market value systems are not in place for other financial assets such as interests in SOEs and SOCs. Cash basis IPSAS, as the accounting standard is not formally adopted and fully compliant; thus, publication of information is inadequate.
12.2 Nonfinancial asset monitoring
D
The government maintains memorandum records of some fixed assets at the departmental level in a budget unit, which are not centralized at the budget unit level nor at the Treasury in the MoF. No records of non-produced assets are maintained. Holdings of nonfinancial assets are disclosed neither in budget documents nor in the Treasury financial statements.
12.3 Transparency of asset disposal
D
There are no written and approved procedures and rules for the transfer or disposal of nonfinancial assets, including a require-ment for such information to be submitted to the Parliament either for information or approval.
Note: IPSAS = International Public Sector Accounting Standards.
12.1 Financial asset monitoring
123. GoIRA’s financial assets, given the lean financial sector, are basic including cash balance and investments in state owned entities. The investments in the state-owned enterprises and corporations are partially documented at the MoF (DG Enterprises). The annual financial statements of the state-owned banks reflect the government’s investment but consolidated information is not available with MoF. The monitoring of the state-owned entities is particularly weak, evident from PI-10.
124. IPSAS has not been fully adopted as the recognized accounting standard for preparing the Financial statements. There are limited disclosures in financial statements with respect to receivables and investments in the state-owned entities. The annual financial statements (Treasury Directorate) provide consolidated information on revenue and expenditure and partial information on cash and cash equivalents. The major categories of financial assets in GoIRA comprise cash holdings and investments in SOEs and SOCs; records of these are maintained and reported in a disaggregated manner but not fully reported in the annual financial statements. Therefore, the dimension is rated ‘C’.

Public Expenditure and Financial Accountability (PEFA) Performance Assessment Report62
12.2 NonFinancial asset monitoring
125. The stock of nonfinancial assets, including fixed assets, inventories, non-produced assets, and valuables, is neither comprehensively recorded nor integrated for reporting. MoF has not implemented the fixed assets module of AFMIS though steps are under way to activate the module to capture all non-financial assets, movements and disposals. In addition, the values of subsoil assets (oil and natural gas or non-produced assets) have never been estimated and reflected in any of the fiscal reports of the government. The LMs have adopted different systems for maintaining asset records but do not document the usage and age of the assets. There is no regular physical verification of the assets and reconciliation with the records. There is also no consolidated information available on the assets owned by SOEs and SOCs. The dimension is scored “D”.
Table 3.16. Categories of NonFinancial AssetsCategories Sub-categories Where Captured Comments
Fixed assets
Buildings and structures
Ministries (central and provincial directorates) and independent agen-cies
The LMs records are cap-tured in memorandum asset registers at depart-mental level. These are manual records.
Machinery and equip-ment
Other fixed assets
Inventories
Memorandum records maintained at depart-mental level in a budget unit
Valuables
Non-produced assets Land
Afghanistan Indepen-dent Land Authority (ARAZI), Municipalities, MAIL, MoF, DAB
Different offices are re-sponsible for land record
Minerals and energy resources
Directorate General of Geological Survey, Minis-try of Mines,
The record lacks a com-prehensive overview. (Afghanistan Extractive Industry Transparency Initiative Report 2017)
Note: The categories in the table are based on the GFSM 2014.
12.3 Transparency of asset disposal
126. There are some procedures for the transfer or disposal of nonFinancial assets. These are partly contained in the Fixed Asset Policy document but have not yet been formally approved. There is however partial information on asset disposals included in budget documents, but it is not comprehensive. Sales of these assets are reflected in the Treasury financial reports.
127. In the absence of a requirement to disclose disposal of nonfinancial assets to the Parliament, there are no effective rules for asset disposals. However, there is some information included in internal reports, in particular the Treasury financial reports.
128. There are no written and approved procedures and rules for the transfer or disposal of nonfinancial assets, including a requirement for such information to be submitted to the Parliament either for information or approval. The dimension is scored ‘D’.

Chapter 3. Assessment of PFM Performance 63
PI-13 Debt management
129. This indicator assesses the management of domestic and foreign debt and guarantees. It seeks to identify whether satisfactory management practices, records, and controls are in place to ensure efficient and effective arrangements.
Indicator/Dimensions Scores ExplanationPI-13 Debt management D+ Overall rating based on M2 methodology.
13.1 Recording and reporting of debt and guarantees
A
Debt records are complete, accurate, updated, and reconciled monthly. Annual debt sustainability analysis is conducted jointly by IMF and WB and report produced annually. Budget document contains debt statistics for 2-quarter duration extracted from the DSA.
13.2 Approval of debt and guarantees
D
According to the Constitution and PFEM the National Assembly approves all loans, explicit contingent liability, and loan guarantee on a case-by-case basis and authorizes the Ministry of Finance for debt management. However, policies and procedures to provide guidance on borrowing, debt issuance and monitoring of debt management by the single entity unit are not notified.
13.3 Debt management strategy D
The government has a basic document guiding its debt management strategy approved in November 2005. The document has not been reviewed since. The IMF and the WB jointly conduct the debt sustainability analysis; however, GoIRA does not have a published medium-term debt management strategy - a requirement for rating of this dimension.
13.1 Recording and reporting of debt and guarantees
130. TheDebtManagementUnit(DMU),TreasuryDirectorate,MoFcarriesoutthebackofficefunctions while Aid Management Directorate (AMD), MoF interfaces with the lending agencies. Although the debt operations are fairly basic and having completed the HIPC completion point Afghanistan received debt relief in the year 2006. However, a change in the structure of donor financing with a shift to loans (a customized illustrative scenario) would quickly lead to an unsustainable debt burden. Afghanistan remains at a high risk of external debt distress (IMF, DSA 2017).
131. Debt is recorded in the Commonwealth Secretariat Debt Reporting and Management System (CS-DRMS) since 2009. The DMU and the Treasury Accounting Unit reconcile data on a monthly basis. The repayments of debt are made through and regular reconciliations are carried out with the Da Afghanistan Bank (DAB). Officials report that the DAB and the MoF meets regularly, though the periodicity of such meetings is not codified.
132. IMF conducts DSA and the report is made public on IMF website. GoIRA prepares quarterly debt reports but the publication of reports had a time lag ; however, the budget includes quarterly debt management report sourced from the debt sustainability analysis (DSA). The dimension is scored ‘A’.

Public Expenditure and Financial Accountability (PEFA) Performance Assessment Report64
13.2 Approval of debt and guarantees
133. Afghanistan does not borrow from the market either externally or internally but from bilateral and multilateral agencies. All borrowing is subject to strict concessional terms under the IMF Extended Credit Facility program that constrains all concessional financing to meet the 60 percent grant element condition. Currently, only a loan from the Islamic Development Bank amounting to US$70 million is not on concessional conditions for which exception has been sought.134. The Constitution of the Islamic Republic of Afghanistan 2004 and the PFEM Law 2005 stipulate the authority for domestic and external borrowing, issuance of loan guarantees, and on-lending by the MoF on behalf of the government. Article 7 of the PFEM Law authorizes the Treasury Department for the debt management. Article 17(1) of the PFEM Law stipulates that all borrowings be approved by the lower house (Wolesi Jirga). It also approves all government loans from donors and creditors. In addition, the Da Afghanistan Bank Law (Central Bank Law 2003) empowers the Minister of Finance to issue domestic marketable securities to recapitalize the DAB. Borrowing purposes are defined in the PFEM Law.
135. GoIRA has no documented procedures for undertaking debt management transactions. Documented policies and procedures to provide guidance to borrow, issue new debt and undertake debt related transactions, issue loan guarantees, and monitor debt management transactions by a single debt management entity are not available. Therefore, this dimension is scored ‘D’.
13.3 Debt management strategy
136. The MoF has not prepared a medium-term debt management strategy during the review period. The ‘Debt Strategy’ was approved by the Cabinet in November 2005 and has not been reviewed since. The MoF relies on the joint World Bank–IMF DSA to inform its medium-term debt outlook. The national budget included a debt management report for the second quarter (1395) only. The dimension is scored ‘D’.
Pillar IV: Policy-based fiscal strategy and budgeting
137. This pillar is about whether the fiscal strategy and the budget are prepared with due regard to government fiscal policies, strategic plans, and adequate macroeconomic and fiscal projections. Policy-based fiscal strategy and budgeting processes enable the government to plan the mobilization and use of resources in line with its fiscal policy and strategy.
PI-14 Macroeconomic and fiscal forecasting
138. This indicator assesses the extent to which clearly defined economic analysis and established medium-term fiscal strategy set parameters for the budget and drive fiscal outcomes. The assessment period is the last completed fiscal years - FY1393 (2014), FY1394 (2015), FY1395 (2016), and (budget preparation) FY1396 (2017).

Chapter 3. Assessment of PFM Performance 65
Indicator/Dimensions Scores ExplanationPI-14 Macroeconomic and Fiscal forecasting A Overall rating based on M2 methodology.
14.1 Macroeconomic forecasts A
The forecast for key macroeconomic indicators is provided for the budget year and the three outer years with summary narrative on assumptions sourced from the fiscal strategy paper (FSP). Office of the High Economic Council chaired by the President approves the FSP and the World Bank reviews the forecasts.
14.2 Fiscal forecasts B
Forecasts of fiscal indicators – revenue (by type), aggregate expenditures and budget balances for the budget year and 3 outer years along with underlying assumptions in a summary form are included in the budget. The comparative budget data is provided; however, explanation of the main differences from the previous year’s forecast is not included.
14.3 Macro-fiscal sensitivity analysis
AFiscal forecast scenarios based on at least 4 alternative assumptions are included in the Fiscal Strategy Paper published on the MFPD website
14.1 Macroeconomic forecasts
139. The MFPD in the MoF prepares the Fiscal Strategy Paper (FSP) that guides the budget estimates. The fiscal strategy contains both macro-economic and fiscal forecasts for the budget year and next four fiscal years. The document contains forecasts of key macroeconomic indicators such as growth, inflation, and balance of payments and documents the assumptions underlying these forecasts. The preparation of these forecasts is carried out in a transparent manner in consultation with the relevant entities, including the DAB, the Central Statistics Organization, and important ministries. The World Bank as an independent entity reviews FSP. This process is formalized to the extent that it has a dedicated organizational structure and staffing within the MoF. In order to fully institutionalize the fiscal strategy formulation process, the policies, procedures and the review process needs to be codified.
140. The national budget 1396 included forecasts for the budget year and three outer years for the GDP, interest, inflation and exchange rate derived from the fiscal strategy paper (available on the MFPD website). The underlying assumptions are summarily presented in the budget and in relatively greater detail in the FSP. The macroeconomic forecasts and the underlying assumptions are drawn up from the fiscal strategy paper that provides details of the underlying assumptions and simulations based on different scenarios. The projections are reviewed biannually in which the World Bank participates. The dimension is rated ‘A’.
14.2 Fiscal forecasts
141. The national budget (FY 1396, Section Fiscal outlook and Table 1 MTFF) contains forecast of the key fiscal indicators for major revenue types, aggregate expenditure and budget balance for the budget year and three outer years. The forecasts and the summary underlying assumptions in the national budget are based on the FSP. The comparative data of the prior and the budget year is provided; however, the explanations for deviations between budgeted forecasts and actual outturns are not provided in the budget. The dimension is scored ‘B’.

Public Expenditure and Financial Accountability (PEFA) Performance Assessment Report66
14.3 Macro-fiscal sensitivity analysis
142. The FSP issued by the MFPD includes fiscal forecasts based on four shock scenarios – aid slowdown, drought, shock to industrial activity, and import shock. In all cases, the impact on growth and revenues is modeled. A joint working group of the DAB, the MoF and the Central Statistical Office conducts consultations on the macroeconomic forecasts based on scenarios that are published by MoF on the website (http://mfpd.mof.gov.af/). The dimension is scored ‘A’.
PI-15 Fiscal strategy
143. This indicator provides an analysis of the capacity to develop and implement a clear Fiscal strategy. It also measures the ability to develop and assess the fiscal impact of revenue and expenditure policy proposals that support the achievement of the government’s fiscal goals.
Indicator/Dimensions Scores ExplanationPI-15 Fiscal strategy C+ Overall rating based on M2 methodology
15.1 Fiscal impact of policy proposals
BThe FSP, published on the MoF website, includes fiscal impact of policy changes in summary but is not presented to the legislature.
15.2 Fiscal strategy adoption BMoF prepares fiscal strategy paper but is not submitted to the legislature with the budget documents.
15.3 Reporting on fiscal outcomes B
GoIRA prepares annual fiscal strategy papers that presents summary data on the fiscal outcomes, particularly for the revenue; however, the impact of the expenditure related policy proposals is not reported. The budget document presented to the legislature contains fiscal outturns for the previous fiscal year but does not provide an explanation for the deviations. The FSP (MTFF) is not mandated to be presented to the legislature and does not contain a discussion on the deviation in fiscal targets.
15.1 Fiscal impact of policy proposals
144. The FSP includes the fiscal impact of the tax policy changes is summary; however, the fiscal impact of the tax expenditure is not provided. MoF mentioned that in the review period, there were no policy proposals for major changes in expenditure and therefore the fiscal impact for major expenditure proposals was not provided. The MoF has built reasonable capacity to estimates the fiscal impact of revenue and expenditure policy proposals. MTFF is a part of the FSP and provides the revenue and expenditure fiscal targets the budget and three outer years. The FSP is made public but not submitted to the legislature as part of budget documents. The budget documents up to 1396 (2017) mainly mentions proposed policy changes without detailing the fiscal impact. The 1397 (2018) budget includes summary of proposed policy changes and their fiscal impact. The dimension is scored ‘B’
15.2 Fiscal strategy adoption
145. The MoF published the FSP for the year 1395 (2016) that set out the Government’s medium term macro-fiscal framework (MTFF), and provide guidance for budget preparation. The FSP is prepared as a standalone document that includes an overview of the international economic outlook, the domestic macroeconomic performance, impact of debt and other international agreements,

Chapter 3. Assessment of PFM Performance 67
risks to the macro-fiscal framework, and the medium-term framework providing the projected major revenue type for four outer years and expenditure by major economic code for a similar period. The Office of High Economic Council (HEC) chaired by the President reviews and approves the fiscal strategy; however, it is not presented to the legislature. The dimension is scored ‘C’.
15.3 Reporting on fiscal outcomes
146. The GoIRA does not prepare a separate report providing progress on the fiscal strategy. The 1395 budget includes the actual expenditure for 1393 and the revised budget for 1394 but does not include explanation for deviations from fiscal targets. The quarterly fiscal bulletins published by the MoF report actual expenditure along with the summary reasons for any deviations. The FSP also includes a summary of fiscal outturns for the previous year without explaining the reasons for any deviations. Both fiscal bulletins and the FSP are public documents but are not submitted to the legislature. The dimension is rated “C”.
PI-16 Medium-term perspective in expenditure budgeting
147. This indicator examines the extent to which expenditure budgets are developed for the medium term within explicit medium-term budget expenditure ceilings. It also examines the extent to which annual budgets are derived from medium-term estimates and the degree of alignment between medium-term budget estimates and strategic plans.
148. Assessment for dimensions 16.1, 16.2, and 16.3 is based on the last budget submitted to the legislature (2017). Dimension 16.4 is based on the last budget submitted to the legislature (2017) and the current budget (2018).
Indicator/Dimensions Scores ExplanationPI-16 Medium-term perspective in expenditure budgeting D Overall rating based on M2 methodology
16.1 Medium-term expenditure estimates
C
The annual budgets (1395 and 1396) provided estimates of expenditure by broad economic classification for three outer years and the administrative classifications for the budget year only.
16.2 Medium-term expenditure ceilings
DThe BC-1 (issued April 2016) did not contain medium-term expenditure ceilings.
16.3 Alignment of strategic plans and medium-term budgets
DThe costed sector strategies were available for only two of the 25 LMs and these were also not aligned with budget estimates.
16.4 Consistency of budgets with previous year estimates
D
The budget document reports differences for the admin-istrative and economic codes for the budget and previous years only and does not provide explanations for these observed deviations.
16.1 Medium-term expenditure estimates
149. The annual budgets for FY1395 and FY1396 provided estimates for the budget year and three outer years disaggregated by major economic classifications (two-digit code). The budget estimates by administrative classification were provided only for the budget year. The dimension is scored ‘C”.

Public Expenditure and Financial Accountability (PEFA) Performance Assessment Report68
16.2 Medium-term expenditure ceilings
150. The budget preparation process commences with the issuance of BC-1, issued in April 2016) for the budget year 1396/2017. The submissions under BC-1 form the basis of the MTFF. After the preparation of the MTFF the annual, and the indicative budget ceilings are communicated through Budget Call circular (BC-2) issued in August 2016. For a C or above rating, the PEFA Framework requires the government to approve budget ceilings before the first budget circular is issued. Therefore, the dimension is scored ‘D’.
16.3 Alignment of strategic plans and medium-term budgets
151. GoIRA adopted the ANPDF (2017–21) as the overarching socioeconomic development philosophy for the country. The eleven National Priority Programs are thematic area based outcomes to guide the public-sector expenditure. The ministries are supposed to formulate strategies for the implementation of the policy priorities approved by the Cabinet. The program budget structure provides the linkage of the budget to NPPs and the overall ANPDF. The MoE, and the MoPH had notified costed sector strategies to guide the national budget estimates. MAIL also has notified a development priority program; however, it is not costed, but provides a brief aggregate level budget and commitments. In the year 1396, the allocation for health and education (Afs 60 Billion) accounted for 26.6 percent of the total expenditure (Afs 225 Billion) of 25 civilian ministries. However, the outcomes and outcomes in the program budget as well as the budget allocation are largely at variance with the MoE and the MoPH sector strategies. As less than 10% (2 of 25) of the civilian ministries have prepared sector strategies and these are also not aligned with budget estimates, the dimension is scored ‘D’.
16.4 Consistency of budgets with previous year estimates
152. This dimension assesses the extent to which the expenditure estimates in the last medium-term budget establish the basis for the current medium-term budget. This would be the case if every expenditure variation between the corresponding years in each medium-term budget could be fully explained and quantified.
153. Table 1 (MTFF) in the national budget document (1396) provides an aggregate-level fiscal position for the previous, current, and three outer years. The aggregate budget allocation comparison between 1395 and 1396 only is presented in Table 2 (MTFF) segregated by operating and development budgets. The operating expenditure major economic code-wise comparison for 1395 and 1396 is presented in Table 7 (MTFF). The budget document also does not provide explanations for the deviations by categories. Therefore, the dimension is scored ‘D’.
PI-17 Budget preparation process
154. This indicator measures the effectiveness of participation by relevant stakeholders in the budget preparation process, including the political leadership, and whether that participation is orderly and timely.

Chapter 3. Assessment of PFM Performance 69
Indicator/Dimensions Scores ExplanationPI-17 Budget preparation process C Overall rating based on M2 methodology
17.1 Budget calendar CThere is a clear annual budget calendar issued. The 1396 calendar allowed just about four weeks. Delays were noted in the budget preparation for FY1396 (2017).
17.2 Guidance on budget prepa-ration
C
There are clear budget circulars issued to budgetary units, covering total budget expenditure for the full fiscal year. The budget reflects ministry ceilings approved by the cabinet (or equivalent) before the circular’s distribution to budgetary units.
17.3 Budget submission to the legislature
C
The executive has submitted the annual budget proposal to the legislature at 1.5 months before the start of the fiscal year and approved by the Parliament in the second month of the new fiscal year.
17.1 Budget calendar
155. The dates to deliver on the major milestones for the budget calendar are laid out in the Budget Calendar and in the PFEM Law as indicated in Table 3.22. Two budget call circulars were issued, followed by budget hearings that concluded with, and closed by the issuance of a budget proposal. statement.
156. BC-1, issued by the MoF in collaboration with the MoEc, gives an indicative prioritized list of projects and results framework after consultation with the ANDS Department. During this stage, the MoF conducts workshops with civil society organizations. Indicative budget ceilings are not issued at this stage.
157. After BC-1, a midyear review is conducted with the results submitted to the Cabinet (usually after the Council of Ministers) and subsequently to the Parliament for adoption. Thereafter, the MoF collates the approved priority proposals and presents to the Cabinet and development partners for their commitments. Once that is completed, the ministry prepares an MTBF and a prebudget report, containing MTEF and budget ceilings, and submits to the Cabinet. These are published upon approval from the Cabinet. A BC-2 is then formally issued. Ministries prepare budgets in accordance with BC-2; budget hearings are held with the Budget Committee comprising the Minister of Finance, Minister of Economy, Minister of Foreign Affairs, and Administration of the Office of the President. Budget hearing discussions are not open to the general public.
158. BC-2 presents ceilings for both current and development budget, and a calendar for the completion of the process, which was not generally adhered to (Table 3.17) during FY1396 (2017). Therefore, this dimension is rated ‘C’.
Table 3.17. Key Dates in FY1395 (2016) Budget CalendarKey Steps in Budget Process Date per Circular Actual Dates
Budget Calendar February 21–29, 2016
The Budget Calendar finalized by the MoF and agreed with the Budget Committee.
The Budget Calendar issued to budgetary units.
BC-1February 21–June 11, 2016
14-Apr-16

Public Expenditure and Financial Accountability (PEFA) Performance Assessment Report70
Key Steps in Budget Process Date per Circular Actual DatesThe Budgetary Units submit Results Frameworks after consulta-tion with the ANDS Department.
The MoF issues BC-1 in collaboration with the MoEc.
The MoF conducts Civil Society Workshop on BC-1.
The budget units submit budgets in accordance with BC-1.
The MoEc submits the prioritized list of projects to the MoF.
Midyear Review May 21–July 2, 2016 21-Jul-16
The MoF initiates FY1395 (2016) midyear review of the budget.
The MoF submits midyear review to the Cabinet for approval.
The midyear review is submitted by the MoF to the Parliament for adoption.
MTBF June 6–29, 2016 20-Aug-16
The MoF collates approved new priority proposals and submits to the Budget Committee for review.
The MoF submits priorities to donors for tentative donor com-mitment.
The donors confirm their commitments.
The MoF prepares the MTBF (prebudget report) containing the MTEF and budget ceilings and submits to the Cabinet.
The MoF publishes the approved MTBF (prebudget report) con-taining the MTEF and budget ceilings.
BC-2 July 5–August 6, 2016 1-Aug-16
The MoF issues BC-2 containing budget ceilings approved by the Cabinet, costing instructions, and project development templates to all budget units.
The donors work with budgetary units to ensure project development as per their requirements and funding with the support of the MoF.
The budgetary units submit their BC-2 proposals to the MoF.
Budget HearingsAugust 7–September 20, 2016
27-Aug-16
The MoF submits the BC-2 Summary Proposals to the Budget Committee.
The MoF concludes discussions with the donors.
The MoF holds budget hearing sessions focusing on allocation of resources by programs classification, not by economic classi-fication.
The MoEc signs off technical and costing elements of approved projects.
The Budgetary units revise program budget submissions based on decisions arrived at budget hearings.
Budget StatementWithin 45 days after bud-get approval

Chapter 3. Assessment of PFM Performance 71
Key Steps in Budget Process Date per Circular Actual Dates
The MoF finalizes budget hearing decisions and submits to the Budget Committee.
The MoF submits Budget Documents to the Cabinet for approv-al.
The MoF submits Budget Documents to the Parliament for approval.
The MoF submits Budget Statement to the Parliament for adoption.
The budgetary units prepare Financial Plans, and the MoF ap-proves them after review.
The MoF prepares the 2016 Citizens Budget.
Source: MoF Directorate General of Budget.
17.2 Guidance on budget preparation
159. Budget circulars are issued to budgetary units; however, budget ceilings are only pro-vided in BC-2 issued three months before the close of the budget preparation process. Detailed guidance on budget preparation is issued by the MoF. During the budget preparation process, the MoF conducts trainings after the issuance of BC-1 explaining the budget rules and processes. After the issuance of BC-2 (that includes the guidelines on costing in addition to the budget submission forms) the MoF conducts training on the project costing, and BC-1 and BC-2 submissions. The MoF has also issued a budget manual to guide the budget preparation process; however, it needs to be revised now with the addition of the new forums in budget formulation. The budget process starts with consultations with the office of High Economic Council (chaired by the President) and the Cab-inet and is endorsed by both forums before the submission of the budget proposals to the legisla-ture. Detailed guidance is provided by the MoF to the LMs in terms of instructions and trainings; however, in the absence of timely communication of the indicative planning figures, the dimension is scored ‘C’.
17.3 Budget submission to the legislature
160. In the last three fiscal years, the executive has submitted the annual budget proposal to the legislature one month before the start of the fiscal year, and the Parliament has ap-proved it by the second month of the new fiscal year. Therefore, this dimension is rated ‘C’.
Table 3.18. Dates of Submission and Approval of the BudgetBudget Estimates Submitted to the
Parliament
Budget Speech and Approval by the Par-
liament
Appropriation Law in a Gazette
Assent by the President
FY1393 (2014) 2-Nov-13 15-Jan-14 n.a. 25-Jan-14
FY1394 (2015) 11-Nov-14 28-Jan-15 n.a. 10-Feb-15
FY1395 (2016) 4-Nov-15 18-Jan-16 n.a. 4-Feb-16

Public Expenditure and Financial Accountability (PEFA) Performance Assessment Report72
PI-18 Legislative scrutiny of budgets
161. This indicator assesses the nature and extent of legislative scrutiny of the annual budget. It considers the extent to which the legislature scrutinizes, debates, and approves the annu-al budget, including the extent to which the legislature’s procedures for scrutiny are well established and respected and the existence of rules for in-year amendments to the budget without ex ante approval by the legislature.
Indicator/Dimensions Scores Explanation
PI-18 Legislative scrutiny of budgets C Overall rating based on M2 methodology
18.1 Scope of budget scrutiny CThe legislature’s review mainly covers details of expenditure and revenue for the budget year.
18.2 Legislative procedures for budget scrutiny
C
The legislature’s procedures to review budget proposals are included in the Parliament’s Rules of Procedure and are largely adhered. However, the rules do not prescribe com-prehensive procedure and support.
18.3 Timing of budget approval CThe legislature has approved the annual budget within one month of the start of the year in at least two of the last three fiscal years
18.4 Rules for budget adjustments by the executive
CThere are clear rules for in-year budget adjustments by the executive that are compiled with in most cases, but they allow extensive administrative reallocations.
18.1 Scope of budget scrutiny
162. The legislature scrutinizes the details of expenditure and revenue included in the budget proposal. The FSP includes additional information about economic and fiscal outlook but it is not presented to the legislature. The budget proposal is submitted first to the Mesharano Jirga (Senate) and then the Woelsi Jirga (National Assembly). A summary table of MTFF and information on outcomes and outputs of the projects are also included in budget documents. The plenary de-bates are mainly with respect to the budget execution and the development budget proposed for the budget year. The dimension is scored ‘C’.
18.2 Legislative procedures for budget scrutiny
163. The Constitution (2004) provides a role for both upper and the lower houses in bud-get scrutiny. The rules of procedure notified by each House provides for the legislative scrutiny of the budget by the Commission at the Mesharano Jirga and the Committee at the Wolesi Jirga. The Rules of Procedure (2007) of Wolesi Jirga provide summary information on legislative oversight authorizing the Budget and Finance Committee to consolidate the input and submit it for review at the plenary session. Rule 22 refers to the list of the committees/commissions, Rule 25(2) refers to making suggestions on budget, Rule 84 refers to the process which briefly indicates the budget dissemination amongst other relevant Committees and its consolidation, while Rule 86 refers to the consolidated and analysed proposal for submission to the plenary session. The extent of procedures described in the existing rules are complied with; however, the rules do not prescribe comprehensive procedure and support. The rules neither provide for internal organizational arrangements, nor do they refer to technical support or negotiation procedures. Therefore, the dimension is scored ‘C’.

Chapter 3. Assessment of PFM Performance 73
18.3 Timing of budget approval
The budget approval has not been timely with delays noted in enactment of the budget bill by the legislature (Table 3.27) therefore the dimension is rated “C”.
164. In the previous three assessed years, the budget has been approved by the legislature within the first month of the start of the fiscal year in two of the last three fiscal years (in January) and assented to by the President in the second month. The President is required to as-sent within 14 days; otherwise, the bill becomes law automatically. Table 3.18 above shows the tim-ings of submission to the legislature, approval by the Parliament, and assentation by the presidency. This dimension is scored ‘C’.
18.4 Rules for budget adjustments by the executive
165. The PFEM Law (2005) prescribes the rules for budget adjustment. Article 42 of the law authorizes the MoF to revise the appropriations if the revenue or expenditure is less or more than those anticipated in the budget or are affected by the repealing or amending of a law. In the event additional expenditure is required, the Legislature (WJ) will approve the appropriation (Article 43). The President shall approve the adjustment of appropriation from the contingency (Article 46). In addition, Article 47 defines four different scenarios for adjustments in the appropriations.
i. Where requested by a state administration, the Ministry of Finance, in consultation with the Budget Committee, may authorize the transfer of amounts between appropriations for that Ministry provided the transferred amount does not exceed 5% [of the appropriation from which the amount is being transferred].ii. Where an appropriation relates to a function of a state administration that is transferred to a different administration, the Ministry of Finance may transfer an appropriation or part ofanappropriationfromthefirstadministrationtothesecondadministration.iii. Where an administration acquires assets or services from another administration, the amount charged for the acquisition shall be treated as expenditure by the acquiring administration.iv. Where the State is required to repay an amount that was included in public money upon receiptbuttowhichtheStatehadnobeneficialright,anappropriationshallbecreatedfor the Ministry of Finance for the amount to be repaid.
166. Although there are clear rules for in-year budget adjustments by the executive, the rules allow extensive administrative reallocations of the budget. The rules do not set strict limitations in terms of the number of internal budget adjustments. The size of the budget can in-crease with the inclusion of the foreign funded development projects during the year. Therefore, this dimension is scored ‘C’.
Pillar V: Predictability and control in budget execution
167. This pillar assesses whether the budget is implemented within a system of effective standards, processes, and internal controls, ensuring that resources are obtained and used as intended. Predictable and controlled budget execution is necessary to ensure that revenue is collected and resources are allocated and used as intended by the government and approved by the legislature. Effective management of policy and program implementation requires predictability in the availability of resources when they are needed, and control ensures that policies, regulations, and laws are complied with during the process of budget execution.

Public Expenditure and Financial Accountability (PEFA) Performance Assessment Report74
PI-19 Revenue Administration
168. This indicator relates to the procedures used to collect and monitor central govern-ment revenues, which may include tax administration, customs administration, and social se-curity contribution administration. It also covers agencies administering revenues from other significant sources such as natural resources extraction. These may include public enterprises that operate as regulators and holding companies for government interests. In such cases, the assess-ment will require information to be collected from entities outside the government sector. In PI 6 the information on the public sector entities collecting revenue was not available.
Indicator/Dimensions Scores Explanation
PI-19 Revenue Administration D+ Overall rating based on M2 methodology
19.1 Rights and obligations for revenue measures
C
Information on taxpayer redress procedures is available on the ACD website. Taxpayer guides are available for some key topics from the ARD website. However, comprehensive information is not published on the ARD website, including objections procedures.
19.2 Revenue risk management C
Overall risk management is not being used effectively in the ACD, with more than 65% declarations being diverted to red channelthe Red Lane Channel, which mandates physical inspections. Data indicate that physical inspections have detected less than 2% noncompliance, meaning proper physical inspections are not being conducted.
18.3 Timing of budget approval CThe legislature has approved the annual budget within one month of the start of the year in at least two of the last three fiscal years
19.3 Revenue audit and investi-gation
D
In the case of the ACD, audit remains area of weakness. Out of approximately 147,000 declarations audited by post clear-ance audit teams, less than 1,000 declarations were found to be noncompliant. This indicates that while post clearance audits are completed in principle on paper, structured audits are not conducted in practice.
19.4 Revenue arrears monitoring D
Data on arrears from the ARD Large Taxpayer Office (LTO) in-dicate that approximately 92% of arrears are uncollectable, due to the inability to complete write-offs. Thus, arrears account for approximately 55% of the LTO annual revenue. Data were not available across the ARD and ACD.
169. This indicator only reviews Custom and Revenue Departments. The Afghanistan Customs Department (ACD) collects the largest share of domestic tax and customs revenues (approximately Af 65.3 billion in 2016), including customs duties, fixed taxes, and business receipts tax payable at the import stage. The Afghanistan Revenue Department (ARD) is responsible for taxes that account for the second largest share of domestic revenues (AFN 42.5 billion in 2016), including income taxes and business receipts tax within the country. The ACD and ARD are the Directorates of the Ministry of Finance.

Chapter 3. Assessment of PFM Performance 75
Table 3.19. Revenues by Type - FY1395 (2016)Original FY1395
target Target (AFN,
millions)
Revised FY1395 target
Target (AFN, millions)
FY1395 Actual (AFN, millions)
Percentage of Actuals to
Original Target (%)
Revenues and grants
418,715.60 418,715.60 345,795.20
Domestic revenues 122,968.80 122,968.80 142,130.50 115.6
Tax revenues 50,028.50 50,028.50 69,257.20 138.4
Income taxes 19,101.00 19,101.00 24,036.70 125.8
Fixed taxes 9,275.90 9,275.90 10,995.00 118.5
Sales taxes 16,939.60 16,939.60 28,492.10 168.2
Property taxes 691.6 691.6 427.1 61.8
Other taxes 4,020.40 4,020.40 5,306.30 132
Customs duty 27,529.70 27,529.70 29,930.00 108.7
Non-tax revenue 40,405.80 40,405.80 34,384.40 85.1
Income from capi-tal property
2,965.80 2,965.80 1,840.10 62
Sales of goods and services
5,785.80 5,785.80 5,720.00 98.9
Administrative fees 12,345.50 12,345.50 24,361.50 197.3
Royalties 143.2 143.2 262.9 183.6
Non-Taxtax fines and penalties
773.3 773.3 1,119.40 144.8
Extractive indus-tries
621.4 621.4 1,080.50 173.9
Other non-tax revenues
17,770.80 17,770.80 — 0
Miscellaneous revenue
1,230.00 1,230.00 4,002.60 325.4
Social contributions 3,774.80 3,774.80 4,556.30 120.7
Foreign grants 295,746.80 295,746.80 203,664.70 —
Operating budget 150,795.00 149,308.60 143,100.90 94.9
Development budget
— — 60,563.80 —
Source: MoF, 1395 Annual Fiscal Bulletin.
19.1 Rights and obligations for revenue measures
170. The ARD and ACD have published taxpayer guides. Each has dedicated websites with infor-mation on taxpayer registration, filing, payment of liabilities, and appeals. Tax laws are available on the Internet. Citizens may come to the ARD or ACD in person to consult with officials and obtain printed information. The ARD and ACD have held outreach campaigns to proactively communicate with tax-payers and encourage compliance with tax laws.

Public Expenditure and Financial Accountability (PEFA) Performance Assessment Report76
171. While these efforts are encouraging, information is not comprehensive. For example, while redress processes and procedures are outlined on the ACD website, they are not currently avail-able from the ARD website. Updated taxpayer guides provide information on several key taxpayer ob-ligations on the ARD website; however, available information is not comprehensive. The dimension is scored ‘C’.
19.2 Revenue risk management
172. The ARD and ACD have implemented risk-based audit frameworks to assess and priori-tize compliance risks for most categories of taxpayers. At the ARD, a system of risk-based compli-ance audit was introduced in 2015. Central-level risk guidelines are issued, from which case managers register risk scores for all returns. Based on the risk scores submitted by case managers, Compliance Committees in each major tax office select cases for audit. This system has been rolled out in the Small, Medium, and Large Taxpayer Offices at the central level and to Nangarhar, Balkh, Kandahar, Herat, and Kunduz. This accounts for most revenues in all ARD revenue streams. Evidence reviewed includes dates and times of weekly audit committee meetings, meeting minutes, and names of committee members.
173. The ACD has used risk management since 2013; however, adoption of multiple criteria risk profiles is limited. The ACD primarily uses commodity-based criteria. Multiple criteria risk profiles have been piloted at the Herat Inland Clearing Depot and at Kabul Airport. Based on a new procedure conforming to World Customs Organization (WCO) and WTO requirements, a systematic and struc-tured approach to risk assessment and risk profiling is being established. Overall risk management is not being used effectively, with more than 65 percent declarations being diverted to the Red Lane Channel, which mandates physical inspections (Table 3.20). Data indicates that physical inspections have detected less than 2 percent noncompliance, meaning proper physical inspections are not being conducted. The requirement is for reducing the number of red channel declarations to a manageable level, whereby proper and effective physical inspections can be carried out. The dimension is scored ‘C’.
Table 3.20. Custom Audit SelectionFY1393 (2014) FY1394 (2015) FY1395 (2016)
Channels No. of Declarations % No. of Declarations % No. of Declarations
Red Lane 125,194 62.5 197,157 70 272,077
Yellow Lane 58,792 29.3 64,280 22.8 56,056
Blue Lane — — — — —
Green Lane 16,243 8.1 20,029 7.1 20,235Note: Yellow Lane: for consignments that require documentary checks;
Red Lane: for consignments that require physical and documentary checks;
Blue Lane: for consignments whose risks can be treated by post clearance audit; and
Green Lane: the default lane.
Source: ACD.
19.3 Revenue audit and investigation
174. The ARD implemented a risk-based taxpayer compliance plan for FY1394–1398. Under this system, taxpayer files are automatically screened against a setseries of criteria. Depending on the number of audits to be completed and the number of risk criteria present in a file, taxpayers will be selected for audit. A set of financial indicators and the taxpayer compliance history are used to rank them according to the risk they pose to revenue collection.

Chapter 3. Assessment of PFM Performance 77
175. The LTO audit coverage has been in the range of 25-32 percent. The LTO completion target for the current year is 120 cases (last year 74 cases were completed). This means that potentially all large taxpayers may be audited in 3–4 years. However, some cases for large companies may take many years to be completed. Currently, the LTO is focusing on auditing the older fiscal years, but the plan is to start auditing the more recent fiscal years.
176. Not all planned audits and investigations are completed timely, and audit quality remains a challenge. Resource and capacity constraints limit the ability of audit teams to undertake all audits. The capacity of auditors is a challenge, including a shortage of qualified staff with sufficient legal and accounting experience. The quality of audit reports is a challenge, particularly for complex files involving accruals accounting and international transactions. Data on final collections indicate that audit reports may be over-assessing taxpayer liabilities.
Table 3.21. Actual Compared to Planned Audits in (FY1395) 2015–16 Number of
Comprehensive AuditsNumber of
Limited AuditsNumber of Desk Audits Total Audits %
Large TaxpayersPlanned 120 0 0 120
Actual 74 0 0 74 61.6
Medium TaxpayersPlanned 980 0 0 980
Actual 517 0 0 517 52.8
Small TaxpayersPlanned 1,568 0 0 1,568
Source: ARD.
177. In the ACD, audit remains an area of weakness. Out of approximately 147,000 declarations audited by post clearance audit teams, less than 1,000 declarations were found to be noncompliant. This indicates that while post clearance audits are completed in principle on paper, structured audits are not conducted in practice and the use of a compliance improvement program cannot be validated. The dimension is scored ‘D’.
19.4 Revenue arrears monitoring
178. The Tax Administration Law 2015 provides an adequate legal framework for arrears management. Chapter 5 deals with aspects related to recovery of tax. The law provides for adequate powers for arrears management covering the steps to be taken to recover arrears. However, there are no provisions for the write-off of bad debts. As a result, there is a large and growing stock of uncollectable arrears.
179. Comprehensive data on arrears was not available with ARD and ACD. While the ARD information system (SIGTAS) provides tools for arrears management, this system is not systematically used. Data on arrears from ARD LTO indicate that approximately 92 percent of arrears are uncollectable, due to the inability to complete write-offs. As a result, arrears account for approximately 55 percent of the LTO annual revenue. The dimension is scored ‘D’.

Public Expenditure and Financial Accountability (PEFA) Performance Assessment Report78
PI-20 Accounting for revenue
180. This indicator assesses the procedures for recording and reporting revenue collections, consolidating revenues collected, and reconciling the revenue accounts and covers both tax revenues and non-tax revenues collected by the central government
Indicator/Dimensions Scores ExplanationPI-20 Accounting for revenue C+ Overall rating based on M2 methodology
20.1 Information on tax (and non-tax revenue)
B
All revenues are deposited directly into specified subac-counts of the Treasury Single Account at Da Afghanistan Bank. However, some entities responsible for non-tax reve-nues still use manual processes to reconcile transactions.
20.2 Transfer of revenue collec-tions
APayments are deposited directly in the Treasury Single Ac-count at Da Afghanistan Bank, eliminating risks associated with transfers from other agencies.
20.3 Revenue accounts reconcili-ation
C
The ARD and ACD, which account for most government revenue, undertake complete reconciliation of collections and transfers to Treasury within eight weeks of each month. However, assessments and arrears are not regularly recon-ciled.
20.1 Information on tax (and non-tax revenue collection)
181. Afghanistan’s investments in information systems and the establishment of the Treasury Single Account have enabled the MoF to track detailed revenue data monthly for all central government revenue. AFMIS includes revenue data by revenue type, collecting entity, and geographic location. were available on AFMIS going back over seven fiscal years. This depth of data provides clear and precise information on the evolution of revenue types across the central government.
182. All central government revenues are deposited directly into specified subaccounts of the Treasury Single Account at the DAB. This approach to revenue management eliminates the risk of revenue diversion between the entity responsible for collection and the Treasury. The Treasury Directorate obtains the reconciled information on most of the revenue collected and the Fiscal Policy Directorate (MoF) produces fiscal bulletins on monthly, quarterly and yearly basis providing information by revenue type. The first monthly bulletin was not made public till the end of the first quarter. The dimension is scored ‘B’.
20.2 Transfer of revenue collections
183. Revenue collection takes place under the Treasury Singly Account at the DAB. Payments are deposited directly in the sub accounts linked to the Treasury Single Account at the DAB, eliminating risks associated with transfers from other agencies. The ACD and ARD also allow for payments to be made through transfers from client accounts at a limited number of commercial banks. In this case, commercial banks effect an immediate transfer of funds to the DAB and issue a payment receipt. Similarly, payments for non-tax revenue are made directly to the DAB. At present, less than 1 percent of the ACD payments are made through private banks using e-payment.
184. In the future, the ARD and ACD envision enabling clients to make payments through commercial banks using electronic payment systems. This approach would allow payment data to be shared between the DAB, SIGTAS and Automated System for Customs Data (ASYCUDA) directly,

Chapter 3. Assessment of PFM Performance 79
reducing the steps required to verify receipt of payments and reducing the interactions between taxpayers and officials. A link between SIGTAS and ASYCUDA was implemented in 2017. However, the full operationalization of these systems will depend on interbank payment systems as well as a legal framework to enable electronic signature and e-governance. Because payments are made directly to the central bank, the dimension is scored ‘A’.
20.3 Revenue accounts reconciliation
185. This dimension assesses the extent to which aggregate amounts related to assessments/charges, collections, arrears, and transfers to (and receipts by) the Treasury or other designated agencies take place regularly and are reconciled on time. This dimension also assesses evidence of the reconciliation between what is expected and what is received by the government.
186. After payments are received by the central bank, the collecting entities complete reconciliation on an ongoing basis. In the ARD, SIGTAS transactions are verified against central bank statements. This can be a challenging process because most taxpayers’ complete handwritten declaration forms, which are transcribed from paper into SIGTAS and then reconciled against account statements. Taxpayer errors or consolidated payments against multiple obligations can complicate the reconciliation process and increase the time required for reconciliation as well as increase errors that can result in additional payment requests for compliant taxpayers.
187. At the ACD, payment data is reconciled based on the M29 form. This form is used to classify the breakdown of revenues between customs, duties, fixed taxes, business receipts tax, and any other taxes. The M29 form is stamped by the DAB and the provincial mustofiat. The DAB simply verifies the total amount of the payment, while the mustofiat checks the revenue codes and sends the M29 forms to the central Treasury Department. The ACD Statistics Department reconciles the revenue with the DAB on a daily (transaction) basis, and the overall collection of duty and transfer is reconciled monthly using the M29 forms.
188. The timeliness of payment reconciliation is variable because it is an ongoing process. At the time of the assessment, tax and customs payments were reconciled within two months of payment. Reconciled financial statements were available approximately six months following the financial year-end.
189. While collections and transfers are reconciled regularly, there is no routine reconciliation of assessments and arrears to the Treasury. It is not currently possible for the Treasury to identify the value of all assessments and arrears for major revenue categories. The dimension is scored ‘C’.
PI-21 Predictability of in-year resource allocation
190. This indicator assesses the extent to which the MoF can forecast cash commitments and requirements and provide reliable information on the availability of funds to budgetary units for service delivery.

Public Expenditure and Financial Accountability (PEFA) Performance Assessment Report80
Indicator/Dimensions Scores ExplanationPI- 21 Predictability of in-year resource allocation B Overall rating based on M2 methodology
21.1 Consolidation of cash balances
C
Most of the bank and cash balances are consolidated on daily basis; however, some of the funds/accounts are outside of the consolidation process. The existence of the dormant accounts with DAB reflects on the quality of the consolidation process.
21.2 Cash forecasting and monitoring
A
A cash flow forecast is prepared for the fiscal year and updated monthly based on cash inflows and outflows information provided by the Budget execution directorate, AMD and the LMs.
21.3 Information on commitment ceilings
BBudgetary units are provided reliable information on commitment ceilings at least quarterly in advance.
21.4 Significance of in-year budget adjustments
CSignificant in-year budget adjustments to budget allocations takes but are carried out in a transparent manner stipulated in the PFEM Law.
21.1 Consolidation of cash balances
191. Afghanistan established a Treasury Single Account in 2004 consisting of a set of linked designated ofFicial bank accounts. All accounts are held at the DAB in the name of the MoF and are administrated by the Treasury, and in provinces by mustofiats. The Treasury Single Account consists of central Afghani and U.S. dollar accounts as well as accounts to receive transfers from the Law and Order Trust Fund for Afghanistan (LOTFA) and Afghanistan Reconstruction Trust Fund (ARTF) for subsequent transfer to the appropriate Treasury Single Account. At the provincial level, the Treasury Single Account includes separate revenue and expenditure accounts. In addition to these accounts, a limited number of donor discretionary and nondiscretionary accounts are maintained. 192. Cash balance consolidation takes place daily; however, some accounts remain outside the cash consolidation process. The Treasury Directorate prepares a daily report on the available cash balance. The report provides the opening bank balance, receipts, payments and ending available balance. Besides the process being carried out, instances were noted showing dormant accounts with the DAB for over 4 years that reflects on the quality of consolidation process. The dimension is scored ‘C’.
21.2 Cash forecasting and monitoring
193. Authorities from the Directorate General of Budget prepare a consolidated forecast as part of the budget preparation process. A projection is prepared based on an economic outlook covering all domestic revenues, including taxes, customs, and non-tax revenues. Additionally, official estimated external grant resources and the projection are included in the budget. This exercise, led by the Directorate General of Budget, receives inputs from the ARD and ACD.
194. The Directorate General of Budget issues monthly fiscal bulletins to monitor revenues and expenditures across all ministries/departments/agencies and mustofiats. These reports use data from AFMIS to report targeted, actual, and previous year revenues and expenditures.. In addition, the Treasury Directorate General prepares monthly cash flow statement based on the information provided by the Budget Execution Directorate, the financial plans and monthly

Chapter 3. Assessment of PFM Performance 81
status of allotment report submitted by the LMs and the donor contributions provided by the Aid Management Directorate. The dimension is scored ‘A’.
21.3 Information on commitment ceilings
195. After the appropriations are set out in the approved budget, overall annual operational and development allocations are provided for each ministry/department/agency. Operating budget ceilings are set against each administrative unit and major expenditure code. Development budgets are set against organization, funding source, project, and major expenditure code. Ministries (departments and agencies) distribute these budget allocations to subunits as sub-allotments at a secondary budget level.
196. Reliable commitment ceilings are available one quarter in advance. Commitments are established to control expenditure against allotments. The availability of commitment ceilings varies between the operational and development budgets. Budgetary units can reliably request operational commitments quarterly. Development budget commitments vary by availability of donor resources. Generally, development budget commitments can be made with a greater certainty because allocated funds are specifically reserved for this purpose.
197. Business processes to create commitments are well documented. The MoF Accounting Manual outlines the processes used for appropriation, allocation, and commitment. A series of control forms are used by ministries (departments and agencies) to obtain approval from Treasury to make commitments. AFMIS is used to record appropriations, allocations, and commitments. Expenditures are only authorized against established allocations. The dimension is scored ‘B’.
21.4 Significance of in-year budget adjustments
198. The PFEM Law stipulates clear rules for budget adjustments that provides for a transparent mechanism for re-appropriations. In addition, mid year review of the budget is conducted by Parliament that monitors the budget execution and endorses the budget adjustments. The budget adjustments take place under four different scenarios (Details at dimension 18.4). Table 3.22 provides details on the budget re-appropriations. Although the adjustments are transparent however budget allocations have happened more than twice a year therefore the dimension is rated ‘C’.
Table 3.22. Number and Amount of Adjustments in Budget (FY1395)Item Number of adjustment Total Amount in AFN
Adjustment in Contingency 1,114 1,698,132,286.00
Supplementary mainly in non-discretionary
35 13,229,600,039.00
Adjustments in project and program allocations, two digit economic code and province
328 53,832,371,123.36
Total 1,477 68,760,103,448.36
PI-22 Expenditure arrears
199. This indicator measures the extent to which there is a stock of arrears and the extent to which a systemic problem in this regard is being addressed and brought under control and addressed.

Public Expenditure and Financial Accountability (PEFA) Performance Assessment Report82
Indicator/Dimensions Scores ExplanationPI-22 Expenditure arrears D Overall rating based on M1 methodology
22.1 Stock of expenditure arrears
D*
Evidence exists of significant arrears. These are obligations not currently recorded in AFMIS. Surveys on arrears have not been routinely carried out with budgetary units to confirm existence or not of expenditure arrears.
22.2 Expenditure arrears monitoring
D
There are no procedures in place to monitor arrears in budget agencies. Data on the stock of arrears is not generated at least annually with a complete list by budget agencies indicating an age profile.
22.1 Stock of expenditure arrears
200. The Afghanistan Financial Regulation No. 873, under Section 4.15, requires budgetary units to ensure timely and accurate payment settlement. In addition, unless determined otherwise, all payments due to creditors must be settled within 30 days from the date of statement. As with international best practice, a payment obligation that has not been settled within 30 days is considered an expenditure payment arrear.
201. Commitment of expenditures and overall expenditure control through AFMIS are centralized in the MoF. Strong allotment and payment controls prevent buildup of arrears in AFMIS. Budgetary units are required to record only commitments in AFMIS for payments that are to be effected, and only those commitments in AFMIS, which have not been paid by the due date, are considered arrears. Therefore, there is a serious risk that arrears are being hidden in budgetary units because they are outside AFMIS. AFMIS is primarily a payment system and does have other modules for tracking arrears.
202. AFMIS uses a commitment functionality that facilitates committing budgetary allotmentsassoughtbybudgetaryentitiesagainstspecificcontractswithactualtransactionlevel codes to which budget spending should be charged. Through AFMIS, funds are set aside based on available allotment to the extent it is committed thereby not allowing usage of the allotment for any other spending that could pertain to the same budgetary codes.
203. Although there is a general presumption that there are no arrears, the MoF has yet to carry out surveys to establish that extent. During the last completed fiscal years, no survey has been carried out in all budgetary units to determine the stock of expenditure payment arrears, in particular on the operating budget for wages and salaries and those relating to use of goods and services. Thus, the actual stock of arrears has not been ascertained; there is a risk that arrears are being ‘hidden’ by budgetary units. This dimension is scored ‘D*’.
22.2 Expenditure arrears monitoring
204. As the principal Financial management system for data recording and reporting, AFMIS does not provide the means for analyzing payments by legal and contractual payment deadlines and those which have been rejected or suspended pending any investigation or prioritization. Arrears appearing in AFMIS are for those payments that have received allotments that have been entered for processing payments, but payment has not been effected due to timing differences. Not all financial and accounting modules in AFMIS have been activated to ensure all

Chapter 3. Assessment of PFM Performance 83
transactions are captured in the system. Thus, arrears in budget entities can only be confirmed through regular surveys of arrears.
205. There were no regular surveys conducted during the last three completed fiscal years to confirm existence and stock of expenditure arrears with budgetary institutions. There are no documented procedures requiring budgetary units to regularly submit expenditure arrears for monitoring. No data on expenditure arrears were made available. This dimension is scored ‘D’.
PI-23 Payroll controls
206. This indicator assesses management of the payroll for public servants, including how changes are handled, and consistency with personnel records management. Wages for casual labor and discretionary allowances that do not form part of the payroll system are included in the assessment of non-salary internal controls in PI-25.
Indicator/Dimensions Scores ExplanationPI-23 Payroll controls D+ Overall rating based on M1 methodology
23.1 Integration of payroll and personnel records D
No reconciliation between payroll and personnel data has been carried out during the last three years by MoE.
23.2 Management of payroll changes D The data for retroactive adjustments was not available
to rate the indicator.
23.3 Internal control of payroll DHigh incidence of payroll related ineligible expenditure reported by the auditors and monitoring agent.
23.4 Payroll audit CPartial payroll audits have been conducted but the coverage has been limited largely owing to the lack of access due to security situation.
23.1 Integration of payroll and personnel records
207. The payroll system in GoIRA is decentralized particularly for the Ministries of Education, Interior, and Defense. The three ministries represent 72 percent of the total government employees and for all those staff that are paid in cash, the ministries use its own systems for personnel record and payroll processing. For other LMs, Treasury Department through the Verified Payroll Plan has developed the Computerized Payroll System (CPS). The staff positions for each LM are created through the approval of Tashkeel by the President. Tashkeel is the employee requirements, determined by the LMs in consultation with the civil service commission.
208. For this review, the MoE data and systems were assessed as it employs almost 60 percent of the civil administration. The payroll process starts at the school level and consolidated at provincial level. For each province, the payment request (M-16a) is presented to the mustofiat for payment that is supported with the attendance sheets and the payroll form (M-41). The form is a summary of the amount due to each employee in a budget unit based on the calculation of all earning types and deductions from salaries (Accounting Manual, Treasury Directorate).
209. Salary is either disbursed to the employees’ bank accounts or paid in cash through a Trustee. For cash salary payments, the Treasury issues a cheque to the trustee who in turn is responsible for disbursing the funds as per the information in the M‐41 and M‐16a Forms. The trustee in the presence of two witnesses withdraw funds from the Bank to make cash payments to

Public Expenditure and Financial Accountability (PEFA) Performance Assessment Report84
the employees (Accounting Manual, Treasury Directorate). Salaries to about 32 percent of the MoE staff is paid in cash through the trustee.
210. The HR Directorate of the MoE is responsible to maintain the personnel record but no reconciliation with payroll record has been carried out. The personnel record being maintained manually is not integrated with the payroll database thus any changes in the personnel record cannot be automatically reflected in the payroll and neither can the reconciliation be conducted efficiently. Moreover, neither the MoE’s payroll is integrated with MoF to facilitate third party checks nor the MoE’s personnel record is integrated with the HRMIS of the civil service commission. In the last three years, the MoE has not carried out a reconciliation of payroll with personnel record. Therefore, the dimension is rated ‘D’.
23.2 Management of payroll changes
211. The MoF could provide the retroactive adjustments data only for its own staff while the MOE could not provide the data on retroactive adjustments. Therefore, the dimension is scored ‘D’.
23.3 Internal control of payroll
212. Controls over payroll are based on the stafFing establishments (Tashkeel) approved by the President. However, in case of the MoE, significant differences exist in the number of staff approved in Tashkeel between records of the MoE and the civil service commission.
213. Information from the SAO reports, internal audit reports, and ARTF monitoring agent reports indicates that there is a relatively high incidence of payroll-related ineligible expenditure because of missing or non- provisioning of documents. ARTF monitoring agent’s annual report (1395) notes unauthorized payroll expenditure of AFN 134 Million while the expenditure incurred without complete supporting documents amounted to AFN 185 Million. Therefore, this dimension is scored “D”.
23.4 Payroll audit
214. SpeciFic payroll audits covering all central government entities have not been carried out during the last three Fiscal year. Some internal audit departments in LMs have carried out payroll audits. The SAO audits payroll expenditure as part of annual financial statements (Qatia) audit but it did not constitute a payroll audit. The ARTF monitoring agent, on a sample basis, has conducted employees’ physical verification in the course of validation of expenditures. However, owing to the security situation, large tracts of areas could not be accessed and even the selected sample of employees could not be physically verified, in totality. This dimension is scored ‘C’.
PI-24 Procurement management
215. This indicator examines the key aspects of procurement management. It focuses on transparency of arrangements, emphasis on open and competitive procedures, monitoring of procurement results, and access to appeal and redress arrangements.

Chapter 3. Assessment of PFM Performance 85
Indicator/Dimensions Scores ExplanationPI-24 Procurement management B+ Overall rating based on M2 methodology
24.1 Procurement monitoring
B
On the procurement website, databases or records are maintained for contracts, including data on what has been procured, value of procurement, and who has been awarded contracts. All procurement entities have access to the Procurement Management Information System (PMIS) through their user credentials and regularly update their procurement information, However, there are cases of below-threshold contracts in which procurement entities have not entered information for all the awarded contracts.
24.2 Procurement methods A
Competitive bidding is the default method for all procurement above AFN 5,000. A written justification is placed in the record of the procurement proceedings stating the reasons for employing single-source procurement method. During FY2016, 88.6% of procurement has been processed using competitive methods, 2.7% is restricted tendering, and 8.5% is single-source method.
24.3 Public access to procurement information
BOf the listed information requirements for public disclosures, not all procurement plans were available on the NPA website.
24.4 Procurement complaints management
B
According to Article 50 of the Procurement Law, there is an independent procurement-complaints address committee; the Administrative Review Committee follows processes for submission and resolution of complaints that are clearly defined and publicly available, exercises authority to suspend the procurement process, and issues decisions on time, however charges a refundable fee to entertain administrative reviews.
Afghanistan Public Procurement Framework
216. Pursuant to the provision of sub-clause 4 of Article 75 of the Constitution of Islamic Republic of Afghanistan, the Procurement Law (2009) was revised and the new amendments were approved by Wolesi Jirga and Meshrano Jirga and ratified by the President through Decree No. 90, dated August 11, 2016. The Procurement Law (2016) aims to (a) organize procurement of goods, works, and services required by procuring entities; (b) ensure transparency in procurement proceedings; (c) achieve effective control of financial affairs and public expenditure; (d) ensure economy (best value for money) in the procurement of goods, works, and services; and (e) provide equal tendering opportunities for participation to all eligible bidders in procurement proceedings.
217. The revised Procurement Law (2016) is applied in all procurement proceedings by all procuring entities, including budgetary units and other entities financed by public funds. The NPC was established pursuant to Article 54 of the Procurement Law. The NPC is responsible for review and approval of contracts that are above thresholds. Below the thresholds, the procuring entities are authorized to award the contract. It is worth highlighting that the procurement processes for below the threshold are conducted by the procuring entities. In case of above the threshold, the final
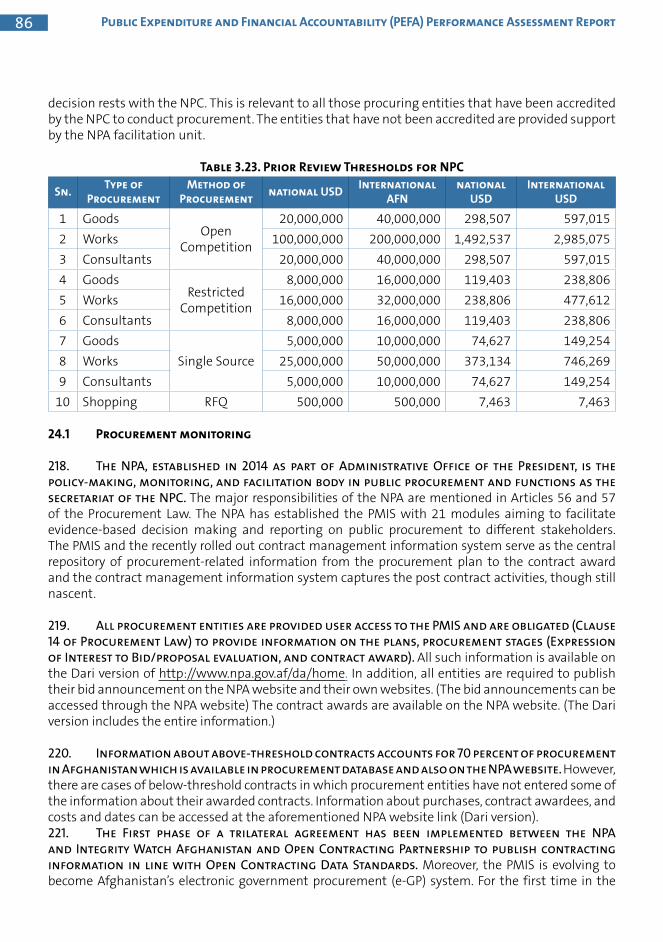
Public Expenditure and Financial Accountability (PEFA) Performance Assessment Report86
decision rests with the NPC. This is relevant to all those procuring entities that have been accredited by the NPC to conduct procurement. The entities that have not been accredited are provided support by the NPA facilitation unit.
Table 3.23. Prior Review Thresholds for NPC
Sn. Type of Procurement
Method of Procurement national USD International
AFNnational
USDInternational
USD
1 GoodsOpen
Competition
20,000,000 40,000,000 298,507 597,015
2 Works 100,000,000 200,000,000 1,492,537 2,985,075
3 Consultants 20,000,000 40,000,000 298,507 597,015
4 GoodsRestricted
Competition
8,000,000 16,000,000 119,403 238,806
5 Works 16,000,000 32,000,000 238,806 477,612
6 Consultants 8,000,000 16,000,000 119,403 238,806
7 Goods
Single Source
5,000,000 10,000,000 74,627 149,254
8 Works 25,000,000 50,000,000 373,134 746,269
9 Consultants 5,000,000 10,000,000 74,627 149,254
10 Shopping RFQ 500,000 500,000 7,463 7,463
24.1 Procurement monitoring
218. The NPA, established in 2014 as part of Administrative Office of the President, is the policy-making, monitoring, and facilitation body in public procurement and functions as the secretariat of the NPC. The major responsibilities of the NPA are mentioned in Articles 56 and 57 of the Procurement Law. The NPA has established the PMIS with 21 modules aiming to facilitate evidence-based decision making and reporting on public procurement to different stakeholders. The PMIS and the recently rolled out contract management information system serve as the central repository of procurement-related information from the procurement plan to the contract award and the contract management information system captures the post contract activities, though still nascent.
219. All procurement entities are provided user access to the PMIS and are obligated (Clause 14 of Procurement Law) to provide information on the plans, procurement stages (Expression of Interest to Bid/proposal evaluation, and contract award). All such information is available on the Dari version of http://www.npa.gov.af/da/home. In addition, all entities are required to publish their bid announcement on the NPA website and their own websites. (The bid announcements can be accessed through the NPA website) The contract awards are available on the NPA website. (The Dari version includes the entire information.)
220. Information about above-threshold contracts accounts for 70 percent of procurement in Afghanistan which is available in procurement database and also on the NPA website. However, there are cases of below-threshold contracts in which procurement entities have not entered some of the information about their awarded contracts. Information about purchases, contract awardees, and costs and dates can be accessed at the aforementioned NPA website link (Dari version). 221. The First phase of a trilateral agreement has been implemented between the NPA and Integrity Watch Afghanistan and Open Contracting Partnership to publish contracting information in line with Open Contracting Data Standards. Moreover, the PMIS is evolving to become Afghanistan’s electronic government procurement (e-GP) system. For the first time in the

Chapter 3. Assessment of PFM Performance 87
history of Afghanistan, the NPA has managed to establish the online Contracts Progress Monitoring System as part of its efforts in upgrading the PMIS. This system is a standard contract administration mechanism in line with Open Contracting Data Standards that publishes contract implementation plans and contract documents and reports on the stages and payment progress of specific contracts.
222. The NPA conducts system-based procurement monitoring, and the accreditation process is annual, in which the procurement monitoring team of the NPA conducts inspections of the procuring entities and on sample basis procurement process–related data are extracted to determine compliance with the stated legal framework and the accreditation is extended. For those entities that have not been accredited as yet, the NPA provides facilitation and mentoring in the procurement process.
223. The Integrity Watch and Transparency International reports offer evidence of the improvement in procurement practices with a deeper and strengthened monitoring mechanism; however, currently, the focus is entirely on the central government operations. The municipalities and those provincial authorities that have been delegated the procurement function are not yet monitored by the NPA monitoring, owing to the staffing constraints. The dimension is rated ‘B’.
24.2 Procurement methods
224. The Procurement Law, Article 18 (5), makes open competitive tendering the default method of procurement and the threshold is set at AFN 5,000. The law also provides for single-source procurement (Article 18) under conditions defined in procurement procedure (Rules 22–23). A written justification shall be placed on the record of the procurement proceedings stating the reasons for employing any procurement method other than open tendering. The NPC approval is required if the award value exceeds certain thresholds determined according to Article 63 of the Procurement Law. The threshold is different for each type of procurement depending on the procurement method applied. Basically, the threshold is lower for a noncompetitive procurement method.
Box 3.1. Procurement Statistics for FY1396 (FY2016)
• 1,474 cases were proposed by public entities and reviewed by the NPC Secretariat. Review reports of these were presented to the NPC, which approved 1,307 cases worth AFN 155.7 billion.
• 59 cases were rejected by the NPC due to noncompliance, and 45 others were returned. (Original returned cases totaled 107, but some were reprocessed and only 45 remained as returned.)
• Savings incurred during the year stood at around AFN 8 billion. Billions more were saved due to strict oversight that might have been wasted to corruption or misuse.
• The NPA Procurement Facilitation Directorate facilitated 213 cases for non-certified public entities worth close to AFN 40 billion.
• 62 fraudulent bidders were debarred during FY2016. Around US$2 million was forfeited of their guarantees.
• 362 complaints were received and responded to by the Administrative Review Committee.
• For statistics from FY1394 (2015) and FY1395 (2016), refer to NPA Annual Report Summary at www.npa.gov.af/da/reports.

Public Expenditure and Financial Accountability (PEFA) Performance Assessment Report88
225. For procurements approved by the NPC during 2016, 88.6 percent of procurements complied with the competitive methods, 2.7 percent were by restricted tendering, and 8.5 percent were by single source. For procurement approved by ministries and agencies during 2016, the data collected from 42 agencies shows that 91.5 percent were executed using competitive methods, 1 percent was by restricted tendering, and 7.5 percent were by a single source. Therefore the Dimension is scored ‘A’.
24.3 Public access to procurement information
226. This dimension was assessed using the NPA website (point to note is that the NPA web portal in the national language has more information than the translated version).
Table 3.24. Status of Key Procurement Information Made Available to the PublicStatus Explanation
(1) Legal and regulatory framework for procurement
YesThe Procurement Law (2017), procurement regulations, circulars, and the administrative review related documents are available on the NPA website.
(2) Government procurement plans
No All procurement plans were not public in FY2016.
(3) Bidding opportunities Yes
Bidding opportunities are published on the NPA website and the websites of the respective procuring entities. They are also published in local media. Further, bidding opportunities in international tenders are published in United Nations Development Business (UNDB) online website and Outlook Afghanistan as well.
(4) Contract awards (purpose, contractor, and value)
Yes
As per Article 43 of the Procurement Law, public entities are obliged to publish award notification notice in a mass-circulated local media outlet to allow unsuccessful bidders to register complains. This notification is published on the NPA website and the websites of the public entities.
(5) Data on resolution of procurement complaints
Yes
The complaints by unsuccessful bidders are initially registered with respective procurement entities; if that response is not satisfactory to the complainant, a request for review can be registered with the Administrative Review Committee according to Article 50 of the Procurement Law. The decisions of the Administrative Review Committee are published on the NPA website, and a copy is submitted to the complainant and respective procurement entity for action. Data on 120 decisions were available on the NPA website
(6) Annual procurement statistics
YesThe NPA prepares a report providing quantitative and qualitative data on the annual procurements.

Chapter 3. Assessment of PFM Performance 89
227. Out of six requirements, Five are complied with; therefore, this dimension is rated ‘B’.
24.4 Procurement complaints management
228. Article 50 of the Procurement Law provides for an independent procurement complaints address committee. The Administrative Review Committee comprises two representatives from the Administrative Office of the President, a representative of the MoCI, a representative of Afghanistan Chamber of Commerce, and two NPA procurement experts providing secretariat services to the committee.
229. The administrative review mechanism provides for a refundable fee of AFN 20,000 (US$300) upon the ascertainment of the authenticity of the protest for the detailed protest review. The fee was levied owing to a large number of frivolous complaints. Unsuccessful bidders may register a request for administrative review if the response provided by a respective procuring entity is not considered satisfactory or no response is provided at all. The fee is refunded if the review is decided in favor of the complainant.
• Processes for submission and resolution of complaints. Submission and resolution of complaints are processed as a bid protest and administrative review procedure. The procedure can be downloaded from (http://www.npa.gov.af/da/procurement-rules).
• Authority of complaints handling. The Administrative Review Committee is given full authority in deciding procurement cases as stipulated in Article 50 of the Procurement Law. Meanwhile, according to Article 3(43), the procurement proceeding ceases once the unsuccessful bidder registers a request for administrative review.
• Issuance of decisions. During FY2016, 362 complaints were registered with the Administrative Review Committee, with decisions issued for 35 of them. The remaining complaints were provided clarification as not being suitable for the committee review.
• Binding decisions. The Administrative Review Committee is given full authority in deciding procurement cases, and its decision can only be overturned through a competent court of law.
230. The dimension is scored ‘B’.
PI-25 Internal controls on non-salary expenditure
231. This indicator measures the effectiveness of general internal controls for non-salary expenditures. Specific expenditure controls on public service salaries are considered in PI-23. Internal control processes ensure that the fiscal discipline is maintained at the micro as well as the macro levels and that resources are allocated as intended and properly authorized and that service delivery has access to and uses the resources provided under legal and regulatory authority and for only those purposes.

Public Expenditure and Financial Accountability (PEFA) Performance Assessment Report90
Indicator/Dimensions Scores ExplanationPI-25 Internal controls on non-salary expenditure C Overall rating based on M2 methodology
25.1 Segregation of duties C
Segregation of duties is prescribed throughout the expenditure process. However, issues with segregation of duties are mentioned in several internal audit reports, including many instances where the segregation of duties is compromised. More precise definition of important responsibilities is still needed.
25.2 Effectiveness of expenditure commitment controls
C
Expenditure commitment control procedures exist for the development budget, but not for the operational budget, which provide partial coverage and are thus partially effective.
25.3 Compliance with payment rules and procedures
C
Majority payments are compliant with regular payment procedures. Instances of non-compliance were highlighted in the SAO and ARTF monitoring agent’s reports.
25.1 Segregation of duties
232. Segregation of duties is a fundamental element of the internal control framework to prevent an employee or group of employees from being in a position both to perpetrate and to conceal errors or fraud in the normal course of their duties. The existing regulations and procedures in place ensure that the main incompatible responsibilities that are segregated include (a) authorization, (b) recording, (c) custody of assets, and (d) reconciliation or audit.
233. Segregation of duties is prescribed throughout the expenditure process as set out in key laws such as the PFEM Law, the Public Procurement Law, and associated regulations. However, in practice, issues with segregation of duties are mentioned in several internal audit reports, including many instances where the segregation of duties is compromised. More precise definition of important responsibilities may be needed. The dimension is scored ‘C’.
25.2 Effectiveness of expenditure commitment controls
234. Article 6 of the PFEM Law, along with the Financial Regulations, assigns each budgetary unit the responsibility for controls in their operations, including expenditure commitment controls. As defined in the Financial Regulations, a commitment is ‘any order placed, contract awarded, service received, or similar transaction that will require payment as a settlement’. In practice, commitments set aside funds within an allotment for contracts signed, purchase orders placed, or any other encumbrances.
235. For contracts that arise under the development budget, the ministries need to record commitments in the AFMIS commitment module. The recording of these in AFMIS ensures that these funds are set aside and cannot be used for any other purchases or expenditures. The commitments for the development budget are automatically reduced in AFMIS when the payment is made against the same coding block as the commitment. Where the contracts are for a period longer that one fiscal year, the commitment is set only for the amount anticipated to be spent in the given year.

Chapter 3. Assessment of PFM Performance 91
236. For the operational budget, no commitments are entered in AFMIS. A pilot introduction of commitments in AFMIS for the operational budget had been tried in recent years, but it led to a slow processing of payments and was discontinued. In addition, there was consideration that the operational budget has a more routine and predictable nature of small value that are not committed in advance.
237. Given the important share that the operational budget has as part of the total budget, the existence of commitment controls only for the development budget provides only partial coverage and the controls are thus only partially effective. The dimension is rated scored ‘C’.
25.3 Compliance with payment rules and procedures
238. This dimension assesses the degree of compliance with the payment control rules and procedures based on available evidence. Given that the compliance data for a sampling approach using the five major budgetary units are not available as measured by gross expenditure in the last completed fiscal year, reliance has been placed on the existing internal audit reports and external audit reports and ARTF Monitoring Agents reports.
239. The internal audit reports, SAO audit reports, and ARTF Monitoring Agents reports provide evidence that, in general, most payments are compliant with regular payment procedures and most exceptions are properly authorized and justified. However, exceptions are still a concern and several important ministries such as Education and Health had issues on compliance with payment rules. The Monitoring agent report (1395) identified around 30 percent of expenditure as ineligible due to either lack of or incomplete documentation. Similarly, the SAO report of Qatia 1394 identifies a few irregularities with respect to sizeable cash payments without supporting documents and payments to the suppliers prior to the delivery of goods that is in contravention of the PFEM Law (Article 60). Moreover, in development projects issues of unadjusted advances and procurement through petty cash have been noted that is a violation of the Treasury Accounting Manual. The dimension is rated scored ‘C’.
PI-26 Internal audit
240. This indicator assesses the standards and procedures applied in internal audit.
Indicator/Dimensions Scores ExplanationPI-26 Internal audit C+ Overall rating based on M2 methodology26.1 Coverage of internal audit A In accordance with the PFEM Law, there is an internal
audit function at every state administration.
26.2 Nature of audits and standards applied C
The MoF internal audit is more developed and focuses on adequacy and effectiveness of internal controls. However, the line departments’ internal audit is focused on financial compliance and lacks documentation to demonstrate compliance with international standards.
26.3 Implementation of internal audits and reporting
BInternal audit units prepare annual audit programs. Four of the five internal audit units assessed completed more than 75% of the planned audits.
26.4 Response to internal audit C
Majority of the recommendations were implemented and the entities provide management response to the internal audit recommendations.

Public Expenditure and Financial Accountability (PEFA) Performance Assessment Report92
26.1 Coverage of internal audit
241. Afghanistan has a decentralized internal audit structure. According to Article 61 of the PFEM Law (Amended 2012), all ministries and state agencies are required to establish an Internal Audit Department. Before the amendment in 2012, the MoF Internal Audit Department had internal audit responsibility across the government. All 26 LMs and has been complied with by all state administrations. For this dimension29 independent directorates have functional Internal Audit Departments.
242. For this indicator, internal audit function of the following five LMs was reviewed: (a) the MoF; (b) Ministry of Education; (c) Ministry of Public Health; (d) Ministry of Higher Education; and (e) MoTCA. Over the years, the MoF Internal Audit Department has developed capacity to conduct audits as per international standards. Internal audit units at the LMs report to the minister. Internal audit manual and toolkit has been developed to guide the internal audit process. The internal audit teams at the respective ministries prepare the annual work program and the reports are submitted to the management. Based on the availability of the internal audit function this dimension is scored ‘A’; however, the function being nascent demands systems and capacity development.
26.2 Nature of audits and standards applied
243. There is varied capacity and performance between the internal audit units at the MoF and those at the LMs. The former uses the Internal Audit Manual and Audit Toolkit that, which complies with the standards issued by the Institute of Internal Auditors. The audits are planned with a risk-based and compliance approach focusing on systemic issues and internal controls and with considerable staff time (between 20 percent and 50 percent is spent on such issues). The audit teams are trained in the audit process and are provided with an audit program to be followed for different audit engagements. Audit Toolkits remain instrumental and are completed for individual audit engagements.
244. On the contrary, internal audit in most of the LMs is primarily focused on financial compliance. The capacity of Internal Audit Departments of LMs is varied, and documentation mainly includes the audit schedule (referred as audit plan) and documents in support of the audit observations. Working paper files as required by international standards are not prepared for audits. The MoF Internal Audit Department supports capacity building of internal audit units in LMs. In addition to training, the MoF Internal Audit Department has supported drafting of an audit charter, manuals, and guidelines. This dimension is rated scored ‘C’.
26.3 Implementation of internal audits and reporting
245. The MoF Internal Audit Department prepares an annual audit plan and carries out quarterly audits according to the annual audit plan, and reports are issued with the same frequency. Internal audit units in the LMs prepare annual audit plans, and the frequency of audits varies from quarterly to semester. The reports are issued with the same frequency mostly, although sometimes with delays. Internal audit units of the ministries also report the progress to SAO periodically. Table 3.25 provides data on planned and completed audits during FY1395 for the five internal audit units. The dimension is scored ‘B’.

Chapter 3. Assessment of PFM Performance 93
Table 3.25. Schedule of Planned and Completed Audits in Five Ministries (FY1395)
Internal Audit Units Number of Audits Planned
Number of Audits Completed
Percentage of Planned Audit Implementation
MoF 117 91 78
Ministry of Education 334 303 90
Ministry of Public Health
60 49 81
Ministry of Higher Education
28 13 46
MoTCA 44 42 95
26.4 Response to internal audit
246. Internal audit reports upon approval of the respective minister are issued to the relevant officials through an official letter that asks for response within a prescribed time. In majority of the cases, the relevant officials respond to audit observations either providing further evidence or agreeing to implement the audit recommendations. Compliance with the agreed actions is usually reviewed as part of the subsequent year’s audit. The Internal Audit Department at the MoF is developing an audit management information system that will automate the audit follow-up process. The status of implementation of audit recommendations for FY1395 is presented in Table 3.26. The dimension is scored ‘C’.
Table 3.26. Status of Implementation of Audit Recommendations in Five Ministries (FY1395)
Internal Audit Unit Number of Audit
Findings and Recom-mendations
Number of Audit Find-ings and Recommenda-
tions Implemented
Percentage of Audit Recommendations Imple-
mented
Ministry of Education 680 388 57
Ministry of Public Health 343 147 43
Ministry of Higher Education 95 74 77
MoTCA 236 197 83
MoF 573 290 51
Pillar VI: Accounting and reporting
247. This pillar assesses the extent to which accurate and reliable records are maintained, and information is produced and disseminated at appropriate times to meet decision-making, management, and reporting needs. Timely, relevant, and reliable financial information is required to support fiscal and budget management and decision-making processes.
PI-27 Financial data integrity
248. This indicator assesses the extent to which Treasury bank accounts, suspense accounts, and advance accounts are regularly reconciled and how the processes in place support the integrity of Financial data.

Public Expenditure and Financial Accountability (PEFA) Performance Assessment Report94
Indicator/Dimensions Scores ExplanationPI-27 Financial data integrity C+ Overall rating based on M2 methodology
27.1 Bank account reconciliation B
Bank reconciliation for all active central government bank accounts takes place monthly within 15 days from the end of the month.
27.2 Suspense accounts BReconciliation of the first quarter’s revenue is completed within 1 to 2 months of the close of the quarter. Subsequently, monthly reconciliations are carried out.
27.3 Advance accounts DReconciliation of advance accounts takes place monthly; however, SAO reported outstanding advances some of which are 8 years old.
27.4 Financial data integrity processes B
Access and changes to records are restricted and recorded and result in an audit trail but do not include financial integrity.
27.1 Bank account reconciliation
249. The GoIRA uses a Treasury Single Account (TSA) to manage its bank accounts. The TSA consists of set of linked designated official bank accounts through which the GoIRA makes all of its transactions (Accounting Manual, Treasury Directorate). According to the DAB TSA operations consist of 567 accounts in AFN and 281 accounts in USD. 250. Bank reconciliation for all active central government accounts takes place at least monthly, within 15 days from the end of the month. Some transactions are reconciled more frequently. The reconciliation process largely entails issuance of the bank statement by the DAB to the Treasury, which is then reconciled within the Treasury, and in case of any discrepancy it is reported to the DAB for correction otherwise it is assumed to be reconciled. The dimension is scored ‘B’.
27.2 Suspense accounts
251. During the first two months of the fiscal year, the revenue classification reports are not submitted to the Treasury on time and revenue based on the bank receipts is recorded as unclassified revenue under code 140 “Other revenue”. The reconciliation of the first quarter’s revenue is completed within one to two months of the close of the quarter and the revenue is reclassified to the proper codes. Subsequently, the revenue reconciliation is carried out on monthly basis. Refer PI 20.3 for the issues in revenue reconciliation. LMs finance departments reconcile the expenditure with AFMIS data on a monthly and report any reconciling to the Treasury for adjustment. The dimension is scored ‘B’.
27.3 Advance accounts
252. The Accounting Manual of the Treasury General Directorate elaborately prescribes the procedure and process for the advance (M-10 Advance Request Form) and acquittals (M-12 Advance Acquittal Form) while the travel advances are processed using M-8 (Order for Personnel Transportation), M-9 (Travel Request and Authorization), and M-13 (Payment Request). The stipulated time for the advance settlement is 30 days. All advances are recorded in their assigned codes for advances in AFMIS. The unit in charge of advances prepares daily reports for management, which includes all unliquidated advances that are outstanding for more than 60 days. LMs are required to acquit the outstanding advances before the release of any fresh advance.

Chapter 3. Assessment of PFM Performance 95
253. While an elaborate framework and guidelines are available, the SAO reports that ‘the advance amount of AFN 671,373,002 is not settled. Moreover, the advance of AFN 224,943,459 that belonged to 18 budgetary units from FY1393 and AFN 744,497,470 that belonged to 32 budgetary units from FY1381 to FY1392 is still unsettled (SAO audit report on Qatia accounts 1394). A similar finding is made on the petty cash advance in SAO reports. The Accounting Manual notifies the monthly settlement and a large number of advances are settled in the process; however, a sizeable amount and number of advances remain unsettled. Therefore, this dimension is rated ‘D’.
27.4 Financial data integrity processes
254. AFMIS supports the data integrity, security, accuracy, and completeness. Good practice measures are in place, including principles of limited and authorized access to information, read-only access for certain users, and changes to records by creation or modification of data. The access and changes to record is restricted through provision of passcodes and the system maintains the user’s log to track the changes made and the time the system was accessed. As a result, audit trails are included in the existing systems. The system also captures the usage by the ministries in terms of reports generation. The dimension is scored ‘B’.
PI-28 In-year budget reports
255. This indicator assesses the comprehensiveness, accuracy, and timeliness of information on budget execution. In-year budget reports must be consistent with budget coverage and classifications to allow the monitoring of budget performance and, if necessary, timely use of corrective measures.
Indicator/Dimensions Scores ExplanationPI-28 In-year budget reports D+ Overall rating based on M1 methodology
28.1 Coverage and comparability of reports D Coverage and classification of data does not allow direct
comparison to original budget.
28.2 Timing of in-year budget reports C
Budget performance reports by the Budget Execution Directorate are prepared quarterly and issued within 8 weeks of the end of the quarter.
28.3 Accuracy of in-year budget reports C There are concerns about data accuracy. Expenditure is
captured at the payment stage.
28.1 Coverage and comparability of reports
256. In-yearbudgetreportsaregenerallyconsistentwithbudgetcoverageandclassificationto allow the monitoring of budget performance and to be used timely for corrective measures. In-year budget reports are used to measure the year-to-date performance through the analysis of revenue and expenditures outturns, with respect to budget estimates. However, the budget reports are designed and being prepared to compare coverage and classification of budget execution data to the revised budget estimates (not the original budget estimates). The original budget estimates are not used for the reports, but the data is readily available. The dimension is scored ‘D’.
28.2 Timing of in-year budget reports
257. The Treasury Manual provides the formats for budget and expenditure/revenue collection reports. The mustofiats are required to report to the Treasury, information related to

Public Expenditure and Financial Accountability (PEFA) Performance Assessment Report96
allotment expenditures using M-22 (Monthly Status of Allotment Report) within five days after the end of the month. The M-22 is prepared from the M-20 (Allotment/Sub-allotment Control Ledger).
258. AFMIS containing the accounting transactions related to budget execution is the basis for the creation of both summary and detailed automated data reports. The Budget Execution Directorate of MoF publishes the budget performance reports on quarterly basis. The reports for the 2nd, 3rd and 4th quarter of 1396 were submitted within two months from the end of each quarter. In addition, MoF publishes monthly, quarterly and yearly fiscal bulletins but with a time lag. No fiscal bulletin for the fiscal year 1397 has been issued till April 2018 i.e. four months into the fiscal The Dimension is scored ‘C’.
28.3 Accuracy of in-year budget reports
259. GoIRA publishes quarterly budget performance reports as well as monthly, quarterly and yearly fiscal bulletins that provide both quantitative and qualitative information on budgeted and actual expenditure and revenue. However, the reports include information on expenditure at the payment stage; not at the commitment stage. There may be concerns about data accuracy because the SAO and the ARTF monitoring agent’s reports indicate misclassification and unauthorized budget re-appropriations. The dimension is rated “C”.
PI-29 Annual financial reports
260. This indicator assesses the extent to which annual financial statements are complete, timely, and consistent with generally accepted accounting principles and standards. This is crucial for accountability and transparency in the PFM system.
Indicator/Dimensions Scores ExplanationPI-29 Annual financial reports D+ Overall rating based on M1 methodology
29.1 Completeness of annual financial reports C
Financial reports are prepared annually and are comparable with the approved budget. The financial reports do not include information on tangible assets and on guarantees and other contingent liabilities
29.2 submission of reports for external audit D
Financial reports are submitted for external audit within 6 months of the fiscal year-end, however SAO reports that the financial report was incomplete.
29.3 Accounting standards D The standards used to prepare annual financial statements (Qatia accounts) are not disclosed.
29.1 Completeness of financial reports
261. Annual Financial statements (Qatia accounts) for the central government include information on budget, revenue, expenditure, cash balances, Financial assets, and Financial liabilities, including medium and long-term obligations, and are supported by a reconciled cash Flow statement. The financial reports do not include information on tangible assets and on guarantees and other contingent liabilities (such as those related to PPPs). For the last completed fiscal year (2016), the annual financial reports compare the budget execution with both the originally approved budget and the latest revised budget figures. The dimension is scored ‘C’.

Chapter 3. Assessment of PFM Performance 97
29.2 Submission of reports for external audit
262. Annual government Financial statements (Qatia accounts) are submitted for external audit to the Afghanistan SAO. The law requires the MoF to submit the Qatia accounts to the SAO within three months after the fiscal year-end; however, it was not complied with, and the FY2016 (1395) annual reports were submitted to the SAO on April 10, 2017. Table 3.27 summarizes the submission dates for the past three fiscal years. However, the SAO report on the Qatia of 1394 qualifies the completeness of the financial statement and states that due to the delays in the provision of the Qatia by the MoF leading to lack of sufficient time for the SAO to audit the Qatia in the stipulated time and due to the lack of full access to information and documents, the SAO was unable to give an opinion on the revenue-related annual data. The PEFA Framework advises the report to be considered final when the SAO considers the report to be complete. Therefore, this dimension is scored ‘D’.
Table 3.27. Submission of Qatia Accounts to the SAOFiscal Year Date of Submission to the SAO
FY1393 (2014) April 26, 2015FY1394 (2015) June 8, 2016
FY1395 (2016) April 10, 2017
29.3 Accounting standards
263. Article55ofthePFEMLawrequirestheMoFtopublishbothfinancialstatementsthatcomply with the international accounting principles and the Qatia accounts; however, MoF only publishes Qatia accounts. The standards used to prepare the Qatia accounts are not disclosed. The auditor’s report also does not include an opinion that on which standards the Qatia accounts have been prepared. The dimension is scored ‘D’.
Pillar VII: External scrutiny and audit
PI-30 External audit
264. This indicator examines the characteristics of external audit and contains four dimensions.
Indicator/Dimensions Scores ExplanationPI-30 External audit D+ Overall rating based on M1 Methodology
30.1 Audit coverage and standards C
All budgetary government entities are audited annually. The SAO has adopted International Standards of Supreme Audit Institutions (ISSAI) as its national standards but they are not fully implemented, and audit documentation mainly comprise supporting documents for the audit observations.
30.2 Submission of audit reports to the legislature
AFor the last three fiscal years, the SAO submitted the Qatia audit reports to the legislature within three months of the receipts of the Qatia accounts from the MoF.
30.3 External audit follow-up B
The audit follow-up mechanism was operational in all three fiscal years, and formal response to the audit observations was provided to the audit entities.

Public Expenditure and Financial Accountability (PEFA) Performance Assessment Report98
Indicator/Dimensions Scores Explanation
30.4 SAO independence D
There is no provision in the Constitution related to external audit or the SAO. According to the SAO Law, the President has the powers to appoint and remove the Auditor General. However, according to the Constitution, the President is the head of the executive branch and a part of legislature. No approval from the legislative assembly is required to appoint or remove the Auditor General. The SAO can independently implement the budget once approved by the Parliament though the budget is subject to the MoF review and there have been some cuts.
30.1 Audit coverage and standards
265. As mentioned in PI-29, annual government financial statements (Qatia accounts) only report budget execution comparing originally approved and revised budgets. Extrabudgetary funds and autonomous agencies are not consolidated in the government financial statements. The MoF also prepares separate annual financial statements according to cash-basis IPSAS for each individual IDA- and ARTF-funded project. These projects are part of the government budget, and their expenditure is also reflected in Qatia accounts. Financial audits (as defined by ISSAI) are carried out for the Qatia accounts and financial statements of IDA- and ARTF-funded projects. The majority of SOEs are annually audited by the SAO with a focus on financial compliance. Therefore, the coverage of financial audits is restricted to budgetary government entities. 266. In 2013, the SAO expressively adopted ISSAI as its authoritative standards. However, the manual used for a Qatia audit was developed in 2011 (FY1390) and is not fully compliant with ISSAI. When samples of working paper files for a Qatia audit were reviewed, it was noted that documentation is limited to supporting documents for the audit observations. Audits are subject to quality assurance reviews to ensure accuracy of the audit findings, but compliance with applicable standards is not reviewed as part of the quality assurance process. Audit of IDA- and ARTF-funded projects are conducted with the support of consultants and to a large degree meet ISSAI requirements for financial audit.
267. The SAO has recently developed and reviewed performance audit and compliance audit manuals consistent with ISSAI 300 and 400. With consultant support under the ARTF-funded PFM Reform Project II, compliance audits of large spending ministries that were carried out during the last three years were certified compliant with ISSAI. This dimension is scored ‘C’.
30.2 Submission of audit reports to the legislature
268 The PFEM Law requires the SAO to prepare and submit an independent report on the previous Fiscal year’s Qatia accounts within six months from the end of the year. The PFEM Law requires all ministries and independent directorates to prepare and submit their Qatia accounts of the fiscal year to the MoF Treasury Department with a copy to the SAO within the first month of the subsequent fiscal year. Upon receipt of such accounts, the Treasury Department consolidates these accounts and submits to the SAO for auditing within three months in the next financial year. Qatia accounts consist of three volumes: revenue budget, development budget, and receipts. During the last three fiscal years, the receipts volume of Qatia accounts were submitted to the SAO with a delay, but the SAO could still submit the audit reports to the legislature within six months of the close of the fiscal year or within three months of the receipt of accounts (Table 3.35). This dimension is scored ‘A’.

Chapter 3. Assessment of PFM Performance 99
Table 3.28. Submission Dates of Qatia Accounts
Fiscal Year Date of Submission of Complete Qatia Accounts to the SAO
Date of the SAO Audit Report Submission to the President and the Parliament
2014 April 26, 2015 June 21, 20152015 June 8, 2016 June 21, 2016
2016 April 10, 2017 June 21, 2017Source: Qatia Audit Reports and Auditor General’s Letter of Submission to the President and the Parliament.
30.3 External audit follow-up
269. Article 15 of the SAO Law (2013) requires audit entities to provide feedback on audit Findings and assure the SAO of the implementation of the audit results. The audit entities provide a formal response which is included in the Management Letter issued to the entities management at the end of audit. The SAO has developed an audit follow-up mechanism that involves collecting periodic updates on the implementation of the agreed-upon recommendations and maintaining a database. It also requires a follow-up as part of the next audit to ascertain the progress made by the entity in implementing the recommendations. Implementation of the audit follow-up mechanism in four ministries during 2016 was a trigger for the ARTF Incentive Program that was achieved.
270. In 2016, the SAO submitted a report to the President analyzing the implementation of the agreed-upon recommendations by the audit entities. The results of compliance by LMs with audit recommendations are varied ranging from up to 80 percent compliance to below 10 percent compliance. The audit follow-up mechanism does not cover grant audits, and the audit findings are followed up during the subsequent year’s audit. The results of audit follow-up are also not published in the audit reports. The SAO is establishing a directorate with a sole mandate to follow up on audit recommendations that will also cover grants audits. This dimension is scored ‘B’.
30.4 SAO Independence
271. There is no provision related to external audit or the SAO in the Constitution of Islamic Republic of Afghanistan. As per the SAO Law (2013), the selection and removal of the Auditor General rests entirely with the President who has executive, legislative, and judicial authority. Article 6 of the SAO Law provides the criteria/requirements for a person to be appointed as Auditor General. Article 7 of the law grants power to the President to appoint the Auditor General for a period of six years. Article 8 prescribes the conditions/circumstances for the removal of the Auditor General by the President. No approval of the legislature is required to appoint or remove the Auditor General. 272. The annual SAO budget is subject to the MoF review. The MoF has made some cuts to the budget estimates submitted by the SAO. The annual SAO budget is approved by the Parliament as part of annual government budget. All budgetary payments are processed through the Treasury system, but the MoF has no authority to limit the SAO accessing the budget once approved by the Parliament. Article 26 (2) of the SAO Law states that the SAO will implement its budget independently.
273. The legal framework does not ensure that the SAO has full organizational independence to accomplish its tasks. The SAO does not have the right to make fundamental changes to its organizational structure without the approval of the President. The SAO does not independently decide on all HR matters. The SAO must follow the procedures established in the Civil Servant Law for hiring personnel. Hence, all appointments, transfers, and promotions are done according to the Civil Servant Law.

Public Expenditure and Financial Accountability (PEFA) Performance Assessment Report100
274. Article 9(1) of the SAO Law states that the SAO is free to draft, prepare, and approve the audit plan and non-audit plan. Articles 15 and 21 of the law provide the SAO with unrestricted rights to access records, documents, and information. The Auditor General is completely independent in audit planning and selecting necessary information for auditing purposes. This dimension is scored ‘D’.
PI-31 Legislative scrutiny of audit reports
275. This indicator focuses on the legislative scrutiny of the audited financial reports of the central government, including institutional units, to the extent that either they are required by law to submit audit reports to the legislature or their parent or controlling unit must answer questions and act on their behalf.
Indicator/Dimensions Scores ExplanationPI-31 Legislative scrutiny of audit reports C+ Overall rating based on M2 methodology
31.1 Timing of audit report scrutiny B
PAC reviewed audit reports on Qatia accounts within 6 months of receipt and submitted its report to the plenary session.
31.2 Hearings of audit findings A
PAC hearings to review audit reports on Qatia accounts are in-depth. All audited entities attend the respective PAC session. In addition, SAO and MoF representatives participate in all PAC sessions.
31.3 Recommendations on audit by the legislature C
PAC issues recommendations on actions to be implemented by the legislature but there is no systemic follow-up on their implementation.
31.4 Transparency of legislative scrutiny of audit reports
DPAC hearings are not public and the PAC report is published neither on an official website nor by any other means easily accessible to the public.
Note: PAC = Public Accounts Committee.
31.1 Timing of audit report scrutiny
276. This dimension assesses the timeliness of the legislature’s scrutiny, which is a key factor in the effectiveness of the accountability function. The PAC is a standing committee of the lower house (Wolesi Jirga) of the Afghan Parliament.
277. The PAC, comprising 10 members, was established in 2015 through a resolution of the lower house with a mandate to review external audit reports and present its recommendations to the President and the Parliament. The PAC’s terms of reference have been framed but not officially published. Previously, the Budget and Financial Affairs Committee of the lower house was responsible to review external audit reports.
278. Annually, the SAO submits Qatia audit reports, compliance audit reports, and performance audit reports to the legislature. However, the PAC only reviews the Qatia audit reports. Compliance audit reports for FY2003 (FY1382) are pending for legislative scrutiny. In FY2016 (FY1395), the SAO submitted the performance audit reports for the first time, but these have not yet been reviewed.

Chapter 3. Assessment of PFM Performance 101
279. The PEFA Framework considers the scrutiny of audit reports of the government’s Financial reports. In case of Afghanistan it is the audit report of the Qatia accounts that was reviewed by the legislature within 6 months after the receipt of the audit report (Table 3.29). Therefore, the dimension is scored “B”
Table 3.29. Audit Report Submissions and Review by Legislature
Fiscal Year
Date of submission by the SAO to the
Parliament
Date of Completion of Review by PAC
Date of Submission of PAC Review to Wolesi Jirga (Lower House of Parliament)
2014 (FY1393) June 21, 2015November 25,
2015December 2, 2015
2015 (FY1394) June 21, 2016September 25,
2016November 2, 2016
2016 (FY1395) June 21, 2017November 28,
2017December 9, 2017
31.2 Hearings of audit findings
280. ThisdimensionassessestheextenttowhichhearingsonkeyfindingsoftheSAOtakeplace. The Qatia audit reports are subject to in-depth review by the legislature. The observations and recommendations examined by the PAC and through hearings with responsible officers from concerned entities are included. Representatives of the SAO and MoF attend all hearings and PAC sessions. The Secretariat of the PAC maintains attendance records for each session, and all audited entities attend the respective PAC session for review of Qatia audit reports. The dimension is scored ‘A’.
31.3 Recommendations on audit by the legislature
281. This dimension assesses the extent to which the legislature issues recommendations and follows up on implementation. Where the legislature finds any deviation in the preparation or presentation of the Qatia accounts, the recommendations for any corrections/modifications to be made are implemented by the executive. Without such correction, the Qatia accounts are not accepted by the legislature. Recommendations are issued on the Qatia audit reports, but there is no systemic follow-up on the implementation of the recommended actions. The PAC annually submits its reports to the President and Parliament outlining recommended actions. The dimension is scored ‘C’.
31.4 Transparency of legislative scrutiny of audit reports
282. This dimension assesses the transparency of the scrutiny function in terms of public access. The PAC sessions are not open to public and media. In addition to the PAC members, representatives of the SAO, Ministry of Defense, and the audited entity, whose report is discussed, can attend the PAC session. Annually, the PAC presents a report to the President and Parliament on review of the audit reports, but it is not published on an official website or made publicly available by any other means. The dimension is scored ‘D’.

Public Expenditure and Financial Accountability (PEFA) Performance Assessment Report102
Chapter 4Conclusions on Analysis of the PFM
System

Chapter 4. Conclusions on Analysis of the PFM System 103
Table of conents (Chapter 4. Conclusions on Analysis of the PFM System)
4.1 Integrated Assessment of the PFM Performance................................................................................. 104
4.2 Effectiveness of the Internal Control Framework................................................................................. 108
4.3 PFM Strengths and Weaknesses.................................................................................................................. 108
4.4 Performance Changes since the 2013 Assessment............................................................................ 110

Public Expenditure and Financial Accountability (PEFA) Performance Assessment Report104
283. Chapter 4 presents an integrated analysis of the PEFA Assessment and identifies the main strengths and weaknesses of the PFM systems. This assessment was conducted using the PEFA Framework 2016. The cutoff date for the assessment was December 21, 2016 (1395). GoIRA has taken commendable measures for strengthening PFM, providing an enabling environment for improving transparency complemented with the passage of the Right of Information Act (2014). The government’s flagship activity of improving public procurement and the establishment of the independent joint anticorruption M&E committee offers the government’s willingness to make procurement process transparent and curb corruption. The FPIP facilitates objective monitoring of the reform efforts; however, there are areas that need attention to improve value for money in public investments. The key messages from the assessment are documented in this chapter.
4.1 Integrated Assessment of the PFM Performance
Pillar I: Budget reliability
284. The aggregate expenditure deviated from the approved budget by 21-30 percent during the PEFA review period. The two rounds of the Presidential elections in the year 2014 (April-June) with the resultant delays in the Cabinet formation (October 2014) diverted the focus from the budget execution. In addition, the security transition in December 2014 led to instability in the provinces impacting the development project execution and the resultant lower budget utilization. The shrinking TA grants led to the withdrawal of technical advisors that created capacity gaps particularly at the LMs. From the budgeting perspective, the delays in determining the size and share of the LMs results in submission of wish lists rather informed budget submissions. The high variance in the expenditure by both functional and economic classification besides the unrestrictive budget adjustments mirrors the quality of expenditure planning.
285. The aggregate revenue deviated from the approved budget by 24-42 percent mainly due to the volatility in foreign inFlows. The domestic revenue performance showed an impressive turnaround in the years 2015 and 2016 with the revenue deviations vis-à-vis the budget at only 5 percent. However, the PEFA Framework (2016) stipulates combining the foreign and domestic revenues for variance analysis. Although the domestic revenue outturns were minimal, the fluctuating foreign aid inflows resulted in a higher revenue deviation during the PEFA review period. Moreover, the continuous under budgeting of the taxes on property calls for a deeper diagnostic to reflect on how informed the revenue planning is.
Pillar II: Transparency of public finances
286. The open budget survey has been periodically conducted to inform GoIRA on the extent of budget transparency. Public right to information has been recognized by the Parliament, while the publication of the citizen’s budget has fostered transparency in the budget process. However, the information availability on the budget execution to the public is limited due to delays in publication of the in-year execution reports. The chart of accounts (CoA) supports the budget preparation, execution, and reporting and is embedded within AFMIS to produce timely data. The budget documents do not include expenditure data per the functional classification because the CoA is not fully compliant with GFS and COFOG.
Chapter 4

Chapter 4. Conclusions on Analysis of the PFM System 105
287. Improving fiscal disclosures of extra-budgetary units will allow better resource management and foster transparency. The key gap identified is almost complete lack of data regarding extra-budgetary entities. These entities may have significant operations (expenditure and revenues) outside financial reports but are neither quantified nor consolidated in the government’s financial reports.
288. The highly centralized expenditure management stifles innovation in service delivery and obscures performance evaluation of the service delivery units. GoIRA introduced program budgeting to incorporate performance element in the budgeting while the recent procurement reforms targeted greater transparency and value for money. However, due to the over centralized expenditure management, budget related information at the level of service delivery units is not available impacting the service delivery and the performance evaluation.
289. Integration of the development budget data to the project’s outputs and outcomes will deepen the program budgeting reforms. The budget document delineates the outputs and outcomes and the performance indicators for the projects; however, this information does not relate to the budget allocations. Therefore, the performance cannot be assessed in terms of ‘how much was achieved with the budget allocated in a year’. The reforms have not been embedded as traditional practices of incremental allocations and disintegrated approach to ordinary and development budget persist.
Pillar III: Management of assets and liabilities
290. Owing to the lack of systems and capacity, the GoIRA does not have a complete picture of the Fiscal risk. The asset and liability management and monitoring of fiscal risks displayed considerable gaps. Debt management was the only indicator demonstrating higher rating, largely owing to the basic debt management function and the technical support received from IMF and the World Bank in carrying out the DSA. The government’s financial reports do not document the fiscal risk nor do the SOEs and SOCs submit financial reports to MoF. GoIRA has embarked upon the public private partnership transactions and it is critical to improve its regulatory function to mitigate risks and safeguard its interests.
291. The public investment management (PIM) regime is weak on the entire continuum while the lack of data systems leads to uninformed decision making. Presently, the development portfolio is largely an outcome of the residual revenues after recurrent expenditures are settled. Though this is an appropriate first step towards laying down the size of development portfolio, the next step of linking the size of the public investments with revenue collection efforts to ensure adequate resource availability is missing. The data systems do not support the public investment analysis. The implicit basis of development budget allocations is the historical execution rate. The existing data systems do not include project related information resulting in uninformed decisions on the entire PIM spectrum. There is neither a published criterion for project selection nor a documented M&E system.
Pillar IV: Policy-based fiscal strategy and budgeting
292. There is strong macroeconomic and Fiscal forecasting coupled with progress toward a comprehensive medium-term expenditure framework. Fiscal strategy setting is strong and well elaborated; however, this information is captured in the FSP that is not presented to the legislature. The projections in the FSP set out the underlying assumptions and include a range of scenarios.

Public Expenditure and Financial Accountability (PEFA) Performance Assessment Report106
The medium-term perspective for the expenditure and revenue in the budget document is limited. The expenditure data only by major economic classification is presented for the budget and three outer years. The recurrent and development budget data with administrative classification is only provided for the budget year. Weaknesses persist in determining the medium-term ceilings and aligning strategic plans and medium-term budgets and the impact of changes between the forward estimates and actuals.
293. The policy proposals for revenue and expenditure are not prepared to guide the budget process. The FSP is prepared on broad assumptions for revenue and expenditure projections but does not detail the key policy proposals and their impact. The impact of the revenue related policies is summarily covered; however, the impact of the tax expenditure is not provided. Similarly, the impact of policy decisions on expenditure with respect to major public investments is not elucidated in the FSP.
294. Lack of adequate budget scrutiny and delays in budget approval by the legislature impacts the budget utilization. The legislature is the key stakeholder that can facilitate the reforms implementation with the use of the modern budget tools in the legislative scrutiny. GoIRA adopted program budgeting but the review is conducted in the traditional setting largely focusing on the development expenditure. The budget submission is based on two-digit economic codes while the rules for budget adjustment does not limit the re-appropriations. As a result, the LMs can re-appropriate the budget without MoF approval below the two-digit codes. This may be a good practice in the developed setting that allows autonomy but has created a perverse incentive as the planning process is completed with the knowledge of non-restriction on the re-appropriations. This is evident from the large number of adjustments to the budget in a year.
295. GoIRA has notified an elaborate budget process, but delays in the commencement and non-availability of the indicative planning Figures compromises the budget process. The MoF issues two budget call circulars but with a delay. As the budget has to be presented in the stipulated time (PFEM Law), the time available for the preparation of project proposals is reduced. With the lack of indicative planning figures in BCC, the quality of budget estimation by the LMs lacks realism. Although the budget has been presented to the legislature in the stipulated time, the enactment of finance bill has been delayed. During the review period, the budget had been passed 30-45 days after the start of the fiscal year, impacting the budget execution.
Pillar V: Predictability and control in budget execution.
296. Revenue administration is relatively weak partly due to the absence of structured audits and due to arrears. The revenue administration is based on comprehensive legislation and user-friendly manuals inform the practices. However, the awareness of the rights and obligation for revenue measures is limited while revenue risk management, audit and arrears management is weak. Approximately 92 percent of arrears are uncollectable and have not been written off. Arrears account for approximately 55 percent of annual revenue in the LTOs. On the other hand, complete data on arrears were not available across the ARD and ACD.
297. All AFMIS modules have not been activated yet; therefore, there is a strong likelihood that some commitments or transactions are initiated outside AFMIS. There are no procedures in place for monitoring arrears in budget entities. For the last three completed fiscal years, no surveys of expenditure arrears were conducted nor identified arrears were verified for a report to be generated. For example, there are arrears in terms of tax refunds that have not been quantified.

Chapter 4. Conclusions on Analysis of the PFM System 107
298. The payroll system is disintegrated and partial payroll audit raises concerns of ghost employees. The payroll processing particularly in the Ministries of Education, Interior and Defense presents controls issue owing to a large number of salary payments in cash and the lack of centralized data availability for third party verification. The personnel record and the payroll data is not integrated therefore the accuracy and the consistency cannot be verified. This issue was highlighted during the retrieval of payroll retroactive adjustments data.
299. Procurement management has received greater government attention leading to the reorganization of the public procurement function. A number of reform measures were rolled out and though the measures are nascent to reflect on its outcome, the NPA claims improvement in the procurement processes, greater transparency, and savings of about AFN 30 billion. The focus of the reforms has largely been at the central level, and provincial-level coverage is being envisaged, to be rolled out after the availability of resources for the NPA at the provincial levels.
300. The internal audit function covers the central government, though capacity and managerial acceptance are weak in some budget units. Internal controls on non-salary expenditures indicate weaknesses in segregation of duties, weak commitment controls, and weak compliance with payment rules and procedures.
Pillar VI: Accounting and reporting
301. Bank account reconciliation is conducted on time; however, the key issue remains with the settlement of advance amounts. The SAO notes large sums of unsettled advances; in some cases, these have remained unsettled for over five years. Access and changes to records are restricted and recorded, indicating a clear audit trail. In-year budget reports are used to measure the year-to-date performance through the analysis of revenue and expenditures outturns with respect to budget estimates. Budget execution reports can be generated from AFMIS; however, the PEFA Framework underscores the production and dissemination of the budget execution reports to the LMs by the MoF. The latter produces monthly fiscal bulletins and quarterly budget performance reports; however, till April 15, 2018, no reports were available on budget execution for 1397. The coverage and classification of data do not allow direct comparison to the original budget.
302. The legal and procedural framework supports financial data integrity. The introduction of the TSA facilitated the timely completion of the bank reconciliation. AFMIS supports the data integrity, security, accuracy, and completeness. Measures are in place, including principles of limited and authorized access and changes to record is restricted through provision of passcodes and the system maintains the user’s log to track the changes. The key issue remains with the settlement of the advances.
303. Periodic budget execution reports are prepared but published with a delay and do not include original budget. Monthly, quarterly and annual budget execution reports are produced based on the revised rather original budget estimates, and as a result the quality of planning is not mirrored. The Budget execution reports reflect data at payment stage and not the commitment. SAO and the ARTF monitoring agent’s report identified instances of misclassification and unauthorized budget re-appropriations
304. General purpose Financial statements are not prepared but MoF only prepares the annual Qatia accounts (Appropriation Accounts). Information on tangible assets, guarantees and other contingent liabilities are not included in the Qatia accounts that mainly report budget and

Public Expenditure and Financial Accountability (PEFA) Performance Assessment Report108
actuals. MoF has been submitting the Qatia accounts to the SAO with a delay. Accounting standards used in preparing the Qatia accounts are not disclosed. The PFEM Law requires MoF to prepare financial reports as per international standards but does not prescribe the standards.
Pillar VII: External scrutiny and audit
305. The system of Financial accountability is undermined with weaknesses in the operational framework and the lack of SAO’s independence. The SAO has adopted ISSAI as its national standards but these are not fully implemented. Submission of audit reports to the legislature and the follow up on audit findings with the Executive is timely carried out by the SAO. The SAO’s independence is compromised because the selection and removal of the Auditor General rests entirely with the President. The PAC reviews the Qatia audit reports within 6 months of receipt; however, compliance and performance audit reports are not reviewed. Compliance audit reports since 2003 are pending legislative scrutiny. The Committee conducts hearings to review Qatia audit reports where senior Executives from the ministries participate. The monitoring of the recommendations on actions to be implemented by the Executive is weak with no systemic follow-up and the public disclosures are extremely limited.
4.2 Effectiveness of the Internal Control Framework
306. The internal control framework of Afghanistan, as set out in Annex 2, is generally weak. The scores in related indicators and dimensions reinforce the functionality of controls associated with the day-to-day transaction of the BCG though heavily centralized in the MoF. The laws and regulations provide the legal framework and allow for specific roles and responsibilities, segregation of duties, and operating processes. The system embeds access controls and audit trails that support the internal control framework. However, the current compliance-based approach does not support continuous improvement in the control environment. There are weaknesses in commitment controls and associated compliance with rules and procedures. There are also weaknesses in performance management for service delivery and lack of independent evaluations of performance achieved on service delivery.
307. The system is not yet supported by a strong internal audit and oversight function due to lack of compliance with international standards and partial implementation of audit recommendations. Internal audit has started adopting a risk-based approach, which needs to be strengthened further by complying fully with the International Professional Practice Framework of internal auditing. Risk assessment is an important part of the control framework that applies to internal audit and analysis. Similarly, certain activities, such as advances, payroll, and pension payments, receive considerable attention in the ex-ante control process. However, a broader examination of risk-focused control and governance arrangement for public entities such as SOEs, SOCs, and extra-budgetary units is required. Majority of internal audit observations report issues of regulatory compliance and implementation of the recommendations by the LMs is varied.
4.3 PFM Strengths and Weaknesses
Aggregate fiscal Discipline
308. Aggregate fiscal discipline is achieved by controls over spending but significant variance exists between budget and actual numbers. The planned budget on an aggregate basis is not unduly circumvented by the use of virement and supplementary budgets. Treasury operations and cash management enables expenditures to be managed within the available resources, but

Chapter 4. Conclusions on Analysis of the PFM System 109
complete data on arrears is not available. Revenue administration ensures that revenues are efficiently collected but some revenue sources are under budgeted and significant revenue arrears exist. However, both expenditure outturns and revenue outturns were considerably below targets (budget) during the last three completed fiscal years. The low predictability of donor resources also contributed to lower revenue outturn. In addition, control over contractual commitments is not sufficiently effective, creating a risk of generating further expenditure arrears. The lack of timely availability of indicative planning figures, the weaknesses in budget execution and the lack of effective monitoring of the extra budgetary units and corporations also negatively influenced fiscal discipline.
Strategic Allocation of Resources
309. The systems are not fully capable to plan and execute budget to achieve policy objectives. The Chart of Accounts caters for a multidimensional analysis of expenditure but presentation of the budget on functional/COFOG classification is long overdue. There is no dedicated functional segment in the current Chart of Accounts, which was last updated in 2009. The link between the medium-term perspective in expenditure budgeting and strategic plans needs to be developed to improve the strategic allocation of resources. The budget allocation mechanism is largely incremental, while the budget estimation for the recurrent and development budgets is fragmented, and thus impedes the linkages between the selected programs and policy priorities. The lack of indicative planning figures during budget preparation cycles does not provide a medium-term perspective, and thus compels the LMs to follow a randomized and incremental budgeting system. The current PIM framework has inadequacies on the entire PIM cycle—project preparation, project appraisal, execution and monitoring and evaluation.
Efficient Use of Resources for Service Delivery
310. The current weaknesses in performance management and monitoring system undermine service delivery. Though performance targets and outcomes are published, the lack of systematic program evaluation and data on resources available at service delivery units undermines accountability for service delivery. Such information would help management decision making to support improved service delivery. Although over 70 percent of the total budget is allocated to recurrent budget, the lack of delegated commitment authority has created spending rigidities, hampering innovations in service delivery. Over the last three fiscal years, approximately half of the development budget remained unspent. On the revenue side, operational efficiency is compromised by the accumulation of tax arrears. Lack of effective tax debt collection undermines credibility of tax assessments and the principle of equal treatment of taxpayers. The introduction of rules and procedures for writing off uncollectable taxes would afford the opportunity to clean up tax arrears and make them current.
4.4 Performance Changes since the 2013 Assessment
311. The 2017 PEFA Assessment was carried out using the 2016 methodology and a direct comparison with previous assessment is not advised. To provide performance trajectories, the data were scored using the 2011 PEFA methodology and compared to the 2013 assessment, which used the same framework.
312. The comparator offers results between the prior (2013) and the current PEFA, however the results have to be viewed with a perspective. The statistical results show the rating for 64 percent indicators remained the same, 11 percent displayed improvements while 25 percent

Public Expenditure and Financial Accountability (PEFA) Performance Assessment Report110
showed decline. However, in order to put things into perspective it is vital to take into account the over optimism in the prior PEFA review. For instance, the budget credibility rating in the prior review was rated ‘A’ with the explanation that no expenditure was charged to the contingency vote. However, the practice for contingency allocations in Afghanistan has been a norm and was practiced in the prior review period also evident from the 1391 budget which shows 8.6 percent of the total budget (excluding carry forwards) was allocated to contingency. Similarly, the adherence to the budget calendar was rated high besides acknowledging the delays in the budget submissions. The data supporting rating of indicator on adjustment to budget allocations was not available in the report. The pay roll processing is particularly deficient in Afghanistan largely owing to the disintegrated personnel and pay roll record, lack of automated system for personnel record, and the continued salary payment in cash even in 2018 offers evidence to weaknesses in the payroll processing. Yet in the prior review the payroll indicator was rated high. The GoIRA accounting system even in 2018 does not have the ability to generate information on the availability of the resources to service delivery units largely owing to the lack of budget codes and yet the PEFA 2013 review noted information availability at the service delivery unit level. Similarly, the procedures for the legislative scrutiny notified by the Wolesi Jirga in the year 2007 have not been revised and these procedures provide for summary information on the budget review process without incorporating the negotiation procedures. Yet the 2013 review rated the indicator high.
314. taking into account the over optimism and inconsistencies in the prior review the results remarkably improve. Out of the total 28 indicators the GoIRA performance deteriorated on 7 indicators, 3 indicators showed increase and the performance remained the same on 18 indicators. Besides the election year during the review period, the security transition, fluctuating foreign flows, the withdrawal of technical support the PEFA rating demonstrate the GoIRA’s performance and the strength of its PFM systems in the given context.

111Chapter 5. Government PFM Reform Program
Chapter 5Government PFM Reform Program

Public Expenditure and Financial Accountability (PEFA) Performance Assessment Report112
Table of conents (Chapter 5. Government PFM Reform Program)
5.1 Approach to PFM Reforms.............................................................................................................................. 113
5.2 Recent and Ongoing Reform Actions......................................................................................................... 113
5.3 Institutional Considerations......................................................................................................................... 114

113Chapter 5. Government PFM Reform Program
314. Chapter 5 discusses the government’s overall approach to PFM reform and describes recent and ongoing reform initiatives to improve PFM performance.
5.1 Approach to PFM Reforms
315. The National Unity Government has consistently prioritized PFM reform. In 2015, the President commissioned work to assess the functionality of the PFM system and develop a program of reforms to allow the budget to be better used as a tool to implement policy. The resulting assessment highlighted important weaknesses in the current PFM system, including fragmentation in the budget, an incremental approach to budgeting, and weakness of policy links.
316. Based on the assessment, the government adopted an ambitious plan for whole-of-government PFM reform. A Fiduciary Risk assessment was conducted to inform the development of the FPIP. The FPIP provides a rolling five-year program for reforms across the entire PFM cycle. The FPIP approach is ‘team based’, with small teams across the MoF and other agencies developing rolling plans to achieve benchmarks based on international good practice or local priorities. Rolling plans are publicly available and updated on a six-month basis. Success against benchmarks is assessed internally and validated through regular external assessment. The FPIP initially involved 63 teams from the MoF and two partner agencies. In 2017, the reform plan was rolled out further to include 96 teams.
5.2 Recent and Ongoing Reform Actions
317. Under the FPIP, PFM reform has been a continuous process, involving substantial recent reforms in many areas. Significant recent PFM reforms include the following:
• Revenue administration reforms. A new Tax Administration Law was passed in 2016, clarifying responsibilities for tax administration and providing the ARD and ACD with required regulatory powers. Substantial progress has been made in clearing arrears and adopting risk-based approaches in tax audit and customs enforcement. The SIGTAS electronic tax system has been rolled out across Kabul and to five large provinces. Progress is ongoing with the rollout of e-filing options to large and medium taxpayers. Work is ongoing to strengthen capacity in tax administration, including through the centralization of large taxpayer responsibilities within the Kabul ARD.
• Revenue policy reforms. Revisions to the Income Tax Act in 2016 simplified and harmonized the tax regime. A telecommunications fee was introduced, and efforts were made to improve revenue collection from various non-tax sources, including overflight fees. The government plans to implement a value added tax (VAT) over coming years, and preparatory work is under way.
• Budget reforms. Progress efforts have been made to introduce a medium-term perspective into the annual budget, with the 2018 budget including forward estimates and compliance with international standards for the presentation of consolidated fiscal data. The government is now seeking to strengthen processes for project selection and better develop links between expenditures and policy priorities through the budget process. Work is ongoing to strengthen the Public Investment Management Framework, based on a recent assessment.
Chapter 5

Public Expenditure and Financial Accountability (PEFA) Performance Assessment Report114
• Audit and accounting reforms. An accountancy law was introduced in 2016, providing a legislative framework for accounting standards and the recognition of accountancy qualifications. An Institute
318. Recent reforms have generally reflected PFM priorities. Recent emphasis on revenue reforms has reflected the urgent need for improved revenues in the context of a sudden decline in revenues in 2014 and the prospect of declining international aid support over time. Efforts to strengthen procurement processes and address corruption are vital both to the overall integrity of the PFM system and to ensure sufficient donor confidence for the continued use of country systems. The current emphasis on budget formulation may need to be balanced with greater consideration of budget execution realities, especially at the level of service delivery units, where payroll and procurement delays continue to impede service delivery, and budget execution for projects remains poor. More generally, the breadth and ambition of reforms included in the FPIP may suggest a need for greater selectivity and prioritization in the future. FPIP targets are informed by achieving high scores against international benchmark indicators throughout the PFM cycle, including those measured through the PEFA Framework. Achievement of current targets would see Afghanistan outperforming all country groups in PEFA scores. While establishing clear aspirational goals may serve an important purpose, the risk is that such high levels of ambition in all areas impede careful and explicit identification of the highest priorities for improved macroeconomic management and service delivery. Establishing clear relative priorities can be vital for ensuring that scarce capacity and resources are put to their best use.
5.3 Institutional Considerations
319. Government exerts strong leadership and ownership over the PFM reform process. The current FPIP approach has full buy-in across Government, including the President. Commitment to PFM reform is stated in the current national development plan, the Afghanistan National Peace and Development Framework (ANPDF). Government has consistently emphasized the importance of PFM reform in increasing confidence in government systems, bringing a greater share of aid on-budget, and – eventually – underpinning self-reliance through effective revenue mobilization and efficient utilization of public resources. Reform plans are developed at the team level, reflecting the priorities of individual teams and team members. These reform plans are then approved by Director Generals, the Minister of Finance, and ultimately the President. Ownership is strengthened through the practice of self-assessment against FPIP benchmarks, and the frequent rolling over of reform plans based on progress and constraints.
320. Coordination of PFM reform efforts has improved. Government has emphasized the importance of coordination and alignment behind the FPIP agenda, having identified previous weaknesses in coordination as a major impediment to progress with PFM reforms. The Macroeconomic and Fiscal Performance Directorate (MFPD) houses the Performance Management Team, which oversees the FPIP process and is responsible for coordinating plans and implementation. Donors have broadly aligned their support around the FPIP. World Bank technical assistance projects are now explicitly aligned with the FPIP team-level plans, and designed to respond flexibly to FPIP priorities as expressed by teams and the Performance Management Team. Donor budget support, including through the ARTF Incentive Program, supports policy actions that are included in FPIP medium-term plans, ensuring complementarities between technical assistance and policy-based support.

115Chapter 5. Government PFM Reform Program
321. Sustainability issues have recently become apparent. The process of developing, assessing, and updating a large number of team-based plans has involved substantial time and effort. International technical assistance has played a key role in supporting teams and undertaking external assessment. Funding gaps for international technical assistance led to delays in rolling over plans in 2017. The FPIP approach remains in an early stage of implementation and continued reliance on external technical assistance is understandable. But over time, it will be important for Government to develop capacities required to fully manage and implement the FPIP approach using its own resources. Development of such capacity is, itself, a component of the FPIP program.
322. The FPIP approach is intended to be fully transparent. The initial PFM assessment that informed design of the FPIP is available on the Ministry of Finance website. Initial five-year plans and the first external assessment report are also available. Interruptions to the availability of international technical assistance has delayed the preparation and publication of subsequent documentation. Donors and government ministries have been consulted through the development of the FPIP, and Government frequently reports on overall progress with key reforms included in the plan.

Public Expenditure and Financial Accountability (PEFA) Performance Assessment Report116
Annex 1Performance Indicator Summary

Annex 1: Performance Indicator Summary 117
Indicator/Dimensions Scores ExplanationPillar 1: Budget Reliability D+ Overall rating based on M1 Methodology
PI-1 Aggregate expenditure outturn D
Aggregate expenditure outturn was 70.3%, 73.1%, and 79.6% of the original approved budget in the fiscal years 2014, 2015, and 2016 (equivalent to solar years 1393, 1394, and 1395, respectively).
PI-2 Expenditure composition outturn D+ Overall rating based on M1 methodology
2.1 Expenditure composition outturn by function
DVariance in expenditure composition by program, administrative or functional classification was 36%, 20%, and 20% in fiscal years 2014, 2015, and 2016, respectively.
2.2 Expenditure composition outturn by economic type
DVariance in expenditure composition by economic classification was 30%, 29%, and 24% in fiscal years 2014, 2015, and 2016, respectively.
2.3 Expenditure from contingency reserves C Actual expenditure charged to a contingency vote was on an
average 9% of the original budget.PI-3 Revenue outturn D Overall rating based on M2 methodology
3.1 Aggregate revenue outturn D
Actual revenue collection was 66%, 58%, and 76% of budgeted revenues in the fiscal years 2014, 2015, and 2016, respectively.
3.2 Revenue composition outturn D Variance in revenue composition was 23%, 44%, and 23% in
fiscal years 2014, 2015, and 2016, respectively.Pillar 2: Transparency of Public Finances
PI-4 Budget classification C
Budget formulation, execution, and reporting are based on administrative, program and economic classification using the GFSM 2001 classification standards. The Chart of Accounts is yet to be updated to comply with GFSM 2014.
Functional classification has been adopted and will be used for the SY1397 (2018) when there is a dedicated functional classification.
There is a Chart of Accounts showing the structure that is not supported by detailed explanations for the codes.
PI-5 Budget documentation C GoIRA provides 3 basic elements and 2 additional
elements (Details at Table 3.8)PI-6 Central government operations outside Financial reports
D Overall rating based on M2 methodology
6.1 Expenditure outside financial reports D*
GoIRA does not have a mechanism to determine the exact size of expenditure outside financial reports for the extra budgetary units and the expenditure of externally funded off-budget projects.
Annex 1: Performance Indicator Summary

Public Expenditure and Financial Accountability (PEFA) Performance Assessment Report118
Indicator/Dimensions Scores Explanation6.2 Revenue outside financial reports D* GoIRA does not have a centralized mechanism to determine
the exact size of the revenue outside fiscal reports.
6.3 Financial reports of extra-budgetary units D
Detailed financial reports of extra budgetary units are not submitted to the government annually within 9 months of the end of the fiscal year.
PI-7 Transfers to subnational governments
NA Overall scoring based on M2 methodology
7.1 Systems for allocating transfers NA
There are no pre-determined transfers from the Treasury to the provinces other than for activities and programs incorporated in the budgets of LMs.
Thus, this dimension is not applicable as there are no direct transfers to provinces, districts, and municipalities
7.2 Timeliness of information on transfers NA Not applicable
PI-8 Performance information for service delivery
D+ Overall rating based on M2 methodology
8.1 Performance plans for service delivery B
GoIRA adopted program-based budgeting and the notified structure allows the budget to include the program objectives, outcomes, and outputs and PIs. This structure is followed across the central government budgetary units. In practice, all but three budgetary units submitted the budget proposal on the notified structure.
8.2 Performance achieved for service delivery
C
The information on achievements provided in the budget is largely qualitative and that too in summary form. It lags a link with the performance indicators identified in the prior year’s budget.
8.3 Resources received by service delivery units D There is no evidence that information on resources received
by frontline service delivery units is collected and recorded.
8.4 Performance evaluation for service delivery
DIndependent evaluations and performance audits have been conducted for a few ministries and Kabul municipality in the years 2014, 2015 and 2016.
PI-9 Public access to Fiscal information D
The government makes available to the public 3 basic elements and 3 additional elements, in accordance with the specified timeframes (see Table 3.12).
Pillar 3: Management of assets and liabilitiesPI-10 Fiscal risk management D Overall rating is based on M2 methodology
10.1 Monitoring of public corporations D
There is neither evidence that audited annual financial statements for all SOEs and SOCs are published within six months of the end of the fiscal year nor are consolidated reports on the financial performance of SOEs and SOCs published by the central government annually.
10.2 Monitoring of subnational government
DThis indicator is assessed from municipalities’ perspective. Neither audited nor unaudited financial reports of the municipalities are published.

Annex 1: Performance Indicator Summary 119
Indicator/Dimensions Scores Explanation
10.3 Contingent liabilities and other fiscal risks
D
No report is published by the central government annually that quantifies and consolidates information on all significant contingent liabilities and other fiscal risks of the central government.
PI-11 Public investment management D+ Overall rating is based on M2 methodology
11.1 Economic analysis of investment proposals
C
There are presently no economic appraisal manuals prepared for all sectors. Detailed and methodical economic analyses are carried out for donor-funded projects. In FY 1396, of the total development portfolio, 53 percent comprised of the non-discretionary grants.,
11.2 Investment project selection
CBefore their inclusion in the budget, most major investment projects are prioritized by a central entity, however without a comprehensive and published criterion for project selection.
11.3 Investment project costing
DThe total cost of the project for the budget and the subsequent year are not included in the budget.
11.4 Investment project monitoring
DAnnual monitoring reports covering both physical and financial progress and providing causes for variation in the original and revised costs are not prepared.
PI-12 Public asset management D+ Overall rating is based on M2 methodology
12.1 Financial asset monitoring
C
The government maintains a record of its holdings in major categories of financial assets. Fair market value systems are not in place for other financial assets such as interests in SOEs and SOCs. Cash basis IPSAS, as the accounting standard is not formally adopted and fully compliant; thus, publication of information is inadequate.
12.2 Nonfinancial asset monitoring
D
The government maintains memorandum records of some fixed assets at the departmental level in a budget unit, which are not centralized at the budget unit level nor at the Treasury in the MoF. No records of non-produced assets are maintained. Holdings of nonfinancial assets are disclosed neither in budget documents nor in the Treasury financial statements.
12.3 Transparency of asset disposal
D
There are no written and approved procedures and rules for the transfer or disposal of nonfinancial assets, including a requirement for such information to be submitted to the Parliament either for information or approval.
PI-13 Debt management D+ Overall rating based on M2 methodology.
13.1 Recording and reporting of debt and guarantees
A
Debt records are complete, accurate, updated, and reconciled monthly. Annual debt sustainability analysis is conducted jointly by IMF and WB and report produced annually. Budget document contains debt statistics for 2-quarter duration extracted from the DSA.

Public Expenditure and Financial Accountability (PEFA) Performance Assessment Report120
Indicator/Dimensions Scores Explanation
13.2 Approval of debt and guarantees
D
According to the Constitution and PFEM the National Assembly approves all loans, explicit contingent liability, and loan guarantee on a case-by-case basis and authorizes the Ministry of Finance for debt management. However, policies and procedures to provide guidance on borrowing, debt issuance and monitoring of debt management by the single entity unit are not notified.
13.3 Debt management strategy
D
The government has a basic document guiding its debt management strategy approved in November 2005. The document has not been reviewed since. The IMF and the WB jointly conduct the debt sustainability analysis; however, GoIRA does not have a published medium-term debt management strategy - a requirement for rating of this dimension.
Pillar 4: Policy based fiscal strategy and budgetingPI-14 Macroeconomic and fiscal forecasting A Overall rating based on M2 methodology.
14.1 Macroeconomic forecasts
A
The forecast for key macroeconomic indicators is provided for the budget year and the three outer years with summary narrative on assumptions sourced from the fiscal strategy paper (FSP). Office of the High Economic Council chaired by the President approves the FSP and the World Bank reviews the forecasts.
14.2 Fiscal forecasts B
Forecasts of fiscal indicators – revenue (by type), aggregate expenditures and budget balances for the budget year and 3 outer years along with underlying assumptions in a summary form are included in the budget. The comparative budget data is provided; however, explanation of the main differences from the previous year’s forecast is not included.
14.3 Macro-fiscal sensitivity analysis
AFiscal forecast scenarios based on at least 4 alternative assumptions are included in the Fiscal Strategy Paper published on the MFPD website
PI-15 Fiscal strategy C+ Overall rating based on M2 methodology
15.1 Fiscal impact of policy proposals
BThe FSP, published on the MoF website, includes fiscal impact of policy changes in summary but is not presented to the legislature.
15.2 Fiscal strategy adoption
CMoF prepares fiscal strategy paper but is not submitted to the legislature with the budget documents.
15.3 Reporting on fiscal outcomes
C
GoIRA prepares annual fiscal strategy papers that presents summary data on the fiscal outcomes, particularly for the revenue; however, the impact of the expenditure related policy proposals is not reported. The budget document presented to the legislature contains fiscal outturns for the previous fiscal year but does not provide an explanation for the deviations. The FSP (MTFF) is not mandated to be presented to the legislature and does not contain a discussion on the deviation in fiscal targets.

Annex 1: Performance Indicator Summary 121
Indicator/Dimensions Scores ExplanationPI-16 Medium-term perspective in expenditure budgeting
D Overall rating based on M2 methodology
16.1 Medium-term expenditure estimates
C
The annual budgets (1395 and 1396) provided estimates of expenditure by broad economic classification for three outer years and the administrative classifications for the budget year only.
16.2 Medium-term expenditure ceilings
DThe BC-1 (issued April 2016) did not contain medium-term expenditure ceilings.
16.3 Alignment of strategic plans and medium-term budgets
DThe costed sector strategies were available for only 2 of the 25 LMs and these were also not aligned with budget estimates.
16.4 Consistency of budgets with previous year estimates
D
The budget document reports differences for the administrative and economic codes for the budget and previous years only and does not provide explanations for these observed deviations.
PI-17 Budget preparation process C Overall rating based on M2 methodology
17.1 Budget calendar CThere is a clear annual budget calendar issued. The 1396 calendar allowed just about four weeks. Delays were noted in the budget preparation for FY1396 (2017).
17.2 Guidance on budget preparation
C
There are clear budget circulars issued to budgetary units, covering total budget expenditure for the full fiscal year. The budget reflects ministry ceilings approved by the cabinet (or equivalent) before the circular’s distribution to budgetary units.
17.3 Budget submission to the legislature
C
The executive has submitted the annual budget proposal to the legislature at 1.5 months before the start of the fiscal year and approved by the Parliament in the second month of the new fiscal year.
PI-18 Legislative scrutiny of budgets C Overall rating based on M1 methodology.
18.1 Scope of budget scrutiny
CThe legislature’s review mainly covers details of expenditure and revenue for the budget year.
18.2 Legislative procedures for budget scrutiny
C
The legislature’s procedures to review budget proposals are included in the Parliament’s Rules of Procedure and are largely adhered. However, the rules do not prescribe comprehensive procedure and support.
18.3 Timing of budget approval
CThe legislature has approved the annual budget within one month of the start of the year in at least two of the last three fiscal years
18.4 Rules for budget adjustments by the executive
CThere are clear rules for in-year budget adjustments by the executive that are compiled with in most cases, but they allow extensive administrative reallocations.

Public Expenditure and Financial Accountability (PEFA) Performance Assessment Report122
Indicator/Dimensions Scores ExplanationPillar 5. Predictability and Control in Budget ExecutionPI-19 Revenue Administration D+ Overall rating based on M2 methodology
19.1 Rights and obligations for revenue measures
C
Information on taxpayer redress procedures is available on the ACD website. Taxpayer guides are available for some key topics from the ARD website. However, comprehensive information is not published on the ARD website, including objections procedures.
19.2 Revenue risk management
C
Overall risk management is not being used effectively in the ACD, with more than 65% declarations being diverted to red channelthe Red Lane Channel, which mandates physical inspections. Data indicate that physical inspections have detected less than 2% noncompliance, meaning proper physical inspections are not being conducted.
19.3 Revenue audit and investigation
D
In the case of the ACD, audit remains area of weakness. Out of approximately 147,000 declarations audited by post clearance audit teams, less than 1,000 declarations were found to be noncompliant. This indicates that while post clearance audits are completed in principle on paper, structured audits are not conducted in practice.
19.4 Revenue arrears monitoring
D
Data on arrears from the ARD Large Taxpayer Office (LTO) indicate that approximately 92% of arrears are uncollectable, due to the inability to complete write-offs. Thus, arrears account for approximately 55% of the LTO annual revenue. Data were not available across the ARD and ACD.
PI-20 Accounting for Revenue C+ Overall rating based on M1 methodology
20.1 Information on tax (and non-tax revenue)
B
All revenues are deposited directly into specified subaccounts of the Treasury Single Account at Da Afghanistan Bank. However, some entities responsible for non-tax revenues still use manual processes to reconcile transactions.
20.2 Transfer of revenue collections
APayments are deposited directly in the Treasury Single Account at Da Afghanistan Bank, eliminating risks associated with transfers from other agencies.
20.3 Revenue accounts reconciliation
C
The ARD and ACD, which account for most government revenue, undertake complete reconciliation of collections and transfers to Treasury within eight weeks of each month. However, assessments and arrears are not regularly reconciled.
PI- 21 Predictability of In-Year resource allocation
B Overall rating based on M2 methodology.

Annex 1: Performance Indicator Summary 123
Indicator/Dimensions Scores Explanation
21.1 Consolidation of cash balances
C
Most of the bank and cash balances are consolidated on daily basis; however, some of the funds/accounts are outside of the consolidation process. The existence of the dormant accounts with DAB reflects on the quality of the consolidation process.
21.2 Cash forecasting and monitoring
A
A cash flow forecast is prepared for the fiscal year and updated monthly based on cash inflows and outflows information provided by the Budget execution directorate, AMD and the LMs.
21.3 Information on commitment ceilings
BBudgetary units are provided reliable information on commitment ceilings at least quarterly in advance.
21.4 Significance of in-year budget adjustments
CSignificant in-year budget adjustments to budget allocations takes but are carried out in a transparent manner stipulated in the PFEM Law.
PI-22 Expenditure arrears D Overall rating based on M1 methodology
22.1 Stock of expenditure arrears
D*
Evidence exists of significant arrears. These are obligations not currently recorded in AFMIS. Surveys on arrears have not been routinely carried out with budgetary units to confirm existence or not of expenditure arrears.
22.2 Expenditure arrears monitoring
D
There are no procedures in place to monitor arrears in budget agencies. Data on the stock of arrears is not generated at least annually with a complete list by budget agencies indicating an age profile.
PI-23 Payroll controls D+ Overall rating based on M1 methodology23.1 Integration of payroll and personnel records
DMoE has carried out no reconciliation between payroll and personnel data during the last three years.
23.2 Management of payroll changes
DThe data for retroactive adjustments was not available to rate the indicator.
23.3 Internal control of payroll
DHigh incidence of payroll related ineligible expenditure reported by the auditors and monitoring agent.
23.4 Payroll audit CPartial payroll audits have been conducted but the coverage has been limited largely owing to the lack of access due to security situation.
PI-24 Procurement Management B+ Overall rating based on M2 methodology
24.1 Procurement monitoring
B
On the procurement website, databases or records are maintained for contracts, including data on what has been procured, value of procurement, and who has been awarded contracts. All procurement entities have access to the Procurement Management Information System (PMIS) through their user credentials and regularly update their procurement information, However, there are cases of below-threshold contracts in which procurement entities have not entered information for all the awarded contracts.

Public Expenditure and Financial Accountability (PEFA) Performance Assessment Report124
Indicator/Dimensions Scores Explanation
24.2 Procurement methods
A
Competitive bidding is the default method for all procurement above AFN 5,000. A written justification is placed in the record of the procurement proceedings stating the reasons for employing single-source procurement method. During FY2016, 88.6% of procurement has been processed using competitive methods, 2.7% is restricted tendering, and 8.5% is single-source method
24.3 Public access to procurement information
BOf the listed information requirements for public disclosures, not all procurement plans are available on the NPA website.
24.4 Procurement complaints management
B
According to Article 50 of the Procurement Law, there is an independent procurement-complaints address committee; the Administrative Review Committee follows processes for submission and resolution of complaints that are clearly defined and publicly available, exercises authority to suspend the procurement process, and issues decisions on time, however charges a refundable fee to entertain administrative reviews.
PI-25 Internal controls on non-salary expenditure
C Overall rating based on M2 methodology
25.1 Segregation of duties
C
Segregation of duties is prescribed throughout the expenditure process. However, issues with segregation of duties are mentioned in several internal audit reports, including many instances where the segregation of duties is compromised. More precise definition of important responsibilities is still needed.
25.2 Effectiveness of expenditure commitment controls
C
Expenditure commitment control procedures exist for the development budget, but not for the operational budget, which provide partial coverage and are thus partially effective.
25.3 Compliance with payment rules and procedures
CMajority payments are compliant with regular payment procedures. Instances of non-compliance were highlighted in the SAO and ARTF monitoring agent’s reports.
PI-26 Internal audit C+ Overall rating based on M1 methodology26.1 Coverage of internal audit
AIn accordance with the PFEM Law, there is an internal audit function at every state administration.
26.2 Nature of audits and standards applied
C
The MoF internal audit is more developed and focuses on adequacy and effectiveness of internal controls. However, the line departments’ internal audit is focused on financial compliance and lacks documentation to demonstrate compliance with international standards.
26.3 Implementation of internal audits and reporting
BInternal audit units prepare annual audit programs. Four of the five internal audit units assessed completed more than 75% of the planned audits.

Annex 1: Performance Indicator Summary 125
Indicator/Dimensions Scores Explanation
26.4 Response to internal audit
CMajority of the recommendations were implemented and the entities provide management response to the internal audit recommendations.
Pillar 6: Accounting and ReportingPI-27 Financial data integrity C+ Overall rating based on M2 methodology
27.1 Bank account reconciliation
BBank reconciliation for all active central government bank accounts takes place monthly within 15 days from the end of the month.
27.2 Suspense accounts BReconciliation of the first quarter’s revenue is completed within 1 to 2 months of the close of the quarter. Subsequently, monthly reconciliations are carried out.
27.3 Advance accounts DReconciliation of advance accounts takes place monthly; however, SAO reported outstanding advances some of which are 8 years old.
27.4 Financial data integrity processes
BAccess and changes to records are restricted and recorded and result in an audit trail but do not include financial integrity.
PI-28 In-year budget reports D+ Overall rating based on M1 methodology
28.1 Coverage and comparability of reports
DCoverage and classification of data does not allow direct comparison to original budget.
28.2 Timing of in-year budget reports
CBudget performance reports by the Budget Execution Directorate are prepared quarterly and issued within 8 weeks of the end of the quarter.
28.3 Accuracy of in-year budget reports
CThere are concerns about data accuracy. Expenditure is captured at the payment stage.
PI-29 Annual financial reports D+ Overall rating based on M1 methodology
29.1 Completeness of annual financial reports
C
Financial reports are prepared annually and are comparable with the approved budget. The financial reports do not include information on tangible assets and on guarantees and other contingent liabilities
29.2 submission of reports for external audit
DFinancial reports are submitted for external audit within 6 months of the fiscal year-end, however SAO reports that the financial report was incomplete.
29.3 Accounting standards
DThe standards used to prepare annual financial statements (Qatia accounts) are not disclosed.
Pillar 7: External Scrutiny and AuditPI-30 External Audit D+ Overall rating based on M1 Methodology
30.1 Audit coverage and standards
C
All budgetary government entities are audited annually. The SAO has adopted International Standards of Supreme Audit Institutions (ISSAI) as its national standards but they are not fully implemented, and audit documentation mainly comprise supporting documents for the audit observations.

Public Expenditure and Financial Accountability (PEFA) Performance Assessment Report126
Indicator/Dimensions Scores Explanation30.2 Submission of audit reports to the legislature
AFor the last three fiscal years, the SAO submitted the Qatia audit reports to the legislature within three months of the receipts of the Qatia accounts from the MoF.
30.3 External audit follow up
BThe audit follow-up mechanism was operational in all three fiscal years, and formal response to the audit observations was provided to the audit entities.
30.4 SAO independence D
There is no provision in the Constitution related to external audit or the SAO. According to the SAO Law, the President has the powers to appoint and remove the Auditor General. However, according to the Constitution, the President is the head of the executive branch and a part of legislature. No approval from the legislative assembly is required to appoint or remove the Auditor General. The SAO can independently implement the budget once approved by the Parliament though the budget is subject to the MoF review and there have been some cuts.
PI-31 Legislative scrutiny of audit reports
C+ Overall rating based on M2 methodology
31.1 Timing of audit report scrutiny
BPAC reviewed audit reports on Qatia accounts within 6 months of receipt and submitted its report to the plenary session.
31.2 Hearings of audit findings
A
PAC hearings to review audit reports on Qatia accounts are in-depth. All audited entities attend the respective PAC session. In addition, SAO and MoF representatives participate in all PAC sessions.
31.3 Recommendations on audit by the legislature
CPAC issues recommendations on actions to be implemented by the legislature but there is no systemic follow-up on their implementation.
31.4 Transparency of legislative scrutiny of audit reports
DPAC hearings are not public and the PAC report is published neither on an official website nor by any other means easily accessible to the public.

Annex 2: Summary of Observations on the Internal Control Framework 127
Annex 2Summary of Observations on the
Internal Control Framework

Public Expenditure and Financial Accountability (PEFA) Performance Assessment Report128
Annex 2: Summary of Observations on the Internal Con-
trol FrameworkInternal Control
Components and Elements Summary of Observations
1. Control Environment
The 2005 Public Finance and Expenditure Management (PFEM) Law and the 2006 Financial Regulations provide the legal framework for the development of Financial Management and Control (FMC). Under the Law, the requirement to introduce FMC applies to all public institutions. Article 6 of the PFEM law, along with the Financial Regulations, assigns each budgetary unit the responsibility for controls in their operations. The Budget Manuals, Treasury and Special Disbursement Unit Manuals, internal audit manual provide the supporting guidance for the control environment while the financial controllers (representatives of the Treasury Directorate conduct pre-audit and the recently introduced internal audit at each budgetary unit are established with the objective to ensure adequate control environment. Although a relatively robust theoretical framework is provided however the practices evident from PI 23 and 25 depicts weaknesses particularly with the payroll and non-salary expenditure and commitment controls.
1.1 The personal and professional integrity and ethical values of management and staff, including a supportive attitude toward internal control constantly throughout the organization
Modalities put in place including internal and external audit or legal procedures leading to prosecution by government have positively impacted in internal control in documentations. However, low level of salaries, pervasive corruption in the public sector (69% of the respondents in a national survey conducted by the Asia Foundation in 2017 consider corruption as major problem in their daily life), and weak accountability systems have affected the personal and professional integrity at all levels of the public sector.
1.2 Commitment to competence
The competency framework and commitment is defined in the civil service law and the relevant codes and procedures of the Government. There is a high level of push from the President for improving competence in the public sector and especially in public financial management. Low education level among the current public servants and lack of a systematic pre-service or an effective in-service training and capacity building are affecting the competence within the public sector. Additionally, widespread interventions of the political and powerful actors in recruitment and placement of the public servants makes patronage prevail over competence and adversely affect the overall capacity in the public sector.

Annex 2: Summary of Observations on the Internal Control Framework 129
Internal Control Components and Elements Summary of Observations
1.3 The ‘tone at the top’ (i.e. management’s philosophy and operating style)
The PFEM Law obligates the authorities in the state administration in the organization of financial affairs, Management of financial affairs, protection of public assets, preparation of budget, and the management of public expenditure. The Financial regulations and the supporting manuals stipulates that the resources of the Government shall be managed, expended, or utilized in accordance with law and regulations and safeguarded against loss or wastage. In practice the management and operating style in Afghanistan is hierarchical in nature and the decisions are by and large top down with less inclusiveness and consultations. The ambiguity in the stated functional mandates, the authority exercised (at times) does not commensurate with the legal mandate. Moreover, mutliple organizations are involved in curbing corruption which has led to the adoption of practices by the executive to dilute the responsibility. The large number of signatures on a small payment or certification process is a good proxy indicator for how the collectively taken decisions obfuscates the decision making responsibility.
1.4 Organizational structure The role of the various parties involved in the financial management control system is established in the PFEM Law and the Financial Regulations. These include the Minister of Finance, the entity authorizing officer and subordinate authorizing officers, executing officers, and line managers.
The government is taking practical steps towards the development of the management accountability and delegation of tasks in accordance with the Law. Full implementation of the requirements will take time to be fully and effectively implemented in public bodies. Many finance units are understaffed, undermining the principles of segregation of duties and achievement of the public sector unit objectives. Public sector units must establish an organizational structure that enables the achievement of the objectives and compliance with the functions assigned by legislation. It must be presented in documentary form, stating clearly the rules for determining and segregating tasks, duties and responsibilities, as well as hierarchy and appropriate reporting lines. In addition, internal regulations and job descriptions need to be updated to fully reflect the recent regulatory changes.
1.5 Human resource policies and practices
The basic legal and regulatory framework for HR management exist. The existing Civil Servants Law, the Labor Law and the Regulation on Personnel Affairs of the Civil Servants and Regulation on the Pension and other regulations related to the HRM in the civil service set basics legal framework for management of the civil servants. However, these laws and regulations in practice are not applied fair and equally. Throughout the system bureaucrats use outdated and convoluted procedures either for rent seeking or lack of thorough understanding of the changes to the laws and regulations. Several types of contracts and different pay scales within the public sector are also affecting fairness and transparency in the HRM.

Public Expenditure and Financial Accountability (PEFA) Performance Assessment Report130
Internal Control Components and Elements Summary of Observations
2. Risk assessment
The implementation of modern risk management practices is in its infancy in Afghanistan. Most of the efforts on risk management focus on fiscal risk and these efforts show limited effectiveness on monitoring the SOEs and SOCs. There are no risk registers being prepared on a systematic basis.
2.1 and 2.2 Risk identification and assessment (significance and likelihood)
Risk related indicators depict unsatisfactory results, particularly with regard to compliance with the risk assessment and identification process. The revenue risk management (PI 19) is partially conducted while the internal audit (PI 26) focuses mainly on financial audit. With regard to the controls framework the controls on the salary particularly the payroll audit (PI 23) is weak and so are the results of the non-salary expenditure controls. The external audit report has identified, though ex-post, the associated risks. The capacity building of the internal auditors is critical to risk identification and assessment in the controls framework. MoF has commenced the capacity building process.
2.3 Risk evaluation During 2016, 78%% of the audit plan has been implemented. Internal auditors submit their reports to the Minister and the head of the public entity audited. However, the internal audit function still has no systematic or diagnostic nature in assessing the effectiveness of the internal control.
2.4 Risk appetite assessment Not carried out for internal controls separately in detail, however functional level risk assessments like the revenue risk management is partially carried out.
2.5 Responses to risk (transfer, tolerance, treatment or termination)
Not carried out systematically.
3. Control activities
Recent internal audit reports and external audit annual reports note shortcomings in control activities, processes and procedures. The reports noted that the manuals and audit trails depicting processes and control activities are not prepared and implemented in all public institutions. In addition, descriptions of formal business processes often go undocumented.
3.1 Authorization and approval procedures
The Treasury Manual and the Special Disbursement Unit Manual provides for an elaborate procedures for authorization and approval procedures to be followed in all expenditure transactions ranging from the approval of allotments (b27) preparation of claim voucher (M16) for payment; approval of expenditure; registration of purchase order/claim voucher; certification (pre-audit by the financial controllers); authorization of payment; issue of payment; recording of expenditure in the accounting records. A comprehensive process flow model in respect of major categories of expenditures is provided for

Annex 2: Summary of Observations on the Internal Control Framework 131
Internal Control Components and Elements Summary of Observations
3.2 Segregation of duties (authorizing, processing, recording, reviewing)
Segregation of duties. While segregation of duties is prescribed throughout the expenditure process, many organizations need to update roles and responsibilities in line with recent organizational changes as well as changes in internal regulations.
3.3 Controls over the access to resources and records
Compliance with payment rules and procedures. The majority of payments are compliant with regular payment procedures. The majority of exceptions are properly authorized and justified.
3.4 Verifications The treasury manual and the SDU manual provides for detailed procedures for internal controls for the verification process. While, multiple levels of checks are in place starting from the financial controllers at the budgetary units, treasury/mustofiat office and ex post audit by the SAO.
3.5 Reconciliations Banks account reconciliations. Bank reconciliation for all active central government bank accounts takes place (27.1) however instances were also noted of outstanding balances in project accounts that had gone dormant. Similarly, gaps in revenue reconciliations were observed as provided for in PI-20.
3.6 Reviews of operating performance
The operating performance largely focuses on the fund utilization. The performance evaluation at the service delivery unit level is non-existent, while the disconnect between the outputs and outcomes with the annual budget obscures the LM level performance evaluation (PI-8). The monitoring of the operating performance of the SOE and SOCs is particularly lagging, owing to the lack of availability of fiscal information (PI-8). Currently the SAO office provides a summary detail of the operating performance of the budgetary units on sample basis while the internal audit at the LMs is nascent and owing to its capacity largely focuses on financial compliance.
3.7 Reviews of operations, processes and activities
The reviews of operations, processes and activities within the government are not integrated and systematically planned. Needs based reviews are conducted and amendments made evident from the continuous changes in the budget forms submissions. The internal audit function in the past have experienced constant debates between MoF and the SAO with respect to the mandate till the amendment in the PFEM Law settled the issue and the internal audit function was made mandatory at each State Administration reporting to the respective ministers. The internal audit function being nascent lags to the capacity to conduct system reviews and strengthening. MoF is providing support to build capacity of the internal auditors at the State Administrations. The SAO reports although identify gaps in the control framework.
3.8 Supervision (assigning, reviewing and approving, guidance and training)
The Financial Regulations supported with the Treasury Manual and SDU manual and the procurement framework defines the delegated authorities and the responsibilities.

Public Expenditure and Financial Accountability (PEFA) Performance Assessment Report132
Internal Control Components and Elements Summary of Observations
4. Information and communication
Recent reports note that there is a general lack of understanding of how financial information can be used to improve efficiency and effectiveness. Quality of financial information is also an issue as evidenced by the weaknesses identified in in-year budget reports (PI-28) and the annual financial reports (PI-29). Of particular concern is the use of revised rather than original budget figures; which limits their effectiveness as a management monitoring tool.
5. Monitoring
5.1 Ongoing monitoring A multi-tier M&E framework exists in Afghanistan starting from the M&E units at the LMs the MOEc, the MoF has been recently accorded a role while the President’s initiative (Joint Anti-Corruption Monitoring and Evaluation Committee) has been rolled out. The monitoring of the SOEs and SOCs is weak evident from PI 6 and 10 while the performance evaluation framework is undermined with highly centralized structure (PI-8). Similarly external mechanisms (PI 18, 30 and 31) in terms of external scrutiny and audit of the budget (Ex ante) and fiscal operations (Ex post) are provided for in the government systems, however the quality of monitoring and transparency needs improvements. In addition given the large donor funded portfolio independent mechanism have been put in place to monitor donor funded expenditure on both recurrent and development side.
5.2 Evaluations The MOEc has been tasked with the M&E function however the performance has been unsatisfactory largely owing to the lack of systems and capacity and over centralized expenditure function. Although the MoF recently has been accorded a role, though the development is beyond this PEFA review period. The SAO has started conducting performance audit reports however are not pat of the legislative oversight as the Commission only focuses on the financial audit reports. The legislative commissions of the Upper and Lower house also have an oversight role, however is largely focused o the budget utilization only.
5.3 Management responses Management response evident from 26.4 is timely. Internal audit reports upon approval of the respective minister are issued to the relevant officials through an official letter that asks for response within a prescribed time. In majority of the cases, the relevant officials respond to audit observations either providing further evidence or agreeing to implement the audit recommendations. Compliance with the agreed actions is usually reviewed as part of the subsequent year’s audit

Annex 3: Source of Information 133
Annex 3Source of Information

Public Expenditure and Financial Accountability (PEFA) Performance Assessment Report134
Annex 3: Source of Information
Annex 3 A: List of Surveys and Analytical Work
BDO (2016) ‘Detailed Annual Management Report for FY 2106’, BDO providing services as the Monitoring Agent for the Afghanistan Reconstruction Trust Fund
Boex, Jamie (2013) ‘PEFA Performance Measurement Framework at Sub National Government Level–definitions and typology’ Working paper for PEFA secretariat’. Used for PI-7
IMF (2001 and 2014) ‘Government Finance Statistics Manual’ 2001 and 2014
IMF (2009), Afghanistan, Fifth Review Under the Three-Year Arrangement Under the Poverty Reduction and Growth Facility, Country Report No. 09/135, April.
IMF (2010) ‘Afghanistan HIPC Initiative Paper, Country Report No:10/40 February
IMF (2011), ‘Afghanistan, 2011 Article IV Consultation and Request for a Three-Year Arrangement Under the Extended Credit Facility, Country Report No. 11/330, November
IMF (2012a) ‘Advancing Public Financial Management Reforms’ April 2012
IMF (2012b): Afghanistan, First Review Under the Extended Credit Facility Arrangement, Country Report No. 12/245, August.
International Budget Partnership (2017) ‘Open Budget Survey Report [accessed on 07 March 2018] https://www.internationalbudget.org/open-budget-survey/
PEFA Secretariat (2016), Framework for Assessing Public Financial Management, February 2016.PEFA Secretariat (2013) Afghanistan Public Financial Management Assessment Report Popal, O.B (2014) ‘Municipalities in Afghanistan’ Research Paper [accessed on 07 Apr 2018] http://dmm.gov.af/Content/files/Municipalities%20in%20Afghanistan_final(1).pdf
United Nations (2008) ‘System of National Accounts’
Bird. W.A and Payenda, M.K (2016) ‘Afghanistan’s Revenue Turnaround in 2015’, Peace Brief, United States Institute of Peace
World Bank (2017), Afghanistan Development Update, May 2017 edition.
Annex 3 B: List of Individuals Met
Khalid Payenda Deputy Minister Finance, MoFMohammad Aqa Deputy Minister, Administration, MoF

Annex 3: Source of Information 135
Ministry of Finance, Performance management and Fiscal reforms teamHameedullah Sherani HeadAhmad Khalid PFM SpecialistFrozan Darwish PFM SpecialistNusimullah Lutifi PFM Specialist Waseem Usman
Ministry of Finance, Budget DepartmentNaveed Ahmad Niaz National Budget Planning & Reform DirectorSayed Naseer Ahmad National Budget Planning & Policy Manager Zabihullah Zelal National Budget Reform Manager Asmar Amir National Budget Planning & Policy SpecialistAjmal Waziri National Budget Reform Specialist/Acting Manager
Ministry of Finance, Revenue DepartmentAbdul Habib Zadran Director General, ARD Muhammad Hamed Naikzad Sub-Director Risk Based Unit, Legal Services and Policy Directorate
Ministry of Finance, Finance and Accounting DirectorateAlem Shah Ibrahimi Director of Finance and Accounting
Ministry of Finance, Treasury DepartmentMohammad Hussain Hazara Directorate General Treasury Brijiesh Bamalwa Regulation Adviser Massod Kharooti Senior Manager AFMIS Abdul Haq Contract & Debt Management Manager Vishal Gandi Accounting Adviser Bilal Hashmi Senior Accounting Specialist Abdul Rahim Senior Manager Debt Management Ahmad Zia Development Budget Reconciliation Manager Shapoor Taqat Coordinator for Verified Payroll ProgramSayed Bilal Hashmi
Ministry of Finance, Customs DepartmentEhsanullah Kamal Head of Project Coordination and Reforms Qais Mohammadi Customs Reforms and Modernization SpecialistAarangzeg Customs Reform & Modernization Specialist
Ministry of Finance, Macro Fiscal Performance DepartmentShams Ul Haq Noor Acting General Director of Macro Fiscal Performance DepartmentAbdul Rahman Rahimi Senior EconomistYama Ahmady Senior EconomistHassenUllah Ahmadzai Revenue Analyst Waseem Usman Economist Mahdi Frough Economist Hafeezullah Momandi

Public Expenditure and Financial Accountability (PEFA) Performance Assessment Report136
Ministry of Finance, Internal Audit DepartmentMohammad Yousuf Ghaznavi General Director Mahmood Qadri Project Coordinator
Ministry of Finance, SOE DepartmentShams Ibrahimi General director of SOECsMr Mohammad Yousif Osman SOEs director”Mr Mohammad Naseer Ibrahimkhil SOCs acting DirectorSamiullah Sultani SOEs Directorate Executive Manager
Ministry of Finance, Policy DepartmentMohamad Abid Amiri Director of Monitoring and EvaluationSadaf Dashti Director of National Policies Analysis
National Procurement AgencySohail Kaakar Acting DG and SCID DirectorMerajudin Rashid Legal ManagerWais Rahimi PFD DirectorShafiqullah Hakimi Ex-Policy ManagerPatyal Ghorzang CPMD DirectorAhmad Naqshbandi Cadre Management DirectorOmar Ahadzadah NPC-S Goods Manager
Supreme Audit OfFiceMujeeb Shirzad Admin and Finance Deputy Auditor GeneralBashir Rashidy External Grants Audit DirectorHanan Maroof Central Budgetary Units Audit DirectorHamidullah Faqairy Development Budget ManagerAhmad Shekib Kardost Performance Audit ManagerShekib Kardoost Manager Performance Audit
Ministry of EconomyJahed MatiullahMirwais Baheej
ParliamentMohammad Atta Khawari Director, Research Services Department of Wolesi JirgaMohammad Reza Sadeqi Chief of Economic and Budget Analysis, Research Services Department of Wolesi Jirga
Development PartnersRomal Sanjeeda, Economist DfIDRichard Taylor, Team Leader DfIDBarbara Egger European Union
OthersSyed Bilal Hashimi Dy. CEO, CPA Waleed Rashid Economic Advisor to DM FinanceMohammad Haroon Liaison Specialist - Chief of StaffAhmad Shoaib M&E Specialist MoF

Annex 4: Summary of Changes in Performance Based on 2011 PEFA Methodology 137
Annex 4Summary of Changes in
Performance Based on 2011 PEFA Methodology

Public Expenditure and Financial Accountability (PEFA) Performance Assessment Report138
Indicator/Dimension
Score 2013
Score 2017
Description of Requirements Met in Current Assessment
Explanation of Change (Including
Comparability Issues)A. PFM-OUTTURNS: Credibility of the BudgetPI-1 Aggregate expenditure outturn compared to original approved budget
C D
Aggregate expenditure outturn was between 70% and 79% (deviation between 21% and 30%) of the approved aggregate budgeted expenditure in the last three years.
Aggregate budget credibility deteriorated. Aggregate deviation was between 4% and 13.5% in the previous assessment.
PI-2 Composition of expenditure outturn compared to original approved budget
D+ D+
Scoring method M1 (weakest link)
(i)Extent of the variance in expenditure composition during the last three years, excluding contingency items
D D
The composition variance between the expenditures outturn by function and the budgeted expenditure exceeds 15% in all three years of assessment.
No change in performance. However, in previous assessment, variance exceeded 15% in two of the last three years.
(ii)The average amount of expenditure charged to the contingency vote over the last three years.
A C
Actual expenditure charged to a contingency vote was on average at 9% of the original budget for the three years assessed (less than 10%).
The performance would be the same, had the 2013 rating considered expenditure charged to contingency budget. To execute, contingency budget is to be appropriated to a specific organization. It appears that the due to the need of this appropriation, 2013 PEFA reported nil expenditure charged to contingency vote.
Annex 4: Summary of Changes in Performance Based on
2011 PEFA MethodologyThis annex presents a comparison of the current assessment with the previous assessment, pub-lished in August 2013 using the 2011 version of the framework. It was prepared in compliance with the guidance on reporting performance changes in PEFA 2016 from previous assessments that applied PEFA 2005 or PEFA 2011 available at www.pefa.org.
Table A4.1. Summary of Changes in PFM Performance Using 2011 Methodology

Annex 4: Summary of Changes in Performance Based on 2011 PEFA Methodology 139
Indicator/Dimension
Score 2013
Score 2017
Description of Requirements Met in Current Assessment
Explanation of Change (Including
Comparability Issues)PI-3 Aggregate revenue outturn compared to original approved budget
C B
Actual domestic revenue was between 94% and 112% of the budgeted revenue for two of the three years assessed.
Improved performance. Previously, actual domestic revenue was between 92% and 116% of the budgeted revenue.
PI-4 Stock and monitoring of expenditure payment arrears C+ D
Scoring method M1 (weakest link)
(i)Stock of expenditure payment arrears and a recent change in the stock.
A D
No information available on the extent of stock of expenditure payment arrears for the last three years.
Decrease in performance. 2013 assessment mentioned that the stock of expenditure arrears was very low at 0.08% of total expenditure at end of FY1391.
(ii)Availability of data for monitoring the stock of expenditure payment arrears.
C D
There is no reliable data on the stock of expenditure payment arrears for the last three years.
Decrease in performance. 2013 assessment mentioned that the MoF had collected data on arrears based on ministry level surveys covering the operating budget of all budgetary units for the two most recent years at that time.
B. KEY CROSS-CUTTING ISSUES: Comprehensiveness and Transparency
PI-5 Classification of the budget
C C
Budget formulation, execution and reporting are based on administrative, program and economic classification using the GFSM 2001 and the chart of accounts is yet to be updated to comply with GFSM 2014. Functional classification is not used.
No change in performance.

Public Expenditure and Financial Accountability (PEFA) Performance Assessment Report140
Indicator/Dimension
Score 2013
Score 2017
Description of Requirements Met in Current Assessment
Explanation of Change (Including
Comparability Issues)PI-6 Comprehensiveness of information included in budget documentation C C
FY1396 (2017) budget documentation fulfills 3 of the 9 elements, i.e. macro-economic assumptions, fiscal deficit, and current year’s budget.
No change in performance. In 2013, the budgetary impacts of revenue including sensitivity analysis were a part of budget documents. This information is now included in the FSP.
PI-7 Extent of unreported government operations.
NR AScoring method M1 (weakest link)
(i)Level of unreported government operations
NR NR
For both 2013 and 2017 assessments, this dimension cannot be rated because expenditure data related to extra budgetary operations is not available.
No change in performance.
(ii)Income/expenditure information on donor-funded projects
A A
For all on-budget donor funded projects, funds are channelled through the treasury system. In total as well as project specific receipts and expenditures are included in the fiscal reports.
No change in performance.
PI-8 Transparency of inter-governmental Fiscal relations.
A AScoring method M2 (average)
(i) Transparency and objectivity in the horizontal allocation amongst Subnational Governments
NA NA
For both 2013 and 2017 assessments, this dimension is not applicable, as Afghanistan does not have an inter-governmental transfer system.
No change in performance.
(ii) Timeliness and reliable information to subnational governments on their allocations
NA NA
For both 2013 and 2017 assessments, this dimension is not applicable, as Afghanistan does not have an inter-governmental transfer system.
No change in performance.

Annex 4: Summary of Changes in Performance Based on 2011 PEFA Methodology 141
Indicator/Dimension
Score 2013
Score 2017
Description of Requirements Met in Current Assessment
Explanation of Change (Including
Comparability Issues)(iii) Extent of consolidation of fiscal data for general government per sectoral categories
A A
The Treasury department collects annual fiscal data – budgeted and actual expenditures for all municipalities receiving budget allocations from MoF. This budget and expenditure data is consolidated in the annual Qatia statement within 6 months after the close of the FY.
No change in performance
PI-9 Oversight of aggregate fiscal risk from other public sector entities.
D+ D+
Scoring method M1 (weakest link)
(i)Extent of central government monitoring of autonomous entities and public enterprises
D D
GoIRA does not have a formal and robust coordination nor centralized fiscal risk monitoring mechanism for SOEs and SoCs.
No change in performance.
(ii)Extent of central government monitoring of subnational government’s fiscal position A A
If SN government cannot generate fiscal liabilities for central government, it qualifies for ‘A’ score as per 2011 framework.
This dimension is assessed for municipalities that cannot borrow and generate liabilities as per the legal framework.
No change in performance.

Public Expenditure and Financial Accountability (PEFA) Performance Assessment Report142
Indicator/Dimension
Score 2013
Score 2017
Description of Requirements Met in Current Assessment
Explanation of Change (Including
Comparability Issues)PI-10 Public access to key Fiscal information
B B
The government made available to the public 4 of the 6 listed types of information; annual budget, year-end financial statements, external audit reports and data on contract awards.
No change in performance.
C. BUDGET CYCLE
C(i) Policy-Based Budgeting PI-11 Orderliness and participation in the annual budget process
C+ C+
(i) Existence of, and adherence to, a fixed budget calendar
B B
A clear annual budget calendar exists, but deviations are often experienced in its implementation. The LMs are allowed four weeks to prepare budget estimates.
No change in performance.
(ii) Guidance on the preparation of budget submissions
C C
A comprehensive & clear budget circular is issued but the first circular (BC 1) does not reflect the indicative ceilings. The ceilings are approved by the Cabinet and conveyed in the second circular (BC 2), which is issued 3 months prior to the submission of the budget to the legislature.
No change
(iii) Timely budget approval by the legislature C C
The legislature has approved the budget for all three past years within two months of the start of the new fiscal year.
No change in performance.
PI-12 Multi-year perspective in Fiscal planning, expenditure policy and budgeting
C+ C+

Annex 4: Summary of Changes in Performance Based on 2011 PEFA Methodology 143
Indicator/Dimension
Score 2013
Score 2017
Description of Requirements Met in Current Assessment
Explanation of Change (Including
Comparability Issues)(i)Multiyear fiscal forecasts and functional allocations
C C
Forecasts of fiscal aggregates (on the basis of the main categories of economic classification) are prepared for the budget year and for at least the next three years on a rolling annual basis. However, no link between forward forecasts and subsequent budget estimates is provided.
No change in performance.
(ii)Scope and frequency of debt sustainability analysis
A A
The Framework allows for external support in carrying out debt sustainability analysis. IMF and the WB support GoIRA in conducting DSA. Joint IMF and WB DSA were conducted in 2015, 2016 and 2017.
No change in performance. Previously, MoF carried out DSA with the support of consultants.
(iii) Existence of costed sector strategies
C C
Statements of sector strategies exist for various sectors but costed strategies have been prepared only for few sectors that are also inconsistent with aggregate fiscal forecasts.
No change in performance.
(iv) Linkages between investment budgets and forward expenditure estimates
D D
Budgeting for investment and recurrent costs are separate processes with no recurrent costs of the projects being shared.
No change in performance.
C(ii) Predictability and Control in Budget Execution PI-13 Transparency of taxpayer obligations and liabilities
C+ C+
(i) Clarity and comprehensiveness of tax liabilities
C C
Legislation and procedures for some major taxes are comprehensive and clear, but the fairness of the system is questioned due to substantial discretionary powers of the government entities involved.
No change in performance.

Public Expenditure and Financial Accountability (PEFA) Performance Assessment Report144
Indicator/Dimension
Score 2013
Score 2017
Description of Requirements Met in Current Assessment
Explanation of Change (Including
Comparability Issues)(ii) Taxpayer access to information on tax liabilities and administrative procedures
B B
The ARD and ACD for major taxes have provided on its website the user guides for tax liability. ARD and ACD also conduct citizens outreach campaigns.
No change in performance.
(iii) Existence and functioning of a tax appeal mechanism.
C C
A tax appeals system of administrative procedures has been established, but it is not fully effective and might need substantial redesign to be fair, transparent and effective. Limited recourse to the mechanism suggests that taxpayers are unaware of it or do not consider it a worthwhile recourse.
No change in performance.
PI-14 Effectiveness of measures for taxpayer registration and tax assessment
C+ C+
Scoring method M1 (weakest link)
(i) Controls in the taxpayer registration system
B B
Taxpayers are registered in a complete database system with some linkages to other relevant government registration systems and financial sector regulations.
No change in performance.
(ii) Effectiveness of penalties for non-compliance with registration and declaration obligations
C C
Penalties for non-compliance generally exist, but substantial changes to their structure, levels or administration are needed to give them a real impact on compliance.
No change in performance.
(iii)Planning and monitoring of tax audit and fraud investigation programs C C
There is a continuous program of tax audits and fraud investigations, but audit programs are not based on clear risk assessment criteria. In the case of ACD audit remains an area of weakness.
No change in performance.

Annex 4: Summary of Changes in Performance Based on 2011 PEFA Methodology 145
Indicator/Dimension
Score 2013
Score 2017
Description of Requirements Met in Current Assessment
Explanation of Change (Including
Comparability Issues)PI-15 Effectiveness in collection of tax payments NR D+
Scoring method M1 (weakest link)
(i) Collection ratio for gross tax arrears
NR D
The debt collection ratio in the most recent year was below 60% and total amount of tax arrears is very significant (55% of LTO’s annual revenue).
Improvement in respect of data to assess this dimension that was not available in the previous assessment.
(ii) Effectiveness of transfer of tax collections to the Treasury by the revenue administration
A A
All tax revenue is paid directly into accounts controlled by the Treasury or transfers to the Treasury are made daily.
No change in performance.
(iii) Frequency of complete accounts reconciliation between tax assessments, collections, arrears records, and receipts by the Treasury
D D
Complete reconciliation of tax assessments, collections, arrears and transfers to Treasury takes place annually within 6 months of end of the year.
No change in performance.
PI-16 Predictability in the availability of funds for commitment of expenditures
B+ C+
(i) Extent to which cash flows are forecasted and monitored
A A
A cash flow forecast is prepared for the fiscal year and updated monthly..
No change.
(ii) Reliability and horizon of periodic in-year information to ministry/department/ agency’s on ceilings for expenditure
B B
Budgetary units receive reliable information on commitment ceilings at least quarterly in advance.
No change in performance.

Public Expenditure and Financial Accountability (PEFA) Performance Assessment Report146
Indicator/Dimension
Score 2013
Score 2017
Description of Requirements Met in Current Assessment
Explanation of Change (Including
Comparability Issues)(iii) Frequency and transparency of adjustments to budget allocations above the level of management of ministry/department/agency’s
B C
Significant in-year budget adjustments are frequent and partially transparent. These include adjustments to contingency and supplementary budget mainly for non-discretionary development projects. The supplementary budget increases the size of budgeted expenditure. Discretionary budget adjustments are largely carried out twice a year.
Decrease in performance. The 2013 score did not consider adjustments to contingency and supplementary grants.
PI-17 Recording and management of cash balances, debt and guarantees
B+ B+Scoring method M2 (average)
(i) Quality of debt data recording and reporting.
A A
Debt records are complete, accurate, updated, and reconciled regularly on a monthly basis. Annual debt sustainability analysis is conducted jointly by IMF and WB and report produced annually. Budget document contains debt statistics for 2-quarter duration extracted from the DSA,
No change in performance.
(ii) Extent of consolidation of the government’s cash balances.
B B
Most cash balances calculated and consolidated on daily basis, but some extra-budgetary funds and the special fund ledger subaccounts remain outside the arrangement.
No change in performance
(iii) Systems for contracting loans and issuance of guarantees.
B B
Central government’s contracting of loans and issuance of guarantees are made within limits for total debt and total guarantees, and always approved by a single responsible government entity.
No change in performance.

Annex 4: Summary of Changes in Performance Based on 2011 PEFA Methodology 147
Indicator/Dimension
Score 2013
Score 2017
Description of Requirements Met in Current Assessment
Explanation of Change (Including
Comparability Issues)PI-18 Effectiveness of payroll controls B D+
Scoring method M1 (weakest link)
(i)Degree of integration and reconciliation between personnel records and payroll data.
B D
Personnel and payroll record is not integrated. It may take up to three months to reflect some of the changes to the personnel records and payroll particularly in the three LMs (Education, Interior and Defense,) that have decentralized payroll record and payment system. Reconciliation of the payroll and personnel record has not been carried out.
Decrease in performance.
(ii) Timeliness of changes to personnel records and the payroll.
B D
The review takes into account the size of the retroactive adjustments in relation to the total wage bill. In the 2018 review, the data on retroactive adjustments was not available for entities other than MoF. Owing to the disintegrated personnel record and payroll system in the MOE, the exact size of the retroactive adjustments could not be calculated hence the decrease in performance.
Decrease in performance.
(iii) Internal controls of changes to personnel records and the payroll.
B C
Controls exist to ensure the integrity of the payroll data of greatest importance, but are not adequate to ensure full integrity of data. Audit and monitoring reports indicate high incidence of payroll related ineligible expenditure.
Decrease in performance.

Public Expenditure and Financial Accountability (PEFA) Performance Assessment Report148
Indicator/Dimension
Score 2013
Score 2017
Description of Requirements Met in Current Assessment
Explanation of Change (Including
Comparability Issues)(iv) Existence of payroll audits to identify control weaknesses and/or ghost workers.
B D
Payroll record is manually maintained at MOE and with various positions recruited at the central and provincial level, missing pieces of personnel record were reported by SAO, internal audit and monitoring agent. However, no specific payroll audit or staff survey was carried out during the review period.
Decrease in performance.
PI-19 Competition, value for money and controls in procurement
B+ B+Scoring method M2 (Average of dimensions)
(i)Transparency, comprehensiveness, and competition in the legal and regulatory framework.
A B
For the 2017 assessment, the legal framework met four of the six listed requirements for this dimension.
(ii)Use of competitive procurement methods. B B
When contracts are awarded by methods other than open competition, they are justified in accordance with the legal requirements for at least 80% of the value of contracts awarded.
No change in performance.
(iii)Public access to complete, reliable and timely procurement information. A A
All the key procurement information elements are complete and reliable for government units representing 90% of procurement operations (by value) and made available to the public on time through appropriate means.
No change in performance.
(iv)Existence of an independent administrative procurement complaints system.
B B
In total five (first two and three other) of the seven criteria listed for this dimension have been met.
No change in performance.

Annex 4: Summary of Changes in Performance Based on 2011 PEFA Methodology 149
Indicator/Dimension
Score 2013
Score 2017
Description of Requirements Met in Current Assessment
Explanation of Change (Including
Comparability Issues)PI-20 Effectiveness of internal controls for non-salary expenditure
C+ CScoring method M1 (weakest link)
(i)Effectiveness of expenditure commitment controls
A C
Expenditure commitment control procedures exist only for development budget, thus providing only partial coverage and are partially effective.
The 2013 assessment considered the commitment controls for the development budget only, whereas the current review, per the Framework, considered the commitment controls for overall budget.
(ii)Comprehensiveness, relevance and understanding of other internal control rules/procedure.
B C
Financial regulations and accounting manual prescribes internal controls, which are understood by those directly involved in their application. Some rules and procedures are excessive (e.g. through duplication of approvals) while controls are deficient in certain areas. For example, there are no prescribed rules for delegation of financial and administrative powers.
The 2013 assessment does not identify areas of minor improvement. It also includes procurement controls to assess this dimension.
(iii)Degree of compliance with rules for processing and recording transactions
C C
Rules are complied with in majority of transactions, but exceptions are still a concern as reported by internal and external auditors.
PI-21 Effectiveness of internal audit C C
Scoring method M1 (weakest link)
(i)Coverage and quality of the internal audit function.
C C
Internal audit is operational for most of central government entities and substantially meets professional standards. It undertakes some systems review (at least 20% of staff time).
No change in performance.

Public Expenditure and Financial Accountability (PEFA) Performance Assessment Report150
Indicator/Dimension
Score 2013
Score 2017
Description of Requirements Met in Current Assessment
Explanation of Change (Including
Comparability Issues)(ii)Frequency and distribution of reports C C
Reports are issued regularly for most government entities, but may not always be submitted to the Ministry of finance and the SAO.
No change in performance.
(iii)Extent of management response to internal audit function. C C
Ministers approve the reports and issues recommendations for compliance. Majority of the recommendations were implemented but with some delay.
No change in performance. However, the compliance rate with audit recommendations improved to above 50% from 31% in the previous assessment.
C(iii) Accounting, Recording and Reporting PI-22 Timeliness and regularity of accounts reconciliation
B BScoring method M2 (Average of dimensions)
(i) Regularity of bank reconciliation
B B
Bank reconciliation for all Treasury managed bank accounts takes place at least on monthly basis, at aggregate and detailed levels and usually within two weeks from the end of the month.
No change in performance.
(ii) Regularity and clearance of suspense accounts and advances
B B
Reconciliation and clearance of advances takes place at least annually within two months of end of period, with some un-cleared balances brought forward. However, some un-cleared balances are more than 8 years old.
No change in performance.
PI-23 Availability of information on resources received by service delivery units
C D
No formal and robust system is in place for collecting and monitoring performance on service delivery. Thus, no comprehensive data collection on resources to service delivery units in any major sector has been collected and processed within the last 3 years and the current rating is D.

Annex 4: Summary of Changes in Performance Based on 2011 PEFA Methodology 151
Indicator/Dimension
Score 2013
Score 2017
Description of Requirements Met in Current Assessment
Explanation of Change (Including
Comparability Issues)PI-24 Quality and timeliness of in-year budget reports
C+ C+Scoring method M1 (weakest link)
(i) Scope of reports in terms of coverage and compatibility with budget estimates.
C C
Expenditure is captured at payment stage. Expenditure is recorded at commitment stage only for the development budget, not for the operational budget.
No change in performance.
(ii) Timeliness of the issue of reports A A
Reports are prepared monthly and issued within two weeks.
No change in performance
(iii) Quality of information
A C
There are some concerns about accuracy of information which may not always be highlighted in the report, but this does not fundamentally undermine their basic usefulness. SAO and Monitoring Agent have reported issues of misclassification and unauthorized budget re-appropriations.
Decrease in performance. The 2013 assessment only mentions about unclassified revenue.
PI-25 Quality and timeliness of annual Financial statements
C+ C+Scoring method M1 (weakest link)
No change in performance.
(i) Completeness of the financial statements
A C
A consolidated government statement is prepared annually and includes full information on revenue and expenditure. The financial statements do not include information on tangible assets, and guarantees and other contingent liabilities.
There has been no change in the format of financial statements since previous assessment. It is not mentioned in the 2013 PEF, if assets and liabilities are disclosed in the financial statements.
(ii)Timeliness of submissions of the financial statements A A
The annual statements are submitted for external audit within six months after year end.
No change in performance.

Public Expenditure and Financial Accountability (PEFA) Performance Assessment Report152
Indicator/Dimension
Score 2013
Score 2017
Description of Requirements Met in Current Assessment
Explanation of Change (Including
Comparability Issues)(iii)Accounting standards used
C C
National accounting standards are applied for all statements, in a consistent format, but there is no disclosure of the differences between national accounting standards and IPSAS.
No change in performance.
C(iv) External Scrutiny and Audit
PI-26 Scope, nature, and follow-up of external audit C+ C+
Scoring method M1 (weakest link)
No change in performance.
(i) Scope/nature of audit performed (including adherence to auditing standards)
C C
All government entities are covered by the annual financial audits. SAO adopted ISSAI but standards are not fully implemented and audit documentation is weak.
No change in performance.
(ii) Timeliness of submission of audit reports to the Legislature B B
Audit reports are submitted to the legislature within 6 months of the close of the fiscal year.
No change in performance.
(iii) Evidence of follow up on audit recommendations
C B
Starting only with 2016 the SAO developed an audit follow up mechanism to track the implementation of recommendations.
Increase in performance as a streamlined audit follow-up mechanism is in place.
PI-27 Legislative scrutiny of the annual budget law B+ C+
Scoring method M1 (weakest link)
(i) Scope of the legislature scrutiny
B C
For 2017 the legislature review mainly covered expenditure and revenue.
Decrease in performance
PEFA 2013 notes that the review mainly covers expenditure and revenue yet was rated B.

Annex 4: Summary of Changes in Performance Based on 2011 PEFA Methodology 153
Indicator/Dimension
Score 2013
Score 2017
Description of Requirements Met in Current Assessment
Explanation of Change (Including
Comparability Issues)(ii) Extent to which the legislature’s procedures are well established and respected.
A B
The legislative scrutiny is ‘summarily’ provided for in the Rules of Procedure that are complied with in the scrutiny process.
The detailed rules for legislative scrutiny were not available even in the current review period rather are summarily provided for in the Rules of Procedure (2007) of Wolesi Jirga. These rules have not been revised nor any supplementary rules have been developed since 2007. The negotiation procedures are not documented either (a requirement in the criteria). The above indicates the favorable view in the 2013 review.
(iii) Adequacy of time for the legislature to provide a response to budget proposals both the detailed estimates and, where applicable, for proposals on macro-fiscal aggregates earlier in the budget preparation cycle (time allowed in practice for all stages combined)
B B
The legislature had a month and a half (45 days) to review budget proposal for 2016, as per the Constitution and PFEM Law.
No change in performance.
(iv) Rules for in-year amendments to the budget without ex-ante approval by the legislature
B C
Clear rules for in-year budget adjustment by the executive exist and are usually respected but they allow extensive administrative reallocations. The budget size can change with the addition of the externally funded development projects in the budget execution period.
The 2013 review did not take into consideration the addition in the budget size due to the inclusion of the externally funded projects in the budget execution period.
PI-28 Legislative scrutiny of external audit reports
C+ B+Scoring method M1 (weakest link)

Public Expenditure and Financial Accountability (PEFA) Performance Assessment Report154
Indicator/Dimension
Score 2013
Score 2017
Description of Requirements Met in Current Assessment
Explanation of Change (Including
Comparability Issues)(i) Timeliness of examination of audit reports by the legislature
C B
Scrutiny of Qatia audit reports is completed within 6 months from the receipt of audit reports, however, compliance audit reports and performance audit reports are still not reviewed by the legislature.
Increase in performance. The PAC was established in 2015 and reviewed audit reports within 6 months. Previously, budget and finance commission was responsible to review audit reports.
(ii) Extent of hearing on key findings undertaken by the legislature
C A
In-depth hearings take place and include responsible officers from all audited entities as well as Ministry of Finance and SAO officials.
Increase in performance. The PAC hearings are in-depth.
(iii) Issuance of recommended actions by the legislature and implementation by the executive
B B
Actions are recommended to the executive, some of which are implemented. However, there is no systemic follow up on the implementation of the actions.
No change in performance.

Public Expenditure and Financial Accountability (PEFA) Performance Assessment Report155
Annex 5Calculation sheets for PI-1, PI-2, and
PI-3

Annex 5: Calculation sheets for PI-1, PI-2, and PI-3 156
Annex 5:Calculation sheets for PI-1, PI-2, and PI-3
(Amount in AFN 000 )
Data for year 2014Administrative or Functional Head Budget Actual Adjusted
budget Deviation Absolute deviation %
General Directorate oF National Security
11,219,510 11,099,374 8,298,545 2,800,829 2,800,829 34%
Ministry oF Foreign AFFairs 4,446,686 3,225,844 3,289,005 -63,161 63,161 2%
Ministry oF Interior AFFairs 67,024,917 59,193,671 49,575,183 9,618,488 9,618,488 19%
Ministry oF National DeFense 105,175,966 65,915,879 77,793,723 -11,877,844 11,877,844 15%
Independent Directorate oF Local Governance
4,410,118 2,114,158 3,261,957 -1,147,799 1,147,799 35%
Administrative AFFairs oF President’s OFFice
2,097,558 1,635,139 1,551,465 83,674 83,674 5%
Supreme Court 3,321,654 3,078,005 2,456,871 621,134 621,134 25%
Ministry oF Public Works 28,085,414 7,177,310 20,773,462 -13,596,152 13,596,152 65%
OFFice oF Civil Aviation 508,499 410,925 376,113 34,812 34,812 9%
Da AFghanistan Brishna Shirkat
7,266,133 1,607,300 5,374,417 -3,767,117 3,767,117 70%
Kabul Municipality 3,495,030 85,802 2,585,110 -2,499,308 2,499,308 97%
Ministry oF Energy & Water 10,969,298 1,867,472 8,113,475 -6,246,003 6,246,003 77%
Ministry oF Mines & Petroleum
2,331,746 1,114,485 1,724,683 -610,198 610,198 35%
Ministry oF Higher Education 8,099,002 5,004,002 5,990,451 -986,449 986,449 16%
Ministry oF Education 45,031,867 36,391,257 33,307,957 3,083,300 3,083,300 9%
Ministry oF Public Health 18,388,235 12,710,467 13,600,914 -890,447 890,447 7%
Ministry oF Rural Rehabilitation
23,244,885 5,485,144 17,193,150 -11,708,006 11,708,006 68%
Ministry oF Agriculture, Irrigation & Livestock
8,383,437 5,447,158 6,200,835 -753,677 753,677 12%
Ministry oF Finance 6,421,591 5,431,808 4,749,749 682,059 682,059 14%
Ministry oF Labor and Social AFFairs, Martyrs & Disabled
22,082,512 20,148,558 16,333,397 3,815,161 3,815,161 23%
21 (= sum oF rest) 24,452,481 51,493,056 18,086,352 33,406,704 33,406,704 185%
Allocated expenditure 406,456,539 300,636,814 300,636,814 0 108,292,320
Interests *** 1,000,000 349,300
Contingency 20,922,000 0
Total expenditure 428,378,539 300,986,114
Aggregate outturn (PI-1) 70%
Composition (PI-2) variance 36%

Public Expenditure and Financial Accountability (PEFA) Performance Assessment Report157
Data for year 2015Administrative or Functional
Head Budget Actual Adjusted budget Deviation Absolute
deviation %
General Directorate of National Security
12,024,529 12,009,806 8,982,311 3,027,495 3,027,495 34%
Ministry of Foreign Affairs 3,294,925 3,756,886 2,461,306 1,295,580 1,295,580 53%
Ministry of Interior Affairs 72,083,825 64,458,636 53,846,542 10,612,094 10,612,094 20%
Ministry of National Defense 103,503,215 65,975,238 77,316,793 -11,341,555 11,341,555 15%
Independent Directorate of Local Governance
3,353,527 2,551,519 2,505,081 46,438 46,438 2%
Administrative Affairs of President's Office
1,965,325 4,099,239 1,468,096 2,631,143 2,631,143 179%
Supreme Court 3,183,951 3,264,268 2,378,408 885,860 885,860 37%
Ministry of Public Works 29,007,037 15,599,150 21,668,226 -6,069,076 6,069,076 28%
Office of Civil Aviation 4,691,866 2,648,647 3,504,819 -856,172 856,172 24%
Da Afghanistan Brishna Shirkat 15,475,005 8,001,285 11,559,813 -3,558,528 3,558,528 31%
Kabul Municipality 3,281,761 1,543,991 2,451,472 -907,481 907,481 37%
Ministry of Energy & Water 10,564,495 5,480,261 7,891,667 -2,411,406 2,411,406 31%
Ministry of Mines & Petroleum 2,810,908 3,133,991 2,099,745 1,034,246 1,034,246 49%
Ministry of Higher Education 7,669,633 6,959,631 5,729,208 1,230,423 1,230,423 21%
Ministry of Education 46,668,340 36,283,204 34,861,201 1,422,003 1,422,003 4%
Ministry of Public Health 18,501,348 14,686,094 13,820,488 865,606 865,606 6%
Ministry of Rural Rehabilitation 30,428,790 16,627,939 22,730,274 -6,102,335 6,102,335 27%
Ministry of Agriculture, Irrigation & Livestock
9,143,139 6,834,294 6,829,915 4,379 4,379 0%
Ministry of Finance 6,713,829 7,327,917 5,015,223 2,312,694 2,312,694 46%
Ministry of Labor and Social Affairs, Martyrs & Disabled
19,849,648 18,092,979 14,827,666 3,265,313 3,265,313 22%
21 (= sum of rest) 21,715,774 18,834,939 16,221,660 2,613,279 2,613,279 16%
Allocated expenditure 425,930,870 318,169,914 318,169,914 0 62,493,106
Interests *** 1,000,000 628,100
Contingency 9,242,000 0
Total expenditure 436,172,870 318,798,014
Aggregate outturn (PI-1) 73%
Composition (PI-2) variance 20%

Annex 5: Calculation sheets for PI-1, PI-2, and PI-3 158
Data for year 2016Administrative or Functional
Head Budget Actual Adjusted budget Deviation Absolute
deviation %
General Directorate of National Security
12,535,242 12,838,983 10,359,324 2,479,659 2,479,659 24%
Ministry of Foreign Affairs 4,786,716 5,130,621 3,955,818 1,174,803 1,174,803 30%
Ministry of Interior Affairs 68,578,901 60,399,308 56,674,697 3,724,611 3,724,611 7%
Ministry of National Defense 89,484,021 70,597,567 73,951,022 -3,353,455 3,353,455 5%
Independent Directorate of Local Governance
4,008,336 3,321,983 3,312,553 9,430 9,430 0%
Administrative Affairs of President's Office
3,183,003 5,107,127 2,630,484 2,476,643 2,476,643 94%
Supreme Court 3,210,187 3,535,387 2,652,950 882,437 882,437 33%
Ministry of Public Works 38,130,644 16,969,582 31,511,772 -14,542,190 14,542,190 46%
Office of Civil Aviation 5,028,227 3,679,398 4,155,407 -476,009 476,009 11%
Da Afghanistan Brishna Shirkat 21,227,624 12,605,395 17,542,847 -4,937,452 4,937,452 28%
Kabul Municipality 3,810,835 1,959,446 3,149,335 -1,189,889 1,189,889 38%
Ministry of Energy & Water 11,757,282 4,690,502 9,716,405 -5,025,903 5,025,903 52%
Ministry of Mines & Petroleum 5,050,373 1,919,592 4,173,709 -2,254,117 2,254,117 54%
Ministry of Higher Education 8,903,750 7,460,084 7,358,201 101,883 101,883 1%
Ministry of Education 47,402,682 37,165,480 39,174,332 -2,008,852 2,008,852 5%
Ministry of Public Health 21,236,019 15,899,646 17,549,785 -1,650,139 1,650,139 9%
Ministry of Rural Rehabilitation 16,913,898 15,908,172 13,977,915 1,930,257 1,930,257 14%
Ministry of Agriculture, Irrigation & Livestock
9,871,372 8,373,323 8,157,859 215,464 215,464 3%
Ministry of Finance 6,806,041 20,099,438 5,624,621 14,474,817 14,474,817 257%
Ministry of Labor and Social Affairs, Martyrs & Disabled
21,440,553 23,156,566 17,718,815 5,437,751 5,437,751 31%
Sum of rest 24,025,024 22,384,914 19,854,663 2,530,251 2,530,251 13%
Allocated expenditure 427,390,730 353,202,514 353,202,514 0 70,876,011
Interests 1,614,000 580,500
Contingency 15,602,026 0
Total expenditure 444,606,756 353,783,014
Aggregate outturn (PI-1) 80%
Composition (PI-2) variance 20%

Public Expenditure and Financial Accountability (PEFA) Performance Assessment Report159
Data for PI-2.2 - Expenditure by Economic Classification VarianceData for year 2014
Economic head Budget Actual Adjusted budget Deviation Absolute
deviation Percent
Compensation of employees
157,888,000 150,173,000 110,934,819 39,238,181 39,238,181 35%
Use of goods and services 144,700,000 84,676,000 101,668,704 -16,992,704 16,992,704 17%
Consumption of fixed capital
0 0 0 0 0 -
Interest 2,400,000 349,000 1,686,281 -1,337,281 1,337,281 79%
Subsidies 0 450,000 0 450,000 450,000 -
Grants 0 76,000 0 76,000 76,000 -
Social benefits 19,700,000 19,274,000 13,841,558 5,432,442 5,432,442 39%
Other expenses 103,690,538 45,988,114 72,854,752 -26,866,638 26,866,638 37%
Total expenditure 428,378,538 300,986,114 300,986,114 0 90,393,246Composition variance 30%
Data for year 2015
Economic head Budget Actual Adjusted budget Deviation Absolute
deviation Percent
Compensation of employees
161,847,000 152,255,300 118,293,699 33,961,601 33,961,601 29%
Use of goods and services 145,307,000 92,077,000 106,204,641 -14,127,641 14,127,641 13%
Consumption of fixed capital
0 0 0 0 0 -
Interest 2,400,000 682,000 1,754,156 -1,072,156 1,072,156 61%
Subsidies 0 846,000 0 846,000 846,000 -
Grants 0 1,506,800 0 1,506,800 1,506,800 -
Social benefits 15,109,000 20,175,000 11,043,143 9,131,857 9,131,857 83%
Other expenses 111,509,870 51,255,914 81,502,376 -30,246,462 30,246,462 37%
Total expenditure 436,172,870 318,798,014 318,798,014 0 90,892,517Composition variance 29%
Data for year 2016
Economic head Budget Actual Adjusted budget Deviation Absolute
deviation Percent
Compensation of employees
161,847,000 164,507,600 128,785,086 35,722,514 35,722,514 28%
Use of goods and services 145,307,000 103,422,000 115,623,858 -12,201,858 12,201,858 11%
Consumption of fixed capital
0 0 0 0 0 -
Interest 1,615,000 580,000 1,285,090 -705,090 705,090 55%
Subsidies 0 1,400,000 0 1,400,000 1,400,000 -
Grants 0 553,000 0 553,000 553,000 -
Social benefits 25,341,800 24,407,500 20,165,007 4,242,493 4,242,493 21%
Other expenses 110,495,956 58,912,914 87,923,973 -29,011,059 29,011,059 33%
Total expenditure 444,606,756 353,783,014 353,783,014 0 83,836,013 Composition variance 24%

Annex 5: Calculation sheets for PI-1, PI-2, and PI-3 160
Calculation sheets PI 3- Revenue OutturnsData for year 2014
Economic Head Budget Actual Adjusted Budget Deviation Absolute
deviation %Tax revenuesTaxes on income, profit, and capital gains including fixed taxes
39,882,935 29,545,277 26,250,450 3,294,827 3,294,827 13%
Taxes on payroll and workforce
- - - - - -
Taxes on property - 823,566 - 823,566 823,566 -
Taxes on goods and services
26,686,928 16,567,791 17,565,003 (997,212) 997,212 6%
Taxes on international trade and transactions
34,706,570 25,964,667 22,843,431 3,121,236 3,121,236 14%
Other taxes 3,867,622 5,146,827 2,545,621 2,601,207 2,601,207 102%
Social contributions
Economic head Budget Actual Adjusted budget Deviation Absolute
deviation %
Social security contributions
- 4,369,718 - 4,369,718 4,369,718 -
Other social contributions - - - - - -
GrantsGrants from foreign governments
8,650,495 - 5,693,648 (5,693,648) 5,693,648 100%
Grants from international organizations
256,681,084
180,019,346
168,944,285 11,075,061 11,075,061 7%
Grants from other government units
4,708,423 - 3,099,025 (3,099,025) 3,099,025 100%
Other revenueProperty income 1,450,000 1,565,967 954,372 611,595 611,595 64%
Sales of goods and services - 3,476,283 - 3,476,283 3,476,283 -
Fines, penalties and forfeits
- 751,038 - 751,038 751,038 -
Sum of rest 30,894,913 20,334,646 (20,334,646) 20,334,646 100%
Total revenue 407,528,970 268,230,480 268,230,480 - 60,249,062 Overall variance 66%
Composition variance 23%
Data for year 2015
Economic Head Budget Actual Adjusted Budget Deviation Absolute
deviation %
Tax revenues
Taxes on income, profit and capital gains
32,581,887 34,047,197 18,812,340 15,234,857 15,234,857 81%
Taxes on payroll and workforce
- - - - -

Public Expenditure and Financial Accountability (PEFA) Performance Assessment Report161
Economic Head Budget Actual Adjusted Budget Deviation Absolute
deviation %
Taxes on property (included in taxes on income
- 806,406 - 806,406 806,406 -
Taxes on goods and services
20,518,350 21,141,957 11,847,017 9,294,940 9,294,940 79%
Taxes on international trade and transactions 31,058,468 30,419,934 17,932,738 12,487,196 12,487,196 70%
Other taxes 7,318,591 5,115,846 4,225,655 890,191 890,191 21%
Social contributionsSocial security contributions
0 4,436,994 0 4,436,994.00 4,436,994.00 -
Other social contributions 0 0 0 0 0 -
GrantsGrants from foreign governments
13,908,301 - 8,030,465 (8,030,465) 8,030,465 100%
Grants from international organizations
281,546,480
122,818,070
162,561,121 (39,743,051) 39,743,051 24%
Grants from other government units (revenue from other govt. units-other domestic revenue)
4,708,423 - 2,718,580 (2,718,580) 2,718,580 100%
Other revenueProperty income (mine & kumar forest rev)
503,000 3,306,957 290,425 3,016,532 3,016,532 1039%
Sales of goods and services - 6,787,186 - 6,787,186 6,787,186 -
Fines, penalties and forfeits
- 856,224 - 856,224 856,224 -
Sum of rest(other non tax rev, rev from previous year, debt)
32,473,416 15,431,280 18,749,710 (3,318,430) 3,318,430 18%
Total revenue 424,616,916 245,168,051 245,168,051 - 107,621,050 Overall variance 58%
Composition variance 44%
Data for year 2016(Amount in AFN’000)
Economic Head Budget Actual Adjusted Budget Deviation Absolute
deviation %
Tax revenuesTaxes on income, profit and capital gains
37,956,630 35,148,314 28,735,185 6,413,129 6,413,129 22%
Taxes on payroll and workforce
- - - - - -
Taxes on property 842,685 432,239 637,957 (205,718) 205,718 32%
Taxes on goods and services
24,042,174 28,609,926 18,201,203 10,408,723 10,408,723 57%

Annex 5: Calculation sheets for PI-1, PI-2, and PI-3 162
Taxes on international trade and transactions
32,141,382 31,265,350 24,332,734 6,932,616 6,932,616 29%
Other taxes 6,751,714 5,308,461 5,111,406 197,055 197,055 4%
Social contributionsSocial security contributions
4,311,338 4,674,631 3,263,912 1,410,719 1,410,719 43%
Other social contributions - - - - - -
GrantsGrants from foreign governments
3,024,816 - 2,289,946 (2,289,946) 2,289,946 100%
Grants from international organizations
301,112,674
205,209,047
227,958,291 (22,749,244) 22,749,244 10%
Grants from other government units (revenue from other govt. units-other domestic revenue)
1,803,420 10,256,709 1,365,285 8,891,424 8,891,424 651%
Other revenueProperty income 1,860,229 2,968,087 1,408,292 1,559,795 1,559,795 111%
Sales of goods and services 6,286,904 5,787,881 4,759,520 1,028,361 1,028,361 22%
Fines, penalties and forfeits
911,014 1,126,836 689,686 437,150 437,150 63%
Sum of rest (extractive revenue, admin fees, royalties & other non-tax
15,895,930 12,034,064 (12,034,064) 12,034,064 100%
Total revenue 436,940,910 330,787,481 330,787,481 - 74,557,944 Overall variance 76%
Composition variance 23%

Annex 5: Calculation sheets for PI-1, PI-2, and PI-3 163


