AFGHANISTAN DEVELOPMENT UPDATE - World...
34
October 2015 AFGHANISTAN DEVELOPMENT UPDATE Public Disclosure Authorized Public Disclosure Authorized Public Disclosure Authorized Public Disclosure Authorized
-
Upload
duongnguyet -
Category
Documents
-
view
217 -
download
0
Transcript of AFGHANISTAN DEVELOPMENT UPDATE - World...

October 2015
AFGHANISTAN DEVELOPMENT UPDATE
Pub
lic D
iscl
osur
e A
utho
rized
Pub
lic D
iscl
osur
e A
utho
rized
Pub
lic D
iscl
osur
e A
utho
rized
Pub
lic D
iscl
osur
e A
utho
rized
wb350881
Typewritten Text
100507

Disclaimer:
This volume is a product of the staff of the International Bank for Reconstruction and Development/The World Bank. The findings, interpretations, and conclusions expressed in this paper do not necessarily reflect the views of the Executive Directors of The World Bank or the governments they represent. The World Bank does not guarantee the accuracy of the data included in this work. The boundaries, colors, denominations, and other information shown on any map in this work do not imply any judgment on the part of The World Bank concerning the legal status of any territory or the endorsement or acceptance of such boundaries
Copyright Statement:
The material in this publication is copyrighted. Copying and/or transmitting portions or all of this work without permission may be a violation of applicable law. The International Bank for Reconstruction and Development/The World Bank encourages dissemination of its work and will normally grant permission to reproduce portions of the work promptly. For permission to photocopy or reprint any part of this work, please send a request with complete information to the Copyright Clearance Center, Inc., 222 Rosewood Drive, Danvers, MA 01923, USA, telephone 978-750-8400, fax 978-750-4470, http://www.copyright.com/. All other queries on rights and licenses, including subsidiary rights, should be addressed to the Office of the Publisher, The World Bank, 1818 H Street NW, Washington, DC 20433, USA, fax 202-522-2422, e-mail [email protected].
Photo Credits:
Cover: ©The World Bank, 2015

AFGHANISTAN DEVELOPMENT UPDATE
October 2015

Preface
The Afghanistan Development Update is published twice a year, covering recent economic developments and the medium-term outlook for Afghanistan. A focus topic, with a more in-depth analysis, is included in each publication. While lack of high-frequency data in the country make detailed analysis somewhat difficult, efforts are made to use reliable sources of data as comprehensively as possible. The Afghanistan Development Update is intended for a wide audience, including policy makers, the donor community, the private sector, and the community of analysts and professionals engaged in Afghanistan’s economy. This report was prepared by Omar Joya, Claudia Nassif, Aman Farahi (all GMFDR) and Silvia Redaelli (Senior Economist, GPVDR). Useful inputs were received from Deepak K. Mishra and the wider country team. This report was prepared under the overall guidance of Shubham Chaudhuri (Practice Manager, GMFDR) and Robert Saum (Country Director). The authors also gratefully acknowledge the cooperation and suggestions received from the Afghan authorities and the International Monetary Fund staff.

Table of contents
PREFACE ................................................................................................................................. 4
EXECUTIVE SUMMARY ........................................................................................................ I
A. RECENT ECONOMIC DEVELOPMENT ....................................................................... 1
1. Background ................................................................................................................................... 1 2. Real Sector Activity ....................................................................................................................... 1 3. Fiscal developments ...................................................................................................................... 5 4. External sector .............................................................................................................................. 7 5. Monetary and financial sector developments ............................................................................... 9
B. OUTLOOK AND MEDIUM-TERM PROSPECTS ......................................................... 11
C. FOCUS SECTION: POVERTY ......................................................................................... 16
Lessons learned................................................................................................................................ 18
APPENDIX: WORLD BANK GROUP PROGRAM IN AFGHANISTAN .......................... 20

LIST OF BOXES
Box 1: The National Unity Government has launched a number of ambitious reforms ..................................... 14
LIST OF FIGURES
Figure 1: Growing insecurity poses risks to growth and investment .............................................................................................. 1 Figure 2: GDP growth slowed in 2014, with lower growth across all sectors .............................................................................. 2 Figure 3: Cereals production has been at record levels over the past three years ........................................................................ 2 Figure 4: Use of Internet services has increased, while service prices have dropped .................................................................. 3 Figure 5: Investor confidence remains subdued as proxied by the number of new firm registrations .................................... 3 Figure 6: Opium production and the area under poppy cultivation declined in 2015 ................................................................. 4 Figure 7: Poverty has remained persistent, while inequality increased between 2007/08 and 2011/12 .................................. 4 Figure 8: Consumer prices are declining, but less steeply than global commodity prices ........................................................... 5 Figure 9: Revenues in the first eight months of 2015 were higher than in the same period last year, but were lower than the initial targets ........................................................................................................................................................................................ 6 Figure 10: Expenditures and financing in first half of 2015 ............................................................................................................. 7 Figure 11: While exports increased in the recent past, they declined in the first half of 2015 ................................................... 7 Figure 12: Official imports increased in first half of 2015, likely due to improved recording ................................................... 8 Figure 13: The large projected trade deficit for 2015 is offset by foreign aid ............................................................................... 8 Figure 14: The Afghani depreciated in the first eight months of 2015, with no further accumulation in foreign exchange reserves ....................................................................................................................................................................................................... 9 Figure 15: Bank lending to the private sector is declining, and slowing economic activity has weakened money demand 10 Figure 16: The fiscal deficit is projected to increase in the medium term ................................................................................... 12 Figure 17: Poverty headcount and mean per capita expenditure and poverty headcount by region ...................................... 16 Figure 18: Trends in selected human development outcomes ....................................................................................................... 18
LIST OF TABLES
Table 1: Medium-term macroeconomic framework, 2015–18 .............................................................................. 11 Appendix Table 1: Selected economic indicators ............................................................................................... 22 Appendix Table 2: Selected fiscal indicators ...................................................................................................... 23 Appendix Table 3: Selected fiscal indicators ...................................................................................................... 24

Afgha nis tan Dev e lopment U pdate
I Octob er 2015 THE WORLD BAN K
Executive summary
More frequent incidences of violence in Afghanistan, as well as delays in the elections process and cabinet formation, continued to fuel uncertainty and affected investor confidence in 2014 and the first half of 2015. Economic growth slowed to 1.3 percent in 2014, down from 3.7 percent a year earlier. Unlike in previous years, agriculture did not contribute much to growth in 2014. Production levels were high for a third year in a row but did not supersede the strong output in 2013. Growth was mainly driven by services and a slight expansion of industries where an increase in construction activities outweighed lower production in manufacturing. Private investment activities showed strong signs of slowdown in 2014, evidenced by a drop of nearly 50 percent in new firm registrations since 2012. Growth, projected at 1.9 percent in 2015, will likely remain sluggish in light of a further deterioration in security over the first three quarters in 2015. The number of new firm registrations in the first six months of the year, which is a proxy for investor confidence, remained at the same level as in the first half of 2014. Fiscal developments in Afghanistan point to some headway on revenue mobilization in 2015. Domestic revenue increased over the first 8 months of 2015 as a result of improvements in the customs and tax administration. New revenue measures, implemented in September 2015, will likely lead to an acceleration of revenue collection in the remainder of the year. The most recent projections indicate that domestic revenues will reach Af 114.2 billion (equivalent to 9.8 percent of GDP) by end 2015, falling much behind the initial target of Af 120 billion. However, recurrent expenditures are also projected to increase in 2015, due to growing security costs. Substantial, additional discretionary donor grants this year—agreed under the New Development Partnership Agreement with the United States and the Afghanistan Reconstruction Trust Fund (ARTF) Incentive Program—will likely help to balance the budget this year. Nevertheless, the budget may run a deficit if the Government fails to meet the agreed commitments that trigger fund disbursements under these programs. Moreover, the weak cash reserve position at the beginning of the year exposes the budget to larger fiscal risks. With declining global food and fuel prices and weakening domestic demand, inflation is projected at −1.7 percent (period average) for 2015. The depreciation of the Afghani—around 8 percent vis-à-vis the U.S. dollar in the first eight months of the year—has partially offset deflationary pressures stemming from the decline in food and nonfood prices. Imports amount to around 40 percent of GDP and tend to have a large impact on domestic prices through imported inflation. The medium-term outlook points to slow post-transition recovery. Real GDP growth is projected to increase to 3.1 and 3.9 percent in 2016 and 2017 respectively, conditioned on improvements in the security environment and strong reform momentum, which could help restore confidence in the economy. Nevertheless, much higher growth rates are required to counter population growth at 2.5 percent and an estimated 400,000 entrants into the labor force each year. Good performance of the agriculture sector and declining food prices could mitigate the upward pressure

Afgha nis tan Dev e lopment U pdate
II Octob er 2015 THE WORLD BAN K
on poverty stemming from negative growth in per capita GDP in 2014 and 2015. However, poverty is expected to remain consistently higher than its pre-transition level due to the contraction in off-farm labor demand and security-related constraints in service delivery. The National Unity Government has embarked on an ambitious reform agenda to revitalize the economy, tackle corruption, and improve investment climate. However, it will take time for these reforms to have an impact, and it is yet unclear how much they will mitigate the high risks stemming from the fragile security environment. Growing trends in security and pension and wage spending over the medium term require immediate attention. Afghanistan faces significant financing shortages for both civilian and security spending. Therefore, securing continued high levels of donor financing over the coming years is of critical importance for fiscal stability in the country. The fragile security environment and financing constraints, compounded by weak governance capacity, pose serious challenges to service delivery in Afghanistan. Any setback in reform implementation would further slow down the pace of human capital accumulation in Afghanistan and reduce future prospects of growth and poverty reduction.

Afgha nis tan Dev e lopment U pdate
1
Octob er 2015 THE WORLD BAN K
A. Recent Economic Development
1. Background
Afghanistan’s economic and social development is overshadowed by tumultuous events at the political and security front.
Afghanistan emerged successfully from a security transition that was marked by the withdrawal of most of international military forces under the NATO-led International Security Assistance Force (ISAF) mission. Responsibilities for security operations were fully shifted to the Afghanistan National Security Forces. Presidential elections were held in 2014—for the first time without an incumbent candidate since emerging out of conflict. However, disputes over the election outcomes and the formation of National Unity Government (NUG) prolonged the political transition. Since in office, the NUG has embarked on a new, ambitious reform program centered heavily around initiatives to fight pervasive corruption. The NUG has also taken a number of bold steps to reshape internal and external political organization and restore peace. These steps were impeded by a change in the leadership of the Taliban and reports of the emergence of militant activities by the ISIS. Security continues to be a critical threat to personal safety, public service delivery, and private investments. Incidences of conflict and violence increased, resulting in nearly 3,700 civilian deaths in 2014, higher than any level in recent years. Between January and June 2015 the number of civilian deaths was slightly lower than over the same period last year, but the surge of large-scale insurgent attacks over the summer combat period has led to an extraordinarily large number of additional victims.
Figure 1: Growing insecurity poses risks to growth and investment (number of death, year)
Source: United Nations Assistance Mission in Afghanistan (UNAMA)
2. Real Sector Activity
Recovery from the impact of transition is slower than anticipated
Real GDP growth slowed to 1.3 percent in 2014, down from 3.7 percent a year earlier. More frequent incidences of violence and growing uncertainty in the after-math of the transition process continued to affect business and consumer confidence. Unlike in previous years, agriculture did not contribute much to growth in 2014. Production levels were high for a third year in a row but did not supersede the strong output level
0
1,000
2,000
3,000
4,000
2009 2010 2011 2012 2013 2014
a. Number of civilian deaths, conflict related
Civilian deaths Poly. (Civilian deaths)
-
500
1,000
1,500
2,000
2012 2013 2014 2015
b. Number of civilian deaths, conflict related biannual comparison
Jan - June July - Dec

Afgha nis tan Dev e lopment U pdate
2
Octob er 2015 THE WORLD BAN K
in 2013. Growth was mainly driven by two factors. First, there was slight growth in industries (2.4 percent), where an increase in construction activities (7 percent) outweighed lower production in manufacturing (−2.5 percent). Second, services grew by 2.2 percent in 2014, mainly on account of government and telecommunication services.
Figure 2: GDP growth slowed in 2014, with lower growth across all sectors (percent)
Sources: Central Statistics Organization (CSO) and Bank staff projections
Agriculture output remained high
Agriculture production in 2014 continued to be strong, but was only marginally up from the bumper harvest in 2013. Cereals output, including wheat, rice, maize, and barley, reached a record level of 6.7 million metric tons in 2014, only 3.7 percent higher than 2013 levels. Fruits production, on the other hand, increased strongly by 18.5 percent. However, production of other agriculture commodities declined, leading to a total decline in agriculture output by −0.1 percent.
Figure 3: Cereals production has been at record levels over the past three years (thousand metric tons)
Source: Ministry of Agriculture, Irrigation and Livestock
Expansion of construction activities offset an overall decline in industry growth
Industries grew overall by 2.4 percent in 2014. However, manufacturing and mining contracted by −2.5 percent and −2.2 percent respectively. This was offset by strong growth of 7 percent in construction. These trends are likely to be a result of lower domestic demand due to weaker consumer and business confidence. Manufacturing was particularly hard hit. Except for carpets, which are to a large extent exported, all manufacturing products are marketed domestically. On the other hand, construction activities are less prone to transitory shocks, because construction projects typically span several years and demand for construction stems largely from the public sector.
14.4
3.71.3 1.9
-15
-5
5
15
25
35
45
a. Growth of real GDP and output sectors
Real GDP growth Agriculture growth
Services growth Industries growth
-10
-5
0
5
10
15
20
25
b. Sector contribution to growth
Agriculture Industries Services
2,000
3,000
4,000
5,000
6,000
7,000
2006 2007 2008 2009 2010 2011 2012 2013 2014
Wheat Other crops
Afgha nis tan Dev e lopment U pdate
3
Octob er 2015 THE WORLD BAN K
Services growth slowed considerably
Growth in services, which averaged 12 percent in the past decade, was recorded at only 2.2 percent in 2014. Nonetheless, due to its large share in GDP, services remained the most dominant driver of growth. Wholesale/retail trade and transportation services, which together comprise around a quarter of GDP, contracted by −2.9 percent and −1.7 percent, respectively. However, strong growth in government services (8 percent) and telecommunications (7.8 percent) offset the decline in other services. Telecommunication has been the fastest-growing sector over the past decade, growing on average by more than 50 percent annually between 2003 and 2013. The number of Internet users increased from 1 million in 2011 to around 3 million users in 2014. This is largely due to the award of 3G licenses to all GSM operators in the country, the expansion of the fiber-optic network to additional provinces, and growing number of Internet service providers in the market. Over the same period, the wholesale price of 1 megabit (MB) of Internet bandwidth dropped from US$900 per month to only US$35 per month.
Figure 4: Use of Internet services has increased, while service prices have dropped (cost of 1 MB/month in US$ (LHS); traffic in GBbps (RHS))
Source: Ministry of Communications and Information Tech
Private investment activities remain subdued
There is little data on investment activity in Afghanistan. But proxy indicators, such as the number of new firm registrations, show that deterioration in the security environment and political uncertainty have taken a toll on business confidence. The number of new firm registrations in the first half of 2015 remains stubbornly at the same level than 2014, and has dropped by almost half since 2012.
Figure 5: Investor confidence remains subdued as proxied by the number of new firm registrations (total number of registration)
Source: Afghanistan Investment Support Agency
100
300
500
700
Jan
-11
Ma
y-1
1
Se
p-1
1
Jan
-12
Ma
y-1
2
Se
p-1
2
Jan
-13
Ma
y-1
3
Se
p-1
3
Jan
-14
Ma
y-1
4
Se
p-1
4
Jan
-15
Ma
y-1
5
a. Total number of new firm registrations per month
-
1,000
2,000
3,000
4,000
5,000
6,000
2012 2013 2014
b. Total number of new firm registrations per year
ManufacturingConstructionServicesAgriculture
$1,500
$900
$300
$97 $35
0
5
10
15
$0
$500
$1,000
$1,500
2010 2011 2012 2013 2014
Internet traffic (Gbps) Price of 1MB/month

Afgha nis tan Dev e lopment U pdate
4
Octob er 2015 THE WORLD BAN K
Opium production decreased in 2015
Preliminary results of a most recent survey by the United Nations Office on Drugs and Crime (UNODC), which used a new sampling methodology based on satellite imagery, put opium production in 2015 at 3,300 tons and area under poppy cultivation at 183,000 hectares. While results of the 2015 opium survey are not directly comparable with the 2014 estimates due to the change in survey methodology and the magnitude of decline cannot be computed, additional tests confirm the direction of change for both indicators. Both area under poppy cultivation and opium production declined in 2015, most likely due to improved eradication efforts.
Figure 6: Opium production and the area under poppy cultivation declined in 2015 (metric tons (LHS); thousand hectares (RHS))
Source: UNODC
Poverty is high and persistent in Afghanistan
Poverty incidence nationwide was 35.8 percent in 2011/12, compared to 36.3 percent in 2007/08, with no statistically significant change in spite of rapid growth and improved social outcomes and service delivery. A number of factors appear to be responsible for this pattern. First, poverty incidence in the Northeast Region increased sharply during this period: without the Northeast, poverty declined from 36.3 percent in 2007/08 to 33.4 percent in 2011/12. Second, climactic shocks impacted the country, with two consecutive years of negative agricultural growth prior to the 2011/12 survey (and the climactic shocks appear to have been more prevalent in the Northeast). Third, inequality nationwide increased during this period, with per capita consumption growth of the top quintile significantly greater than that of bottom quintile, with the latter actually negative. Finally, Afghanistan faces a daunting demographic challenge, with around 400,000 new entrants into the labor force each year and underemployment being pervasive.
Figure 7: Poverty has remained persistent, while inequality increased between 2007/08 and 2011/12 (in percent of population)
Source: National Risk and Vulnerability Assessment (NRVA) (CSO). Poverty rate is the percentage of population living below the national poverty line. Poverty gap indicates how far below the poor are, on average, from the poverty line. Gini index is a measure of income inequality; which varies between 0 meaning no inequality and 100 indicating maximum inequality.
-
100
200
300
-
2,000
4,000
6,000
8,000
20
06
20
07
20
08
20
09
20
10
20
11
20
12
20
13
20
14
20
15
Opium production Cultivated land
36.3
7.9
29.7
35.8
8.4
31.6
Poverty rate (%) Poverty gap (%) Gini index (%)
2007/08 2011/12

Afgha nis tan Dev e lopment U pdate
5
Octob er 2015 THE WORLD BAN K
Inflation slipped into negative territory
Declining prices for global commodities, as well as weakening domestic demand, have lowered the prices and exerted deflationary pressures. Consumer price inflation dropped to −4.8 percent in July 2015, down from 1.4 percent in December 2014. This is much more moderate than the decline in global price trends in commodities. World prices of grains and energy, for instance, plunged by −40 percent and −21 percent respectively (on a 12-month comparison basis in April 2015). The impact of declining global prices has been countered to some extent by the depreciation of the exchange rate for the Afghani. Imports amount to around 40 percent of GDP and tend to have a large impact on domestic prices through imported inflation.
Deflationary pressures are driven by both food and nonfood prices
Food and nonfood consumer prices fell by −5.9 percent and −3.5 percent in July 2015 respectively. Specifically, prices of cereals and bread—which comprise nearly 18 percent of the consumer basket—declined by −6.6 percent (year-on-year basis). Prices for vegetables, which are the second largest food item, fell by −21 percent. Among nonfood items, prices for housing, transportation, and communication services—which together comprise more than a fourth of the consumer basket—have also been falling. Property prices have plummeted over the past two years as a result of a lower propensity to invest under the prevailing uncertainty.
Figure 8: Consumer prices are declining, but less steeply than global commodity prices (12-month percentage change)
Source: Central Statistics Organization, and World Bank Global Economic Monitor (GEM)
Deflation could benefit the poor
The current deflationary trend is expected to be transitory. Prices are projected to rebound next year because exchange rate depreciation will start to exert upward pressure on domestic prices. Deflation, as long as it does not persist for long periods of time, benefits the poor through the impact of lower food and nonfood prices in the household consumption basket. However, deflation that persists for extended period of time could become a drag on growth. This is because households delay consumption with the expectation that prices will further decline in the future. Period-average inflation is projected at −1.7 percent for 2015.
3. Fiscal developments
Revenues have improved over the last year, but remain below targets
After a decade of strong revenue performance, revenue collection started to decline from a peak of 11.6 percent of GDP in 2011 to 8.7 percent in 2014. Domestic revenues rebounded in 2015 and reached Af 70.7 billion by the end of August (compared to Af 62 billion in August 2014), but were 11 percent short of the initial
-6
-4
-2
0
2
4
6
8
10
12
Jul-1
2
Oct-
12
Jan
-13
Ap
r-13
Jul-1
3
Oct-
13
Jan
-14
Ap
r-14
Jul-1
4
Oct-
14
Jan
-15
Ap
r-15
Jul-1
5
a. Domestic CPI inflation
Non-Food
HeadlineFood
-60
-40
-20
0
20
40b. World commodity prices
Grains
Energy

Afgha nis tan Dev e lopment U pdate
6
Octob er 2015 THE WORLD BAN K
revenue target for that month. Nonetheless, all categories of revenue, including tax, customs, and nontax revenues, increased over the 2014 level. Income tax and sales tax, which comprise the largest sources of tax revenue, increased by 7 percent and 13 percent respectively in the first eight months of 2014 compared to the same period last year. Fixed tax revenues, on the other hand, declined by nearly 7 percent. Customs duties also increased by 23 percent over the same period.
Revenue collection has been supported by a series of tax measures
Revenues in the first half of 2015 amounted to Af 52.4 billion. Current trends project revenue growth to accelerate in the second half of 2015 and reach Af 114.2 billion by end-2015 as a result of additional tax measures, which were implemented in the second and third quarters of 2015. These measures include an increase in the business receipts tax rate from 2 percent to 4 percent, introduction of a 10-percent telecommunications tax on mobile phone top-ups, increase of fuel fee from Af 1 per liter to Af 2 per liter, and an increase in the overflight fees for Afghanistan’s airspace.
Figure 9: Revenues in the first eight months of 2015 were higher than in the same period last year, but were lower than the initial targets (billion AFS)
Source: Ministry of Finance (Afghanistan Financial Management Information System [AFMIS], data extracted Sep 16, 2015) Note: The monthly targets for 2015 are based on the initial annual target of Af 120 billion.
Expenditures are close to 2014 levels
Expenditures in the first half of 2015 were close to the spending levels of the same period last year. Total expenditures were recorded at Af 128 billion (roughly US$2.2 billion) in the first six months of the year, as compared to Af 131 billion in the same period in 2014. Recurrent expenditures amounted to Af 94.5 billion (US$1.6 billion), of which Af 54 billion (US$930 million) were security spending.
Table 1: Expenditures in the first six months of 2014 and 2015 (Af million) Expenditures 2014-H1 2015-H1
Total recurrent 96,251 94,537
Security 56,038 54,339
Civilian 40,213 40,198
Wages & salaries 23,647 24,055
Operations & maintenance 6,060 7,204
Capital expenditures 1,287 678
Social transfers 8,942 7,658
Interest payments 278 602
Discretionary development 6,586 8,324
Recurrent + Discretionary development 102,837 102,861
Nondiscretionary development 28,366 25,419
Total core expenditures 131,203 128,280
Source: Ministry of Finance (AFMIS)
-
10
20
30
40
50
60
70
80
M1 M2 M3 M4 M5 M6 M7 M8
a. Monthly revenue collection, 2015 initial target versus 2014 and 2015 actuals
Actual 2014Target 2015Actual 2015
32.8 34.7
16.0 19.7
13.6
16.4
-
10.0
20.0
30.0
40.0
50.0
60.0
70.0
80.0
2014-M8 2015-M8
b. Revenues in first eight months of 2014 and 2015
Tax revenueCustoms Duty and FeesNon-tax revenue

Afgha nis tan Dev e lopment U pdate
7
Octob er 2015 THE WORLD BAN K
The tight fiscal policy stance runs the risk of procyclicality
The 2015 budget plans civilian expenditures at somewhat lower levels than 2014 and cuts discretionary development spending by almost half. This tight fiscal stance was reasonable in light of the sharp fall in revenue collection, accumulation of arrears, and the drawdown of cash reserves in 2014. Moving forward, however, further expenditure cuts could weaken domestic demand and negatively affect growth and service delivery, which in turn could perpetuate fragility risks. A higher revenue collection effort and additional grant financing could avoid procyclicality in upcoming years.
Figure 10: Expenditures and financing in first half of 2015 (Af billion)
Source: Ministry of Finance (AFMIS)
4. External sector
Official exports have dropped
Official exports in the first half of 2015 were 15 percent lower than exports over the same period in 2014 in spite of a weaker exchange rate and strong agriculture output. In fact, as exports in Afghanistan are agriculture-related products and commodities, years with strong agriculture production normally see increases in exports. Dried fruits, medicinal plants, and carpets represent the three major export items for Afghanistan. The limited effect of the exchange rate depreciation on exports implies large competitiveness challenges in production and supply chains in export sectors.
Figure 11: While exports increased in the recent past, they declined in the first half of 2015 (US$ million)
Source: CSO
154.0
119.5
125.3
113.2
167
101.5
6
153.1
9
197.7
1
114.4
6
115.5
1
50.0
80.0
110.0
140.0
170.0
200.0
230.0
Q1 Q2 Q3 Q4
a. Official quarterly exports
2013 2014 2015
-
100.0
200.0
300.0
400.0
500.0
600.0
700.0
2012 2013 2014
b. Official exports by product groups
Others
Carpets
Dry fruits
Fresh fruits
Medicinal plants
Oil seeds
Karakul skins
Animal by-products(excl. Karakul)Cotton
54.3
40.2
8.3
25.4
38.7
52.4
7.7
22.3
-
40.0
80.0
120.0
Expenditures Financing
Non-discretionary grants Civilian discretionary grants
Domestic revenues Security Grants
Non-discretionary dev. Discretionary development
Civilian recurrent Security recurrent

Afgha nis tan Dev e lopment U pdate
8
Octob er 2015 THE WORLD BAN K
Figure 12: Official imports increased in first half of 2015, likely due to improved recording (US$ million)
Source: CSO
Official imports increased in the first half of 2015, likely due to improved recording
Official imports in the first six months of 2015 were 8 percent higher in value than in the same period last year. The increase in official imports could likely be the result of improved recording at customs. However, estimates indicate that 15–20 percent of all trade in Afghanistan is unrecorded and smuggled. As such, official statistics fall short of capturing all trade flows. The strong asymmetry of import and export flows results in an annual trade deficit estimated at around 40 percent of GDP. This deficit is projected to increase to 42 percent (US$7.9 billion) in 2015. As in previous years, the trade deficit is almost entirely financed by foreign aid, which puts the current account at a small surplus (projected at 4.4 percent of GDP in 2015).
Figure 13: The large projected trade deficit for 2015 is offset by foreign aid (percent of GDP)
Sources: IMF and Bank staff estimates
Exchange rate depreciated by nearly 8 percent in the first eight months of the year
The exchange rate of Afghani against the U.S. dollar depreciated by nearly 8 percent between December 2014 and August 2015. Though the Afghani was stable in the first quarter of the year, it plummeted against the U.S. dollar in the second and third quarters of 2015. While the exchange rate was expected to depreciate during and after the transition due to declining foreign aid inflows, the abrupt depreciation of the Afghani this year could also be attributed to larger capital outflows. News reports point toward increasing capital flight in the recent past, possibly triggered by larger out-migration.
1,579 1,828
1,877 1,916
-
500
1,000
1,500
2,000
2,500
3,000
3,500
4,000
2014 2015
a. Imports in the first two quarters of 2014 and 2015
Q1 Q2
212
696
244
48
92
240
199 178
1,849
b. Imports share by product group, first half of 2015
Vehicles, machineryand equipmentFuel and oil
Metal products
Chemical products
Cement
Wheat and wheatflourVeg. Oil
Textile and clothing
Other
4.4
45.7
0.7
-42.0
-46.2
4.3
-60 -40 -20 0 20 40 60
Current Account balance
Current transfers, net
Net income
Trade balance
Imports
Exports

Afgha nis tan Dev e lopment U pdate
9
Octob er 2015 THE WORLD BAN K
Risks to balance of payments in the immediate future are low
The current trend of currency depreciation is not expected to cause external imbalances in the immediate future. At the moment, the high level of imports are predominantly financed by the large foreign aid inflows. The flexible exchange rate regime further safeguards the stability of the external accounts because it allows the pass-through of changes in international prices on domestic prices without affecting the level of foreign exchange reserves. The same mechanism, however, could potentially lead to inflationary pressures on domestic prices which over the past months have been offset by the declining prices for global commodities. On the other hand, Afghanistan’s low domestic production capabilities and narrow export base limit the positive impact of the depreciation on competitiveness and export growth one would typically expect. This has important implications for macroeconomic stability: balance of payment risks could increase if foreign aid declines unless alternative sources of foreign exchange earnings are secured, for example, through export revenues or incoming foreign direct investments. Development of investment opportunities and exports, for instance in extractives sector, will therefore remain a critical priority in the years to come.
Figure 14: The Afghani depreciated in the first eight months of 2015, with no further accumulation in foreign exchange reserves
Source: Da Afghanistan Bank
Foreign exchange reserves remain at US$7.3 billion, equivalent to around eight months of imports
Gross international reserves were US$7.3 billion as of July 2015. While foreign exchange reserves grew strongly up until early 2013, they have since remained stagnant at around US$7 billion. The withdrawal of international military troops, which reduced both military and civilian aid (for instance, Provincial Reconstruction Teams’ assistance), slowed foreign exchange accumulation. Gross reserves are currently at a comfortable level at an equivalent of eight months of imports. But such a level is needed to adequately manage the downside risks to Afghanistan’s balance of payments (including fluctuations in foreign aid inflows).
5. Monetary and financial sector developments
Money demand has weakened in the first half of 2015
Broad money (M2), which includes currency-in-circulation and deposits in commercial banks, grew by 4.7 percent in July 2015 (year-on-year), as compared to 8.3 percent in December 2014. Growth of currency-in-circulation (year-on-year) declined to 4.4 percent in July 2015, down from 16.7 percent in December 2014, indicating weakening money demand and slowing economic activity. Deposits in commercial banks—which were declining throughout most of last year—grew
55
60
65
70
75
80
48
50
53
55
58
60
63
65
Jan
-12
Ap
r-12
Jul-1
2
Oct-
12
Jan
-13
Ap
r-13
Jul-1
3
Oct-
13
Jan
-14
Ap
r-14
Jul-1
4
Oct-
14
Jan
-15
Ap
r-15
Jul-1
5
Exch
an
ge r
ate
(eu
ro)
Exch
an
ge r
ate
(U
S$)
a. Afghani exchange rate against the U.S. dollar and euro
USD (LHS)
Euro (RHS)
6,000
6,200
6,400
6,600
6,800
7,000
7,200
7,400
7,600
Jan
-12
Ap
r-12
Jul-1
2
Oct-
12
Jan
-13
Ap
r-13
Jul-1
3
Oct-
13
Jan
-14
Ap
r-14
Jul-1
4
Oct-
14
Jan
-15
Ap
r-15
Jul-1
5
Reserv
es (
US
$ m
illi
on
)b. Foreign exchange reserves

Afgha nis tan Dev e lopment U pdate
1 0
Octob er 2015 THE WORLD BAN K
positively at a 6.1 percent annualized rate in July 2015, but they are still growing at a much lower rate than in previous years.
Banking lending continues to decline
Commercial banks’ lending to the private sector continued to decline over the first half of the year. Credit to private sector has been declining since the second half of last year and dropped, as of July 2015, by −3.3 percent (year-on-year). Total banking sector loans stood at US$740 million in July 2015, as compared to US$818 million twelve months earlier. The drop in banks’ lending can be attributed to economic slowdown, banks’ limited appetite for lending, and stricter regulations imposed on FX-denominated loans. With increased uncertainty in the economy, proxy data indicates that private investment has stalled and thus borrowing from the banking sector has dropped. Further, the banking sector appears to have become more risk averse since the Kabul Bank crisis in 2011. The decline in bank lending portrays weak financial intermediation, which remains a key challenge to the system’s efficiency and development. In addition, the quality of assets has deteriorated. The ratio of nonperforming loans increased from 6.3 percent in June 2014 to 13.8 percent in June 2015, leading to a total loss of US$14 million in the first seven months of 2015.
Figure 15: Bank lending to the private sector is declining, and slowing economic activity has weakened money demand (percent change)
Source: Da Afghanistan Bank
The Central Bank restored the overnight deposits facility
The overnight deposits facility, which was suspended by the Central Bank in mid-2014 with the objective of encouraging bank lending, was restored on May 30, 2015. The overnight rate is set at 1 percent below the 28-day capital notes cut-off rate. As of September 1, 2015, the 28-day capital notes cut-off rate was 3.55 percent. Capital notes are short-term securities issued by the Central Bank to commercial banks and certified money dealers with different maturities (7 days, 28 days, 182 days, and 364 days) and are used as a monetary policy instrument. The total outstanding amount in capital notes stood at Af 39 billion (equivalent to around US$650 million) as of September 1, 2015. Further, the Central Bank continues to exercise its weekly foreign exchange auction as another instrument of managing liquidity in the market.
-10
0
10
20
Jul-1
2
Oct-
12
Jan
-13
Ap
r-13
Jul-1
3
Oct-
13
Jan
-14
Ap
r-14
Jul-1
4
Oct-
14
Jan
-15
Ap
r-15
Jul-1
5
a. Growth in monetary aggregates, year-on-year change
Broad money (M2)
Reserve money
Currency in circulation
-15
-5
5
15
25
Jul-1
2
Oct-
12
Jan
-13
Ap
r-13
Jul-1
3
Oct-
13
Jan
-14
Ap
r-14
Jul-1
4
Oct-
14
Jan
-15
Ap
r-15
Jul-1
5
b. Growth in banks' deposits and loans to private sector
Deposit
Loan

A f g h a n i s t a n D e v e l o p m e n t U p d a t e
1 1
Octob er 2015 THE WORLD BAN K
B. Outlook and Medium-Term Prospects
The growth outlook for 2015 remains sluggish
Growth, projected at 1.9 percent, will likely remain sluggish in light of the deterioration in security over the first three quarters of 2015. Investor and consumer confidence in the nonagricultural sectors show no signs of picking up over 2015. With declining global food and fuel prices and weakening domestic demand, inflation is projected at −1.7 percent (period average) for 2015. While currency depreciation will offset to some degree the effects of declining global commodity prices, weakened domestic demand will continue to exert deflationary pressure through prices of nontraded, nonfood items. Fiscal vulnerabilities will continue to be high. Revenues recovered somewhat in the first half of the year, but they may remain below the initial target of Af 120 billion. In light of the current revenue performance, the revenue target for 2015 is revised to Af 114.2 billion (equivalent to 9.8 percent of GDP). Recurrent expenditures are projected to increase in 2015, due to growing security costs. The budget could potentially run a deficit of US$100–US$150 million this year. However, if substantial, additional discretionary donor grants materialize under the New Development Partnership Agreement with the United States and under the ARTF Incentive Program, the government should be able to balance the budget and build up depleted cash reserves.
Post-transition recovery is expected to be slow
Real GDP growth is projected to increase to 3.1 and 3.9 percent in 2016 and 2017 respectively, conditioned on improvements in the security environment and strong reform momentum, which could help restore confidence in the economy. Nevertheless, much higher growth rates are required to counter population growth at 2.5 percent and estimated 400,000 entrants into the labor force each year. Good performance of the agriculture sector and declining food prices could mitigate the upward pressure on poverty stemming from negative growth in per capita GDP in 2014 and 2015. However, poverty is expected to remain consistently higher than its pre-transition level due to the contraction in off-farm labor demand and security-related constraints in service delivery.
Table 1: Medium-term macroeconomic framework, 2015–18
2012 2013 2014 2015 2016 2017 2018
Actual/estimates ---------- Tentative staff projections -------
Real GDP growth (%) 14.4 3.7 1.3 1.9 3.1 3.9 5.0
Nominal GDP (US$ billion) 20.5 20.5 20.0 19.0 20.1 21.5 23.8
CPI inflation (period average, in %) 6.4 7.4 4.6 −1.7 3.0 3.5 5.0
Fiscal Percent of GDP
Revenues and grants 23.2 24.1 24.4 29.2 29.3 30.9 32.6
Domestic revenues 10.3 9.7 8.7 9.8 10.1 10.5 11.6
Foreign grants 13.0 14.4 15.7 19.4 19.2 20.4 21.0
Total core expenditures 23.8 24.6 26.2 29.9 30.1 31.9 33.8
Recurrent expenditures 17.1 17.5 19.8 22.3 21.9 23.4 25.0
Development expenditures 6.7 7.1 6.4 7.7 8.2 8.5 8.8
Overall balance (incl. grants) −0.5 −0.5 −1.8 −0.8 −0.8 −1.0 −1.2
Overall balance (excl. grants) −13.5 −14.9 −17.5 −20.2 −20.0 −21.4 −22.2
External
Trade balance −45.8 −41.6 −40.6 −42.0 −41.7 −43.5 −38.7
Current account balance (incl. grants) 6.2 7.4 6.2 4.4 1.3 −2.4 −3.7
Source: World Bank staff estimates, tentative and subject to revision
A f g h a n i s t a n D e v e l o p m e n t U p d a t e
1 2
Octob er 2015 THE WORLD BAN K
The growth outlook is contingent upon a relatively stable political and security environment
Agriculture and services will likely be among the key drivers of economic growth. Agriculture accounts for about a quarter of GDP and is also linked closely to other parts of the economy, such as food and beverages (which account for almost all of manufacturing), and parts of transport and retail. Afghanistan has the potential to build on this foundation by reviving its historical position as an important exporter of fruits, nuts, vegetables, and other higher value-added products. This will require investments in irrigation and extension services to improve capacity, as well as efforts to build and improve downstream agro-processing activities. On the other hand, the government also has the option to tap into large potential for developing extractive industries, which currently account for a very small share of GDP. Unlocking this potential will require progress on the legislative framework as well as securing financing for the necessary infrastructure.
The medium-term growth outlook is subject to serious risks, which will need to be carefully managed
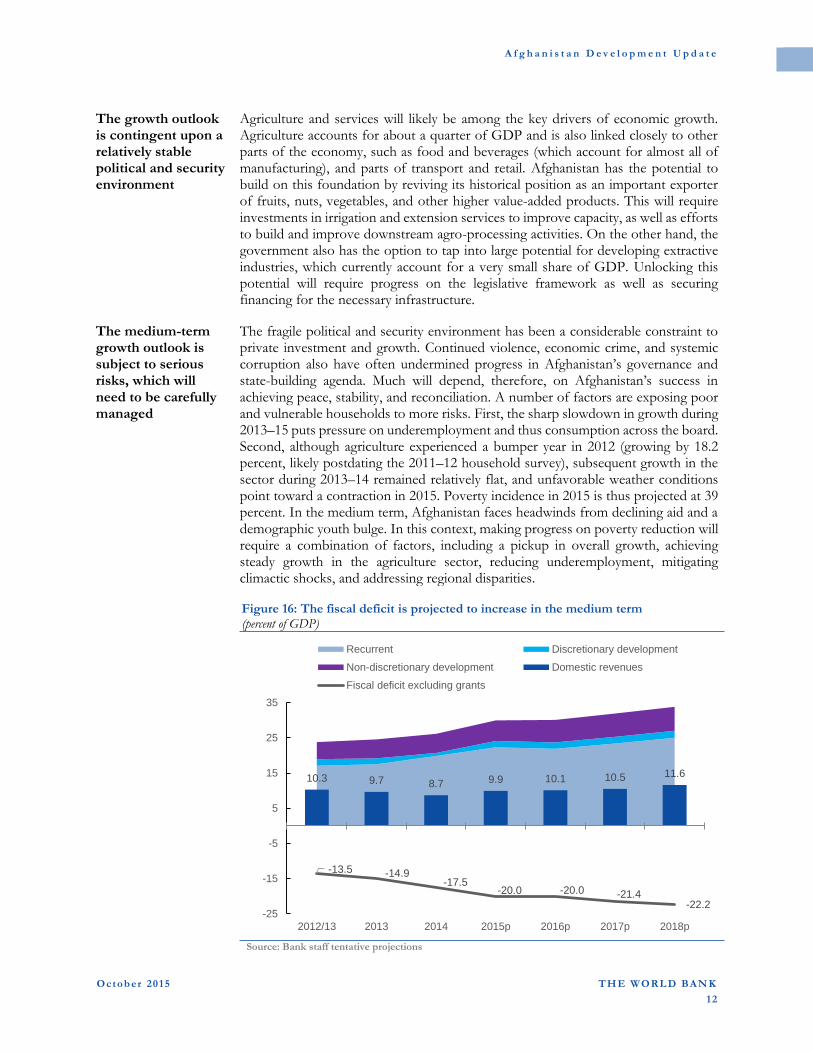
The fragile political and security environment has been a considerable constraint to private investment and growth. Continued violence, economic crime, and systemic corruption also have often undermined progress in Afghanistan’s governance and state-building agenda. Much will depend, therefore, on Afghanistan’s success in achieving peace, stability, and reconciliation. A number of factors are exposing poor and vulnerable households to more risks. First, the sharp slowdown in growth during 2013–15 puts pressure on underemployment and thus consumption across the board. Second, although agriculture experienced a bumper year in 2012 (growing by 18.2 percent, likely postdating the 2011–12 household survey), subsequent growth in the sector during 2013–14 remained relatively flat, and unfavorable weather conditions point toward a contraction in 2015. Poverty incidence in 2015 is thus projected at 39 percent. In the medium term, Afghanistan faces headwinds from declining aid and a demographic youth bulge. In this context, making progress on poverty reduction will require a combination of factors, including a pickup in overall growth, achieving steady growth in the agriculture sector, reducing underemployment, mitigating climactic shocks, and addressing regional disparities. Figure 16: The fiscal deficit is projected to increase in the medium term (percent of GDP)
Source: Bank staff tentative projections
10.3 9.7 8.7 9.9 10.1 10.5 11.6
-13.5 -14.9-17.5
-20.0 -20.0 -21.4-22.2
-25
-15
-5
5
15
25
35
2012/13 2013 2014 2015p 2016p 2017p 2018p
Recurrent Discretionary development
Non-discretionary development Domestic revenues
Fiscal deficit excluding grants

A f g h a n i s t a n D e v e l o p m e n t U p d a t e
1 3
Octob er 2015 THE WORLD BAN K
Restoring fiscal stability will require accelerating revenue-enhancing reforms, additional discretionary assistance, and prioritizing expenditures
Revenue reforms have picked up momentum in the second half of 2015, with the implementation of new tax measures and commitments to important institutional reforms in the customs and revenue administration. Nevertheless, the fiscal crisis in 2014 exposed the Government to larger fiscal risks in the medium term. The weaker cash position and larger stock of arrears at the beginning of 2015 mean that there will be more need for adjustment moving forward. In the medium term, contingent on the successful implementation of revenue-enhancing reforms, revenues are projected to improve from 8.7 percent of GDP in 2014 to 11.6 percent by 2018—which is about the level of revenue in 2012. While the projected increase in revenues is ambitious, it will still leave Afghanistan with a currently unfinanced fiscal deficit of 1–2 percent of GDP during 2015–18. The fiscal deficit (excluding donor grants) is forecast to reach 22.2 percent of GDP by 2018. If additional resources are not forthcoming to cover this gap, more aggressive expenditure consolidation efforts would be needed, which would compromise development prospects and social outcomes.
Raising fiscal revenue will require larger reform efforts and promoting new sources of economic growth
Recent analysis shows that with considerably greater effort to reduce leakages and improve administration of the tax regime, revenues could be raised up to 16 percent of GDP. This is grossly inadequate to finance Afghanistan’s current level of spending, which is at 30 percent of GDP and does not yet fully account for liabilities that are currently financed off-budget, especially in the security sector. But raising revenue above its current potential would require tapping into new sources for economic growth. The natural resources sector would be a good contender, with its large potential to contribute to revenues in the medium and long term. However, the timeline for new developments in extractive industries has become more uncertain in light of strategic reorientation in policy decisions and slow progress in reforms over the past year.
Budget expenditures are projected to rise, with higher security and social benefit spending
Total budget expenditures are projected to rise from 26 percent of GDP in 2014 to 30 percent in 2016. This increase is largely a result of more security spending moving on budget, while it was previously undertaken directly by international partners. Moreover, Afghanistan has considerable public expenditure needs in the areas of service delivery, building essential infrastructure, and operations and maintenance. For example, delivering on goals to improve education outcomes will require hiring increasing numbers of teachers. Developing new sources of growth will require much better infrastructure. Prioritizing these expenditure needs within the Government’s limited resource envelope will be critical to maintaining a pro-development stance. With social benefits for martyrs and disabled increasing significantly in 2014, the Government will need to consider reforms in the pension and social benefit scheme going forward. Although more detailed analysis of public expenditures in needed, there appears to be limited space to adjust expenditures.
Donors have committed to considerable assistance for Afghanistan contingent on satisfactory reform progress
At the December 2014 London Conference on Afghanistan, the international community reaffirmed its Tokyo commitment of providing US$16 billion in development assistance for Afghanistan over 2012–15, sustaining support through 2017 at or near the levels of the past decade, and providing continuing but declining support through the transformation decade. These funds, contingent on satisfactory reform progress under the Tokyo Mutual Accountability Framework (TMAF), would allow Afghanistan to progress toward sustainability and meet its development and infrastructure targets. Together with earlier pledges on the security side, this means annual aid of about US$8 billion—roughly equally divided between civil and security

A f g h a n i s t a n D e v e l o p m e n t U p d a t e
1 4
Octob er 2015 THE WORLD BAN K
aid. In light of the recent fiscal crisis, returning to a path of sustainability in Afghanistan will require acceleration of reforms as well as additional on-budget assistance.
Box 1: The National Unity Government has launched a number of ambitious reforms
The National Unity Government has started implementing a number of reforms that are anchored in commitments with international partners. Successful and timely implementation of reforms will move Afghanistan toward greater self-sufficiency and improved governance. The table below highlights selected reform programs that aim to strengthen the macro-fiscal environment in the country.
The ARTF Incentive Program 2015–17
Human resource management, enforcement, and business process in tax and customs administration
Tax policy coordination and tax code
Design and delivery system of pensions and social benefits
Land management and administration
Business licensing and registration
Fiscal deconcentrating and provincial budgeting
Performance audits, civil society accountability instruments, audit follow-up mechanisms
IMF Staff Monitored Program 2015
New tax policy measures for 2015
Banking supervision and regulation
New Banking Law
Strengthening of AML/CFT legal framework
Financial market development: Sukuk Law and secondary trading of existing instruments
Privatization of New Kabul Bank
Tax administration
Fiscal regime for natural resources
Public financial management (PFM) reforms
Anti-corruption efforts
SMAF 2015 (Self-Reliance through Mutual Accountability Framework)
Civilian systems of procurement, and financial transparency and accountability in security ministries
Electoral reforms
Anti-corruption measures and civil service reforms
Provincial budgeting policy
Tax administration
E-payments in Customs
PFM Roadmap II
Multi-year budget framework
Investment climate reforms and public-private partnership regulatory framework
New Development Partnership Framework
Raising revenue and stabilizing banking sector
Improving business environment
Procurement reforms
Civil service reforms
Implementation of citizen charter
Provincial budgeting
Land tenure security
Women’s empowerment
An ambitious reform agenda is already in hand
The National Unity Government has initiated a number of bold measures since it took office. Consistent with its strategy for greater self-reliance presented at the 2014 London Conference, the Government put forward an ambitious reform plan at the Senior Officials Meeting in September 2015. The plan is anchored in programs such as the ARTF Incentive Program, the IMF-supported Staff Monitored Program, and the Mutual Accountability Framework (see Box 1).

A f g h a n i s t a n D e v e l o p m e n t U p d a t e
1 5
Octob er 2015 THE WORLD BAN K
Three measures complement the Government reform program for the short- and medium term
The new reforms will take time to have an impact—as will the current efforts to achieve peace and stability. Meanwhile, given the current economic outlook, poverty, unemployment, and fragility will continue to increase. Three measures could help to strengthen the impact of the Government’s reforms:
Restore private sector confidence to stimulate investment. In the short term
necessary reforms—such as the recent ones in procurement and tax policy—
can be viewed as increasing uncertainty. To mitigate this perception, closer
dialogue with the private sector would be key for building support for reform.
Providing greater clarity on the Government’s economic policy stance could
further enhance investment predictability.
Enhance the poverty impact of public expenditure. The fiscal space is very
narrow and without additional financing, the only way to mitigate poverty in
the short term is to reprogram the existing portfolio of development
interventions. In this context, opportunities for expanding direct household
transfers, insurance schemes, and adult literacy programs could be explored
to complement existing service delivery efforts. Our experiences show that
such measures could improve mobility and productivity, and enhance
participation of the poor in the growth process.
Rearticulate the needs for security and development assistance. Afghanistan’s
security strategy and commitments need to be revisited in light of the changes
in the security situation. Achieving greater self-reliance will critically depend
on how realistic and affordable the country’s security will be in the long term.
Commitments for development financing will likely need to remain at least
at current levels in order to meet Afghanistan’s extraordinary development
needs. A new National Development Strategy could provide a clearer sense
of direction and vision for donor financing.

A f g h a n i s t a n D e v e l o p m e n t U p d a t e
1 6
Octob er 2015 THE WORLD BAN K
C. Focus Section: Poverty
Growth without poverty reduction
Strong economic growth in Afghanistan during the pre-transition period has not reduced poverty. Afghanistan’s per capita GDP grew at an average annual rate of 6.9 percent between 2007–08 and 2011–12. In 2007–08, 36 percent of Afghans were poor—that is, more than one in every three Afghans did not have the buying power to satisfy basic food and nonfood needs. Four years later, in 2011–12, 36 percent of Afghans were still poor.
Characteristics of Afghanistan’s poor: rural, agricultural, underemployed, and heavily vulnerable
Economic growth, while necessary, is not in and of itself enough to reduce poverty. The problem is in the distribution of the gains. Patterns of growth contributed to widening inequality. Average per capita consumption grew at an annual rate of 1.2 percent between 2007–08 and 2011–12, but growth in consumption was not uniform, thus increasing inequality. While the poorest 20 percent of the population saw a 2 percent decline in real per capita expenditure, the richest 20 percent experienced a 9 percent increase. Widening inequalities are reflected in an increase of the Gini index, which moved from 29.7 in 2007–08 to 31.6 percent in 2011–12. Data shows that the characteristics of the poor did not change (Figure 17). Poverty in Afghanistan strongly correlates to geography—that is, to where people live. Four out of every five poor people live in rural areas. The mountainous East, Northeast, and West-Central regions—where almost half of inhabitants are poor—have the lowest per capita consumption and highest likelihood of poverty.
Figure 17: Poverty headcount and mean per capita expenditure by region
a. Poverty headcount and mean per capita expenditure
b. Poverty headcount by region
Note: Area of symbol proportional to size of poor population Source: World Bank Staff calculations using NRVA 2011–12
Education, type of job, and access to basic services clearly contribute to Afghan poverty. Poor people tend to be illiterate (75.6 percent), and often lack opportunities
to educate their children. Poor people face higher unemployment1 (8 percent) or are
1 In Afghanistan, as in most developing countries, labor is the most critical asset for poor
households. For individual living in poorer households, being engaged in some sort of income-generating activity is a necessity to make ends meet. Poverty, together with the widespread availability of poor-quality jobs in the informal sector, make open
Central
SouthEast
Northeast
North
WestSouthwest
WestCentral
Urban
Rural
15
20
25
30
35
40
45
50
55
60
1200 2200 3200 4200
Po
vert
y r
ate
(%
)
Per capita consumption (average)
LAGGING REGIONS

A f g h a n i s t a n D e v e l o p m e n t U p d a t e
1 7
Octob er 2015 THE WORLD BAN K
underemployed (41 percent). When employed, poor people are more likely to have a vulnerable and informal job (84.3 percent), most likely in agriculture (43.6 percent). Poor people are much less likely to have access to basic services such as electricity (63.8 percent), safe drinking water (40.3 percent), and sanitation (2.8 percent). Poverty in Afghanistan closely intertwines with natural and manmade risks. Approximately 84 percent of Afghan households experienced at least one economic shock in 2011–12, and 53 percent suffered from three or more. Due to mountainous terrain, poor connectivity, and greater reliance on subsistence and rain-fed agriculture, the poorest regions in the East, Northeast, and West-Central are particularly exposed and vulnerable to shocks, especially natural hazards. Poor people are among the most vulnerable, because they are exposed the most to a wide array of risks, and because they lack means to cope with hazards. Poor households are more likely to use harmful risk coping mechanisms that may protect them in the short term, but at greater long-
term cost, reducing the likelihood of escaping from poverty in the future.2
International spending is an effective driver of growth, but gains not distributed equally
International spending did not benefit Afghanistan’s employment sectors, regions, and people equally. International spending on military and civilian assistance drove economic growth in Afghanistan, but growth did not reach the poor. International spending contributed to growth and job creation in the service sector. However, while the service sector growth created good-quality jobs, especially in the public and in health and education-related services, 80 percent of new jobs were in informal day labor arrangements. Lacking education, the poor could not compete for these jobs, and moved from vulnerable employment in agriculture to vulnerable employment in the service sector. On the other hand, aid did not contribute to raising productivity of the agriculture sector, where most of the poor find employment. While losing its GDP primacy, the continued importance of agriculture in the Afghan economy contributed to economic growth volatility due to the sector’s high reliance on rain-fed production and vulnerability to weather-related shocks. Tilted towards military operations, international spending benefited high-conflict
areas most, leaving behind the poorest West-Central, Northeast, and East regions.3 Moreover, while in the rest of the country a thriving service sector created new and less vulnerable jobs, “lagging” regions remained reliant on vulnerable employment in agriculture. Greater incidence of and greater vulnerability to natural hazards contributed to widening inequality between the poorest regions and the rest of the country.
Despite significant progress, gap in education and basic services widened
While consumption-based poverty in Afghanistan stagnated, overall country human development outcomes improved. Enabled by international aid–supported public investment, from 2007–08 to 2011–12, literacy rates for the population aged 15 and above grew by 5 percent, youth literacy by 8 percent, and primary school enrollment
unemployment a rare phenomenon. The relatively low level of open unemployment is counterbalanced by the severity of underemployment.
2 Lacking proper means to cope with risk, poor households face extremely unfavorable trade-offs when hit by a shock and may resort to “harmful” coping mechanisms. These include things like selling livestock or assets that may affect future productivity and livelihood; increasing the use of child labor, which leads to intergenerational poverty; or reducing consumption and going hungry, which affects health, human capital accumulation, and future labor productivity.
3 Aid increased in nonlagging regions by 79 percent over the period compared to only 31 percent in lagging regions.

A f g h a n i s t a n D e v e l o p m e n t U p d a t e
1 8
Octob er 2015 THE WORLD BAN K
by 6 percent annually. Access to electricity, access to safe drinking water, and access to improved sanitation all improved, growing annually by approximately 14 percent each. While these achievements have been significant, it is important to note that—at its pre-transition pace of progress—it will take the country from 20 to 25 years to achieve the same level of adult literacy of other low-income or conflict-affected countries. Further, it would take Afghanistan from 11 to 15 years to achieve the same level of youth literacy, and from 12 to 23 years to achieve the same level of primary-school enrollment. Afghanistan is still a long way from closing the widening gap between poor and better-off Afghans. Between 2007–08 and 2011–12, the gap in education between poor and nonpoor Afghans widened. Children in poor households have significantly lower school enrollment rates than their counterparts in nonpoor households. While urban areas and nonlagging regions saw significant improvement in school enrollment, education outcomes stagnated in rural areas and in lagging regions, mostly due to negative impact of shocks and conflict on girls’ enrollment.
The gap in access to basic services between the poor and nonpoor also widened, except in the case of access to electricity, mostly thanks to expansion in the use of solar and battery sources. Expanded service delivery to rural areas reduced the urban-rural services access gap, but differences between the poorest East, Northeast, and West-Central regions and the rest of the country widened, possibly reflecting differences in international aid allocation.
Figure 18: Trends in selected human development outcomes (percent(LHS); annual growth rate (RHS))
Source: World Bank staff calculations based on NRVA 2007–08 and 2011–12.
Lessons learned
While economic growth is necessary to reduce poverty, the poor must receive benefits from the growth. For any given rate of growth, the extent of poverty reduction depends on the ability to distribute income, assets, and access to opportunities to the poor. For Afghanistan, the implications of our analysis are as follows:
Strengthening agriculture remains a top priority in Afghanistan to sustain
growth as aid dwindles, and for accelerating poverty reduction. As 75.6 percent
of poor aged 15 and above are illiterate, they cannot take advantage of better
employment opportunities requiring high skills. Thus poverty reduction should
0
2
4
6
8
10
12
14
16
0
10
20
30
40
50
60
70
80
AdultLiteracy
Rate, age15+
YouthLiteracy
Rate, age15-24
NetEnrollment
Primary
Electricity ImprovedSanitation
Safedrinkingwater
2007-08
2011-12
Annual growth rate

A f g h a n i s t a n D e v e l o p m e n t U p d a t e
1 9
Octob er 2015 THE WORLD BAN K
benefit the most from growth in sectors like agriculture, where the poor
concentrate.
Afghanistan needs sustained investment in human development to support economic growth, reduce poverty, and bridge gaps in these areas between Afghanistan and other countries in the region. While continuing to expand the supply of education, health, and basic services, the country should devote greater attention to improving access in underserved areas and among traditionally underserved groups such as girls and the poor.
Afghanistan’s poor households need help to manage risk. Geography
(which can increase exposure to natural hazards), economic structure, and high
incidence of poverty (which limits households’ ability to cope with shocks)
require coordinated assistance to prevent and mitigate risks, and to help people
coping with the impact of shocks. In particular, greater attention should be
devoted to the development of an efficient system of safety nets to promote
poverty reduction, and to complement and improve the effectiveness of
investments in human development and agriculture.

20
Octob er 2015 THE WORLD BAN K
APPENDIX: WORLD BANK GROUP PROGRAM IN AFGHANISTAN
1. The World Bank Group’s program in Afghanistan is governed by the joint Interim Strategy Note (ISN) for FY 2012–FY 2014, which focuses on three themes: (i) building the legitimacy and capacity of institutions; (ii) equitable service delivery; and (iii) inclusive growth and jobs. The process for preparing the next country strategy—the Country Partnership Framework for Afghanistan—has been launched, and work on the Systematic Country Diagnostics (SCD) is in progress.
2. Since 2002, the International Development Association (IDA) has committed a total of US$3.12 billion in
grants (86 percent) and credits (14 percent) in Afghanistan. Thirty seven development and emergency-reconstruction projects and four budget-support operations have been committed as of end-August 2015. In addition, the Afghanistan Reconstruction Trust Fund (ARTF) has generated US$7.99 billion from 33 donors, and committed US$3.61 billion for the government’s recurrent costs and US$3.79 billion for government investment programs. At end of August 2015, the active IDA portfolio was worth US$725.98 million and the active ARTF investment portfolio was worth US$2.5 billion.
3. The Bank also administers the ARTF—the World Bank Group’s largest single-country multi-donor trust
fund. The ARTF provides grant support to Afghanistan based on a three-year rolling financing strategy. Together, the IDA and the ARTF provide close to US$1 billion per year in grant resources (about US$150 million from IDA and about US$800–US$900 million from the ARTF). The ARTF is a key vehicle for providing the Government with predictable and transparent on-budget financing and provides a platform for policy dialogue between Government and donors.
4. In FY 2015, the World Bank Board approved additional financing for an existing project—the Second
Customs Reform and Trade Facilitation Project—in the amount of US$21.5 million. No new projects were approved under the ARTF during the political transition period. Funds were, however, allocated to ongoing projects for a total of US$450 million, which includes US$50 million for the National Horticulture and Livestock Project, US$100 million for the National Solidarity Program III, US$100 million for the Rural Access Program, and US$200 million for the System Enhancement for Health in Transition Project. In FY 2015, US$419.56 million was disbursed under the Recurrent Cost Window, including the baseline financing (US$125 million), Incentive Program (US$132.5 million, of which US$65 million was through the O&M Facility), and additional donor grants of US$146.9 million through ad hoc mechanisms.
5. The World Bank continues to engage in rigorous analytical work and places large emphasis on policy
dialogue. These nonlending activities have been supportive of the Bank’s lending program and have played a crucial role in informing government of its strategic choices and advancing dialogue between the Government of Afghanistan and its international development partners. In recent years, four pieces of analytical work stand out: Transition Economics, Resources Corridors, Poverty Analysis, and the Agriculture Sector Review. The Bank also prepared Policy Notes on key sectors of the economy to help guide its policy dialogue with the new administration and launched the preparation of a comprehensive revenue analysis.
6. The portfolio of the International Finance Corporation (IFC) in Afghanistan has more than doubled since
FY 2008—from around US$8 million to about US$135 million to date. IFC is following an integrated advisory and investment strategy. It is focused on improving the investment climate, building capacity, and supporting selective investments in sectors with high development impact and job creation. Currently, IFC’s portfolio includes two investments in the telecommunications sector and two operations in the financial markets. Going forward, IFC is looking to expand its investment program in Afghanistan, in the areas of infrastructure, finance, manufacturing, agribusiness, and services.

21
Octob er 2015 THE WORLD BAN K
7. The Multilateral Investment Guarantee Agency (MIGA) has US$154 million of gross exposure in Afghanistan, supporting telecoms and agri-business projects. In 2013 MIGA launched its Conflict Affected and Fragile Economies Facility, which is supporting the agency’s exposure in Afghanistan. MIGA is currently supporting three projects in Afghanistan, of which one is a joint effort with IFC in the telecoms sector (supporting telecom operator MTN). The other two operations are MIGA-only dairy and cashmere production projects.

22
Octob er 2015 THE WORLD BAN K
Appendix Table 1: Selected economic indicators
2012 2013 2014 2015 2016 2017 2018
Proj. Proj. Proj. Proj.
Income Levels
Nominal GDP (billion Afs) /1 1,061 1,133 1,151 1,171 1,269 1,408 1,532
Nominal GDP (billion US$) /1 20.5 20.5 20.0 19.0 20.1 21.5 23.8
GDP per capita (US$) 689 670 640 593 613 641 693
Population (million) 29.8 30.6 31.3 32.0 32.8 33.6 34.3
Real Income and Prices (% growth)
Real GDP growth /1 14.4 3.7 1.3 1.9 3.1 3.9 5.0
Agriculture 18.2 0.0 −0.1 0.2 0.5 −0.5 0.8
Industry 7.8 3.1 2.4 1.4 3.1 3.9 7.8
Services 10.3 5.3 2.2 2.8 4.8 5.6 9.6
CPI inflation (period average) 6.4 7.4 4.6 −1.7 3.0 3.5 5.0
Core inflation (excl. fuel & cereals; p.a.) 6.6 7.0 2.4 −0.8 .. .. ..
CPI inflation (end period) 5.8 7.3 1.4 0.5 .. .. ..
GDP Composition (% of GDP)
Agriculture 24.6 24.1 23.5 23.1 22.4 21.5 20.3
Industry 21.8 21.2 22.3 22.2 22.2 22.2 22.3
Services 53.5 54.7 54.2 54.7 55.4 56.3 57.4
External Sector (% of GDP, unless otherwise indicated
Exports of goods (million US$) /2 640 729 775 810 937 1,131 2,001
Imports of goods (million US$) /3 10,054 9,244 8,917 8,790 9,328 10,492 11,196
Trade balance −45.8 −41.6 −40.6 −42.0 −41.7 −43.5 −38.7
Net current transfers 47.0 41.7 43.5 45.7 42.6 42.1 37.6
Current account balance 6.2 7.4 6.2 4.4 1.3 −2.4 −3.7
Gross foreign exchange reserves (million. US$) 6,771 7,447 7,360 7,410 7,500 7,650 7,700
Gross foreign exch. res. (months of imports) 7.2 7.6 8.2 7.8 7.2 7.0 6.7
External debt /4 6.7 6.4 6.4 6.7 6.8 6.6 7.8
Exchange rate (AFN/USD, period average) 51.7 55.4 57.4 60.9 .. .. ..
Exchange rate (AFN/USD, end period) 52.1 56.6 58.1 63.9 .. .. ..
Real effective exchange rate (decrease=depreciation)
127.0 125.5 121.1 116.2 116.5 115.3 114.0
Monetary and Financial Statistics (% of GDP)
Broad money (M2) 32.0 33.0 34.9 35.8 36.7 37.6 38.5
Total deposits 17.6 17.6 17.7 18.1 18.9 19.5 20.1
Share of dollar deposits (%) 70.2 68.0 66.0 65.4 .. .. ..
Credit to private sector, commercial banks 4.1 4.2 3.8 3.5 4.1 5.3 7.6
Loan-to-deposit ratio (%) 23.0 23.7 21.6 19.3 21.7 27.2 37.8
Note:
1/ National Accounts data exclude opium value added. 2/ Exclude sales of goods to nonresidents in the country. 3/ Include estimated unofficial trade or smuggling. 4/ Incorporates committed but not yet delivered debt relief; excludes Russian Federation’s loan. Sources: Central Statistics Organization, Central Bank, World Development Indicators, IMF staff estimates, and Bank staff projections.

23
Octob er 2015 THE WORLD BAN K
Appendix Table 2: Selected fiscal indicators
2012 2013 2014 2015 2016 2017 2018
In Billion Afghanis, unless otherwise indicated
Proj. Proj. Proj. Proj.
Domestic revenues 108.9 109.4 100.1 114.2 128.2 147.9 177.8
Tax revenue 51.7 52.4 51.8 57.0 60.9 71.8 84.3
Customs duty and fees 28.5 28.3 26.0 31.2 33.0 39.4 47.5
Nontax revenues 28.7 28.7 22.3 26.0 34.3 36.6 46.0
Donor grants 137.8 163.0 180.7 227.3 243.7 287.3 321.3
Discretionary grants 85.9 105.2 119.1 159.0 163.7 188.7 219.1
Non-discretionary grants 51.9 57.8 61.6 68.3 79.6 91.1 102.1
Total expenditures 252.5 278.3 301.0 350.5 382.1 449.3 518.0
Recurrent expenditures 181.1 198.0 228.3 260.8 278.0 329.6 383.1
Security 106.6 119.8 137.4 170.1 180.2 222.5 252.8
Civilian 74.5 78.3 91.0 90.7 97.7 107.0 130.3
Wages and salaries 43.5 47.9 52.7 53.1 57.1 61.4 73.7
Operations and maintenance 20.1 18.0 16.3 16.1 17.3 19.9 26.8
Capital expenditures 1.2 1.7 1.9 0.5 0.7 0.8 1.2
Social transfers 9.8 10.5 19.2 20.3 22.0 24.2 28.0
Interest payment 0.2 0.5 0.9 0.6 0.7 0.8 0.9
Discretionary development 20.1 19.0 9.9 21.4 22.8 26.8 30.6
Non-discretionary development 51.4 61.3 62.8 68.3 81.2 93.0 104.2
Discretionary balance (Recurrent + Disc dev.) −6.3 −2.4 −19.1 −8.9 −8.9 −19.7 −16.9
Overall balance −5.8 −6.0 −20.2 −8.9 −10.5 −21.6 −18.9
Overall balance excluding grants −143.6 −169.0 −200.9 −236.3 −253.9 −301.4 −340.2
Revenues to recurrent spending ratio (%) 60.2 55.2 43.8 43.8 46.1 44.9 46.4
Sources: Ministry of Finance (AFMIS), and Bank staff projections

24
Octob er 2015 THE WORLD BAN K
Appendix Table 3: Selected fiscal indicators
2012 2013 2014 2015 2016 2017 2018
In Percent of GDP, unless otherwise indicated Proj. Proj. Proj. Proj.
Domestic revenues 10.3 9.7 8.7 9.8 10.1 10.5 11.6
Tax revenue 4.9 4.6 4.5 4.9 4.8 5.1 5.5
Customs duty and fees 2.7 2.5 2.3 2.7 2.6 2.8 3.1
Nontax revenues 2.7 2.5 1.9 2.2 2.7 2.6 3.0
Donor grants 13.0 14.4 15.7 19.4 19.2 19.9 21.0
Discretionary grants 8.1 9.3 10.3 13.6 12.9 13.4 14.3
Nondiscretionary grants 4.9 5.1 5.4 5.8 6.3 6.5 6.7
Total expenditures 23.8 24.6 26.2 29.9 30.1 31.9 33.8
Recurrent expenditures 17.1 17.5 19.8 22.3 21.9 23.4 25.0
Security 10.0 10.6 11.9 14.5 14.2 15.8 16.5
Civilian 7.0 6.9 7.9 7.7 8.3 9.1 11.1
Wages and salaries 4.1 4.2 4.6 4.5 4.9 5.2 6.3
Operations and maintenance 1.9 1.6 1.4 1.4 1.5 1.7 2.3
Capital expenditures 0.1 0.1 0.2 0.0 0.1 0.1 0.1
Social transfers 0.9 0.9 1.7 1.7 1.9 2.1 2.4
Interest payment 0.0 0.0 0.1 0.1 0.1 0.1 0.1
Discretionary development 1.9 1.7 0.9 1.8 1.8 1.9 2.0
Nondiscretionary development 4.8 5.4 5.5 5.8 6.4 6.6 6.8
Discretionary balance (Recurrent + Disc dev.) −0.6 −0.2 −1.7 −0.8 −0.7 −1.4 −1.1
Overall balance −0.5 −0.5 −1.8 −0.8 −0.8 −1.5 −1.2
Overall balance excluding grants −13.5 −14.9 −17.5 −20.2 −20.0 −21.4 −22.2
Revenues to recurrent spending ratio (%) 60.2 55.2 43.8 43.8 46.1 44.9 46.4
Sources: Ministry of Finance (AFMIS), and Bank staff projections


26