AFFORDABLE COHOUSING TOOLKIT A SUMMARY OF … · 3 Purpose of this Summary This summary has been...
82
AFFORDABLE COHOUSING TOOLKIT: ASUMMARY OF PUBLIC AND PRIVATE AFFORDABLE HOUSING PROGRAMS Affordable Cohousing Task Group The Cohousing Association of the U.S. June 2010 Affordable Cohousing Task Group Members: David Entin ([email protected]) Grace Kim ([email protected]) Greg Sherwin ([email protected]) Jerome Garciano ([email protected]) Kathleen Nolan ([email protected]) Nancy Fister ([email protected]) Randa Johnson ([email protected]) Sharon Ross ([email protected]) Katie McCamant ([email protected]) Barbara Burnham ([email protected])
Transcript of AFFORDABLE COHOUSING TOOLKIT A SUMMARY OF … · 3 Purpose of this Summary This summary has been...

AFFORDABLE COHOUSING TOOLKIT:A SUMMARY OF PUBLIC AND PRIVATE AFFORDABLE HOUSING PROGRAMS
Affordable Cohousing Task GroupThe Cohousing Association of the U.S.
June 2010
Affordable Cohousing Task Group Members:
David Entin ([email protected])Grace Kim ([email protected])
Greg Sherwin ([email protected])Jerome Garciano ([email protected])
Kathleen Nolan ([email protected])Nancy Fister ([email protected])
Randa Johnson ([email protected])Sharon Ross ([email protected])
Katie McCamant ([email protected])Barbara Burnham ([email protected])

2
TABLE OF CONTENTS
A. PUBLIC AFFORDABLE HOUSING SUBSIDIES AND FINANCING SOURCES ........................... 8
A.01 Community Development Block Grant Program (CDBG) ........................................................................................................... 9
A.02 Low Income Housing Tax Credit (LIHTC) ................................................................................................................................. 12
A.03 HOME Investment Partnerships Program .................................................................................................................................. 15
A.04 Federal Private activity tax-exempt bonds for housing............................................................................................................... 18
A.05 Federal Housing Choice (Section 8) Vouchers ............................................................................................................................. 21
A.06 Housing Opportunities for Persons with AIDS (HOPWA)........................................................................................................ 24
A.07 Low Income Home Energy Assistance Program (LIHEAP)....................................................................................................... 27
A.08 Neighborhood Stabilization Program (NSP)................................................................................................................................ 30
A.09 New Markets Tax Credit (NMTC) ............................................................................................................................................... 33
A.10 Project-Based Rental Assistance (PB Section 8) .......................................................................................................................... 36
A.11 Rural Housing And Economic Development (RHED) ................................................................................................................ 39
A.12 Section 202 Supportive Housing for the Elderly.......................................................................................................................... 42
A.13 Section 514/516 Farm Labor Housing .......................................................................................................................................... 45
A.14 Section 811 Supportive Housing for Persons with Disabilities ................................................................................................... 48
A.15 Self-Help Homeownership Opportunity Program (SHOP) ........................................................................................................ 51
A.16 State and Local Housing Trust Funds .......................................................................................................................................... 54
B. PRIVATE AFFORDABLE HOUSING SUBSIDIES AND FINANCING SOURCES ....................... 57
B.01 Federal Home Loan Banks (FHLB) Affordable Housing Program (AHP) ............................................................................... 58
B.02 Community Self Financing............................................................................................................................................................ 61
B.03 Not-For-Profit Intermediary Organizations ................................................................................................................................ 64
B.04 Community Development Financial Institutions (CDFI)............................................................................................................ 67
B.05 Private Buyer & Investor Model .................................................................................................................................................. 70
B.06 Private Foundation Grants ........................................................................................................................................................... 73
C. GENERAL AFFORDABLE HOUSING MECHANISMS........................................................... 76
C.01 Community Land Trusts ............................................................................................................................................................... 77
C.02 Small House Design ....................................................................................................................................................................... 80

3
Purpose of this SummaryThis summary has been created by the Affordable Cohousing Task Group of The CohousingAssociation of the United States (CohoUS). It is intended to be a resource for existing andforming cohousing communities for researching affordable housing subsidies. The summarydescribes a variety of public and private subsidies which may enable cohousing groups tofinancially integrate affordable housing units in rental and homeownership cohousing structures.Each summary provides a basic description of the subsidy, the types of projects the subsidy mayapply to, the required level of affordability, and the application process. As each financialsubsidy is introduced units are able to be designated as affordable units at a certain level of thearea median income.
Cohousing groups should use this summary as a guide for initial research for potential affordablehousing subsidies that may apply to their projects. Each subsidy description includes a financialanalysis indicating the financial effect of the subsidy starting from a market-rate baseline. Notethat many of the public and private subsidies summarized here are available through competitivefunding application processes. Cohousing groups may want to consider partnering strategies (forexample with local non-profits) with experience in these competitive applications.
Definition of “Affordable”The definition of “affordable” is based on the geographic location of the housing and theeconomic resources of the resident household. The geographic location factor is determined byusing the local HUD Area Median Income (AMI) for the area in which the cohousing project issituated. The AMI is an annually updated federal determination of the median annual incomeamount for a statistical geographic area. A household’s economic resources is then determinedby calculating the household’s actual income as percentage of the AMI, based on household size.An affordable monthly rent or mortgage payment (including utilities) is usually defined as 30%of a household’s monthly income, as adjusted for an assumed household size. Whether a givenhousing unit is affordable is therefore a function of both the local housing costs (using the localAMI as a proxy) and the size of the unit (using a percent of local AMI based on household sizeassumed for the number of bedrooms in the unit).
Note that many affordable housing programs require both a certain maximum housing paymentlevel (rent restriction) and a maximum income level of the tenant (income restriction). Theincome restriction promotes the inclusion of lower income tenants into a housing developmentwhile the rent restriction insures that the tenant pays an affordable level of rent for that incomelevel.
For example, the 2009 AMI for the Boulder, Colorado statistical area is $89,100 for a family offour. A family of four with an income of $44,550 would be considered at the 50% AMI level(“Very Low Income”). A family at the 50% AMI level living in a 3BR unit (with an assumedannual income of $46,325, calculated from a 4.5 assumed household size) can pay up to $1,048per month ($46,325 x 30% / 12 - $110 monthly utility allowance) to be considered paying anaffordable housing cost level for the 3BR unit. So $1,048 per month or lower is an affordablehousing cost payment for a 3BR unit for a family at the 50% AMI level in Boulder, Colorado.Such a unit should have an income restriction so that only families at 50% AMI or lower maylive in that unit at that rent level.

4
About the Affordable Cohousing Task GroupThe CohoUS wishes to find ways to increase the diversity of cohousing communities bypromoting the creation of more affordable housing units. While the CohoUS believes thatcohousing is an environmentally, socially, and economically sustainable housing model foreveryone, it also recognizes that the emphasis on homeownership has put cohousing out of reachfor many low to moderate income people.
The CohoUS Board members recognized that CohoUS needs to dedicate its resources to affectchange in the inclusion of affordable units in our communities and to identify ways to preservelong-term affordability. To acknowledge that affordability is part of the CohoUS strategicagenda, it chartered the Affordable Cohousing Task Group in January 2010. The Task Groupwas charged with exploring means for creating affordable units within cohousing. One ofintended outcomes of the Task Group was to provide information to existing and formingcohousing communities about how to create more affordability.
For More InformationPlease contact any member of the CohoUS Affordable Cohousing Task Group for moreinformation on the CohoUS Affordable Cohousing Task Group. This summary is a work inprogress and will be continually updated. For more information or to suggest additions orchanges to this summary please contact the Affordable Cohousing Task Group [email protected].

5
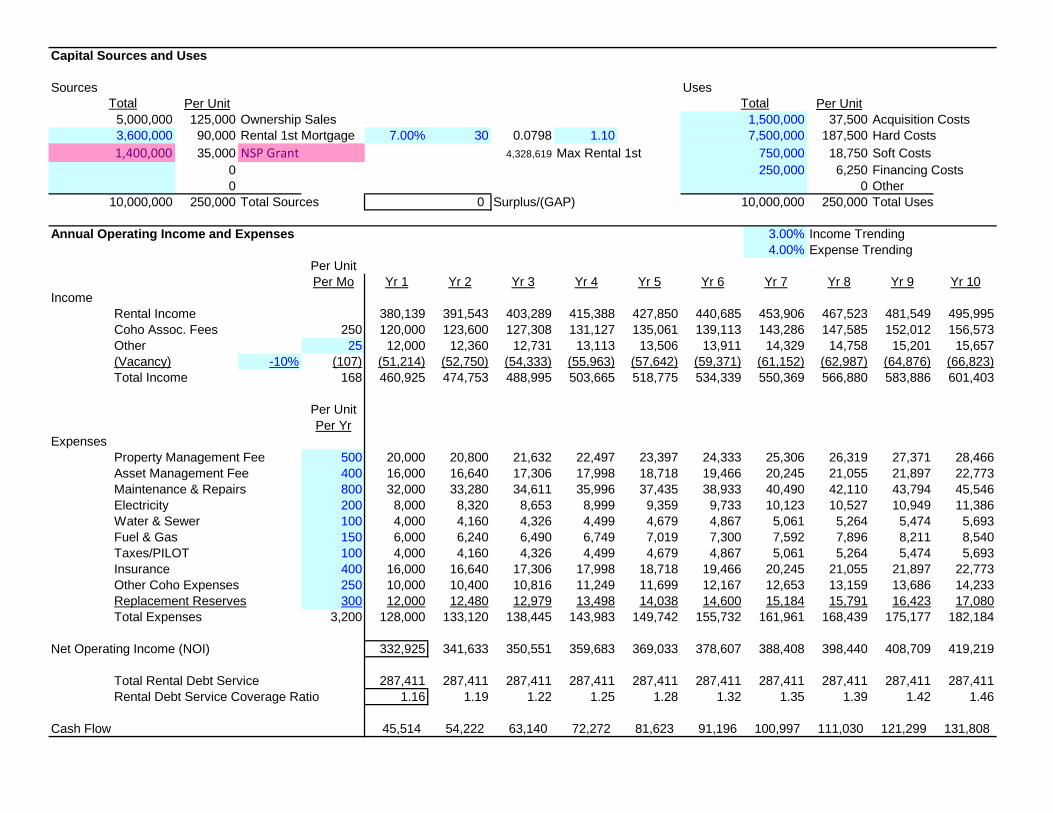
Market Rate Baseline Financial Model
The Market Rate Baseline Financial Model is a financial analysis of a market-rate hypotheticalcohousing development in Boulder, CO. The hypothetical cohousing is a 40-unit project andcosts $10m to build. Half of the units are rental and half are homeownership. No affordableunits are assumed in the Market Rate Baseline Financial Model.
The Market Rate Baseline Financial Model will be used as a starting point comparison to each ofthe subsequent subsidy financial models. By comparing to the Market Rate Baseline FinancialModel, one can see how each subsidy works financially to make affordable units. Blue cellsindicate generally variable data inputs. Each subsidy financial model shows in red cells thechange of the financial subsidy on the cohousing development.

Market Rate Baseline ModelAffordable Cohousing Toolkit
House Hold Size 3.0 3.5 4.0 4.5 5.0 Metro Statistical Area Boulder, CO100% Area Median Income 80,200 84,650 89,100 92,650 96,200 Year 2009
50% Area Median Income 40,100 42,325 44,550 46,325 48,100
Unit type 2BR 3BRHouse Hold Size 3 4.5 30% Affordable Rent % of IncomeUtilities Allowance 90 110 30% Affordable Mortgage % of Income
Rental Calculation 2BR 3BRMarket Rent 1,500 2,000 10 10
50% AMI Affordable Rent 913 1,04810 10
Coho Assoc. Fees 200 300 20 Units420,000 Annual Income
Homeownership Calculation Mortgage Loan Interest Rate 6.00%2BR 3BR Mortgage Loan Amortization Yrs 30
Sales Price 250,000 330,000Closing CostsEscrow
250,000 330,000
20% Down Payment 50,000 66,0001st Mortgage 200,000 264,000Soft 2nd Mortgage Total Soft 2nd Mort
0.071946 Monthly 1st Mortgage Payment 1,199 1,5830.589% Taxes 123 162
Insurance 50 75Ownership Monthly Scenario 1,372 1,820
2BR 3BRMarket Mortgage Payment 1,500 2,000 10 10
50% AMI Affordable Mortgage Payment 913 1,04810 10
Coho Assoc. Fees 200 300 20 UnitsTotal Sales5,800,000
0

Capital Sources and Uses
Sources UsesTotal Per Unit Total Per Unit
145,000 Ownership Sales 37,500 Acquisition Costs
105,000 Rental 1st Mortgage 7.00% 30 0.0798 1.10 187,500 Hard Costs0 4,782,514 Max Rental 1st 18,750 Soft Costs0 6,250 Financing Costs0 0 Other
250,000 Total Sources Surplus/(GAP) 250,000 Total Uses
Annual Operating Income and Expenses 3.00% Income Trending4.00% Expense Trending
Per UnitPer Mo Yr 1 Yr 2 Yr 3 Yr 4 Yr 5 Yr 6 Yr 7 Yr 8 Yr 9 Yr 10
IncomeRental Income 420,000 432,600 445,578 458,945 472,714 486,895 501,502 516,547 532,043 548,005Coho Assoc. Fees 250 120,000 123,600 127,308 131,127 135,061 139,113 143,286 147,585 152,012 156,573Other 25 12,000 12,360 12,731 13,113 13,506 13,911 14,329 14,758 15,201 15,657(Vacancy) -10% (115) (55,200) (56,856) (58,562) (60,319) (62,128) (63,992) (65,912) (67,889) (69,926) (72,023)Total Income 160 496,800 511,704 527,055 542,867 559,153 575,927 593,205 611,001 629,331 648,211
Per UnitPer Yr
ExpensesProperty Management Fee 500 20,000 20,800 21,632 22,497 23,397 24,333 25,306 26,319 27,371 28,466Asset Management Fee 400 16,000 16,640 17,306 17,998 18,718 19,466 20,245 21,055 21,897 22,773Maintenance & Repairs 800 32,000 33,280 34,611 35,996 37,435 38,933 40,490 42,110 43,794 45,546Electricity 200 8,000 8,320 8,653 8,999 9,359 9,733 10,123 10,527 10,949 11,386Water & Sewer 100 4,000 4,160 4,326 4,499 4,679 4,867 5,061 5,264 5,474 5,693Fuel & Gas 150 6,000 6,240 6,490 6,749 7,019 7,300 7,592 7,896 8,211 8,540Taxes/PILOT 100 4,000 4,160 4,326 4,499 4,679 4,867 5,061 5,264 5,474 5,693Insurance 400 16,000 16,640 17,306 17,998 18,718 19,466 20,245 21,055 21,897 22,773Other Coho Expenses 250 10,000 10,400 10,816 11,249 11,699 12,167 12,653 13,159 13,686 14,233Replacement Reserves 300 12,000 12,480 12,979 13,498 14,038 14,600 15,184 15,791 16,423 17,080Total Expenses 3,200 128,000 133,120 138,445 143,983 149,742 155,732 161,961 168,439 175,177 182,184
Net Operating Income (NOI) 368,800 378,584 388,610 398,884 409,411 420,196 431,244 442,562 454,155 466,027
Total Rental Debt Service 335,312 335,312 335,312 335,312 335,312 335,312 335,312 335,312 335,312 335,312Rental Debt Service Coverage Ratio 1.10 1.13 1.16 1.19 1.22 1.25 1.29 1.32 1.35 1.39
Cash Flow 33,488 43,272 53,298 63,572 74,098 84,883 95,932 107,250 118,842 130,715
10,000,000 0 10,000,000
750,000250,000
5,800,000 1,500,000
4,200,000 7,500,000

8
A. Public Affordable Housing Subsidies and Financing Sources

9
A.01 Community Development Block Grant Program (CDBG)
GENERAL DESCRIPTION. Cohousing groups may be able to use the CommunityDevelopment Block Grant (CDBG) Program as a capital subsidy. The CDBG Programprovides grant funding on a formula basis to municipalities to develop housing andexpanded economic opportunities for low- and moderate-income persons.
ELIGIBLE PROJECTS. Cohousing projects that are rental or homeownership may beeligible. CDBG funds can be used for housing rehabilitation loans and grants tohomeowners, landlords, nonprofits and developers, housing construction finance, downpayment assistance and other help for first-time home buyers, purchasing land andbuildings, building accessibility for the elderly and disabled, public services such as jobtraining, transportation, healthcare and child care; capacity-building for nonprofits;rehabilitating commercial or industrial buildings; and loans or grants to businesses. Inrecent years, about 25% of CDBG funds have been used for some type of housingprogram.
AFFORDABILITY REQUIREMENTS. Cohousing affordable units must be forresidents at or below 50-80% of AMI. Single-family homes must be occupied by a lowor moderate income household. For multifamily buildings, at least 51% of the units mustbe occupied by low or moderate income households.
HOW TO APPLY. Cohousing groups should contact your state, local municipal orcounty official for more information. The CDBG entitlement program allocates annualgrants to larger cities and urban counties. The Small Cities CDBG program is fundedthrough State agencies which award grants to smaller local governments. Annually, eachState develops funding priorities and criteria for selecting projects. HUD’s Office ofCommunity Planning and Development administers providing funds to improve housing,the living environment and economic opportunities for persons with low and moderateincomes. For more information see
http://www.hud.gov/offices/cpd/communitydevelopment/programs/

A.01 - Community Development Block Grant Program (CDBG)Affordable Cohousing Toolkit
House Hold Size 3.0 3.5 4.0 4.5 5.0 Metro Statistical Area Boulder, CO100% Area Median Income 80,200 84,650 89,100 92,650 96,200 Year 2009
50% Area Median Income 40,100 42,325 44,550 46,325 48,100
Unit type 2BR 3BRHouse Hold Size 3 4.5 30% Affordable Rent % of IncomeUtilities Allowance 90 110 30% Affordable Mortgage % of Income
Rental Calculation 2BR 3BR
Market Rent 1,500 2,000 7 7
60% AMI Affordable Rent 1,113 1,280 3 310 10
Coho Assoc. Fees 200 300 20 Units
380,139 Annual Income
Homeownership Calculation Mortgage Loan Interest Rate 6.00%2BR 3BR Mortgage Loan Amortization Yrs 30
Sales Price 250,000 330,000Closing CostsEscrow
250,000 330,000
20% Down Payment 50,000 66,0001st Mortgage 200,000 264,000Soft 2nd Mortgage Total Soft 2nd Mort
0.071946 Monthly 1st Mortgage Payment 1,199 1,5830.589% Taxes 123 162
Insurance 50 75Ownership Monthly Scenario 1,372 1,820
2BR 3BRMarket Mortgage Payment 1,500 2,000 10 10
50% AMI Affordable Mortgage Payment 913 1,04810 10
Coho Assoc. Fees 200 300 20 UnitsTotal Sales5,800,000
0

Capital Sources and Uses
Sources UsesTotal Per Unit Total Per Unit
145,000 Ownership Sales 37,500 Acquisition Costs
92,500 Rental 1st Mortgage 7.00% 30 0.0798 1.10 187,500 Hard Costs
12,500 CDBG 4,328,619 Max Rental 1st 18,750 Soft Costs
0 6,250 Financing Costs0 0 Other
250,000 Total Sources Surplus/(GAP) 250,000 Total Uses
Annual Operating Income and Expenses 3.00% Income Trending4.00% Expense Trending
Per UnitPer Mo Yr 1 Yr 2 Yr 3 Yr 4 Yr 5 Yr 6 Yr 7 Yr 8 Yr 9 Yr 10
IncomeRental Income 380,139 391,543 403,289 415,388 427,850 440,685 453,906 467,523 481,549 495,995Coho Assoc. Fees 250 120,000 123,600 127,308 131,127 135,061 139,113 143,286 147,585 152,012 156,573Other 25 12,000 12,360 12,731 13,113 13,506 13,911 14,329 14,758 15,201 15,657(Vacancy) -10% (107) (51,214) (52,750) (54,333) (55,963) (57,642) (59,371) (61,152) (62,987) (64,876) (66,823)Total Income 168 460,925 474,753 488,995 503,665 518,775 534,339 550,369 566,880 583,886 601,403
Per UnitPer Yr
ExpensesProperty Management Fee 500 20,000 20,800 21,632 22,497 23,397 24,333 25,306 26,319 27,371 28,466Asset Management Fee 400 16,000 16,640 17,306 17,998 18,718 19,466 20,245 21,055 21,897 22,773Maintenance & Repairs 800 32,000 33,280 34,611 35,996 37,435 38,933 40,490 42,110 43,794 45,546Electricity 200 8,000 8,320 8,653 8,999 9,359 9,733 10,123 10,527 10,949 11,386Water & Sewer 100 4,000 4,160 4,326 4,499 4,679 4,867 5,061 5,264 5,474 5,693Fuel & Gas 150 6,000 6,240 6,490 6,749 7,019 7,300 7,592 7,896 8,211 8,540Taxes/PILOT 100 4,000 4,160 4,326 4,499 4,679 4,867 5,061 5,264 5,474 5,693Insurance 400 16,000 16,640 17,306 17,998 18,718 19,466 20,245 21,055 21,897 22,773Other Coho Expenses 250 10,000 10,400 10,816 11,249 11,699 12,167 12,653 13,159 13,686 14,233Replacement Reserves 300 12,000 12,480 12,979 13,498 14,038 14,600 15,184 15,791 16,423 17,080Total Expenses 3,200 128,000 133,120 138,445 143,983 149,742 155,732 161,961 168,439 175,177 182,184
Net Operating Income (NOI) 332,925 341,633 350,551 359,683 369,033 378,607 388,408 398,440 408,709 419,219
Total Rental Debt Service 295,394 295,394 295,394 295,394 295,394 295,394 295,394 295,394 295,394 295,394Rental Debt Service Coverage Ratio 1.13 1.16 1.19 1.22 1.25 1.28 1.31 1.35 1.38 1.42
Cash Flow 37,531 46,239 55,156 64,288 73,639 83,213 93,014 103,046 113,315 123,824
10,000,000 0 10,000,000
500,000 750,000
250,000
5,800,000 1,500,000
3,700,000 7,500,000

12
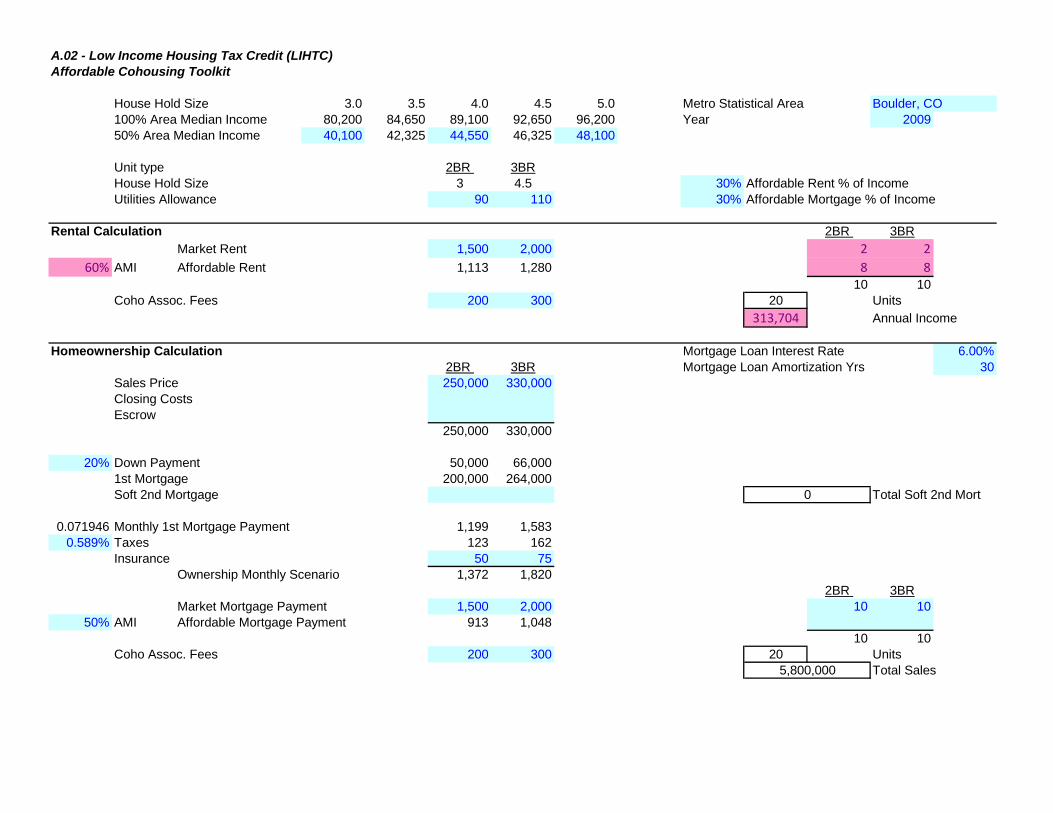
A.02 Low Income Housing Tax Credit (LIHTC)
GENERAL DESCRIPTION. Cohousing groups may be able to use the Low IncomeHousing Tax Credit (LIHTC) program as a capital subsidy. The LIHTC programexpands the supply of affordable housing by offering federal income tax credits toinvestors for private investment in low income housing. The tax credit is sold to theinvestors, who provide cash or ‘equity’ to the owner of a project and, in return, receive adollar-for-dollar reduction in their federal income taxes. The equity reduces the amountof money an owner has to borrow, thereby lowering debt costs and rents to residents.
ELIGIBLE PROJECTS. Cohousing projects that are rental may be eligible. The LIHTCcan be used to support multifamily and single-family housing, new construction, andrehabilitation, and housing for the elderly and disabled. Once awarded tax credits, adeveloper then sells them to investors, usually through an equity syndicator. Mostinvestors are large corporations and banks that receive Community Reinvestment Actcredit for these investments. The cash from the investors is used by the owner, along withother subsidies to construct the affordable housing.
AFFORDABILITY REQUIREMENTS. Cohousing affordable units must be forresidents at or below 50-60% of AMI. Qualified low income housing projects aredefined as housing where either (1) 20% or more of the units are rent restricted andoccupied by persons at 50% of area median income or less (20/50 projects) or (2) 40% ofthe units are rent restricted and occupied by persons at 60% of area median or less (40/60projects). Units are rent restricted when rent and utilities do not exceed 30% of the 50%or 60% income limitation applicable to that unit. Units must be rent-restricted andoccupied by income-eligible households for at least 30 years. Some states require‘extended low income housing commitments’ greater than 30 years or provide incentivesfor projects that voluntarily agree to longer commitments.
HOW TO APPLY. Cohousing groups should contact the applicable state HousingFinance Agency (HFA) or allocating agency for more information. Tax credits areallocated to states based on each state’s population. Each state has an allocating agency,often the state HFA, that decides how to allocate its share of federal housing tax credits tohousing projects around its jurisdiction. Each allocating agency must have a QualifiedAllocation Plan (QAP), which sets out the state’s priorities and eligibility criteria forawarding federal tax credits to housing projects. For more information see
www.hud.gov/offices/cpd/affordablehousing/training/web/lihtc/
www.ruralhome.org/pubs/guides/lihtc/toc.htm
www.enterprisecommunity.com/products_and_services/downloads/lihtc_101_ppt_10-06.
A.02 - Low Income Housing Tax Credit (LIHTC)Affordable Cohousing Toolkit
House Hold Size 3.0 3.5 4.0 4.5 5.0 Metro Statistical Area Boulder, CO100% Area Median Income 80,200 84,650 89,100 92,650 96,200 Year 2009
50% Area Median Income 40,100 42,325 44,550 46,325 48,100
Unit type 2BR 3BRHouse Hold Size 3 4.5 30% Affordable Rent % of IncomeUtilities Allowance 90 110 30% Affordable Mortgage % of Income
Rental Calculation 2BR 3BR
Market Rent 1,500 2,000 2 2
60% AMI Affordable Rent 1,113 1,280 8 810 10
Coho Assoc. Fees 200 300 20 Units
313,704 Annual Income
Homeownership Calculation Mortgage Loan Interest Rate 6.00%2BR 3BR Mortgage Loan Amortization Yrs 30
Sales Price 250,000 330,000Closing CostsEscrow
250,000 330,000
20% Down Payment 50,000 66,0001st Mortgage 200,000 264,000Soft 2nd Mortgage Total Soft 2nd Mort
0.071946 Monthly 1st Mortgage Payment 1,199 1,5830.589% Taxes 123 162
Insurance 50 75Ownership Monthly Scenario 1,372 1,820
2BR 3BRMarket Mortgage Payment 1,500 2,000 10 10
50% AMI Affordable Mortgage Payment 913 1,04810 10
Coho Assoc. Fees 200 300 20 UnitsTotal Sales5,800,000
0

Capital Sources and Uses
Sources UsesTotal Per Unit Total Per Unit
145,000 Ownership Sales 37,500 Acquisition Costs
55,275 Rental 1st Mortgage 7.00% 30 0.0798 1.10 187,500 Hard Costs
49,725 LIHTC Equity 9% 3,572,128 Max Rental 1st 18,750 Soft Costs
0 0.65 6,250 Financing Costs
0 0 Other250,000 Total Sources Surplus/(GAP) 250,000 Total Uses
Annual Operating Income and Expenses 3.00% Income Trending4.00% Expense Trending
Per UnitPer Mo Yr 1 Yr 2 Yr 3 Yr 4 Yr 5 Yr 6 Yr 7 Yr 8 Yr 9 Yr 10
IncomeRental Income 313,704 323,115 332,809 342,793 353,077 363,669 374,579 385,816 397,391 409,313Coho Assoc. Fees 250 120,000 123,600 127,308 131,127 135,061 139,113 143,286 147,585 152,012 156,573Other 25 12,000 12,360 12,731 13,113 13,506 13,911 14,329 14,758 15,201 15,657(Vacancy) -10% (93) (44,570) (45,908) (47,285) (48,703) (50,164) (51,669) (53,219) (54,816) (56,460) (58,154)Total Income 182 401,134 413,168 425,563 438,330 451,479 465,024 478,974 493,344 508,144 523,388
Per UnitPer Yr
Expenses
Property Management Fee 1,000 40,000 41,600 43,264 44,995 46,794 48,666 50,613 52,637 54,743 56,932
Asset Management Fee 1,000 40,000 41,600 43,264 44,995 46,794 48,666 50,613 52,637 54,743 56,932
Maintenance & Repairs 800 32,000 33,280 34,611 35,996 37,435 38,933 40,490 42,110 43,794 45,546Electricity 200 8,000 8,320 8,653 8,999 9,359 9,733 10,123 10,527 10,949 11,386Water & Sewer 100 4,000 4,160 4,326 4,499 4,679 4,867 5,061 5,264 5,474 5,693Fuel & Gas 150 6,000 6,240 6,490 6,749 7,019 7,300 7,592 7,896 8,211 8,540Taxes/PILOT 100 4,000 4,160 4,326 4,499 4,679 4,867 5,061 5,264 5,474 5,693Insurance 400 16,000 16,640 17,306 17,998 18,718 19,466 20,245 21,055 21,897 22,773Other Coho Expenses 250 10,000 10,400 10,816 11,249 11,699 12,167 12,653 13,159 13,686 14,233Replacement Reserves 300 12,000 12,480 12,979 13,498 14,038 14,600 15,184 15,791 16,423 17,080Total Expenses 4,300 172,000 178,880 186,035 193,477 201,216 209,264 217,635 226,340 235,394 244,810
Net Operating Income (NOI) 229,134 234,288 239,527 244,853 250,264 255,759 261,340 267,003 272,750 278,579
Total Rental Debt Service 176,518 176,518 176,518 176,518 176,518 176,518 176,518 176,518 176,518 176,518Rental Debt Service Coverage Ratio 1.30 1.33 1.36 1.39 1.42 1.45 1.48 1.51 1.55 1.58
Cash Flow 52,616 57,770 63,009 68,335 73,746 79,241 84,822 90,485 96,232 102,061
10,000,000 0 10,000,000
1,989,000 750,000
250,000
5,800,000 1,500,000
2,211,000 7,500,000

15
A.03 HOME Investment Partnerships Program
GENERAL DESCRIPTION. Cohousing groups may be able to use the HOMEInvestment Partnerships (HOME) Program as a capital or operating subsidy. The HOMEprogram is a federal block grant to states and certain localities, that use the funds toprovide affordable low income housing. States and localities use the funds for a variety ofrental and homeownership activities, such as constructing new units, rehabilitatingexisting units, offering down payment assistance, and providing tenant-based rentalassistance.
ELIGIBLE PROJECTS. Cohousing projects that are rental or homeownership may beeligible. HOME funds can be used as a grant or a loan to buy existing housing or vacantland for affordable housing, build new housing, and rehabilitate existing housing. Othereligible uses include demolition costs to make way for affordable housing, relocation, siteimprovements, and various soft costs such as engineering plans, attorneys’ fees, titlesearch and fair housing services. HOME can also be used to make loans, loan guaranteesor down payment assistance. Tenants of rental projects can also be given grants forsecurity deposits and rental assistance (so that they pay no more than 30% of theirincome for rent and utilities).
AFFORDABILITY REQUIREMENTS. Cohousing affordable units must be forresidents at or below 50-80% of AMI. When HOME is used to assist renters, at least90% of the units must be occupied by households with incomes below 60% of AMI andthe remaining 10% of the rental units can benefit those with incomes up to 80% of AMI.If a rental project has five or more HOME units, at least 20% of the HOME units must beoccupied by households with incomes below 50% of AMI. For homeowners, HOMEmust be used for housing occupied by households with incomes below 80% of AMI.Newly constructed projects must remain affordable for 20 years. Existing housing that iseither purchased or rehabilitated must remain affordable for 15 years if more than$40,000 per unit is spent, 10 years if between $15,000 and $40,000 per unit is spent, andfive years if less than $15,000 per unit is spent. Projects must have ‘resale’ and‘recapture’ provisions to ensure affordability during the required periods. If an originalhomeowner sells before the end of the affordability period a resale provision must requirepurchase by an income-eligible household. A recapture provision must ensure that all or aportion of HOME assistance is recouped if an owner sells or is foreclosed upon.
HOW TO APPLY. Cohousing groups should contact their local state and local agencywhich awards and administers the HOME program. The program is administered at thefederal level by the Office of Affordable Housing Programs in HUD’s Office ofCommunity Planning and Development (CPD). For more information see
www.hud.gov/offices/cpd/affordablehousing/programs/home/index.cfm.

A.03 - HOME Investment Partnerships ProgramAffordable Cohousing Toolkit
House Hold Size 3.0 3.5 4.0 4.5 5.0 Metro Statistical Area Boulder, CO100% Area Median Income 80,200 84,650 89,100 92,650 96,200 Year 2009
50% Area Median Income 40,100 42,325 44,550 46,325 48,100
Unit type 2BR 3BRHouse Hold Size 3 4.5 30% Affordable Rent % of IncomeUtilities Allowance 90 110 30% Affordable Mortgage % of Income
Rental Calculation 2BR 3BRMarket Rent 1,500 2,000 10 10
50% AMI Affordable Rent 913 1,04810 10
Coho Assoc. Fees 200 300 20 Units420,000 Annual Income
Homeownership Calculation Mortgage Loan Interest Rate 6.00%2BR 3BR Mortgage Loan Amortization Yrs 30
Sales Price 250,000 330,000Closing CostsEscrow
250,000 330,000
20% Down Payment 50,000 66,000
1st Mortgage 180,000 204,000
HOME Soft 2nd Mortgage 20,000 60,000 Total Soft 2nd Mort
0.071946 Monthly 1st Mortgage Payment 1,079 1,2230.589% Taxes 123 162
Insurance 50 75Ownership Monthly Scenario 1,252 1,460
2BR 3BR
Market Mortgage Payment 1,500 2,000 5 5
70% AMI Affordable Mortgage Payment 1,314 1,511 5 510 10
Coho Assoc. Fees 200 300 20 UnitsTotal Sales5,800,000
400,000

Capital Sources and Uses
Sources UsesTotal Per Unit Total Per Unit
145,000 Ownership Sales 37,500 Acquisition Costs
105,000 Rental 1st Mortgage 7.00% 30 0.0798 1.10 187,500 Hard Costs0 4,782,514 Max Rental 1st 18,750 Soft Costs0 6,250 Financing Costs0 0 Other
250,000 Total Sources Surplus/(GAP) 250,000 Total Uses
Annual Operating Income and Expenses 3.00% Income Trending4.00% Expense Trending
Per UnitPer Mo Yr 1 Yr 2 Yr 3 Yr 4 Yr 5 Yr 6 Yr 7 Yr 8 Yr 9 Yr 10
IncomeRental Income 420,000 432,600 445,578 458,945 472,714 486,895 501,502 516,547 532,043 548,005Coho Assoc. Fees 250 120,000 123,600 127,308 131,127 135,061 139,113 143,286 147,585 152,012 156,573Other 25 12,000 12,360 12,731 13,113 13,506 13,911 14,329 14,758 15,201 15,657(Vacancy) -10% (115) (55,200) (56,856) (58,562) (60,319) (62,128) (63,992) (65,912) (67,889) (69,926) (72,023)Total Income 160 496,800 511,704 527,055 542,867 559,153 575,927 593,205 611,001 629,331 648,211
Per UnitPer Yr
ExpensesProperty Management Fee 500 20,000 20,800 21,632 22,497 23,397 24,333 25,306 26,319 27,371 28,466Asset Management Fee 400 16,000 16,640 17,306 17,998 18,718 19,466 20,245 21,055 21,897 22,773Maintenance & Repairs 800 32,000 33,280 34,611 35,996 37,435 38,933 40,490 42,110 43,794 45,546Electricity 200 8,000 8,320 8,653 8,999 9,359 9,733 10,123 10,527 10,949 11,386Water & Sewer 100 4,000 4,160 4,326 4,499 4,679 4,867 5,061 5,264 5,474 5,693Fuel & Gas 150 6,000 6,240 6,490 6,749 7,019 7,300 7,592 7,896 8,211 8,540Taxes/PILOT 100 4,000 4,160 4,326 4,499 4,679 4,867 5,061 5,264 5,474 5,693Insurance 400 16,000 16,640 17,306 17,998 18,718 19,466 20,245 21,055 21,897 22,773Other Coho Expenses 250 10,000 10,400 10,816 11,249 11,699 12,167 12,653 13,159 13,686 14,233Replacement Reserves 300 12,000 12,480 12,979 13,498 14,038 14,600 15,184 15,791 16,423 17,080Total Expenses 3,200 128,000 133,120 138,445 143,983 149,742 155,732 161,961 168,439 175,177 182,184
Net Operating Income (NOI) 368,800 378,584 388,610 398,884 409,411 420,196 431,244 442,562 454,155 466,027
Total Rental Debt Service 335,312 335,312 335,312 335,312 335,312 335,312 335,312 335,312 335,312 335,312Rental Debt Service Coverage Ratio 1.10 1.13 1.16 1.19 1.22 1.25 1.29 1.32 1.35 1.39
Cash Flow 33,488 43,272 53,298 63,572 74,098 84,883 95,932 107,250 118,842 130,715
10,000,000 0 10,000,000
750,000250,000
5,800,000 1,500,000
4,200,000 7,500,000

18
A.04 Federal Private activity tax-exempt bonds for housing
GENERAL DESCRIPTION. Cohousing groups may be able to use tax-exempt bonds aslow cost financing. Private activity bonds are issued by state and local governments tosupport the stated public purpose including housing, student loans, infrastructure, andredevelopment activities. Private activity bonds must fulfill public purposes and eachprivate activity bond issuer must hold public hearings to demonstrate such publicpurposes. Certain private activity bonds allow Housing Finance Agencies (HFAs) toaccess private financing to support affordable housing. HFAs sell the tax-exempt bondsto individual and corporate investors, who are willing to purchase bonds paying lowerthan market interest rates because of the bonds’ tax-exempt status. This interest savings ispassed on through private lenders to support housing purchase and development.Mortgage Revenue Bonds use proceeds finance to discount mortgages to support thepurchase of single-family homes.
ELIGIBLE PROJECTS. Cohousing projects that are rental or homeownership may beeligible. There are two main types of housing bonds: Mortgage Revenue Bonds(MRBs), which finance single-family home purchases for qualified low incomehomebuyers, and multifamily housing bonds, which finance the acquisition, construction,and rehabilitation of multifamily developments for low income renters. By lowering theinterest rate, MRBs make homeownership affordable for families who would not be ableto meet mortgage payments on a conventional loan. Multifamily bonds provide fundingfor multifamily housing development that reaches income groups the market might nototherwise serve. Multifamily housing bonds finance the acquisition, construction, orrehabilitation of affordable rental housing.
AFFORDABILITY REQUIREMENTS. Cohousing affordable units must be forresidents at or below 115% of AMI. MRB mortgages are limited to first-timehomebuyers who earn no more than the greater of area or statewide median income(AMI). Families of three or more can earn up to 115% of the greater of area or statewidemedian income. The price of homes purchased with MRB mortgages is limited to 90% ofthe average area purchase price. In the case of multifamily bonds, the income-restrictedapartments financed by those bonds must remain affordable for at least 15 years.
HOW TO APPLY. Cohousing groups should contact the local state HFA for moreinformation on applying. For more information see www.ncsha.org.

A.04 - Federal Private activity tax-exempt bonds for housingAffordable Cohousing Toolkit
House Hold Size 3.0 3.5 4.0 4.5 5.0 Metro Statistical Area Boulder, CO100% Area Median Income 80,200 84,650 89,100 92,650 96,200 Year 2009
50% Area Median Income 40,100 42,325 44,550 46,325 48,100
Unit type 2BR 3BRHouse Hold Size 3 4.5 30% Affordable Rent % of IncomeUtilities Allowance 90 110 30% Affordable Mortgage % of Income
Rental Calculation 2BR 3BR
Market Rent 1,500 2,000 6 6
50% AMI Affordable Rent 913 1,048 4 410 10
Coho Assoc. Fees 200 300 20 Units
346,110 Annual Income
Homeownership Calculation Mortgage Loan Interest Rate 6.00%2BR 3BR Mortgage Loan Amortization Yrs 30
Sales Price 250,000 330,000Closing CostsEscrow
250,000 330,000
20% Down Payment 50,000 66,0001st Mortgage 200,000 264,000Soft 2nd Mortgage Total Soft 2nd Mort
0.071946 Monthly 1st Mortgage Payment 1,199 1,5830.589% Taxes 123 162
Insurance 50 75Ownership Monthly Scenario 1,372 1,820
2BR 3BRMarket Mortgage Payment 1,500 2,000 10 10
50% AMI Affordable Mortgage Payment 913 1,04810 10
Coho Assoc. Fees 200 300 20 UnitsTotal Sales5,800,000
0

Capital Sources and Uses
Sources UsesTotal Per Unit Total Per Unit
145,000 Ownership Sales 37,500 Acquisition Costs
105,000 TE Rental 1st Mortgage 5.00% 30 0.0644 1.10 187,500 Hard Costs
0 4,884,389 Max Rental 1st 18,750 Soft Costs0 6,250 Financing Costs0 0 Other
250,000 Total Sources Surplus/(GAP) 250,000 Total Uses
Annual Operating Income and Expenses 3.00% Income Trending4.00% Expense Trending
Per UnitPer Mo Yr 1 Yr 2 Yr 3 Yr 4 Yr 5 Yr 6 Yr 7 Yr 8 Yr 9 Yr 10
IncomeRental Income 346,110 356,493 367,188 378,204 389,550 401,236 413,273 425,672 438,442 451,595Coho Assoc. Fees 250 120,000 123,600 127,308 131,127 135,061 139,113 143,286 147,585 152,012 156,573Other 25 12,000 12,360 12,731 13,113 13,506 13,911 14,329 14,758 15,201 15,657(Vacancy) -10% (100) (47,811) (49,245) (50,723) (52,244) (53,812) (55,426) (57,089) (58,801) (60,566) (62,383)Total Income 175 430,299 443,208 456,504 470,199 484,305 498,834 513,800 529,213 545,090 561,443
Per UnitPer Yr
ExpensesProperty Management Fee 500 20,000 20,800 21,632 22,497 23,397 24,333 25,306 26,319 27,371 28,466Asset Management Fee 400 16,000 16,640 17,306 17,998 18,718 19,466 20,245 21,055 21,897 22,773Maintenance & Repairs 800 32,000 33,280 34,611 35,996 37,435 38,933 40,490 42,110 43,794 45,546Electricity 200 8,000 8,320 8,653 8,999 9,359 9,733 10,123 10,527 10,949 11,386Water & Sewer 100 4,000 4,160 4,326 4,499 4,679 4,867 5,061 5,264 5,474 5,693Fuel & Gas 150 6,000 6,240 6,490 6,749 7,019 7,300 7,592 7,896 8,211 8,540Taxes/PILOT 100 4,000 4,160 4,326 4,499 4,679 4,867 5,061 5,264 5,474 5,693Insurance 400 16,000 16,640 17,306 17,998 18,718 19,466 20,245 21,055 21,897 22,773Other Coho Expenses 250 10,000 10,400 10,816 11,249 11,699 12,167 12,653 13,159 13,686 14,233Replacement Reserves 300 12,000 12,480 12,979 13,498 14,038 14,600 15,184 15,791 16,423 17,080Total Expenses 3,200 128,000 133,120 138,445 143,983 149,742 155,732 161,961 168,439 175,177 182,184
Net Operating Income (NOI) 302,299 310,088 318,059 326,217 334,563 343,103 351,839 360,774 369,913 379,259
Total Rental Debt Service 270,558 270,558 270,558 270,558 270,558 270,558 270,558 270,558 270,558 270,558Rental Debt Service Coverage Ratio 1.12 1.15 1.18 1.21 1.24 1.27 1.30 1.33 1.37 1.40
Cash Flow 31,741 39,530 47,501 55,659 64,005 72,545 81,281 90,216 99,355 108,701
10,000,000 0 10,000,000
750,000250,000
5,800,000 1,500,000
4,200,000 7,500,000

21
A.05 Federal Housing Choice (Section 8) Vouchers
GENERAL DESCRIPTION. Cohousing groups may be able to use the Section 8Vouchers as an income supplement for residents. Generally, voucher-holding tenants pay30% of their income toward rent. The value of the voucher then makes up the differencebetween the tenant’s rent payment and the rent required. Housing vouchers are portable,meaning families can use them to move nearly anywhere in the country where there is afunctioning voucher program.
ELIGIBLE PROJECTS. Cohousing projects that are rental or homeownership may beeligible. Voucher holder housing must meet HUD housing quality standards andlandlords willing to enter into a Housing Assistance Payment (HAP) contract with thelocal public housing authority (PHA).
AFFORDABILITY REQUIREMENTS. Cohousing affordable units must be forresidents at or below 50% of AMI. A PHA must provide 75 percent of its voucher toapplicants whose incomes do not exceed 30 percent of the area median income. Underthe voucher program, the subsidy covers the difference between 30% of the tenant’sincome and the ‘payment standard,’ which is the total rent and utility costs that the PHAwill cover. The PHA has the authority to modify the payment standard to as low as 90%of the Fair Market Rent (FMR) and as high as 110%.
HOW TO APPLY. Cohousing groups should contact your local PHA for moreinformation. For more information seehttp://www.hud.gov/offices/pih/programs/hcv/about/fact_sheet.cfm

A.05 - Federal Housing Choice (Section 8) VouchersAffordable Cohousing Toolkit
House Hold Size 3.0 3.5 4.0 4.5 5.0 Metro Statistical Area Boulder, CO100% Area Median Income 80,200 84,650 89,100 92,650 96,200 Year 2009
50% Area Median Income 40,100 42,325 44,550 46,325 48,100
Unit type 2BR 3BRHouse Hold Size 3 4.5 30% Affordable Rent % of IncomeUtilities Allowance 90 110 30% Affordable Mortgage % of Income
Rental Calculation 2BR 3BR
Market Rent 1,500 2,000 9 9
0-60% AMI Affordable Rent 1,500 2,000 1 110 10
Coho Assoc. Fees 200 300 20 Units420,000 Annual Income
Homeownership Calculation Mortgage Loan Interest Rate 6.00%2BR 3BR Mortgage Loan Amortization Yrs 30
Sales Price 250,000 330,000Closing CostsEscrow
250,000 330,000
20% Down Payment 50,000 66,0001st Mortgage 200,000 264,000Soft 2nd Mortgage Total Soft 2nd Mort
0.071946 Monthly 1st Mortgage Payment 1,199 1,5830.589% Taxes 123 162
Insurance 50 75Ownership Monthly Scenario 1,372 1,820
2BR 3BR
Market Mortgage Payment 1,500 2,000 9 9
0-60% AMI Affordable Mortgage Payment 1,500 2,000 1 110 10
Coho Assoc. Fees 200 300 20 UnitsTotal Sales5,800,000
0

Capital Sources and Uses
Sources UsesTotal Per Unit Total Per Unit
145,000 Ownership Sales 37,500 Acquisition Costs
105,000 Rental 1st Mortgage 7.00% 30 0.0798 1.10 187,500 Hard Costs0 4,782,514 Max Rental 1st 18,750 Soft Costs0 6,250 Financing Costs0 0 Other
250,000 Total Sources Surplus/(GAP) 250,000 Total Uses
Annual Operating Income and Expenses 3.00% Income Trending4.00% Expense Trending
Per UnitPer Mo Yr 1 Yr 2 Yr 3 Yr 4 Yr 5 Yr 6 Yr 7 Yr 8 Yr 9 Yr 10
IncomeRental Income 420,000 432,600 445,578 458,945 472,714 486,895 501,502 516,547 532,043 548,005Coho Assoc. Fees 250 120,000 123,600 127,308 131,127 135,061 139,113 143,286 147,585 152,012 156,573Other 25 12,000 12,360 12,731 13,113 13,506 13,911 14,329 14,758 15,201 15,657(Vacancy) -10% (115) (55,200) (56,856) (58,562) (60,319) (62,128) (63,992) (65,912) (67,889) (69,926) (72,023)Total Income 160 496,800 511,704 527,055 542,867 559,153 575,927 593,205 611,001 629,331 648,211
Per UnitPer Yr
ExpensesProperty Management Fee 500 20,000 20,800 21,632 22,497 23,397 24,333 25,306 26,319 27,371 28,466Asset Management Fee 400 16,000 16,640 17,306 17,998 18,718 19,466 20,245 21,055 21,897 22,773Maintenance & Repairs 800 32,000 33,280 34,611 35,996 37,435 38,933 40,490 42,110 43,794 45,546Electricity 200 8,000 8,320 8,653 8,999 9,359 9,733 10,123 10,527 10,949 11,386Water & Sewer 100 4,000 4,160 4,326 4,499 4,679 4,867 5,061 5,264 5,474 5,693Fuel & Gas 150 6,000 6,240 6,490 6,749 7,019 7,300 7,592 7,896 8,211 8,540Taxes/PILOT 100 4,000 4,160 4,326 4,499 4,679 4,867 5,061 5,264 5,474 5,693Insurance 400 16,000 16,640 17,306 17,998 18,718 19,466 20,245 21,055 21,897 22,773Other Coho Expenses 250 10,000 10,400 10,816 11,249 11,699 12,167 12,653 13,159 13,686 14,233Replacement Reserves 300 12,000 12,480 12,979 13,498 14,038 14,600 15,184 15,791 16,423 17,080Total Expenses 3,200 128,000 133,120 138,445 143,983 149,742 155,732 161,961 168,439 175,177 182,184
Net Operating Income (NOI) 368,800 378,584 388,610 398,884 409,411 420,196 431,244 442,562 454,155 466,027
Total Rental Debt Service 335,312 335,312 335,312 335,312 335,312 335,312 335,312 335,312 335,312 335,312Rental Debt Service Coverage Ratio 1.10 1.13 1.16 1.19 1.22 1.25 1.29 1.32 1.35 1.39
Cash Flow 33,488 43,272 53,298 63,572 74,098 84,883 95,932 107,250 118,842 130,715
10,000,000 0 10,000,000
750,000250,000
5,800,000 1,500,000
4,200,000 7,500,000

24
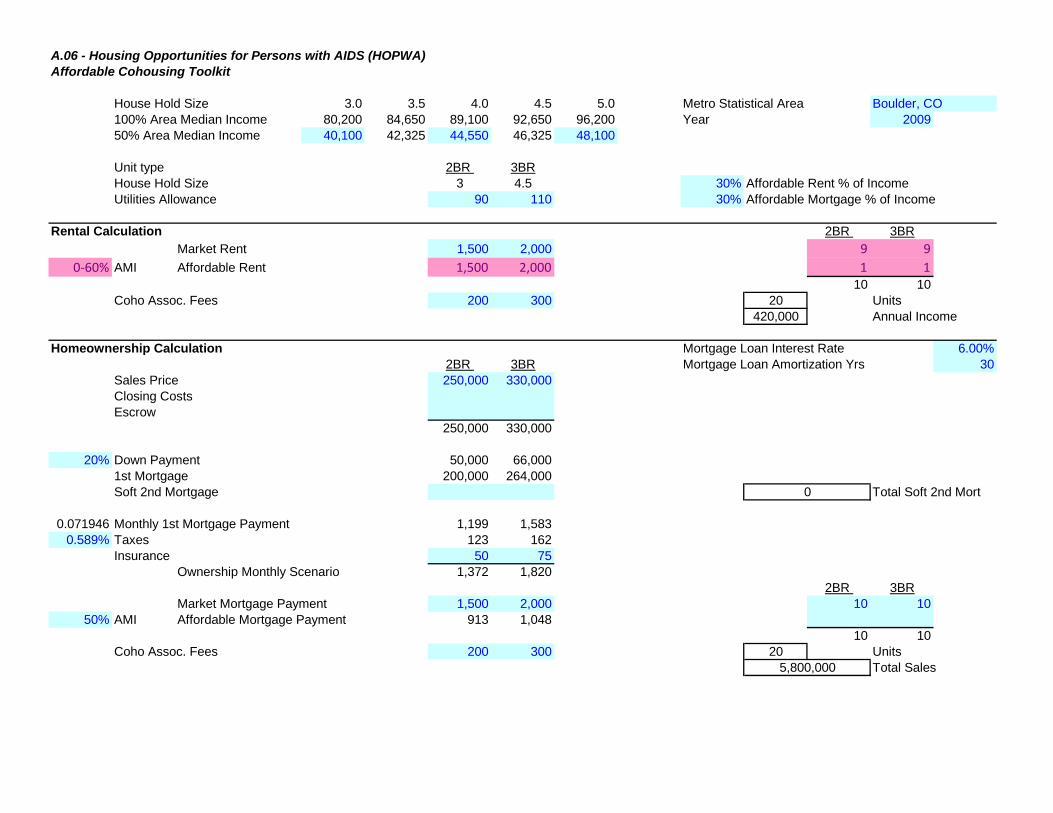
A.06 Housing Opportunities for Persons with AIDS (HOPWA)
GENERAL DESCRIPTION. Cohousing groups may be able to use the HousingOpportunities for Persons with AIDS (HOPWA) program as capital or operating subsidyor income supplement. The HOPWA program provides housing assistance and relatedsupportive services for low income persons living with HIV/AIDS and their families. Theprogram goals are to help create support communities and the development of long-termhousing strategies for persons living with HIV/AIDS that prevent them from becominghomeless.
ELIGIBLE PROJECTS. Cohousing projects that are rental or homeownership may beeligible. In the competitive HOPWA program, states and localities can distribute fundsto projects that provide housing information and referral, housing search assistance,shelter or rental assistance, the development or operation of single room occupancy(SRO) housing and other community-based residences, and technical assistance.HOPWA also provides technical assistance to help support sound management in localprograms as well as develop strategies to address HIV/AIDS housing need.
AFFORDABILITY REQUIREMENTS. Cohousing affordable units must be forresidents at or below 80% of AMI. Eligibility for HOPWA assistance is limited to lowincome individuals with HIV/AIDS and their families. Approximately 91% of the clientsassisted through HOPWA funds have family incomes of less than $1,000 per month.
HOW TO APPLY. Cohousing groups should contact the Office of HIV/AIDS Housing(OHH), which is located in the Office of Community Planning and Development at HUDfor more information. Ninety percent of the funds are distributed as formula grants tostates and localities, which must serve the metropolitan area in which they are located.The formula is based on population size and the number of people living with HIV/AIDSas confirmed by the CDC. The other 10% of HOPWA funds are distributed through acompetitive process to states and localities that do not qualify for a formula allocation orto states, localities or nonprofit organizations that propose projects of nationalsignificance. For more information seehttp://www.hud.gov/offices/cpd/aidshousing/programs/
A.06 - Housing Opportunities for Persons with AIDS (HOPWA)Affordable Cohousing Toolkit
House Hold Size 3.0 3.5 4.0 4.5 5.0 Metro Statistical Area Boulder, CO100% Area Median Income 80,200 84,650 89,100 92,650 96,200 Year 2009
50% Area Median Income 40,100 42,325 44,550 46,325 48,100
Unit type 2BR 3BRHouse Hold Size 3 4.5 30% Affordable Rent % of IncomeUtilities Allowance 90 110 30% Affordable Mortgage % of Income
Rental Calculation 2BR 3BR
Market Rent 1,500 2,000 9 9
0-60% AMI Affordable Rent 1,500 2,000 1 110 10
Coho Assoc. Fees 200 300 20 Units420,000 Annual Income
Homeownership Calculation Mortgage Loan Interest Rate 6.00%2BR 3BR Mortgage Loan Amortization Yrs 30
Sales Price 250,000 330,000Closing CostsEscrow
250,000 330,000
20% Down Payment 50,000 66,0001st Mortgage 200,000 264,000Soft 2nd Mortgage Total Soft 2nd Mort
0.071946 Monthly 1st Mortgage Payment 1,199 1,5830.589% Taxes 123 162
Insurance 50 75Ownership Monthly Scenario 1,372 1,820
2BR 3BRMarket Mortgage Payment 1,500 2,000 10 10
50% AMI Affordable Mortgage Payment 913 1,04810 10
Coho Assoc. Fees 200 300 20 UnitsTotal Sales5,800,000
0

Capital Sources and Uses
Sources UsesTotal Per Unit Total Per Unit
145,000 Ownership Sales 37,500 Acquisition Costs
105,000 Rental 1st Mortgage 7.00% 30 0.0798 1.10 187,500 Hard Costs0 4,782,514 Max Rental 1st 18,750 Soft Costs0 6,250 Financing Costs0 0 Other
250,000 Total Sources Surplus/(GAP) 250,000 Total Uses
Annual Operating Income and Expenses 3.00% Income Trending4.00% Expense Trending
Per UnitPer Mo Yr 1 Yr 2 Yr 3 Yr 4 Yr 5 Yr 6 Yr 7 Yr 8 Yr 9 Yr 10
IncomeRental Income 420,000 432,600 445,578 458,945 472,714 486,895 501,502 516,547 532,043 548,005Coho Assoc. Fees 250 120,000 123,600 127,308 131,127 135,061 139,113 143,286 147,585 152,012 156,573Other 25 12,000 12,360 12,731 13,113 13,506 13,911 14,329 14,758 15,201 15,657(Vacancy) -10% (115) (55,200) (56,856) (58,562) (60,319) (62,128) (63,992) (65,912) (67,889) (69,926) (72,023)Total Income 160 496,800 511,704 527,055 542,867 559,153 575,927 593,205 611,001 629,331 648,211
Per UnitPer Yr
ExpensesProperty Management Fee 500 20,000 20,800 21,632 22,497 23,397 24,333 25,306 26,319 27,371 28,466Asset Management Fee 400 16,000 16,640 17,306 17,998 18,718 19,466 20,245 21,055 21,897 22,773Maintenance & Repairs 800 32,000 33,280 34,611 35,996 37,435 38,933 40,490 42,110 43,794 45,546Electricity 200 8,000 8,320 8,653 8,999 9,359 9,733 10,123 10,527 10,949 11,386Water & Sewer 100 4,000 4,160 4,326 4,499 4,679 4,867 5,061 5,264 5,474 5,693Fuel & Gas 150 6,000 6,240 6,490 6,749 7,019 7,300 7,592 7,896 8,211 8,540Taxes/PILOT 100 4,000 4,160 4,326 4,499 4,679 4,867 5,061 5,264 5,474 5,693Insurance 400 16,000 16,640 17,306 17,998 18,718 19,466 20,245 21,055 21,897 22,773Other Coho Expenses 250 10,000 10,400 10,816 11,249 11,699 12,167 12,653 13,159 13,686 14,233Replacement Reserves 300 12,000 12,480 12,979 13,498 14,038 14,600 15,184 15,791 16,423 17,080Total Expenses 3,200 128,000 133,120 138,445 143,983 149,742 155,732 161,961 168,439 175,177 182,184
Net Operating Income (NOI) 368,800 378,584 388,610 398,884 409,411 420,196 431,244 442,562 454,155 466,027
Total Rental Debt Service 335,312 335,312 335,312 335,312 335,312 335,312 335,312 335,312 335,312 335,312Rental Debt Service Coverage Ratio 1.10 1.13 1.16 1.19 1.22 1.25 1.29 1.32 1.35 1.39
Cash Flow 33,488 43,272 53,298 63,572 74,098 84,883 95,932 107,250 118,842 130,715
10,000,000 0 10,000,000
750,000250,000
5,800,000 1,500,000
4,200,000 7,500,000

27
A.07 Low Income Home Energy Assistance Program (LIHEAP)
GENERAL DESCRIPTION. Cohousing groups may be able to use the Low IncomeHome Energy Assistance Program (LIHEAP) as a resident income supplement. Theregular LIHEAP is a federal block grant program to the states to help low incomefamilies meet the costs of heating and cooling their homes. LIHEAP is intended to assistlow income households in meeting their home energy needs. LIHEAP grants are used toprovide bill payment assistance to eligible low income households to help with heatingand cooling costs.
ELIGIBLE PROJECTS. Cohousing projects that are rental or homeownership may beeligible. The LIHEAP program focuses on ‘home energy’ which is defined as a source ofheating or cooling in residential dwellings. LIHEAP subsidizes the cost of residentialheating or cooling fuels, including a range of fuels from natural gas and electricity (forheating or cooling) to home heating oil, propane, kerosene and wood. It provides avendor payment, a two-party check, or direct assistance to the LIHEAP householdswhose heat is covered in the rent. States may use up to 15% of their annual LIHEAPblock grant for low-cost residential weatherization or other home-energy related repair.States can also use up to 5% of their block grant to provide services to encourage andenable households to reduce their home energy needs through activities such as needsassessments, counseling, and assistance with energy vendors.
AFFORDABILITY REQUIREMENTS. Cohousing affordable units must be forresidents at or below 60-75% of the statewide AMI. States are to target assistance to lowincome households with the lowest income and highest energy needs (i.e., those who paya large percentage of their income on home energy) and households with populationsvulnerable to extreme heat or cold, such as households with very young children,individuals with disabilities and/or frail elderly.
HOW TO APPLY. Cohousing groups should contact the local state LIHEAP grantee formore information. For more information see
www.acf.hhs.gov/programs/ocs/liheap/grantees/states.html
www.liheap.ncat.org/

A.07 - Low Income Home Energy Assistance Program (LIHEAP)Affordable Cohousing Toolkit
House Hold Size 3.0 3.5 4.0 4.5 5.0 Metro Statistical Area Boulder, CO100% Area Median Income 80,200 84,650 89,100 92,650 96,200 Year 2009
50% Area Median Income 40,100 42,325 44,550 46,325 48,100
Unit type 2BR 3BRHouse Hold Size 3 4.5 30% Affordable Rent % of Income
Utilities Allowance 0 0 30% Affordable Mortgage % of Income
Rental Calculation 2BR 3BR
Market Rent 1,500 2,000 9 9
60% AMI Affordable Rent 1,500 2,000 1 110 10
Coho Assoc. Fees 200 300 20 Units420,000 Annual Income
Homeownership Calculation Mortgage Loan Interest Rate 6.00%2BR 3BR Mortgage Loan Amortization Yrs 30
Sales Price 250,000 330,000Closing CostsEscrow
250,000 330,000
20% Down Payment 50,000 66,0001st Mortgage 200,000 264,000Soft 2nd Mortgage Total Soft 2nd Mort
0.071946 Monthly 1st Mortgage Payment 1,199 1,5830.589% Taxes 123 162
Insurance 50 75Ownership Monthly Scenario 1,372 1,820
2BR 3BRMarket Mortgage Payment 1,500 2,000 10 10
50% AMI Affordable Mortgage Payment 1,003 1,15810 10
Coho Assoc. Fees 200 300 20 UnitsTotal Sales5,800,000
0

Capital Sources and Uses
Sources UsesTotal Per Unit Total Per Unit
145,000 Ownership Sales 37,500 Acquisition Costs
105,000 Rental 1st Mortgage 7.00% 30 0.0798 1.10 187,500 Hard Costs0 4,782,514 Max Rental 1st 18,750 Soft Costs0 6,250 Financing Costs0 0 Other
250,000 Total Sources Surplus/(GAP) 250,000 Total Uses
Annual Operating Income and Expenses 3.00% Income Trending4.00% Expense Trending
Per UnitPer Mo Yr 1 Yr 2 Yr 3 Yr 4 Yr 5 Yr 6 Yr 7 Yr 8 Yr 9 Yr 10
IncomeRental Income 420,000 432,600 445,578 458,945 472,714 486,895 501,502 516,547 532,043 548,005Coho Assoc. Fees 250 120,000 123,600 127,308 131,127 135,061 139,113 143,286 147,585 152,012 156,573Other 25 12,000 12,360 12,731 13,113 13,506 13,911 14,329 14,758 15,201 15,657(Vacancy) -10% (115) (55,200) (56,856) (58,562) (60,319) (62,128) (63,992) (65,912) (67,889) (69,926) (72,023)Total Income 160 496,800 511,704 527,055 542,867 559,153 575,927 593,205 611,001 629,331 648,211
Per UnitPer Yr
ExpensesProperty Management Fee 500 20,000 20,800 21,632 22,497 23,397 24,333 25,306 26,319 27,371 28,466Asset Management Fee 400 16,000 16,640 17,306 17,998 18,718 19,466 20,245 21,055 21,897 22,773Maintenance & Repairs 800 32,000 33,280 34,611 35,996 37,435 38,933 40,490 42,110 43,794 45,546Electricity 200 8,000 8,320 8,653 8,999 9,359 9,733 10,123 10,527 10,949 11,386Water & Sewer 100 4,000 4,160 4,326 4,499 4,679 4,867 5,061 5,264 5,474 5,693Fuel & Gas 150 6,000 6,240 6,490 6,749 7,019 7,300 7,592 7,896 8,211 8,540Taxes/PILOT 100 4,000 4,160 4,326 4,499 4,679 4,867 5,061 5,264 5,474 5,693Insurance 400 16,000 16,640 17,306 17,998 18,718 19,466 20,245 21,055 21,897 22,773Other Coho Expenses 250 10,000 10,400 10,816 11,249 11,699 12,167 12,653 13,159 13,686 14,233Replacement Reserves 300 12,000 12,480 12,979 13,498 14,038 14,600 15,184 15,791 16,423 17,080Total Expenses 3,200 128,000 133,120 138,445 143,983 149,742 155,732 161,961 168,439 175,177 182,184
Net Operating Income (NOI) 368,800 378,584 388,610 398,884 409,411 420,196 431,244 442,562 454,155 466,027
Total Rental Debt Service 335,312 335,312 335,312 335,312 335,312 335,312 335,312 335,312 335,312 335,312Rental Debt Service Coverage Ratio 1.10 1.13 1.16 1.19 1.22 1.25 1.29 1.32 1.35 1.39
Cash Flow 33,488 43,272 53,298 63,572 74,098 84,883 95,932 107,250 118,842 130,715
10,000,000 0 10,000,000
750,000250,000
5,800,000 1,500,000
4,200,000 7,500,000

30
A.08 Neighborhood Stabilization Program (NSP)
GENERAL DESCRIPTION. Cohousing groups may be able to use the NeighborhoodStabilization Program (NSP) as capital subsidy or low-cost financing. The NSP providesgovernment funds to acquire and redevelop foreclosed properties that might otherwisebecome sources of abandonment and blight within their communities.
ELIGIBLE PROJECTS. Cohousing projects that are rental or homeownership may beeligible. The eligible activities include establishing financing mechanisms for thepurchase and redevelopment of foreclosed homes and residential properties, purchasingand rehabilitating homes and residential properties that have been abandoned orforeclosed, establishing land banks for homes that have been foreclosed, demolishingblighted structures, and redeveloping demolished or vacant properties.
AFFORDABILITY REQUIREMENTS. Cohousing affordable units must be forresidents at or below 120% of AMI. All of the funds made available must be used withrespect to individuals and families whose incomes do not exceed 120% of area medianincome. Not less than 25% of these funds are to be used for the purchase andredevelopment of abandoned or foreclosed upon homes or residential properties that willbe used to house individuals or families whose incomes do not exceed 50% of areamedian income.
HOW TO APPLY. Cohousing groups should contact the local NSP grantee governmentagency for more information. NSP Formula Grant formula is based on the number andpercentage of home foreclosures in each state or unit of general local government, thenumber and percentage of homes financed by a subprime mortgages in those areas, andthe number and percentage of homes in default or delinquency in those areas. For moreinformation see
http://www.hud.gov/offices/cpd/communitydevelopment/programs/neighborhoodspg/nspfaq.cfm
www.hud.gov/nsp

A.08 - Neighborhood Stabilization Program (NSP)Affordable Cohousing Toolkit
House Hold Size 3.0 3.5 4.0 4.5 5.0 Metro Statistical Area Boulder, CO100% Area Median Income 80,200 84,650 89,100 92,650 96,200 Year 2009
50% Area Median Income 40,100 42,325 44,550 46,325 48,100
Unit type 2BR 3BRHouse Hold Size 3 4.5 30% Affordable Rent % of IncomeUtilities Allowance 90 110 30% Affordable Mortgage % of Income
Rental Calculation 2BR 3BR
Market Rent 1,500 2,000 7 7
60% AMI Affordable Rent 1,113 1,280 3 310 10
Coho Assoc. Fees 200 300 20 Units
380,139 Annual Income
Homeownership Calculation Mortgage Loan Interest Rate 6.00%2BR 3BR Mortgage Loan Amortization Yrs 30
Sales Price 235,000 265,000Closing CostsEscrow
235,000 265,000
20% Down Payment 47,000 53,0001st Mortgage 188,000 212,000Soft 2nd Mortgage Total Soft 2nd Mort
0.071946 Monthly 1st Mortgage Payment 1,127 1,2710.589% Taxes 115 130
Insurance 50 75Ownership Monthly Scenario 1,293 1,476
2BR 3BR
Market Mortgage Payment 1,500 2,000 5 5
70% AMI Affordable Mortgage Payment 1,314 1,511 5 510 10
Coho Assoc. Fees 200 300 20 Units
Total Sales5,000,000
0
Capital Sources and Uses
Sources UsesTotal Per Unit Total Per Unit
125,000 Ownership Sales 37,500 Acquisition Costs
90,000 Rental 1st Mortgage 7.00% 30 0.0798 1.10 187,500 Hard Costs
35,000 NSP Grant 4,328,619 Max Rental 1st 18,750 Soft Costs
0 6,250 Financing Costs0 0 Other
250,000 Total Sources Surplus/(GAP) 250,000 Total Uses
Annual Operating Income and Expenses 3.00% Income Trending4.00% Expense Trending
Per UnitPer Mo Yr 1 Yr 2 Yr 3 Yr 4 Yr 5 Yr 6 Yr 7 Yr 8 Yr 9 Yr 10
IncomeRental Income 380,139 391,543 403,289 415,388 427,850 440,685 453,906 467,523 481,549 495,995Coho Assoc. Fees 250 120,000 123,600 127,308 131,127 135,061 139,113 143,286 147,585 152,012 156,573Other 25 12,000 12,360 12,731 13,113 13,506 13,911 14,329 14,758 15,201 15,657(Vacancy) -10% (107) (51,214) (52,750) (54,333) (55,963) (57,642) (59,371) (61,152) (62,987) (64,876) (66,823)Total Income 168 460,925 474,753 488,995 503,665 518,775 534,339 550,369 566,880 583,886 601,403
Per UnitPer Yr
ExpensesProperty Management Fee 500 20,000 20,800 21,632 22,497 23,397 24,333 25,306 26,319 27,371 28,466Asset Management Fee 400 16,000 16,640 17,306 17,998 18,718 19,466 20,245 21,055 21,897 22,773Maintenance & Repairs 800 32,000 33,280 34,611 35,996 37,435 38,933 40,490 42,110 43,794 45,546Electricity 200 8,000 8,320 8,653 8,999 9,359 9,733 10,123 10,527 10,949 11,386Water & Sewer 100 4,000 4,160 4,326 4,499 4,679 4,867 5,061 5,264 5,474 5,693Fuel & Gas 150 6,000 6,240 6,490 6,749 7,019 7,300 7,592 7,896 8,211 8,540Taxes/PILOT 100 4,000 4,160 4,326 4,499 4,679 4,867 5,061 5,264 5,474 5,693Insurance 400 16,000 16,640 17,306 17,998 18,718 19,466 20,245 21,055 21,897 22,773Other Coho Expenses 250 10,000 10,400 10,816 11,249 11,699 12,167 12,653 13,159 13,686 14,233Replacement Reserves 300 12,000 12,480 12,979 13,498 14,038 14,600 15,184 15,791 16,423 17,080Total Expenses 3,200 128,000 133,120 138,445 143,983 149,742 155,732 161,961 168,439 175,177 182,184
Net Operating Income (NOI) 332,925 341,633 350,551 359,683 369,033 378,607 388,408 398,440 408,709 419,219
Total Rental Debt Service 287,411 287,411 287,411 287,411 287,411 287,411 287,411 287,411 287,411 287,411Rental Debt Service Coverage Ratio 1.16 1.19 1.22 1.25 1.28 1.32 1.35 1.39 1.42 1.46
Cash Flow 45,514 54,222 63,140 72,272 81,623 91,196 100,997 111,030 121,299 131,808
10,000,000 0 10,000,000
1,400,000 750,000
250,000
5,000,000 1,500,000
3,600,000 7,500,000

33
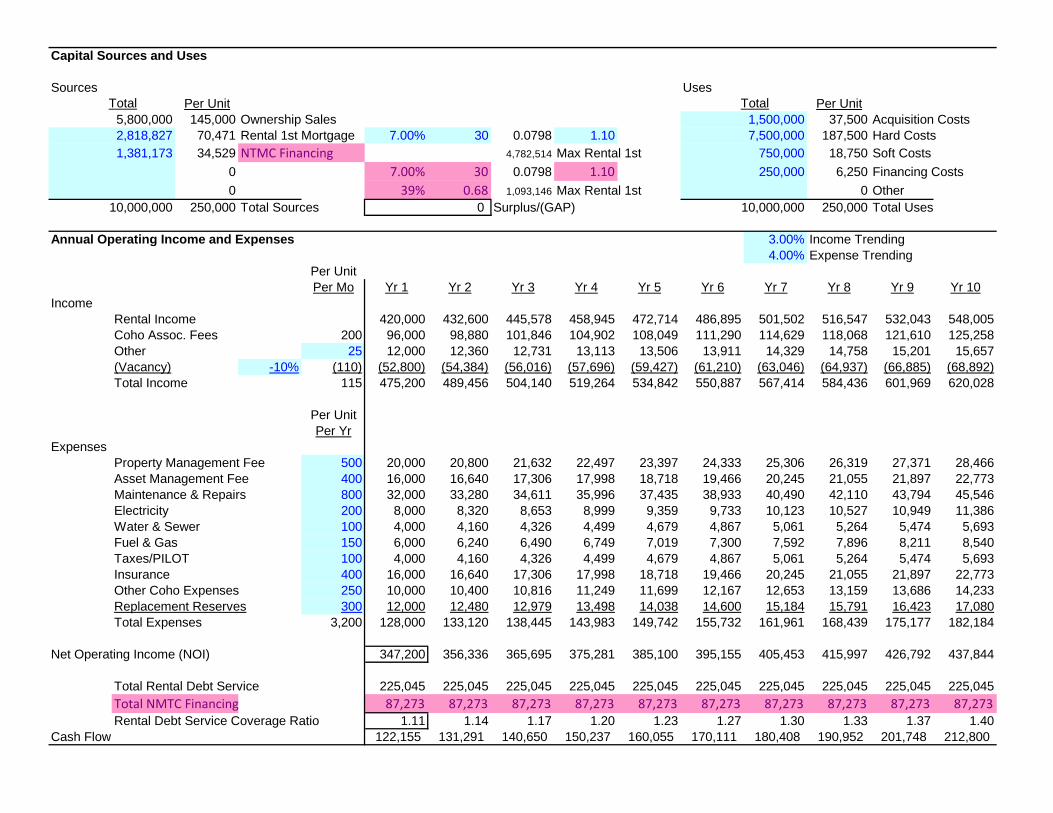
A.09 New Markets Tax Credit (NMTC)
GENERAL DESCRIPTION. Cohousing groups may be able to use the New MarketsTax Credit (NMTC) as a capital subsidy. The NMTC Program encourages businessinvestment and promotes economic and community development in low incomecommunities by offering a seven year, 39% federal income tax credit for Qualified EquityInvestment (QEI) made through investment vehicles known as Community DevelopmentEntities (CDE). CDEs use capital derived from the tax credits to make loans to orinvestments in businesses and projects in low income communities.
ELIGIBLE PROJECTS. Cohousing projects that include commercial or common housespace may be eligible. NMTC may not be used for residential projects. Cohousingcommunities may be able to utilize CDE financing for community buildings andassociated commercial property.
AFFORDABILITY REQUIREMENTS. Cohousing projects must be located in qualifiedlow-income census tracts.
HOW TO APPLY. Cohousing groups should contact the local CDFI NMTC allocatee formore information. The NMTC is administered by the Community DevelopmentFinancial Institutions Fund (CDFI Fund) within the U.S. Department of the Treasury.For more information seehttp://www.cdfifund.gov/what_we_do/programs_id.asp?programID=5

A.09 - New Markets Tax Credit (NMTC)Affordable Cohousing Toolkit
House Hold Size 3.0 3.5 4.0 4.5 5.0 Metro Statistical Area Boulder, CO100% Area Median Income 80,200 84,650 89,100 92,650 96,200 Year 2009
50% Area Median Income 40,100 42,325 44,550 46,325 48,100
Unit type 2BR 3BRHouse Hold Size 3 4.5 30% Affordable Rent % of IncomeUtilities Allowance 90 110 30% Affordable Mortgage % of Income
Rental Calculation 2BR 3BRMarket Rent 1,500 2,000 10 10
50% AMI Affordable Rent 913 1,04810 10
Coho Assoc. Fees 150 250 20 Units
420,000 Annual Income
Homeownership Calculation Mortgage Loan Interest Rate 6.00%2BR 3BR Mortgage Loan Amortization Yrs 30
Sales Price 250,000 330,000Closing CostsEscrow
250,000 330,000
20% Down Payment 50,000 66,0001st Mortgage 200,000 264,000Soft 2nd Mortgage Total Soft 2nd Mort
0.071946 Monthly 1st Mortgage Payment 1,199 1,5830.589% Taxes 123 162
Insurance 50 75Ownership Monthly Scenario 1,372 1,820
2BR 3BRMarket Mortgage Payment 1,500 2,000 10 10
50% AMI Affordable Mortgage Payment 913 1,04810 10
Coho Assoc. Fees 150 250 20 Units
Total Sales5,800,000
0
Capital Sources and Uses
Sources UsesTotal Per Unit Total Per Unit
145,000 Ownership Sales 37,500 Acquisition Costs
70,471 Rental 1st Mortgage 7.00% 30 0.0798 1.10 187,500 Hard Costs
34,529 NTMC Financing 4,782,514 Max Rental 1st 18,750 Soft Costs
0 7.00% 30 0.0798 1.10 6,250 Financing Costs
0 39% 0.68 1,093,146 Max Rental 1st 0 Other
250,000 Total Sources Surplus/(GAP) 250,000 Total Uses
Annual Operating Income and Expenses 3.00% Income Trending4.00% Expense Trending
Per UnitPer Mo Yr 1 Yr 2 Yr 3 Yr 4 Yr 5 Yr 6 Yr 7 Yr 8 Yr 9 Yr 10
IncomeRental Income 420,000 432,600 445,578 458,945 472,714 486,895 501,502 516,547 532,043 548,005Coho Assoc. Fees 200 96,000 98,880 101,846 104,902 108,049 111,290 114,629 118,068 121,610 125,258Other 25 12,000 12,360 12,731 13,113 13,506 13,911 14,329 14,758 15,201 15,657(Vacancy) -10% (110) (52,800) (54,384) (56,016) (57,696) (59,427) (61,210) (63,046) (64,937) (66,885) (68,892)Total Income 115 475,200 489,456 504,140 519,264 534,842 550,887 567,414 584,436 601,969 620,028
Per UnitPer Yr
ExpensesProperty Management Fee 500 20,000 20,800 21,632 22,497 23,397 24,333 25,306 26,319 27,371 28,466Asset Management Fee 400 16,000 16,640 17,306 17,998 18,718 19,466 20,245 21,055 21,897 22,773Maintenance & Repairs 800 32,000 33,280 34,611 35,996 37,435 38,933 40,490 42,110 43,794 45,546Electricity 200 8,000 8,320 8,653 8,999 9,359 9,733 10,123 10,527 10,949 11,386Water & Sewer 100 4,000 4,160 4,326 4,499 4,679 4,867 5,061 5,264 5,474 5,693Fuel & Gas 150 6,000 6,240 6,490 6,749 7,019 7,300 7,592 7,896 8,211 8,540Taxes/PILOT 100 4,000 4,160 4,326 4,499 4,679 4,867 5,061 5,264 5,474 5,693Insurance 400 16,000 16,640 17,306 17,998 18,718 19,466 20,245 21,055 21,897 22,773Other Coho Expenses 250 10,000 10,400 10,816 11,249 11,699 12,167 12,653 13,159 13,686 14,233Replacement Reserves 300 12,000 12,480 12,979 13,498 14,038 14,600 15,184 15,791 16,423 17,080Total Expenses 3,200 128,000 133,120 138,445 143,983 149,742 155,732 161,961 168,439 175,177 182,184
Net Operating Income (NOI) 347,200 356,336 365,695 375,281 385,100 395,155 405,453 415,997 426,792 437,844
Total Rental Debt Service 225,045 225,045 225,045 225,045 225,045 225,045 225,045 225,045 225,045 225,045
Total NMTC Financing 87,273 87,273 87,273 87,273 87,273 87,273 87,273 87,273 87,273 87,273Rental Debt Service Coverage Ratio 1.11 1.14 1.17 1.20 1.23 1.27 1.30 1.33 1.37 1.40
Cash Flow 122,155 131,291 140,650 150,237 160,055 170,111 180,408 190,952 201,748 212,800
10,000,000 0 10,000,000
1,381,173 750,000
250,000
5,800,000 1,500,000
2,818,827 7,500,000

36
A.10 Project-Based Rental Assistance (PB Section 8)
GENERAL DESCRIPTION. Cohousing groups may be able to use project-based Section8 as an operating subsidy. Project-based vouchers are a component of public housingagencies (PHAs) Section 8 housing choice voucher program. The PHA voucherassistance is tied to specific housing units if the owner agrees to construct the affordableunits or set-aside a portion of the units in an existing development.
ELIGIBLE PROJECTS. Cohousing projects that are homeownership or rental may beeligible. Owners are required to make the units available to low and moderate incomehouseholds at HUD-approved rents throughout the mortgage or Section 8 contract term.Rehabilitated units must require at least $1,000 of rehabilitation per unit to be subsidized,and all units must meet HUD housing quality standards.
AFFORDABILITY REQUIREMENTS. Cohousing affordable units must be forresidents at or below 30-50% of AMI. Some developments may give preference inselection to households where one or more members have a special need or meet otheradditional selection criteria.
HOW TO APPLY. Cohousing groups should contact the local PHA for moreinformation. For more information seehttp://www.hud.gov/offices/pih/programs/hcv/project.cfm

A.10 - Project-Based Rental Assistance (PB Section 8)Affordable Cohousing Toolkit
House Hold Size 3.0 3.5 4.0 4.5 5.0 Metro Statistical Area Boulder, CO100% Area Median Income 80,200 84,650 89,100 92,650 96,200 Year 2009
50% Area Median Income 40,100 42,325 44,550 46,325 48,100
Unit type 2BR 3BRHouse Hold Size 3 4.5 30% Affordable Rent % of IncomeUtilities Allowance 90 110 30% Affordable Mortgage % of Income
Rental Calculation 2BR 3BR
Market Rent 1,500 2,000 5 5
60% AMI Affordable Rent 1,113 1,280 5 510 10
Coho Assoc. Fees 200 300 20 Units
353,565 Annual Income
Homeownership Calculation Mortgage Loan Interest Rate 6.00%2BR 3BR Mortgage Loan Amortization Yrs 30
Sales Price 250,000 330,000Closing CostsEscrow
250,000 330,000
20% Down Payment 50,000 66,0001st Mortgage 200,000 264,000Soft 2nd Mortgage Total Soft 2nd Mort
0.071946 Monthly 1st Mortgage Payment 1,199 1,5830.589% Taxes 123 162
Insurance 50 75Ownership Monthly Scenario 1,372 1,820
2BR 3BRMarket Mortgage Payment 1,500 2,000 10 10
50% AMI Affordable Mortgage Payment 913 1,04810 10
Coho Assoc. Fees 200 300 20 UnitsTotal Sales5,800,000
0

Capital Sources and Uses
Sources UsesTotal Per Unit Total Per Unit
145,000 Ownership Sales 37,500 Acquisition Costs
105,000 Rental 1st Mortgage 7.00% 30 0.0798 1.10 187,500 Hard Costs0 4,026,022 Max Rental 1st 18,750 Soft Costs0 6,250 Financing Costs0 0 Other
250,000 Total Sources Surplus/(GAP) 250,000 Total Uses
Annual Operating Income and Expenses 3.00% Income Trending4.00% Expense Trending
Per UnitPer Mo Yr 1 Yr 2 Yr 3 Yr 4 Yr 5 Yr 6 Yr 7 Yr 8 Yr 9 Yr 10
IncomeRental Income 353,565 364,172 375,097 386,350 397,941 409,879 422,175 434,840 447,886 461,322Coho Assoc. Fees 250 120,000 123,600 127,308 131,127 135,061 139,113 143,286 147,585 152,012 156,573
Project Based Section 8 200 96,000 98,880 101,846 104,902 108,049 111,290 114,629 118,068 121,610 125,258Other 25 12,000 12,360 12,731 13,113 13,506 13,911 14,329 14,758 15,201 15,657(Vacancy) -10% (121) (58,157) (59,901) (61,698) (63,549) (65,456) (67,419) (69,442) (71,525) (73,671) (75,881)Total Income 354 523,409 539,111 555,284 571,943 589,101 606,774 624,977 643,726 663,038 682,929
Per UnitPer Yr
Expenses 500Property Management Fee 400 16,000 16,640 17,306 17,998 18,718 19,466 20,245 21,055 21,897 22,773Asset Management Fee 200 8,000 8,320 8,653 8,999 9,359 9,733 10,123 10,527 10,949 11,386Maintenance & Repairs 800 32,000 33,280 34,611 35,996 37,435 38,933 40,490 42,110 43,794 45,546Electricity 200 8,000 8,320 8,653 8,999 9,359 9,733 10,123 10,527 10,949 11,386Water & Sewer 100 4,000 4,160 4,326 4,499 4,679 4,867 5,061 5,264 5,474 5,693Fuel & Gas 150 6,000 6,240 6,490 6,749 7,019 7,300 7,592 7,896 8,211 8,540Taxes/PILOT 400 16,000 16,640 17,306 17,998 18,718 19,466 20,245 21,055 21,897 22,773Insurance 500 20,000 20,800 21,632 22,497 23,397 24,333 25,306 26,319 27,371 28,466Other Coho Expenses 250 10,000 10,400 10,816 11,249 11,699 12,167 12,653 13,159 13,686 14,233Replacement Reserves 300 12,000 12,480 12,979 13,498 14,038 14,600 15,184 15,791 16,423 17,080Total Expenses 3,300 132,000 137,280 142,771 148,482 154,421 160,598 167,022 173,703 180,651 187,877
Net Operating Income (NOI) 391,409 401,831 412,513 423,461 434,680 446,176 457,955 470,023 482,387 495,052
Total Rental Debt Service 335,312 335,312 335,312 335,312 335,312 335,312 335,312 335,312 335,312 335,312Rental Debt Service Coverage Ratio 1.17 1.20 1.23 1.26 1.30 1.33 1.37 1.40 1.44 1.48
Cash Flow 56,096 66,518 77,200 88,148 99,367 110,863 122,643 134,711 147,075 159,740
10,000,000 0 10,000,000
750,000250,000
5,800,000 1,500,000
4,200,000 7,500,000

39
A.11 Rural Housing And Economic Development (RHED)
GENERAL DESCRIPTION. Cohousing groups may be able to use the Rural HousingAnd Economic Development (RHED) program as a capital subsidy. RHED is acompetitive grant program to support housing and economic development of ruralcommunities. RHED funds are used to support capacity-building activities or programsthat will result in complementary affordable housing and economic development projects.Residents of economically distressed rural communities receive the benefits of the RHEDprogram.
ELIGIBLE PROJECTS. Cohousing projects that are rental or homeownership may beeligible. HUD defines rural in three ways: A place having fewer than 2,500 inhabitants;A county or parish with an urban population of 20,000 inhabitants or less; and Any placewith a population not in excess of 20,000 inhabitants and not located in a MetropolitanStatistical Area. RHED also provides funding for the Support for Innovative Housing andEconomic Development Activities, which cover the costs of the preparation of plans,architectural drawings, provision of infrastructure, purchase of materials, construction,use of local labor markets, job training and the acquisition of land and buildingdemolition. Projects must provide integrated housing and economic developmentactivities.
AFFORDABILITY REQUIREMENTS. Cohousing affordable units must be forresidents at or below 50-80% of AMI.
HOW TO APPLY. Cohousing groups should contact Office of Rural Housing andEconomic Development (ORHED) for more information. The RHED allocation is basedon community need, measured by poverty and unemployment rates, and the level ofsubstandard housing or housing affordability issues. The ORHED is administered byHUD’s Community Planning and Development office in consultation with the U.S.Department of Agriculture (USDA). For more information seewww.hud.gov/offices/cpd/economicdevelopment/programs/rhed/
www.ruralhome.org
www.hud.gov/offices/cpd/economicdevelopment/programs/rhed/gateway/

A.11 - Rural Housing And Economic Development (RHED)Affordable Cohousing Toolkit
House Hold Size 3.0 3.5 4.0 4.5 5.0 Metro Statistical Area Boulder, CO100% Area Median Income 80,200 84,650 89,100 92,650 96,200 Year 2009
50% Area Median Income 40,100 42,325 44,550 46,325 48,100
Unit type 2BR 3BRHouse Hold Size 3 4.5 30% Affordable Rent % of IncomeUtilities Allowance 90 110 30% Affordable Mortgage % of Income
Rental Calculation 2BR 3BR
Market Rent 1,500 2,000 7 7
60% AMI Affordable Rent 1,113 1,280 3 310 10
Coho Assoc. Fees 200 300 20 Units
380,139 Annual Income
Homeownership Calculation Mortgage Loan Interest Rate 6.00%2BR 3BR Mortgage Loan Amortization Yrs 30
Sales Price 250,000 330,000Closing CostsEscrow
250,000 330,000
20% Down Payment 50,000 66,0001st Mortgage 200,000 264,000Soft 2nd Mortgage Total Soft 2nd Mort
0.071946 Monthly 1st Mortgage Payment 1,199 1,5830.589% Taxes 123 162
Insurance 50 75Ownership Monthly Scenario 1,372 1,820
2BR 3BRMarket Mortgage Payment 1,500 2,000 10 10
50% AMI Affordable Mortgage Payment 913 1,04810 10
Coho Assoc. Fees 200 300 20 UnitsTotal Sales5,800,000
0

Capital Sources and Uses
Sources UsesTotal Per Unit Total Per Unit
145,000 Ownership Sales 37,500 Acquisition Costs
92,500 Rental 1st Mortgage 7.00% 30 0.0798 1.10 187,500 Hard Costs
12,500 RHED Grant 4,328,619 Max Rental 1st 18,750 Soft Costs
0 6,250 Financing Costs0 0 Other
250,000 Total Sources Surplus/(GAP) 250,000 Total Uses
Annual Operating Income and Expenses 3.00% Income Trending4.00% Expense Trending
Per UnitPer Mo Yr 1 Yr 2 Yr 3 Yr 4 Yr 5 Yr 6 Yr 7 Yr 8 Yr 9 Yr 10
IncomeRental Income 380,139 391,543 403,289 415,388 427,850 440,685 453,906 467,523 481,549 495,995Coho Assoc. Fees 250 120,000 123,600 127,308 131,127 135,061 139,113 143,286 147,585 152,012 156,573Other 25 12,000 12,360 12,731 13,113 13,506 13,911 14,329 14,758 15,201 15,657(Vacancy) -10% (107) (51,214) (52,750) (54,333) (55,963) (57,642) (59,371) (61,152) (62,987) (64,876) (66,823)Total Income 168 460,925 474,753 488,995 503,665 518,775 534,339 550,369 566,880 583,886 601,403
Per UnitPer Yr
ExpensesProperty Management Fee 500 20,000 20,800 21,632 22,497 23,397 24,333 25,306 26,319 27,371 28,466Asset Management Fee 400 16,000 16,640 17,306 17,998 18,718 19,466 20,245 21,055 21,897 22,773Maintenance & Repairs 800 32,000 33,280 34,611 35,996 37,435 38,933 40,490 42,110 43,794 45,546Electricity 200 8,000 8,320 8,653 8,999 9,359 9,733 10,123 10,527 10,949 11,386Water & Sewer 100 4,000 4,160 4,326 4,499 4,679 4,867 5,061 5,264 5,474 5,693Fuel & Gas 150 6,000 6,240 6,490 6,749 7,019 7,300 7,592 7,896 8,211 8,540Taxes/PILOT 100 4,000 4,160 4,326 4,499 4,679 4,867 5,061 5,264 5,474 5,693Insurance 400 16,000 16,640 17,306 17,998 18,718 19,466 20,245 21,055 21,897 22,773Other Coho Expenses 250 10,000 10,400 10,816 11,249 11,699 12,167 12,653 13,159 13,686 14,233Replacement Reserves 300 12,000 12,480 12,979 13,498 14,038 14,600 15,184 15,791 16,423 17,080Total Expenses 3,200 128,000 133,120 138,445 143,983 149,742 155,732 161,961 168,439 175,177 182,184
Net Operating Income (NOI) 332,925 341,633 350,551 359,683 369,033 378,607 388,408 398,440 408,709 419,219
Total Rental Debt Service 295,394 295,394 295,394 295,394 295,394 295,394 295,394 295,394 295,394 295,394Rental Debt Service Coverage Ratio 1.13 1.16 1.19 1.22 1.25 1.28 1.31 1.35 1.38 1.42
Cash Flow 37,531 46,239 55,156 64,288 73,639 83,213 93,014 103,046 113,315 123,824
10,000,000 0 10,000,000
500,000 750,000
250,000
5,800,000 1,500,000
3,700,000 7,500,000

42
A.12 Section 202 Supportive Housing for the Elderly
GENERAL DESCRIPTION. Cohousing groups may be able to use the Section 202Supportive Housing for the Elderly (Section 202) program as capital or operatingsubsidy. The Section program provides funds to nonprofit organizations that develop andoperate housing for seniors with very low incomes. The Section 202 program has twomain components, a capital advance that covers expenses related to housing construction,and operating assistance that supports ongoing operating costs.
ELIGIBLE PROJECTS. Cohousing projects that are rental for seniors may be eligible.Capital Funding provides capital advance funds for the construction, rehabilitation oracquisition of supportive housing for seniors. Operating Funding provides rentalassistance in the form of Project Rental Assistance Contracts (PRACs) to subsidize theoperating expenses of the developments. Residents pay rent equal to 30% of theiradjusted income, and PRAC makes up the difference between rental income andoperating expenses. Also available are predevelopment grants, assisted living conversionfunds to help meet the great need for affordable assisted living options for low incomeseniors, and emergency capital repair grants for federally-assisted senior properties.
AFFORDABILITY REQUIREMENTS. Cohousing affordable units must be forresidents at or below 50% of AMI.
HOW TO APPLY. Cohousing groups should contact HUD’s Office of HousingAssistance and Grant Administration for more information. Both the capital andoperating funding streams are allocated to nonprofits on a competitive basis, through aHUD NOFA (notice of funding availability). Private nonprofit organizations applying todevelop a Section 202 project must provide a minimum capital investment equal to 0.5percent of the HUD-approved capital advance, up to a maximum of $25,000 for nationalsponsors or $10,000 for other sponsors. For more information seehttp://www.hud.gov/offices/hsg/mfh/progdesc/eld202.cfm

A.12 - Section 202 Supportive Housing for the ElderlyAffordable Cohousing Toolkit
House Hold Size 3.0 3.5 4.0 4.5 5.0 Metro Statistical Area Boulder, CO100% Area Median Income 80,200 84,650 89,100 92,650 96,200 Year 2009
50% Area Median Income 40,100 42,325 44,550 46,325 48,100
Unit type 2BR 3BRHouse Hold Size 3 4.5 30% Affordable Rent % of IncomeUtilities Allowance 90 110 30% Affordable Mortgage % of Income
Rental Calculation 2BR 3BR
Market Rent 1,500 2,000 4 4
30% AMI Affordable Rent 512 585 6 610 10
Coho Assoc. Fees 200 300 20 Units
246,939 Annual Income
Homeownership Calculation Mortgage Loan Interest Rate 6.00%2BR 3BR Mortgage Loan Amortization Yrs 30
Sales Price 250,000 330,000Closing CostsEscrow
250,000 330,000
20% Down Payment 50,000 66,0001st Mortgage 200,000 264,000Soft 2nd Mortgage Total Soft 2nd Mort
0.071946 Monthly 1st Mortgage Payment 1,199 1,5830.589% Taxes 123 162
Insurance 50 75Ownership Monthly Scenario 1,372 1,820
2BR 3BRMarket Mortgage Payment 1,500 2,000 10 10
50% AMI Affordable Mortgage Payment 913 1,04810 10
Coho Assoc. Fees 200 300 20 UnitsTotal Sales5,800,000
0

Capital Sources and Uses
Sources UsesTotal Per Unit Total Per Unit
145,000 Ownership Sales 37,500 Acquisition Costs
80,000 Rental 1st Mortgage 7.00% 30 0.0798 1.10 187,500 Hard Costs
25,000 Section 202 Grant 2,811,879 Max Rental 1st 18,750 Soft Costs
0 6,250 Financing Costs0 0 Other
250,000 Total Sources Surplus/(GAP) 250,000 Total Uses
Annual Operating Income and Expenses 3.00% Income Trending4.00% Expense Trending
Per UnitPer Mo Yr 1 Yr 2 Yr 3 Yr 4 Yr 5 Yr 6 Yr 7 Yr 8 Yr 9 Yr 10
IncomeRental Income 246,939 254,347 261,978 269,837 277,932 286,270 294,858 303,704 312,815 322,199Coho Assoc. Fees 250 120,000 123,600 127,308 131,127 135,061 139,113 143,286 147,585 152,012 156,573Other 25 12,000 12,360 12,731 13,113 13,506 13,911 14,329 14,758 15,201 15,657
PRAC Contract 200 96,000 98,880 101,846 104,902 108,049 111,290 114,629 118,068 121,610 125,258(Vacancy) -10% (99) (47,494) (48,919) (50,386) (51,898) (53,455) (55,058) (56,710) (58,412) (60,164) (61,969)Total Income 376 427,445 440,268 453,477 467,081 481,093 495,526 510,392 525,704 541,475 557,719
Per UnitPer Yr
Expenses 500Property Management Fee 400 16,000 16,640 17,306 17,998 18,718 19,466 20,245 21,055 21,897 22,773Asset Management Fee 200 8,000 8,320 8,653 8,999 9,359 9,733 10,123 10,527 10,949 11,386Maintenance & Repairs 800 32,000 33,280 34,611 35,996 37,435 38,933 40,490 42,110 43,794 45,546Electricity 200 8,000 8,320 8,653 8,999 9,359 9,733 10,123 10,527 10,949 11,386Water & Sewer 100 4,000 4,160 4,326 4,499 4,679 4,867 5,061 5,264 5,474 5,693Fuel & Gas 150 6,000 6,240 6,490 6,749 7,019 7,300 7,592 7,896 8,211 8,540Taxes/PILOT 400 16,000 16,640 17,306 17,998 18,718 19,466 20,245 21,055 21,897 22,773Insurance 500 20,000 20,800 21,632 22,497 23,397 24,333 25,306 26,319 27,371 28,466Other Coho Expenses 250 10,000 10,400 10,816 11,249 11,699 12,167 12,653 13,159 13,686 14,233Replacement Reserves 300 12,000 12,480 12,979 13,498 14,038 14,600 15,184 15,791 16,423 17,080Total Expenses 3,300 132,000 137,280 142,771 148,482 154,421 160,598 167,022 173,703 180,651 187,877
Net Operating Income (NOI) 295,445 302,988 310,705 318,599 326,672 334,928 343,370 352,001 360,824 369,842
Total Rental Debt Service 255,476 255,476 255,476 255,476 255,476 255,476 255,476 255,476 255,476 255,476Rental Debt Service Coverage Ratio 1.16 1.19 1.22 1.25 1.28 1.31 1.34 1.38 1.41 1.45
Cash Flow 39,969 47,512 55,229 63,123 71,196 79,452 87,894 96,524 105,347 114,366
10,000,000 0 10,000,000
1,000,000 750,000
250,000
5,800,000 1,500,000
3,200,000 7,500,000

45
A.13 Section 514/516 Farm Labor Housing
GENERAL DESCRIPTION. Cohousing groups may be able to use the Section 514/516program as capital subsidy or low-cost financing. The U.S. Department of Agriculture(USDA) provides both loans (Section 514) and grants (Section 516) to buy, build,improve, or repair farmworker housing. Funds can be used for site acquisition, housing,day care facilities, or community room construction, household furnishings andconstruction loan interest. The Section 515 program makes direct loans to developers ofaffordable multifamily rental housing for very low, low, and moderate income families,elderly people and persons with disabilities. The loans are at an interest rate of 1%,amortized over 50 years, to finance modest rental or cooperatively-owned housing. Fundsmay be used to construct new housing or to purchase and rehabilitate existing structuresfor rental purposes.
ELIGIBLE PROJECTS. Cohousing projects that are rental or homeownership may beeligible. Section 514 loans are made to farmers, associations of farmers, family farmcorporations, Indian tribes, nonprofit organizations, public agencies, associations offarmworkers, and limited partnerships in which the general partner is a nonprofit entity.Section 516 grants are made to farmworker associations, nonprofit organizations, Indiantribes, and public agencies. Funds may be used in urban areas for nearby farm labor, anexception to USDA’s usual strictly rural service area. Tenants must be domestic farmlaborers who receive a substantial portion of their income from farm labor and arecitizens or legally admitted for permanent residence. Legally admitted temporary laborers(“H-2A” workers) are not eligible. Retired or disabled farm laborers may remain astenants if initially eligible. Projects may also include congregate housing for the elderlyand persons with disabilities and group homes for the developmentally disabled.
AFFORDABILITY REQUIREMENTS. Cohousing affordable units must be forresidents at or below 50% of AMI.
HOW TO APPLY. Cohousing groups should contact the local USDA office for moreinformation. Section 515 loans are made available on a competitive basis each year,using a national Notice of Funding Availability (NOFA). For more information seewww.rurdev.usda.gov/rhs/mfh/brief_mfh_flh.htm

A.13 - Section 514/516 Farm Labor HousingAffordable Cohousing Toolkit
House Hold Size 3.0 3.5 4.0 4.5 5.0 Metro Statistical Area Boulder, CO100% Area Median Income 80,200 84,650 89,100 92,650 96,200 Year 2009
50% Area Median Income 40,100 42,325 44,550 46,325 48,100
Unit type 2BR 3BRHouse Hold Size 3 4.5 30% Affordable Rent % of IncomeUtilities Allowance 90 110 30% Affordable Mortgage % of Income
Rental Calculation 2BR 3BR
Market Rent 1,500 2,000 0 0
30% AMI Affordable Rent 512 585 10 1010 10
Coho Assoc. Fees 200 300 20 Units
131,565 Annual Income
Homeownership Calculation Mortgage Loan Interest Rate 6.00%2BR 3BR Mortgage Loan Amortization Yrs 30
Sales Price 250,000 330,000Closing CostsEscrow
250,000 330,000
20% Down Payment 50,000 66,0001st Mortgage 200,000 264,000Soft 2nd Mortgage Total Soft 2nd Mort
0.071946 Monthly 1st Mortgage Payment 1,199 1,5830.589% Taxes 123 162
Insurance 50 75Ownership Monthly Scenario 1,372 1,820
2BR 3BRMarket Mortgage Payment 1,500 2,000 10 10
50% AMI Affordable Mortgage Payment 913 1,04810 10
Coho Assoc. Fees 200 300 20 UnitsTotal Sales5,800,000
0

Capital Sources and Uses
Sources UsesTotal Per Unit Total Per Unit
145,000 Ownership Sales 37,500 Acquisition Costs
92,500 514 Loan 1.00% 50 0.0254 1.10 187,500 Hard Costs
12,500 516 Loan 4,704,562 Max Rental 1st 18,750 Soft Costs
0 6,250 Financing Costs0 0 Other
250,000 Total Sources Surplus/(GAP) 250,000 Total Uses
Annual Operating Income and Expenses 3.00% Income Trending4.00% Expense Trending
Per UnitPer Mo Yr 1 Yr 2 Yr 3 Yr 4 Yr 5 Yr 6 Yr 7 Yr 8 Yr 9 Yr 10
IncomeRental Income 131,565 135,512 139,577 143,765 148,078 152,520 157,095 161,808 166,663 171,662Coho Assoc. Fees 250 120,000 123,600 127,308 131,127 135,061 139,113 143,286 147,585 152,012 156,573Other 25 12,000 12,360 12,731 13,113 13,506 13,911 14,329 14,758 15,201 15,657(Vacancy) -10% (55) (26,357) (27,147) (27,962) (28,800) (29,664) (30,554) (31,471) (32,415) (33,388) (34,389)Total Income 220 237,209 244,325 251,654 259,204 266,980 274,990 283,239 291,737 300,489 309,503
Per UnitPer Yr
ExpensesProperty Management Fee 500 20,000 20,800 21,632 22,497 23,397 24,333 25,306 26,319 27,371 28,466Asset Management Fee 400 16,000 16,640 17,306 17,998 18,718 19,466 20,245 21,055 21,897 22,773Maintenance & Repairs 800 32,000 33,280 34,611 35,996 37,435 38,933 40,490 42,110 43,794 45,546Electricity 200 8,000 8,320 8,653 8,999 9,359 9,733 10,123 10,527 10,949 11,386Water & Sewer 100 4,000 4,160 4,326 4,499 4,679 4,867 5,061 5,264 5,474 5,693Fuel & Gas 150 6,000 6,240 6,490 6,749 7,019 7,300 7,592 7,896 8,211 8,540Taxes/PILOT 100 4,000 4,160 4,326 4,499 4,679 4,867 5,061 5,264 5,474 5,693Insurance 400 16,000 16,640 17,306 17,998 18,718 19,466 20,245 21,055 21,897 22,773Other Coho Expenses 250 10,000 10,400 10,816 11,249 11,699 12,167 12,653 13,159 13,686 14,233Replacement Reserves 300 12,000 12,480 12,979 13,498 14,038 14,600 15,184 15,791 16,423 17,080Total Expenses 3,200 128,000 133,120 138,445 143,983 149,742 155,732 161,961 168,439 175,177 182,184
Net Operating Income (NOI) 109,209 111,205 113,210 115,222 117,238 119,258 121,279 123,297 125,312 127,319
Total Rental Debt Service 94,065 94,065 94,065 94,065 94,065 94,065 94,065 94,065 94,065 94,065Rental Debt Service Coverage Ratio 1.16 1.18 1.20 1.22 1.25 1.27 1.29 1.31 1.33 1.35
Cash Flow 15,143 17,139 19,144 21,156 23,173 25,193 27,213 29,232 31,246 33,254
10,000,000 0 10,000,000
500,000 750,000
250,000
5,800,000 1,500,000
3,700,000 7,500,000

48
A.14 Section 811 Supportive Housing for Persons with Disabilities
GENERAL DESCRIPTION. Cohousing groups may be able to use the Section 811Supportive Housing for Persons with Disabilities (Section 811) program as capitalsubsidy or a resident income supplement. Section 811 provides supportive housing forpeople with serious and long-term disabilities, including physical or developmentaldisabilities as well as serious mental illness.
ELIGIBLE PROJECTS. Cohousing projects that are rental or homeownership may beeligible. Capital Advance/PRAC funding assists projects that meet the needs of peoplewith disabilities and are approved by the appropriate local or state agency. Section 811funds can be used for case management, assistance with housing or residential skills suchas landlord/tenant obligations, housekeeping assistance, assistance with skills of dailyliving and others. The Section 811 Capital Advance/PRAC component provides interest-free capital advances to nonprofit sponsors to help finance the development of ‘singlepurpose’ permanent supportive rental properties, including independent living projectsand group homes. Note that the purchase of condominiums and cooperative units ispermitted but bureaucratically difficult. Group homes may not assist more than 8 peopleand each person must have his/her own bedroom. Independent living projects may notexceed 24 units. Section 811 tenant-based rental assistance (Section 8 MainstreamHousing Opportunities for Persons with Disabilities program) is also available.
AFFORDABILITY REQUIREMENTS. Cohousing affordable units must be forresidents at or below 50% of AMI. Participants must be 18 years of age or older.Housing must remain available for very low income people with disabilities for at least40 years. A three-year renewable PRAC is awarded with the capital advance and coversthe difference between the HUD-approved cost of operating the housing (maintenanceand repairs, utilities, insurance, etc.) and tenant rents which are set at 30% of income.
HOW TO APPLY. Cohousing groups should contact their local HUD office for moreinformation. Section 811 Capital Advance/ (PRAC) funding is announced each yearthrough HUD’s SuperNOFA published in the spring. For more information seehttp://www.hud.gov/offices/hsg/mfh/progdesc/disab811.cfm

A.14 - Section 811 Supportive Housing for Persons with DisabilitiesAffordable Cohousing Toolkit
House Hold Size 3.0 3.5 4.0 4.5 5.0 Metro Statistical Area Boulder, CO100% Area Median Income 80,200 84,650 89,100 92,650 96,200 Year 2009
50% Area Median Income 40,100 42,325 44,550 46,325 48,100
Unit type 2BR 3BRHouse Hold Size 3 4.5 30% Affordable Rent % of IncomeUtilities Allowance 90 110 30% Affordable Mortgage % of Income
Rental Calculation 2BR 3BR
Market Rent 1,500 2,000 5 5
0-60% AMI PRAC 1,500 2,000 5 510 10
Coho Assoc. Fees 200 300 20 Units420,000 Annual Income
Homeownership Calculation Mortgage Loan Interest Rate 6.00%2BR 3BR Mortgage Loan Amortization Yrs 30
Sales Price 250,000 330,000Closing CostsEscrow
250,000 330,000
20% Down Payment 50,000 66,0001st Mortgage 200,000 264,000Soft 2nd Mortgage Total Soft 2nd Mort
0.071946 Monthly 1st Mortgage Payment 1,199 1,5830.589% Taxes 123 162
Insurance 50 75Ownership Monthly Scenario 1,372 1,820
2BR 3BRMarket Mortgage Payment 1,500 2,000 10 10
50% AMI Affordable Mortgage Payment 913 1,04810 10
Coho Assoc. Fees 200 300 20 UnitsTotal Sales5,800,000
0

Capital Sources and Uses
Sources UsesTotal Per Unit Total Per Unit
145,000 Ownership Sales 37,500 Acquisition Costs
92,500 Rental 1st Mortgage 7.00% 30 0.0798 1.10 187,500 Hard Costs
12,500 Section 811 Capital Advance 4,782,514 Max Rental 1st 18,750 Soft Costs
0 6,250 Financing Costs0 0 Other
250,000 Total Sources Surplus/(GAP) 250,000 Total Uses
Annual Operating Income and Expenses 3.00% Income Trending4.00% Expense Trending
Per UnitPer Mo Yr 1 Yr 2 Yr 3 Yr 4 Yr 5 Yr 6 Yr 7 Yr 8 Yr 9 Yr 10
IncomeRental Income 420,000 432,600 445,578 458,945 472,714 486,895 501,502 516,547 532,043 548,005Coho Assoc. Fees 250 120,000 123,600 127,308 131,127 135,061 139,113 143,286 147,585 152,012 156,573Other 25 12,000 12,360 12,731 13,113 13,506 13,911 14,329 14,758 15,201 15,657(Vacancy) -10% (115) (55,200) (56,856) (58,562) (60,319) (62,128) (63,992) (65,912) (67,889) (69,926) (72,023)Total Income 160 496,800 511,704 527,055 542,867 559,153 575,927 593,205 611,001 629,331 648,211
Per UnitPer Yr
ExpensesProperty Management Fee 500 20,000 20,800 21,632 22,497 23,397 24,333 25,306 26,319 27,371 28,466Asset Management Fee 400 16,000 16,640 17,306 17,998 18,718 19,466 20,245 21,055 21,897 22,773Maintenance & Repairs 800 32,000 33,280 34,611 35,996 37,435 38,933 40,490 42,110 43,794 45,546Electricity 200 8,000 8,320 8,653 8,999 9,359 9,733 10,123 10,527 10,949 11,386Water & Sewer 100 4,000 4,160 4,326 4,499 4,679 4,867 5,061 5,264 5,474 5,693Fuel & Gas 150 6,000 6,240 6,490 6,749 7,019 7,300 7,592 7,896 8,211 8,540Taxes/PILOT 100 4,000 4,160 4,326 4,499 4,679 4,867 5,061 5,264 5,474 5,693Insurance 400 16,000 16,640 17,306 17,998 18,718 19,466 20,245 21,055 21,897 22,773Other Coho Expenses 250 10,000 10,400 10,816 11,249 11,699 12,167 12,653 13,159 13,686 14,233Replacement Reserves 300 12,000 12,480 12,979 13,498 14,038 14,600 15,184 15,791 16,423 17,080Total Expenses 3,200 128,000 133,120 138,445 143,983 149,742 155,732 161,961 168,439 175,177 182,184
Net Operating Income (NOI) 368,800 378,584 388,610 398,884 409,411 420,196 431,244 442,562 454,155 466,027
Total Rental Debt Service 295,394 295,394 295,394 295,394 295,394 295,394 295,394 295,394 295,394 295,394Rental Debt Service Coverage Ratio 1.25 1.28 1.32 1.35 1.39 1.42 1.46 1.50 1.54 1.58
Cash Flow 73,406 83,190 93,216 103,490 114,017 124,801 135,850 147,168 158,760 170,633
10,000,000 0 10,000,000
500,000 750,000
250,000
5,800,000 1,500,000
3,700,000 7,500,000

51
A.15 Self-Help Homeownership Opportunity Program (SHOP)
GENERAL DESCRIPTION. Cohousing groups may be able to use the Self-HelpHomeownership Opportunity Program (SHOP) as capital subsidy. SHOP is acompetitive grant program that provides funds to national and regional nonprofits thatassist low income families in building their own homes using a ‘sweat-equity’ or ‘self-help’ model.
ELIGIBLE PROJECTS. Cohousing projects that are homeownership may be eligible.Funds are restricted to paying for land and infrastructure costs associated with buildingthe homes, including such items as sewer connections, streets, utilities and environmentalremediation. The homes are sold to the homebuyers at below-market rates. These fundsmust result in one home for each $15,000 awarded. Each family receiving assistancethrough the SHOP program is required to invest at least 100 hours of work in building itshome or the homes of others, although many families work far more than the requiredhours. Organizations may develop self-help housing themselves or act as intermediaries;that is, make SHOP loans to local organizations that work with self-help home buyers.
AFFORDABILITY REQUIREMENTS. Cohousing affordable units must be forresidents at or below 80% of AMI. SHOP funds have been used to support the work ofself-help housing organizations throughout the country.
HOW TO APPLY. Cohousing groups should contact HUD’s Office of CommunityPlanning and Development or the local self-help housing organization for moreinformation. National or regional nonprofit organizations or consortia can apply to HUDannually for SHOP funds. Two SHOP recipients operate nationwide, Habitat forHumanity and the Housing Assistance Council. HUD awards grants competitively basedupon an organization’s experience in managing a sweat-equity program, communityneeds, its capacity to generate other sources of funding, and the soundness of its programdesign. For more information seehttp://www.hud.gov/offices/cpd/affordablehousing/programs/shop

A.15 - Self-Help Homeownership Opportunity Program (SHOP)Affordable Cohousing Toolkit
House Hold Size 3.0 3.5 4.0 4.5 5.0 Metro Statistical Area Boulder, CO100% Area Median Income 80,200 84,650 89,100 92,650 96,200 Year 2009
50% Area Median Income 40,100 42,325 44,550 46,325 48,100
Unit type 2BR 3BRHouse Hold Size 3 4.5 30% Affordable Rent % of IncomeUtilities Allowance 90 110 30% Affordable Mortgage % of Income
Rental Calculation 2BR 3BRMarket Rent 1,500 2,000 10 10
50% AMI Affordable Rent 913 1,04810 10
Coho Assoc. Fees 200 300 20 Units420,000 Annual Income
Homeownership Calculation Mortgage Loan Interest Rate 6.00%2BR 3BR Mortgage Loan Amortization Yrs 30
Sales Price 250,000 330,000Closing CostsEscrow
250,000 330,000
20% Down Payment 50,000 66,0001st Mortgage 200,000 234,000
SHOP 2nd Mortgage 0 30,000 Total Soft 2nd Mort
0.071946 Monthly 1st Mortgage Payment 1,199 1,4030.589% Taxes 123 162
Insurance 50 75Ownership Monthly Scenario 1,372 1,640
2BR 3BRMarket Mortgage Payment 1,500 2,000 5 5
80% AMI Affordable Mortgage Payment 1,514 1,743 5 510 10
Coho Assoc. Fees 200 300 20 UnitsTotal Sales5,800,000
150,000

Capital Sources and Uses
Sources UsesTotal Per Unit Total Per Unit
145,000 Ownership Sales 37,500 Acquisition Costs
105,000 Rental 1st Mortgage 7.00% 30 0.0798 1.10 187,500 Hard Costs0 4,782,514 Max Rental 1st 18,750 Soft Costs0 6,250 Financing Costs0 0 Other
250,000 Total Sources Surplus/(GAP) 250,000 Total Uses
Annual Operating Income and Expenses 3.00% Income Trending4.00% Expense Trending
Per UnitPer Mo Yr 1 Yr 2 Yr 3 Yr 4 Yr 5 Yr 6 Yr 7 Yr 8 Yr 9 Yr 10
IncomeRental Income 420,000 432,600 445,578 458,945 472,714 486,895 501,502 516,547 532,043 548,005Coho Assoc. Fees 250 120,000 123,600 127,308 131,127 135,061 139,113 143,286 147,585 152,012 156,573Other 25 12,000 12,360 12,731 13,113 13,506 13,911 14,329 14,758 15,201 15,657(Vacancy) -10% (115) (55,200) (56,856) (58,562) (60,319) (62,128) (63,992) (65,912) (67,889) (69,926) (72,023)Total Income 160 496,800 511,704 527,055 542,867 559,153 575,927 593,205 611,001 629,331 648,211
Per UnitPer Yr
ExpensesProperty Management Fee 500 20,000 20,800 21,632 22,497 23,397 24,333 25,306 26,319 27,371 28,466Asset Management Fee 400 16,000 16,640 17,306 17,998 18,718 19,466 20,245 21,055 21,897 22,773Maintenance & Repairs 800 32,000 33,280 34,611 35,996 37,435 38,933 40,490 42,110 43,794 45,546Electricity 200 8,000 8,320 8,653 8,999 9,359 9,733 10,123 10,527 10,949 11,386Water & Sewer 100 4,000 4,160 4,326 4,499 4,679 4,867 5,061 5,264 5,474 5,693Fuel & Gas 150 6,000 6,240 6,490 6,749 7,019 7,300 7,592 7,896 8,211 8,540Taxes/PILOT 100 4,000 4,160 4,326 4,499 4,679 4,867 5,061 5,264 5,474 5,693Insurance 400 16,000 16,640 17,306 17,998 18,718 19,466 20,245 21,055 21,897 22,773Other Coho Expenses 250 10,000 10,400 10,816 11,249 11,699 12,167 12,653 13,159 13,686 14,233Replacement Reserves 300 12,000 12,480 12,979 13,498 14,038 14,600 15,184 15,791 16,423 17,080Total Expenses 3,200 128,000 133,120 138,445 143,983 149,742 155,732 161,961 168,439 175,177 182,184
Net Operating Income (NOI) 368,800 378,584 388,610 398,884 409,411 420,196 431,244 442,562 454,155 466,027
Total Rental Debt Service 335,312 335,312 335,312 335,312 335,312 335,312 335,312 335,312 335,312 335,312Rental Debt Service Coverage Ratio 1.10 1.13 1.16 1.19 1.22 1.25 1.29 1.32 1.35 1.39
Cash Flow 33,488 43,272 53,298 63,572 74,098 84,883 95,932 107,250 118,842 130,715
10,000,000 0 10,000,000
750,000250,000
5,800,000 1,500,000
4,200,000 7,500,000

54
A.16 State and Local Housing Trust Funds
GENERAL DESCRIPTION. Cohousing groups may be able to use state and localhousing trust funds as capital subsidies. Housing trust funds (HTFs) are government-established funds that have ongoing, dedicated sources of public funds committed tosupport the production and preservation of homes for low income households. HTFsdedicate public revenues by ordinance or legislation so that the revenues are availableeach and every year to support affordable housing. Most housing trust funds providefunding through loans and grants.
ELIGIBLE PROJECTS. Cohousing projects that are rental or homeownership may beeligible. Housing trust funds employ public funds and work to address the affordablehousing needs for households at various percentage of the area median income. Eligibleactivities are usually quite broadly defined, including new construction, rehabilitation,acquisition, emergency repairs, accessibility, first time homeownership and many otheractivities. Rental assistance is provided by some housing trust funds. There are a fewhousing trust funds that serve only the needs of the homeless population and define theiractivities accordingly.
AFFORDABILITY REQUIREMENTS. Although programs vary, cohousing affordableunits must be for residents at or below 80% of AMI. Most housing trust funds servepopulations earning no more than 80% of the area median income, but many serve lowerincome households either entirely or in part by setting aside a portion of the funds toserve these populations in particular.
HOW TO APPLY. Cohousing groups should contact the state or local Housing TrustFund for more information. Eligible applicants typically include nonprofit developers,for-profit developers, government entities, Native American tribes and public housingauthorities. For more information seewww.communitychange.org/our-projects/htf.

A.16 - State and Local Housing Trust FundsAffordable Cohousing Toolkit
House Hold Size 3.0 3.5 4.0 4.5 5.0 Metro Statistical Area Boulder, CO100% Area Median Income 80,200 84,650 89,100 92,650 96,200 Year 2009
50% Area Median Income 40,100 42,325 44,550 46,325 48,100
Unit type 2BR 3BRHouse Hold Size 3 4.5 30% Affordable Rent % of IncomeUtilities Allowance 90 110 30% Affordable Mortgage % of Income
Rental Calculation 2BR 3BR
Market Rent 1,500 2,000 7 7
60% AMI Affordable Rent 1,113 1,280 3 310 10
Coho Assoc. Fees 200 300 20 Units
380,139 Annual Income
Homeownership Calculation Mortgage Loan Interest Rate 6.00%2BR 3BR Mortgage Loan Amortization Yrs 30
Sales Price 250,000 330,000Closing CostsEscrow
250,000 330,000
20% Down Payment 50,000 66,0001st Mortgage 200,000 264,000Soft 2nd Mortgage Total Soft 2nd Mort
0.071946 Monthly 1st Mortgage Payment 1,199 1,5830.589% Taxes 123 162
Insurance 50 75Ownership Monthly Scenario 1,372 1,820
2BR 3BRMarket Mortgage Payment 1,500 2,000 10 10
50% AMI Affordable Mortgage Payment 913 1,04810 10
Coho Assoc. Fees 200 300 20 UnitsTotal Sales5,800,000
0

Capital Sources and Uses
Sources UsesTotal Per Unit Total Per Unit
145,000 Ownership Sales 37,500 Acquisition Costs
92,500 Rental 1st Mortgage 7.00% 30 0.0798 1.10 187,500 Hard Costs
12,500 State HTF Loan 4,328,619 Max Rental 1st 18,750 Soft Costs
0 6,250 Financing Costs0 0 Other
250,000 Total Sources Surplus/(GAP) 250,000 Total Uses
Annual Operating Income and Expenses 3.00% Income Trending4.00% Expense Trending
Per UnitPer Mo Yr 1 Yr 2 Yr 3 Yr 4 Yr 5 Yr 6 Yr 7 Yr 8 Yr 9 Yr 10
IncomeRental Income 380,139 391,543 403,289 415,388 427,850 440,685 453,906 467,523 481,549 495,995Coho Assoc. Fees 250 120,000 123,600 127,308 131,127 135,061 139,113 143,286 147,585 152,012 156,573Other 25 12,000 12,360 12,731 13,113 13,506 13,911 14,329 14,758 15,201 15,657(Vacancy) -10% (107) (51,214) (52,750) (54,333) (55,963) (57,642) (59,371) (61,152) (62,987) (64,876) (66,823)Total Income 168 460,925 474,753 488,995 503,665 518,775 534,339 550,369 566,880 583,886 601,403
Per UnitPer Yr
ExpensesProperty Management Fee 500 20,000 20,800 21,632 22,497 23,397 24,333 25,306 26,319 27,371 28,466Asset Management Fee 400 16,000 16,640 17,306 17,998 18,718 19,466 20,245 21,055 21,897 22,773Maintenance & Repairs 800 32,000 33,280 34,611 35,996 37,435 38,933 40,490 42,110 43,794 45,546Electricity 200 8,000 8,320 8,653 8,999 9,359 9,733 10,123 10,527 10,949 11,386Water & Sewer 100 4,000 4,160 4,326 4,499 4,679 4,867 5,061 5,264 5,474 5,693Fuel & Gas 150 6,000 6,240 6,490 6,749 7,019 7,300 7,592 7,896 8,211 8,540Taxes/PILOT 100 4,000 4,160 4,326 4,499 4,679 4,867 5,061 5,264 5,474 5,693Insurance 400 16,000 16,640 17,306 17,998 18,718 19,466 20,245 21,055 21,897 22,773Other Coho Expenses 250 10,000 10,400 10,816 11,249 11,699 12,167 12,653 13,159 13,686 14,233Replacement Reserves 300 12,000 12,480 12,979 13,498 14,038 14,600 15,184 15,791 16,423 17,080Total Expenses 3,200 128,000 133,120 138,445 143,983 149,742 155,732 161,961 168,439 175,177 182,184
Net Operating Income (NOI) 332,925 341,633 350,551 359,683 369,033 378,607 388,408 398,440 408,709 419,219
Total Rental Debt Service 295,394 295,394 295,394 295,394 295,394 295,394 295,394 295,394 295,394 295,394Rental Debt Service Coverage Ratio 1.13 1.16 1.19 1.22 1.25 1.28 1.31 1.35 1.38 1.42
Cash Flow 37,531 46,239 55,156 64,288 73,639 83,213 93,014 103,046 113,315 123,824
10,000,000 0 10,000,000
500,000 750,000
250,000
5,800,000 1,500,000
3,700,000 7,500,000

57
B. Private Affordable Housing Subsidies and Financing Sources

58
B.01 Federal Home Loan Banks (FHLB) Affordable Housing Program (AHP)
GENERAL DESCRIPTION. Cohousing groups may be able to use the AffordableHousing Program (AHP) as a capital subsidy or low-cost financing. The FHLBanks arerequired to dedicate 10% of their net income each year to AHP. Funds are then awardedon a competitive basis to projects that are sponsored by member institutions inpartnership with community-based nonprofit partners. AHP funds often are used incombination with other programs, ensuring a project’s feasibility.
ELIGIBLE PROJECTS. Cohousing projects that are homeownership or rental may beeligible. The average unit subsidy is $7,926. AHP can be used for acquisition,construction, purchase and rehabilitation of affordable housing. Economic developmentprojects include commercial, industrial, manufacturing, social service, infrastructureprojects and public facility projects and activities.
AFFORDABILITY REQUIREMENTS. Cohousing affordable units must be forresidents at or below 50-80% of AMI. AHP subsidizes the cost of housing for very lowincome, low and moderate income owner-occupied and rental housing.
HOW TO APPLY. Cohousing groups should contact the local FHLB for moreinformation. For more information seehttp://www.fhlbanks.com/programs_affordhousing.htm

B.01 - Federal Home Loan Banks (FHLB) Affordable Housing Program (AHP)Affordable Cohousing Toolkit
House Hold Size 3.0 3.5 4.0 4.5 5.0 Metro Statistical Area Boulder, CO100% Area Median Income 80,200 84,650 89,100 92,650 96,200 Year 2009
50% Area Median Income 40,100 42,325 44,550 46,325 48,100
Unit type 2BR 3BRHouse Hold Size 3 4.5 30% Affordable Rent % of IncomeUtilities Allowance 90 110 30% Affordable Mortgage % of Income
Rental Calculation 2BR 3BR
Market Rent 1,500 2,000 7 7
60% AMI Affordable Rent 1,113 1,280 3 310 10
Coho Assoc. Fees 200 300 20 Units
380,139 Annual Income
Homeownership Calculation Mortgage Loan Interest Rate 6.00%2BR 3BR Mortgage Loan Amortization Yrs 30
Sales Price 250,000 330,000Closing CostsEscrow
250,000 330,000
20% Down Payment 50,000 66,0001st Mortgage 200,000 264,000Soft 2nd Mortgage Total Soft 2nd Mort
0.071946 Monthly 1st Mortgage Payment 1,199 1,5830.589% Taxes 123 162
Insurance 50 75Ownership Monthly Scenario 1,372 1,820
2BR 3BRMarket Mortgage Payment 1,500 2,000 10 10
50% AMI Affordable Mortgage Payment 913 1,04810 10
Coho Assoc. Fees 200 300 20 UnitsTotal Sales5,800,000
0

Capital Sources and Uses
Sources UsesTotal Per Unit Total Per Unit
145,000 Ownership Sales 37,500 Acquisition Costs
92,500 Rental 1st Mortgage 7.00% 30 0.0798 1.10 187,500 Hard Costs
12,500 FHLB Grant or Loan 4,328,619 Max Rental 1st 18,750 Soft Costs
0 6,250 Financing Costs0 0 Other
250,000 Total Sources Surplus/(GAP) 250,000 Total Uses
Annual Operating Income and Expenses 3.00% Income Trending4.00% Expense Trending
Per UnitPer Mo Yr 1 Yr 2 Yr 3 Yr 4 Yr 5 Yr 6 Yr 7 Yr 8 Yr 9 Yr 10
IncomeRental Income 380,139 391,543 403,289 415,388 427,850 440,685 453,906 467,523 481,549 495,995Coho Assoc. Fees 250 120,000 123,600 127,308 131,127 135,061 139,113 143,286 147,585 152,012 156,573Other 25 12,000 12,360 12,731 13,113 13,506 13,911 14,329 14,758 15,201 15,657(Vacancy) -10% (107) (51,214) (52,750) (54,333) (55,963) (57,642) (59,371) (61,152) (62,987) (64,876) (66,823)Total Income 168 460,925 474,753 488,995 503,665 518,775 534,339 550,369 566,880 583,886 601,403
Per UnitPer Yr
ExpensesProperty Management Fee 500 20,000 20,800 21,632 22,497 23,397 24,333 25,306 26,319 27,371 28,466Asset Management Fee 400 16,000 16,640 17,306 17,998 18,718 19,466 20,245 21,055 21,897 22,773Maintenance & Repairs 800 32,000 33,280 34,611 35,996 37,435 38,933 40,490 42,110 43,794 45,546Electricity 200 8,000 8,320 8,653 8,999 9,359 9,733 10,123 10,527 10,949 11,386Water & Sewer 100 4,000 4,160 4,326 4,499 4,679 4,867 5,061 5,264 5,474 5,693Fuel & Gas 150 6,000 6,240 6,490 6,749 7,019 7,300 7,592 7,896 8,211 8,540Taxes/PILOT 100 4,000 4,160 4,326 4,499 4,679 4,867 5,061 5,264 5,474 5,693Insurance 400 16,000 16,640 17,306 17,998 18,718 19,466 20,245 21,055 21,897 22,773Other Coho Expenses 250 10,000 10,400 10,816 11,249 11,699 12,167 12,653 13,159 13,686 14,233Replacement Reserves 300 12,000 12,480 12,979 13,498 14,038 14,600 15,184 15,791 16,423 17,080Total Expenses 3,200 128,000 133,120 138,445 143,983 149,742 155,732 161,961 168,439 175,177 182,184
Net Operating Income (NOI) 332,925 341,633 350,551 359,683 369,033 378,607 388,408 398,440 408,709 419,219
Total Rental Debt Service 295,394 295,394 295,394 295,394 295,394 295,394 295,394 295,394 295,394 295,394Rental Debt Service Coverage Ratio 1.13 1.16 1.19 1.22 1.25 1.28 1.31 1.35 1.38 1.42
Cash Flow 37,531 46,239 55,156 64,288 73,639 83,213 93,014 103,046 113,315 123,824
10,000,000 0 10,000,000
500,000 750,000
250,000
5,800,000 1,500,000
3,700,000 7,500,000

61
B.02 Community Self Financing
GENERAL DESCRIPTION. Cohousing groups may be able to use internal self-financing as capital or operating subsidy or low-cost financing. Self-financing is whenforming groups provide private financing from community members to make some units“affordable.”
ELIGIBLE PROJECTS. Cohousing projects that are rental or homeownership may beeligible. The three types of self-financing include individual contributions, developmentcost subsidies, and realignment of house purchase cost. In individual contributionsindividual households put up money voluntarily to assist other, less well-off communitymembers in forming groups to help them afford their unit. This money can be a loan withor without interest, or a gift/grant. Repayment plans for loans can vary considerably.Development cost subsidies are set aside monies in the development budget to assisthouseholds in need of assistance to purchase their units. A separate account is created inthe project development budget to assist families/households who need help inpurchasing their unit. This can be a gift or a loan, with varying methods of repayment.Realignment of house purchase costs for units being purchased by more well-offhouseholds are raised and the cost of units being purchased by lower/moderate incomefamilies are reduced. The more affluent households are thus subsidizing the less affluent.
AFFORDABILITY REQUIREMENTS. Each cohousing group can design its ownprogram. Some communities have set aside $25,000 for an “Affordability Fund.”Individual contributions ranged from $ 500 to $10,000. In addition, the community, byconsensus, agreed to allocate $5,000 in the project development budget for theAffordability Fund thus bringing the total to $30,000. Communities may set upAffordability Committees to review and approve, in confidence, applications received forthe Affordability Fund. The amounts may be granted as no-interest loans that could berepaid at any time, but no later than point of sale. When units are sold the subsidies arereturned to the Affordability Fund.
HOW TO APPLY. Each cohousing group can design its own program.

B.02 - Community Self FinancingAffordable Cohousing Toolkit
House Hold Size 3.0 3.5 4.0 4.5 5.0 Metro Statistical Area Boulder, CO100% Area Median Income 80,200 84,650 89,100 92,650 96,200 Year 2009
50% Area Median Income 40,100 42,325 44,550 46,325 48,100
Unit type 2BR 3BRHouse Hold Size 3 4.5 30% Affordable Rent % of IncomeUtilities Allowance 90 110 30% Affordable Mortgage % of Income
Rental Calculation 2BR 3BR
Market Rent 1,500 2,000 5 5
60% AMI Affordable Rent 1,113 1,280 5 510 10
Coho Assoc. Fees 200 300 20 Units
353,565 Annual Income
Homeownership Calculation Mortgage Loan Interest Rate 6.00%2BR 3BR Mortgage Loan Amortization Yrs 30
Sales Price 250,000 330,000Closing CostsEscrow
250,000 330,000
20% Down Payment 50,000 66,0001st Mortgage 150,000 164,000
Self Financing 2nd Mortgage 50,000 100,000 Total Soft 2nd Mort
0.071946 Monthly 1st Mortgage Payment 899 9830.589% Taxes 123 162
Insurance 50 75Ownership Monthly Scenario 1,072 1,220
2BR 3BR
Market Mortgage Payment 1,500 2,000 5 5
60% AMI Affordable Mortgage Payment 1,113 1,280 5 510 10
Coho Assoc. Fees 200 300 20 Units
Total Sales5,800,000
750,000

Capital Sources and Uses
Sources UsesTotal Per Unit Total Per Unit
145,000 Ownership Sales 37,500 Acquisition Costs
86,250 Rental 1st Mortgage 7.00% 30 0.0798 1.10 187,500 Hard Costs
18,750 Self Financing Grant 4,026,022 Max Rental 1st 18,750 Soft Costs
0 6,250 Financing Costs0 0 Other
250,000 Total Sources Surplus/(GAP) 250,000 Total Uses
Annual Operating Income and Expenses 3.00% Income Trending4.00% Expense Trending
Per UnitPer Mo Yr 1 Yr 2 Yr 3 Yr 4 Yr 5 Yr 6 Yr 7 Yr 8 Yr 9 Yr 10
IncomeRental Income 353,565 364,172 375,097 386,350 397,941 409,879 422,175 434,840 447,886 461,322Coho Assoc. Fees 250 120,000 123,600 127,308 131,127 135,061 139,113 143,286 147,585 152,012 156,573Other 25 12,000 12,360 12,731 13,113 13,506 13,911 14,329 14,758 15,201 15,657(Vacancy) -10% (101) (48,557) (50,013) (51,514) (53,059) (54,651) (56,290) (57,979) (59,718) (61,510) (63,355)Total Income 174 437,009 450,119 463,622 477,531 491,857 506,613 521,811 537,465 553,589 570,197
Per UnitPer Yr
ExpensesProperty Management Fee 500 20,000 20,800 21,632 22,497 23,397 24,333 25,306 26,319 27,371 28,466Asset Management Fee 400 16,000 16,640 17,306 17,998 18,718 19,466 20,245 21,055 21,897 22,773Maintenance & Repairs 800 32,000 33,280 34,611 35,996 37,435 38,933 40,490 42,110 43,794 45,546Electricity 200 8,000 8,320 8,653 8,999 9,359 9,733 10,123 10,527 10,949 11,386Water & Sewer 100 4,000 4,160 4,326 4,499 4,679 4,867 5,061 5,264 5,474 5,693Fuel & Gas 150 6,000 6,240 6,490 6,749 7,019 7,300 7,592 7,896 8,211 8,540Taxes/PILOT 100 4,000 4,160 4,326 4,499 4,679 4,867 5,061 5,264 5,474 5,693Insurance 400 16,000 16,640 17,306 17,998 18,718 19,466 20,245 21,055 21,897 22,773Other Coho Expenses 250 10,000 10,400 10,816 11,249 11,699 12,167 12,653 13,159 13,686 14,233Replacement Reserves 300 12,000 12,480 12,979 13,498 14,038 14,600 15,184 15,791 16,423 17,080Total Expenses 3,200 128,000 133,120 138,445 143,983 149,742 155,732 161,961 168,439 175,177 182,184
Net Operating Income (NOI) 309,009 316,999 325,178 333,548 342,115 350,881 359,850 369,026 378,412 388,013
Total Rental Debt Service 275,435 275,435 275,435 275,435 275,435 275,435 275,435 275,435 275,435 275,435Rental Debt Service Coverage Ratio 1.12 1.15 1.18 1.21 1.24 1.27 1.31 1.34 1.37 1.41
Cash Flow 33,573 41,564 49,742 58,113 66,680 75,446 84,415 93,591 102,977 112,578
10,000,000 0 10,000,000
750,000 750,000
250,000
5,800,000 1,500,000
3,450,000 7,500,000

64
B.03 Not-For-Profit Intermediary Organizations
GENERAL DESCRIPTION. Cohousing groups may be able to use Intermediary grantsor loans as capital subsidy or low-cost financing. Private intermediaries primarilysupport community development corporations (CDCs). While CDCs remain a primaryconstituency of most intermediaries, many intermediaries now form partnerships withother organizations on the ground, including self-help housing groups, faith-basedorganizations, funding collaboratives, housing partnership organizations, CommunityDevelopment Financial Institutions (CDFIs), social service providers and for-profitentities.
ELIGIBLE PROJECTS. Cohousing projects that are rental or homeownership may beeligible. Intermediary organizations marshal resources from financial institutions,philanthropic organizations, government and individuals and direct it to community-based organizations for operating support and project financing. They also providetraining, technical assistance, information and networking opportunities, such asconferences, for practitioners. Intermediaries also advocate for policies that advanceaffordable housing as well as other priorities at all levels of government and raiseawareness of housing and related issues among the general public.
AFFORDABILITY REQUIREMENTS. Each intermediary will have differentrequirements.
HOW TO APPLY. Cohousing groups should contact the local intermediary. Severalwell known national intermediaries include: Corporation for Supportive Housing (whichhas a homeless housing and services focus); Enterprise Community Partners (formerlyknown as The Enterprise Foundation); Habitat for Humanity International; HousingAssistance Council (which has an explicitly rural focus); Housing Partnership Network(which generally serves larger partnership groups); Local Initiatives Support Corporation;National Community Capital Association (which assists CDFIs); NeighborhoodReinvestment Corporation (doing business as NeighborWorks America and mainlyfunded by the federal government). For more information seehttp://www.nlihc.org/detail/article.cfm?article_id=6055&id=23

B.03 - Not-For-Profit Intermediary OrganizationsAffordable Cohousing Toolkit
House Hold Size 3.0 3.5 4.0 4.5 5.0 Metro Statistical Area Boulder, CO100% Area Median Income 80,200 84,650 89,100 92,650 96,200 Year 2009
50% Area Median Income 40,100 42,325 44,550 46,325 48,100
Unit type 2BR 3BRHouse Hold Size 3 4.5 30% Affordable Rent % of IncomeUtilities Allowance 90 110 30% Affordable Mortgage % of Income
Rental Calculation 2BR 3BR
Market Rent 1,500 2,000 7 7
60% AMI Affordable Rent 1,113 1,280 3 310 10
Coho Assoc. Fees 200 300 20 Units
380,139 Annual Income
Homeownership Calculation Mortgage Loan Interest Rate 6.00%2BR 3BR Mortgage Loan Amortization Yrs 30
Sales Price 250,000 330,000Closing CostsEscrow
250,000 330,000
20% Down Payment 50,000 66,0001st Mortgage 150,000 164,000
Intermediary 2nd Mortgage 50,000 100,000 Total Soft 2nd Mort
0.071946 Monthly 1st Mortgage Payment 899 9830.589% Taxes 123 162
Insurance 50 75Ownership Monthly Scenario 1,072 1,220
2BR 3BR
Market Mortgage Payment 1,500 2,000 5 5
60% AMI Affordable Mortgage Payment 1,113 1,280 5 510 10
Coho Assoc. Fees 200 300 20 Units
Total Sales5,800,000
750,000
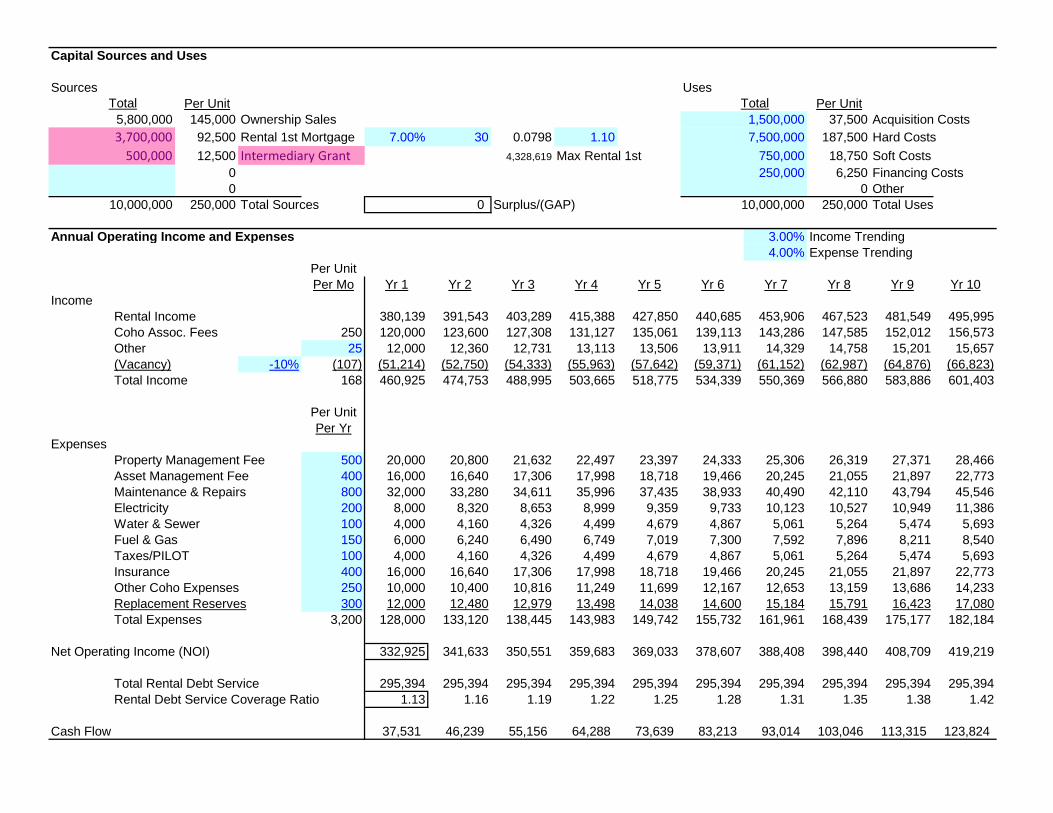
Capital Sources and Uses
Sources UsesTotal Per Unit Total Per Unit
145,000 Ownership Sales 37,500 Acquisition Costs
92,500 Rental 1st Mortgage 7.00% 30 0.0798 1.10 187,500 Hard Costs
12,500 Intermediary Grant 4,328,619 Max Rental 1st 18,750 Soft Costs
0 6,250 Financing Costs0 0 Other
250,000 Total Sources Surplus/(GAP) 250,000 Total Uses
Annual Operating Income and Expenses 3.00% Income Trending4.00% Expense Trending
Per UnitPer Mo Yr 1 Yr 2 Yr 3 Yr 4 Yr 5 Yr 6 Yr 7 Yr 8 Yr 9 Yr 10
IncomeRental Income 380,139 391,543 403,289 415,388 427,850 440,685 453,906 467,523 481,549 495,995Coho Assoc. Fees 250 120,000 123,600 127,308 131,127 135,061 139,113 143,286 147,585 152,012 156,573Other 25 12,000 12,360 12,731 13,113 13,506 13,911 14,329 14,758 15,201 15,657(Vacancy) -10% (107) (51,214) (52,750) (54,333) (55,963) (57,642) (59,371) (61,152) (62,987) (64,876) (66,823)Total Income 168 460,925 474,753 488,995 503,665 518,775 534,339 550,369 566,880 583,886 601,403
Per UnitPer Yr
ExpensesProperty Management Fee 500 20,000 20,800 21,632 22,497 23,397 24,333 25,306 26,319 27,371 28,466Asset Management Fee 400 16,000 16,640 17,306 17,998 18,718 19,466 20,245 21,055 21,897 22,773Maintenance & Repairs 800 32,000 33,280 34,611 35,996 37,435 38,933 40,490 42,110 43,794 45,546Electricity 200 8,000 8,320 8,653 8,999 9,359 9,733 10,123 10,527 10,949 11,386Water & Sewer 100 4,000 4,160 4,326 4,499 4,679 4,867 5,061 5,264 5,474 5,693Fuel & Gas 150 6,000 6,240 6,490 6,749 7,019 7,300 7,592 7,896 8,211 8,540Taxes/PILOT 100 4,000 4,160 4,326 4,499 4,679 4,867 5,061 5,264 5,474 5,693Insurance 400 16,000 16,640 17,306 17,998 18,718 19,466 20,245 21,055 21,897 22,773Other Coho Expenses 250 10,000 10,400 10,816 11,249 11,699 12,167 12,653 13,159 13,686 14,233Replacement Reserves 300 12,000 12,480 12,979 13,498 14,038 14,600 15,184 15,791 16,423 17,080Total Expenses 3,200 128,000 133,120 138,445 143,983 149,742 155,732 161,961 168,439 175,177 182,184
Net Operating Income (NOI) 332,925 341,633 350,551 359,683 369,033 378,607 388,408 398,440 408,709 419,219
Total Rental Debt Service 295,394 295,394 295,394 295,394 295,394 295,394 295,394 295,394 295,394 295,394Rental Debt Service Coverage Ratio 1.13 1.16 1.19 1.22 1.25 1.28 1.31 1.35 1.38 1.42
Cash Flow 37,531 46,239 55,156 64,288 73,639 83,213 93,014 103,046 113,315 123,824
10,000,000 0 10,000,000
500,000 750,000
250,000
5,800,000 1,500,000
3,700,000 7,500,000

67
B.04 Community Development Financial Institutions (CDFI)
GENERAL DESCRIPTION. Cohousing groups may be able to use CDFI financing aslow-cost financing. Community Development Financial Institutions (CDFIs) are privatebanks and financial intermediaries with a primary mission of community development.CDFIs provide credit and financial services to underserved markets and populations.Cohousing could benefit from many financial products that CDFIs offer to increaseaffordability in new and existing developments. Cohousing groups may be able to accessCDFI predevelopment funding, construction financing and permanent loan mortgages foraffordable housing development.
ELIGIBLE PROJECTS. Cohousing projects that are rental or homeownership may beeligible. CDFIs have a variety of structures and development lending goals which couldincrease housing affordability. These products include providing financial services,loans, and investments; offering training and technical assistance services; and promotingdevelopment efforts. CDFI Community development loan funds lend to build businesses,affordable housing and community facilities. CDFI’s may be able to make affordablefirst or second mortgage loans to low-income homebuyers. CDFI products also provideaccess to capital to start and expand businesses in economically challenged areas, buildand purchase affordable homes, and develop needed community facilities. Financialproducts and services, such as mortgage financing for low-income and first-timehomebuyers and not-for-profit developers, flexible underwriting and risk capital forneeded community facilities, and technical assistance, is also available from CDFIs.Some CDFIs offer commercial loans and investments to small start-up or expandingbusinesses in low-income areas. The mission focus of CDFIs allow them to adapt lendingguidelines to the needs of borrowers; accept unconventional collateral for loans; and toprovide additional education, training, and assistance to potential borrowers above andbeyond standard banks and financial institutions.
AFFORDABILITY REQUIREMENTS. Affordability requirements vary by CDFI.CDFIs typically serve urban and rural communities that lack access to credit and are notadequately served by the traditional banking industry. Most serve a particular targetgeography or market by providing financing and development services.
HOW TO APPLY. Cohousing groups should contact the local CDFI for moreinformation. For more information see http://www.cdfi.org/ andhttp://www.cdfifund.gov/ andhttp://www.cdfifund.gov/docs/certification/cdfi/CDFIbyState.pdf to see a list of CDFIsby state.

B.04 - Community Development Financial InstitutionsAffordable Cohousing Toolkit
House Hold Size 3.0 3.5 4.0 4.5 5.0 Metro Statistical Area Boulder, CO100% Area Median Income 80,200 84,650 89,100 92,650 96,200 Year 2009
50% Area Median Income 40,100 42,325 44,550 46,325 48,100
Unit type 2BR 3BRHouse Hold Size 3 4.5 30% Affordable Rent % of IncomeUtilities Allowance 90 110 30% Affordable Mortgage % of Income
Rental Calculation 2BR 3BR
Market Rent 1,500 2,000 3 3
60% AMI Affordable Rent 1,113 1,280 7 710 10
Coho Assoc. Fees 200 300 20 Units
326,991 Annual Income
Homeownership Calculation Mortgage Loan Interest Rate 6.00%2BR 3BR Mortgage Loan Amortization Yrs 30
Sales Price 250,000 330,000Closing CostsEscrow
250,000 330,000
20% Down Payment 50,000 66,0001st Mortgage 150,000 164,000
CDFI 2nd Mortgage 50,000 100,000 Total Soft 2nd Mort
0.071946 Monthly 1st Mortgage Payment 899 9830.589% Taxes 123 162
Insurance 50 75Ownership Monthly Scenario 1,072 1,220
2BR 3BR
Market Mortgage Payment 1,500 2,000 5 5
60% AMI Affordable Mortgage Payment 1,113 1,280 5 510 10
Coho Assoc. Fees 200 300 20 Units
Total Sales5,800,000
750,000

Capital Sources and Uses
Sources UsesTotal Per Unit Total Per Unit
145,000 Ownership Sales 37,500 Acquisition Costs
105,000 CDFI 1st Mortgage 4.00% 30 0.0573 1.10 187,500 Hard Costs
0 5,188,783 Max Rental 1st 18,750 Soft Costs0 6,250 Financing Costs0 0 Other
250,000 Total Sources Surplus/(GAP) 250,000 Total Uses
Annual Operating Income and Expenses 3.00% Income Trending4.00% Expense Trending
Per UnitPer Mo Yr 1 Yr 2 Yr 3 Yr 4 Yr 5 Yr 6 Yr 7 Yr 8 Yr 9 Yr 10
IncomeRental Income 326,991 336,801 346,905 357,312 368,031 379,072 390,444 402,158 414,222 426,649Coho Assoc. Fees 250 120,000 123,600 127,308 131,127 135,061 139,113 143,286 147,585 152,012 156,573Other 25 12,000 12,360 12,731 13,113 13,506 13,911 14,329 14,758 15,201 15,657(Vacancy) -10% (96) (45,899) (47,276) (48,694) (50,155) (51,660) (53,210) (54,806) (56,450) (58,144) (59,888)Total Income 179 413,092 425,485 438,249 451,397 464,939 478,887 493,253 508,051 523,292 538,991
Per UnitPer Yr
ExpensesProperty Management Fee 500 20,000 20,800 21,632 22,497 23,397 24,333 25,306 26,319 27,371 28,466Asset Management Fee 400 16,000 16,640 17,306 17,998 18,718 19,466 20,245 21,055 21,897 22,773Maintenance & Repairs 800 32,000 33,280 34,611 35,996 37,435 38,933 40,490 42,110 43,794 45,546Electricity 200 8,000 8,320 8,653 8,999 9,359 9,733 10,123 10,527 10,949 11,386Water & Sewer 100 4,000 4,160 4,326 4,499 4,679 4,867 5,061 5,264 5,474 5,693Fuel & Gas 150 6,000 6,240 6,490 6,749 7,019 7,300 7,592 7,896 8,211 8,540Taxes/PILOT 100 4,000 4,160 4,326 4,499 4,679 4,867 5,061 5,264 5,474 5,693Insurance 400 16,000 16,640 17,306 17,998 18,718 19,466 20,245 21,055 21,897 22,773Other Coho Expenses 250 10,000 10,400 10,816 11,249 11,699 12,167 12,653 13,159 13,686 14,233Replacement Reserves 300 12,000 12,480 12,979 13,498 14,038 14,600 15,184 15,791 16,423 17,080Total Expenses 3,200 128,000 133,120 138,445 143,983 149,742 155,732 161,961 168,439 175,177 182,184
Net Operating Income (NOI) 285,092 292,365 299,804 307,414 315,197 323,155 331,292 339,612 348,116 356,807
Total Rental Debt Service 240,617 240,617 240,617 240,617 240,617 240,617 240,617 240,617 240,617 240,617Rental Debt Service Coverage Ratio 1.18 1.22 1.25 1.28 1.31 1.34 1.38 1.41 1.45 1.48
Cash Flow 44,475 51,747 59,187 66,797 74,579 82,538 90,675 98,994 107,498 116,190
10,000,000 0 10,000,000
750,000250,000
5,800,000 1,500,000
4,200,000 7,500,000

70
B.05 Private Buyer & Investor Model
GENERAL DESCRIPTION. Cohousing groups may be able to use the private buyer andinvestor model as low-cost financing. The private buyer and investor model create a realestate purchase and rental cash flow structure that provides more affordable andcommunity sustainable housing to buyers and/or renters while concurrently beingattractive to potential private investors, banks and/or private funding institutions.
ELIGIBLE PROJECTS. Cohousing projects that are rental or homeownership may beeligible. While cohousing groups can design their own program, one model uses “Soft”2nd mortgages in amounts ranging from $40,000-$60,000 to low income buyers (Buyer)from private investors (Community Investors). These Community Investors could make areturn on investment (ROI) if there is a profit on resale and/or if the community Buyerstops being a community participant. The Community Investors receives ROI of 33% ofany future net resale profit and/or a certain amount per month if Buyer stops being acommunity participant for 3 consecutive months. Community Participation, for example,could be hosting one community meal plus one event per month that at least 25% ofcommunity households attend and attending at least one community meal and event permonth.
AFFORDABILITY REQUIREMENTS. Each cohousing group can design its ownprogram. If the Community, or a Community Investor, decided to exercise their firstright of refusal to buy this property from the low-income owner (Seller), they would haveto pay back the Seller’s original investment plus a fixed amount of profit. If the 2ndmortgage holder wanted to be paid off at the time of resale, the community buyer’s costwould increase. This community repurchase option allows the community to resell or rentthis property to another community focused renter/buyer under the same “communityparticipation” terms as described above thus repeating the ‘more affordable’ rent-to-buyhousing cycle.
HOW TO APPLY. Each cohousing group can design its own program.
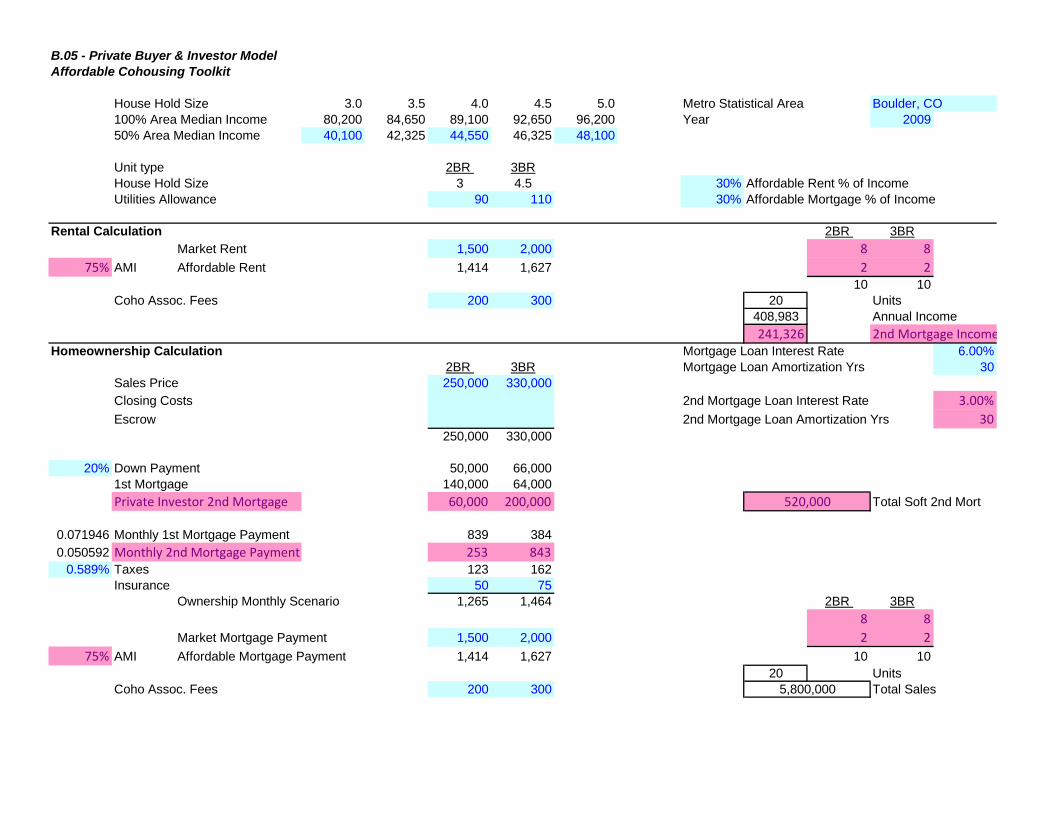
B.05 - Private Buyer & Investor ModelAffordable Cohousing Toolkit
House Hold Size 3.0 3.5 4.0 4.5 5.0 Metro Statistical Area Boulder, CO100% Area Median Income 80,200 84,650 89,100 92,650 96,200 Year 2009
50% Area Median Income 40,100 42,325 44,550 46,325 48,100
Unit type 2BR 3BRHouse Hold Size 3 4.5 30% Affordable Rent % of IncomeUtilities Allowance 90 110 30% Affordable Mortgage % of Income
Rental Calculation 2BR 3BR
Market Rent 1,500 2,000 8 8
75% AMI Affordable Rent 1,414 1,627 2 210 10
Coho Assoc. Fees 200 300 20 Units408,983 Annual Income
241,326 2nd Mortgage IncomeHomeownership Calculation Mortgage Loan Interest Rate 6.00%
2BR 3BR Mortgage Loan Amortization Yrs 30Sales Price 250,000 330,000
Closing Costs 2nd Mortgage Loan Interest Rate 3.00%
Escrow 2nd Mortgage Loan Amortization Yrs 30250,000 330,000
20% Down Payment 50,000 66,0001st Mortgage 140,000 64,000
Private Investor 2nd Mortgage 60,000 200,000 Total Soft 2nd Mort
0.071946 Monthly 1st Mortgage Payment 839 384
0.050592 Monthly 2nd Mortgage Payment 253 8430.589% Taxes 123 162
Insurance 50 75Ownership Monthly Scenario 1,265 1,464 2BR 3BR
8 8
Market Mortgage Payment 1,500 2,000 2 2
75% AMI Affordable Mortgage Payment 1,414 1,627 10 10
20 UnitsCoho Assoc. Fees 200 300 Total Sales5,800,000
520,000
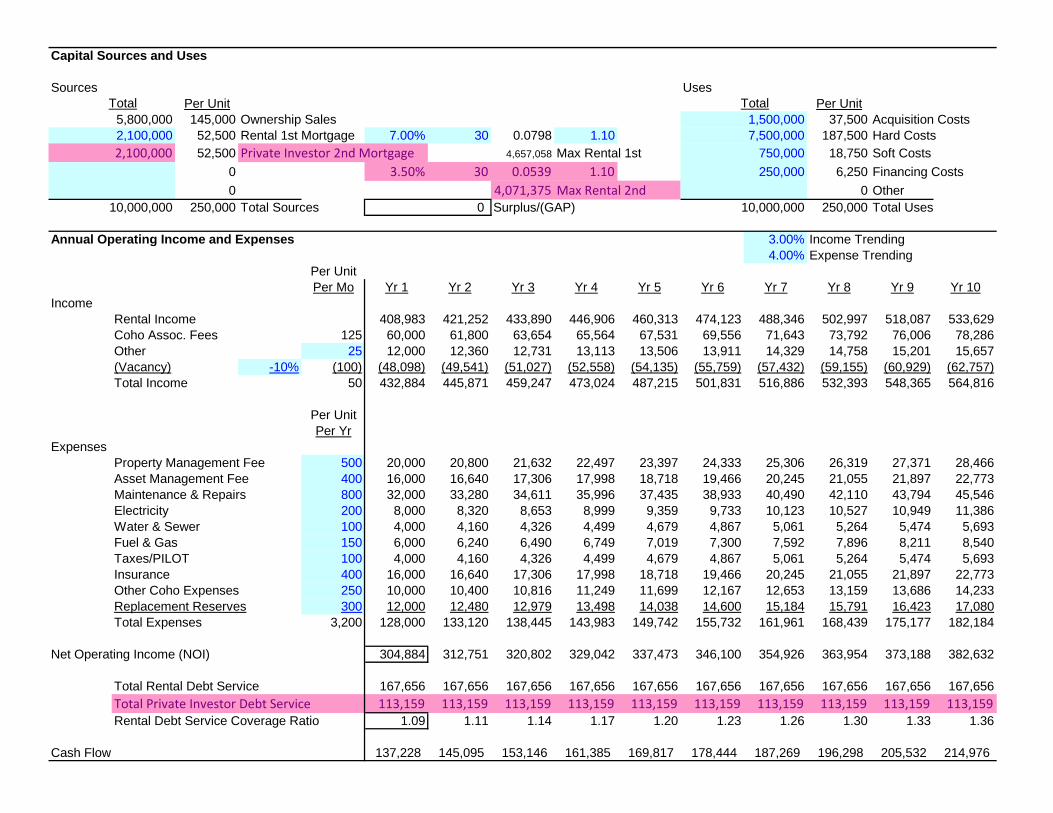
Capital Sources and Uses
Sources UsesTotal Per Unit Total Per Unit
145,000 Ownership Sales 37,500 Acquisition Costs
52,500 Rental 1st Mortgage 7.00% 30 0.0798 1.10 187,500 Hard Costs
52,500 Private Investor 2nd Mortgage 4,657,058 Max Rental 1st 18,750 Soft Costs
0 3.50% 30 0.0539 1.10 6,250 Financing Costs
0 4,071,375 Max Rental 2nd 0 Other
250,000 Total Sources Surplus/(GAP) 250,000 Total Uses
Annual Operating Income and Expenses 3.00% Income Trending4.00% Expense Trending
Per UnitPer Mo Yr 1 Yr 2 Yr 3 Yr 4 Yr 5 Yr 6 Yr 7 Yr 8 Yr 9 Yr 10
IncomeRental Income 408,983 421,252 433,890 446,906 460,313 474,123 488,346 502,997 518,087 533,629Coho Assoc. Fees 125 60,000 61,800 63,654 65,564 67,531 69,556 71,643 73,792 76,006 78,286Other 25 12,000 12,360 12,731 13,113 13,506 13,911 14,329 14,758 15,201 15,657(Vacancy) -10% (100) (48,098) (49,541) (51,027) (52,558) (54,135) (55,759) (57,432) (59,155) (60,929) (62,757)Total Income 50 432,884 445,871 459,247 473,024 487,215 501,831 516,886 532,393 548,365 564,816
Per UnitPer Yr
ExpensesProperty Management Fee 500 20,000 20,800 21,632 22,497 23,397 24,333 25,306 26,319 27,371 28,466Asset Management Fee 400 16,000 16,640 17,306 17,998 18,718 19,466 20,245 21,055 21,897 22,773Maintenance & Repairs 800 32,000 33,280 34,611 35,996 37,435 38,933 40,490 42,110 43,794 45,546Electricity 200 8,000 8,320 8,653 8,999 9,359 9,733 10,123 10,527 10,949 11,386Water & Sewer 100 4,000 4,160 4,326 4,499 4,679 4,867 5,061 5,264 5,474 5,693Fuel & Gas 150 6,000 6,240 6,490 6,749 7,019 7,300 7,592 7,896 8,211 8,540Taxes/PILOT 100 4,000 4,160 4,326 4,499 4,679 4,867 5,061 5,264 5,474 5,693Insurance 400 16,000 16,640 17,306 17,998 18,718 19,466 20,245 21,055 21,897 22,773Other Coho Expenses 250 10,000 10,400 10,816 11,249 11,699 12,167 12,653 13,159 13,686 14,233Replacement Reserves 300 12,000 12,480 12,979 13,498 14,038 14,600 15,184 15,791 16,423 17,080Total Expenses 3,200 128,000 133,120 138,445 143,983 149,742 155,732 161,961 168,439 175,177 182,184
Net Operating Income (NOI) 304,884 312,751 320,802 329,042 337,473 346,100 354,926 363,954 373,188 382,632
Total Rental Debt Service 167,656 167,656 167,656 167,656 167,656 167,656 167,656 167,656 167,656 167,656
Total Private Investor Debt Service 113,159 113,159 113,159 113,159 113,159 113,159 113,159 113,159 113,159 113,159Rental Debt Service Coverage Ratio 1.09 1.11 1.14 1.17 1.20 1.23 1.26 1.30 1.33 1.36
Cash Flow 137,228 145,095 153,146 161,385 169,817 178,444 187,269 196,298 205,532 214,976
10,000,000 0 10,000,000
2,100,000 750,000
250,000
5,800,000 1,500,000
2,100,000 7,500,000
73
B.06 Private Foundation Grants
GENERAL DESCRIPTION. Cohousing groups may be able to use private foundationgrants as capital or operating subsidy or low-cost financing. Foundations are private,nonprofit organizations that are governed by federal and state law and regulated by theInternal Revenue Services. Private foundations make grants, in large to non-profit taxexempt organizations, based on charitable endowments. The endowment funds comefrom an individual, a family or a corporation or in the case of community foundationsfrom many individuals, families and organizations. By partnering with non-profitorganizations, Cohousing groups may be able to access foundation funding. Foundationfunding is often used with other internal subsidies that including community land trustsand private self-financing to subsidize rental and ownership affordable units.
ELIGIBLE PROJECTS. Varies by foundation. Foundations make grants for virtuallyany charitable purpose but most have a specific focus and many restrict grants to ageographical area.
AFFORDABILITY REQUIREMENTS. Varies by foundation.
HOW TO APPLY. Cohousing groups should contact local foundations and non-profitorganizations involved in low-income housing. Application procedures vary byfoundation. For more information see http://foundationcenter.org/.

B.06 - Private Foundation GrantsAffordable Cohousing Toolkit
House Hold Size 3.0 3.5 4.0 4.5 5.0 Metro Statistical Area Boulder, CO100% Area Median Income 80,200 84,650 89,100 92,650 96,200 Year 2009
50% Area Median Income 40,100 42,325 44,550 46,325 48,100
Unit type 2BR 3BRHouse Hold Size 3 4.5 30% Affordable Rent % of IncomeUtilities Allowance 90 110 30% Affordable Mortgage % of Income
Rental Calculation 2BR 3BR
Market Rent 1,500 2,000 7 7
60% AMI Affordable Rent 1,113 1,280 3 310 10
Coho Assoc. Fees 200 300 20 Units
380,139 Annual Income
Homeownership Calculation Mortgage Loan Interest Rate 6.00%2BR 3BR Mortgage Loan Amortization Yrs 30
Sales Price 250,000 330,000Closing CostsEscrow
250,000 330,000
20% Down Payment 50,000 66,0001st Mortgage 150,000 164,000
Private Foundation 2nd Mortgage 50,000 100,000 Total Soft 2nd Mort
0.071946 Monthly 1st Mortgage Payment 899 9830.589% Taxes 123 162
Insurance 50 75Ownership Monthly Scenario 1,072 1,220
2BR 3BR
Market Mortgage Payment 1,500 2,000 5 5
60% AMI Affordable Mortgage Payment 1,113 1,280 5 510 10
Coho Assoc. Fees 200 300 20 Units
Total Sales
750,000
5,800,000

Capital Sources and Uses
Sources UsesTotal Per Unit Total Per Unit
145,000 Ownership Sales 37,500 Acquisition Costs
92,500 Rental 1st Mortgage 7.00% 30 0.0798 1.10 187,500 Hard Costs
12,500 Private Foundation Grant 4,328,619 Max Rental 1st 18,750 Soft Costs
0 6,250 Financing Costs0 0 Other
250,000 Total Sources Surplus/(GAP) 250,000 Total Uses
Annual Operating Income and Expenses 3.00% Income Trending4.00% Expense Trending
Per UnitPer Mo Yr 1 Yr 2 Yr 3 Yr 4 Yr 5 Yr 6 Yr 7 Yr 8 Yr 9 Yr 10
IncomeRental Income 380,139 391,543 403,289 415,388 427,850 440,685 453,906 467,523 481,549 495,995Coho Assoc. Fees 250 120,000 123,600 127,308 131,127 135,061 139,113 143,286 147,585 152,012 156,573Other 25 12,000 12,360 12,731 13,113 13,506 13,911 14,329 14,758 15,201 15,657(Vacancy) -10% (107) (51,214) (52,750) (54,333) (55,963) (57,642) (59,371) (61,152) (62,987) (64,876) (66,823)Total Income 168 460,925 474,753 488,995 503,665 518,775 534,339 550,369 566,880 583,886 601,403
Per UnitPer Yr
ExpensesProperty Management Fee 500 20,000 20,800 21,632 22,497 23,397 24,333 25,306 26,319 27,371 28,466Asset Management Fee 400 16,000 16,640 17,306 17,998 18,718 19,466 20,245 21,055 21,897 22,773Maintenance & Repairs 800 32,000 33,280 34,611 35,996 37,435 38,933 40,490 42,110 43,794 45,546Electricity 200 8,000 8,320 8,653 8,999 9,359 9,733 10,123 10,527 10,949 11,386Water & Sewer 100 4,000 4,160 4,326 4,499 4,679 4,867 5,061 5,264 5,474 5,693Fuel & Gas 150 6,000 6,240 6,490 6,749 7,019 7,300 7,592 7,896 8,211 8,540Taxes/PILOT 100 4,000 4,160 4,326 4,499 4,679 4,867 5,061 5,264 5,474 5,693Insurance 400 16,000 16,640 17,306 17,998 18,718 19,466 20,245 21,055 21,897 22,773Other Coho Expenses 250 10,000 10,400 10,816 11,249 11,699 12,167 12,653 13,159 13,686 14,233Replacement Reserves 300 12,000 12,480 12,979 13,498 14,038 14,600 15,184 15,791 16,423 17,080Total Expenses 3,200 128,000 133,120 138,445 143,983 149,742 155,732 161,961 168,439 175,177 182,184
Net Operating Income (NOI) 332,925 341,633 350,551 359,683 369,033 378,607 388,408 398,440 408,709 419,219
Total Rental Debt Service 295,394 295,394 295,394 295,394 295,394 295,394 295,394 295,394 295,394 295,394Rental Debt Service Coverage Ratio 1.13 1.16 1.19 1.22 1.25 1.28 1.31 1.35 1.38 1.42
Cash Flow 37,531 46,239 55,156 64,288 73,639 83,213 93,014 103,046 113,315 123,824
10,000,000 0 10,000,000
500,000 750,000
250,000
5,800,000 1,500,000
3,700,000 7,500,000

76
C. General Affordable Housing Mechanisms

77
C.01 Community Land Trusts
GENERAL DESCRIPTION. Cohousing groups may be able to use the community landtrust mechanism as a vehicle for continued affordability. A community land trust (CLT)is a nonprofit, community-based organization whose mission is to provide affordablehousing in perpetuity by owning land and leasing it to those who live in houses built onthat land. The CLT model has strong similarities to cohousing concepts of long-termcommunity, the control of neighborhood resources, the empowerment of residentsthrough involvement and participation in the organization. The key aspect of a CLT is topreserve the affordability of housing permanently by allowing a buyer to purchase ahouse without the land.
ELIGIBLE PROJECTS. Cohousing projects that are rental or homeownership may beeligible. The CLT acquires multiple parcels of land throughout a targeted geographicarea with the intention of retaining ownership of these parcels forever. Because valueincreases in land often exceeds that of structures, if the land is excluded from the price ofhousing, affordability for that housing may be assured over time. CLTs acquire and holdthe land and leases it for a nominal fee to individuals who own the buildings on the land.By owning the land, CLTs are able to greatly reduce the initial housing cost to thepotential buyer because the cost of land is minimized or eliminated. The community landtrust and the homeowner agree to a long-term ground lease agreement. The land leasesprovide for the exclusive use of the land by the owners of any buildings located there.These leases are typically long-term (e.g. 99 years) and renewable, and often arestructured to be assignable to the heirs of the leaseholder. The ground lease oftenrequires owner-occupancy and responsible use of the premises. Other features include theright for the CLT to step in and force repairs, if the property is not properly maintained,and the right to step in and cure the default, forestalling foreclosure, should propertyowners default on their mortgages.
AFFORDABILITY REQUIREMENTS. Each cohousing group can design its ownprogram. One model provides for limited equity upon resale. These CLTs often retain anoption to repurchase any home located upon its land, should the homeowner ever chooseto sell. The CLT has the right to purchase the house when and if the owner wants to sell.This option is a tool to enforce the "limited equity" policies and formulas that restrict theresale price of the housing in order to maintain its long-term affordability. The resaleprice is set by a formula contained in the ground lease that is designed to give presenthomeowners a fair return on their investment, while giving future homebuyers fair accessto housing at an affordable price. The resale provision can also ensure that it goes toanother low or moderate income person. The buyer agrees to limit the amount of profitthey make on the house sale in order to insure that the property remains affordable for thenext person. In this way the commitment to preserving the affordability of housing ispassed on from one owner to another, in perpetuity.
HOW TO APPLY. Each community can design its own program. For more informationsee http://www.cltnetwork.org.
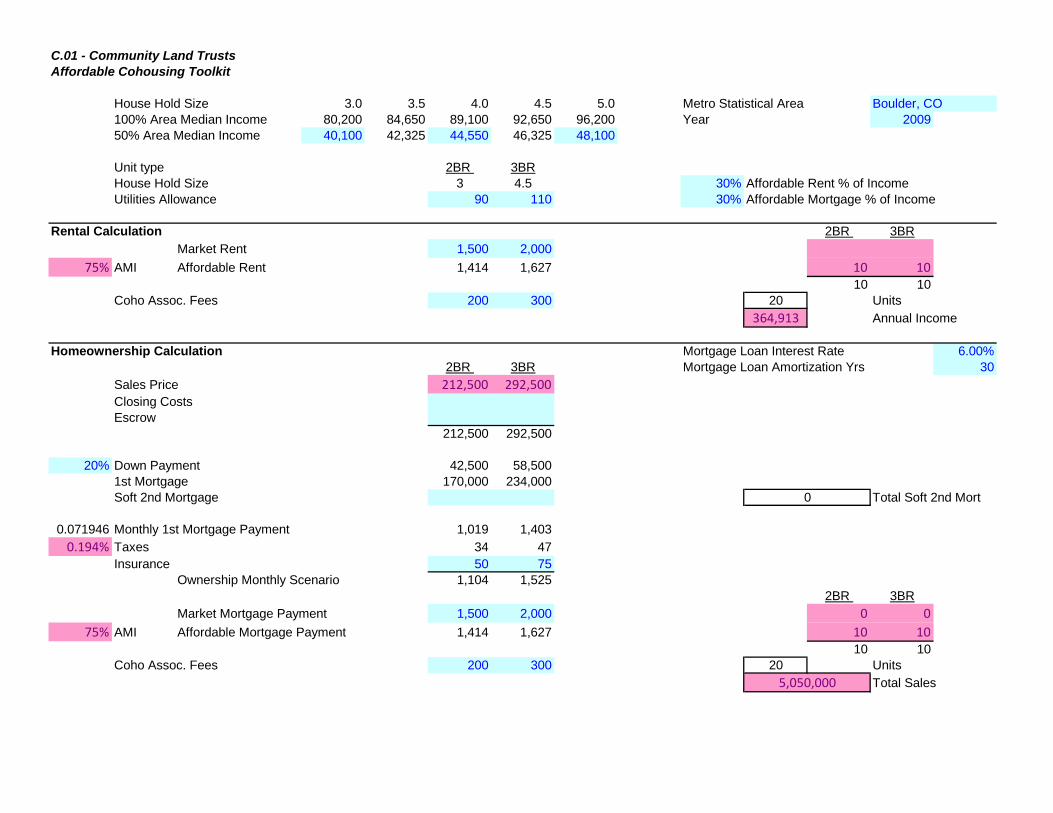
C.01 - Community Land TrustsAffordable Cohousing Toolkit
House Hold Size 3.0 3.5 4.0 4.5 5.0 Metro Statistical Area Boulder, CO100% Area Median Income 80,200 84,650 89,100 92,650 96,200 Year 2009
50% Area Median Income 40,100 42,325 44,550 46,325 48,100
Unit type 2BR 3BRHouse Hold Size 3 4.5 30% Affordable Rent % of IncomeUtilities Allowance 90 110 30% Affordable Mortgage % of Income
Rental Calculation 2BR 3BR
Market Rent 1,500 2,000
75% AMI Affordable Rent 1,414 1,627 10 1010 10
Coho Assoc. Fees 200 300 20 Units
364,913 Annual Income
Homeownership Calculation Mortgage Loan Interest Rate 6.00%2BR 3BR Mortgage Loan Amortization Yrs 30
Sales Price 212,500 292,500Closing CostsEscrow
212,500 292,500
20% Down Payment 42,500 58,5001st Mortgage 170,000 234,000Soft 2nd Mortgage Total Soft 2nd Mort
0.071946 Monthly 1st Mortgage Payment 1,019 1,403
0.194% Taxes 34 47
Insurance 50 75Ownership Monthly Scenario 1,104 1,525
2BR 3BR
Market Mortgage Payment 1,500 2,000 0 0
75% AMI Affordable Mortgage Payment 1,414 1,627 10 1010 10
Coho Assoc. Fees 200 300 20 Units
Total Sales5,050,000
0

Capital Sources and Uses
Sources UsesTotal Per Unit Total Per Unit
126,250 Ownership Sales 0 Acquisition Costs
86,250 Rental 1st Mortgage 7.00% 30 0.0798 1.10 187,500 Hard Costs
0 4,155,236 Max Rental 1st 18,750 Soft Costs0 6,250 Financing Costs0 0 Other
212,500 Total Sources Surplus/(GAP) 212,500 Total Uses
Annual Operating Income and Expenses 3.00% Income Trending4.00% Expense Trending
Per UnitPer Mo Yr 1 Yr 2 Yr 3 Yr 4 Yr 5 Yr 6 Yr 7 Yr 8 Yr 9 Yr 10
IncomeRental Income 364,913 375,860 387,136 398,750 410,712 423,034 435,725 448,796 462,260 476,128Coho Assoc. Fees 250 120,000 123,600 127,308 131,127 135,061 139,113 143,286 147,585 152,012 156,573Other 25 12,000 12,360 12,731 13,113 13,506 13,911 14,329 14,758 15,201 15,657(Vacancy) -10% (104) (49,691) (51,182) (52,717) (54,299) (55,928) (57,606) (59,334) (61,114) (62,947) (64,836)Total Income 171 447,221 460,638 474,457 488,691 503,351 518,452 534,006 550,026 566,526 583,522
Per UnitPer Yr
ExpensesProperty Management Fee 500 20,000 20,800 21,632 22,497 23,397 24,333 25,306 26,319 27,371 28,466Asset Management Fee 400 16,000 16,640 17,306 17,998 18,718 19,466 20,245 21,055 21,897 22,773Maintenance & Repairs 800 32,000 33,280 34,611 35,996 37,435 38,933 40,490 42,110 43,794 45,546Electricity 200 8,000 8,320 8,653 8,999 9,359 9,733 10,123 10,527 10,949 11,386Water & Sewer 100 4,000 4,160 4,326 4,499 4,679 4,867 5,061 5,264 5,474 5,693Fuel & Gas 150 6,000 6,240 6,490 6,749 7,019 7,300 7,592 7,896 8,211 8,540Taxes/PILOT 100 4,000 4,160 4,326 4,499 4,679 4,867 5,061 5,264 5,474 5,693Insurance 400 16,000 16,640 17,306 17,998 18,718 19,466 20,245 21,055 21,897 22,773Other Coho Expenses 250 10,000 10,400 10,816 11,249 11,699 12,167 12,653 13,159 13,686 14,233Replacement Reserves 300 12,000 12,480 12,979 13,498 14,038 14,600 15,184 15,791 16,423 17,080Total Expenses 3,200 128,000 133,120 138,445 143,983 149,742 155,732 161,961 168,439 175,177 182,184
Net Operating Income (NOI) 319,221 327,518 336,012 344,708 353,610 362,720 372,045 381,586 391,350 401,338
Total Rental Debt Service 275,435 275,435 275,435 275,435 275,435 275,435 275,435 275,435 275,435 275,435Rental Debt Service Coverage Ratio 1.16 1.19 1.22 1.25 1.28 1.32 1.35 1.39 1.42 1.46
Cash Flow 43,786 52,083 60,577 69,273 78,174 87,285 96,609 106,151 115,914 125,903
8,500,000 0 8,500,000
750,000250,000
5,050,000 0
3,450,000 7,500,000

80
C.02 Small House Design
GENERAL DESCRIPTION. Cohousing groups may be able to use the small housedesign model as a method to decrease construction costs. Small House Design is aconcept that will integrate small house design, cohousing and pocket neighborhoodplanning, and community building with dynamic governance. Affordability will beaddressed through small and simple, yet quality and creative design, along withopportunities for co-ownership and owner builder involvement.
ELIGIBLE PROJECTS. Cohousing projects that are rental or ownership may be eligible.Each cohousing group can design its own program. One model has zoning conducive tobuilding eight to twelve houses with design parameters of 300 to 1000 square feet offloor space. House plans will provide loft, one, and two bedroom options. Open floorplans will be standard for optimal space efficiency. Construction will follow standardsfor energy efficiency, nontoxic material, and resource conservation. Site planning withcommon green space will be designed for optimal community interaction. Neighborhoodwill be walkable and child friendly. Opportunities will be developed to provide co-ownership, rentals, and owner builder involvement as strategies for affordability.
AFFORDABILITY REQUIREMENTS. Each cohousing group can design its ownprogram. One model has price projection per house ranging between $65,000 and$200,000.
HOW TO APPLY. Each cohousing group can design its own program.

C.02 - Small House DesignAffordable Cohousing Toolkit
House Hold Size 3.0 3.5 4.0 4.5 5.0 Metro Statistical Area Boulder, CO100% Area Median Income 80,200 84,650 89,100 92,650 96,200 Year 2009
50% Area Median Income 40,100 42,325 44,550 46,325 48,100
Unit type 2BR 3BRHouse Hold Size 3 4.5 30% Affordable Rent % of Income
Utilities Allowance 90 110 30% Affordable Mortgage % of Income
Rental Calculation 2BR 3BR
Market Rent 750 1,000 0 0
40% AMI Affordable Rent 712 817 10 1010 10
Coho Assoc. Fees 200 300 20 Units
183,420 Annual Income
Homeownership Calculation Mortgage Loan Interest Rate 6.00%2BR 3BR Mortgage Loan Amortization Yrs 30
Sales Price 150,000 200,000Closing CostsEscrow
150,000 200,000
20% Down Payment 30,000 40,0001st Mortgage 120,000 160,000Soft 2nd Mortgage Total Soft 2nd Mort
0.071946 Monthly 1st Mortgage Payment 719 959
0.194% Taxes 24 32
Insurance 25 37Ownership Monthly Scenario 769 1,029
2BR 3BR
Market Mortgage Payment 750 1,000 0 0
40% AMI Affordable Mortgage Payment 712 817 10 1010 10
Coho Assoc. Fees 200 300 20 Units
Total Sales3,500,000
0

Capital Sources and Uses
Sources UsesTotal Per Unit Total Per Unit
87,500 Ownership Sales 18,750 Acquisition Costs
37,500 Rental 1st Mortgage 7.00% 30 0.0798 1.10 93,750 Hard Costs
0 2,088,592 Max Rental 1st 9,375 Soft Costs
0 3,125 Financing Costs
0 0 Other125,000 Total Sources Surplus/(GAP) 125,000 Total Uses
Annual Operating Income and Expenses 3.00% Income Trending4.00% Expense Trending
Per UnitPer Mo Yr 1 Yr 2 Yr 3 Yr 4 Yr 5 Yr 6 Yr 7 Yr 8 Yr 9 Yr 10
IncomeRental Income 183,420 188,923 194,590 200,428 206,441 212,634 219,013 225,583 232,351 239,321Coho Assoc. Fees 250 120,000 123,600 127,308 131,127 135,061 139,113 143,286 147,585 152,012 156,573Other 25 12,000 12,360 12,731 13,113 13,506 13,911 14,329 14,758 15,201 15,657(Vacancy) -10% (66) (31,542) (32,488) (33,463) (34,467) (35,501) (36,566) (37,663) (38,793) (39,956) (41,155)Total Income 209 283,878 292,394 301,166 310,201 319,507 329,092 338,965 349,134 359,608 370,396
Per UnitPer Yr
ExpensesProperty Management Fee 500 20,000 20,800 21,632 22,497 23,397 24,333 25,306 26,319 27,371 28,466Asset Management Fee 400 16,000 16,640 17,306 17,998 18,718 19,466 20,245 21,055 21,897 22,773Maintenance & Repairs 800 32,000 33,280 34,611 35,996 37,435 38,933 40,490 42,110 43,794 45,546Electricity 200 8,000 8,320 8,653 8,999 9,359 9,733 10,123 10,527 10,949 11,386Water & Sewer 100 4,000 4,160 4,326 4,499 4,679 4,867 5,061 5,264 5,474 5,693Fuel & Gas 150 6,000 6,240 6,490 6,749 7,019 7,300 7,592 7,896 8,211 8,540Taxes/PILOT 100 4,000 4,160 4,326 4,499 4,679 4,867 5,061 5,264 5,474 5,693Insurance 400 16,000 16,640 17,306 17,998 18,718 19,466 20,245 21,055 21,897 22,773Other Coho Expenses 250 10,000 10,400 10,816 11,249 11,699 12,167 12,653 13,159 13,686 14,233Replacement Reserves 300 12,000 12,480 12,979 13,498 14,038 14,600 15,184 15,791 16,423 17,080Total Expenses 3,200 128,000 133,120 138,445 143,983 149,742 155,732 161,961 168,439 175,177 182,184
Net Operating Income (NOI) 155,878 159,274 162,721 166,219 169,765 173,361 177,004 180,695 184,431 188,212
Total Rental Debt Service 119,754 119,754 119,754 119,754 119,754 119,754 119,754 119,754 119,754 119,754Rental Debt Service Coverage Ratio 1.30 1.33 1.36 1.39 1.42 1.45 1.48 1.51 1.54 1.57
Cash Flow 36,124 39,520 42,967 46,464 50,011 53,606 57,250 60,940 64,677 68,458
5,000,000 0 5,000,000
375,000
125,000
3,500,000 750,000
1,500,000 3,750,000