AFFECTIVE REACTIONS AND PSYCHOSOCIAL FUNCTIONING OF .../67531/metadc2210/m2/1/high_res_d ·...
121
AFFECTIVE REACTIONS AND PSYCHOSOCIAL FUNCTIONING OF CHILDREN IN THE COURSE OF PSYCHO-EDUCATIONAL ASSESSMENT Martha Buenrostro, B.S.W., M.A. Dissertation Prepared for the Degree of DOCTOR OF PHILOSOPHY UNIVERSITY OF NORTH TEXAS August 1999 APPROVED: Persephanie Silverthorn, Major Professor Kenneth Sewell, Committee Member Thomas Boyle, Committee Member Clifford Hardy, Committee Member Ernest Harrell, Chair of the Department of Psychology C. Neal Tate, Dean of the Robert B. Toulouse School of Graduate Studies
Transcript of AFFECTIVE REACTIONS AND PSYCHOSOCIAL FUNCTIONING OF .../67531/metadc2210/m2/1/high_res_d ·...

AFFECTIVE REACTIONS AND PSYCHOSOCIAL FUNCTIONING OF CHILDREN IN
THE COURSE OF PSYCHO-EDUCATIONAL ASSESSMENT
Martha Buenrostro, B.S.W., M.A.
Dissertation Prepared for the Degree of
DOCTOR OF PHILOSOPHY
UNIVERSITY OF NORTH TEXAS
August 1999
APPROVED:
Persephanie Silverthorn, Major ProfessorKenneth Sewell, Committee MemberThomas Boyle, Committee MemberClifford Hardy, Committee MemberErnest Harrell, Chair of the Department of PsychologyC. Neal Tate, Dean of the Robert B. Toulouse School of Graduate Studies

Buenrostro, Martha, Affective Reactions and Psychosocial Functioning in
the Course of Psycho-Educational Assessment. Doctor of Philosophy (Clinical
Psychology), August, 1999, 115 pp., 9 tables, references, 75 titles.
Every day, children throughout the United States are given psychological
evaluations for many different clinical and psycho-educational purposes. Very
little research has attempted to investigate children’s responses to the
experience of having intellectual and achievement tests administered. The goal
of the current research was to explore the effect a psycho-educational evaluation
has on children in areas of self-concept and anxiety. Dependent variables
consisted of pre- and post-test measures of anxiety and self-concept. A total of
75 children in the 4th 5th and 6th grades were recruited after referral for evaluation
and possible placement in the Talented and Gifted Program or Special
Education. This study employed Analysis of Variance (ANOVA), t-tests, multiple
regression analysis, and correlational analysis. Findings included initial evidence
that children endorsed decreased anxiety after psycho-educational assessments
rather than increased anxiety, suggesting that fear of unknown situations may be
more anxiety provoking than the actual situation itself, potentially beneficial
findings for psychology and psychometric professionals who evaluate children
daily. Students endorsement of academic self-concept significantly predicted
anxiety after a psycho-educational evaluation, indicating that students who feel
capable in academic areas may endorse less anxiety after an evaluation than

students who do not feel academically capable. Finally, negative verbal
interaction with parents significantly predicted lower general self-concept scores,
providing evidence that the manner in which parents verbally relate to their
children may have significant impact for the mental health of children.

ii
ACKNOWLEDGMENTS
I wish to express my gratitude to the many employees of the Dallas Public
Schools without whose advice, assistance, and cooperation this study would not
have been completed. Numerous elementary school principals agreed to allow data
collection at their campuses. The innumerable teachers whose students were
allowed to leave class briefly to participate in the study. Additionally, my colleagues
in the Psychological, Social and Diagnostics Services Department who graciously
collected data for me while they managed their regular multifaceted and demanding
job requirements. Special thanks to my fellow interns whose support and assistance
may the task possible.

iii
TABLE OF CONTENTS
Page
LIST OF TABLES..........................................................................................……iv
Chapter
1. INTRODUCTION...........................................................................................1
Psychological AssessmentChild CharacteristicsParental CharacteristicsStatement of ProblemHypotheses
2. METHOD.....................................................................................................33
ParticipantsMeasuresProcedure
3. RESULTS....................................................................................................44
Preliminary Data AnalysisDescriptive StatisticsHypothesis TestingExploratory Analysis
4. DISCUSSION..............................................................................................53
AnxietySelf-ConceptParent CharacteristicsLimitations of the Current ResearchFuture ImplicationsFinal Conclusions
APPENDICES.................................................................................................…66
REFERENCES..............................................................................................…106

iv
LIST OF TABLES
Table Page
1. Demographic variables of student participants…………………………….….. 94
2. Means, standard deviations, range: Self-concept sub-scales……………….. 96
3. Self description questionnaire I: Sub-scale intercorrelations………………… 97
4. Post-test self-description sub-scale intercorrelations…………………………. 98
5. Means, standard deviations, range: Locus of Control sub-scales…………… 99
6. Locus of control sub-scale intercorrelations………………………………….. 101
7. Sub-scale intercorrelations among self-report variables……………………. 102
8 Means and standard deviations of STAIC-A……..………………..……….…. 104
9. Means, standard deviations and demographics of parenting style groups.. 105
1
CHAPTER I
INTRODUCTION
Every day children throughout the United States are given psychological
evaluations for many different clinical and psycho-educational purposes.
Evaluations are used to assess children for diagnosis, eligibility determination for
special programs, evaluation of progress and change, behavior problems,
physical problems, and academic problems (Salvia & Ysseldyke, 1995; Sattler,
1992). A vast body of literature is available to guide an evaluator with decisions
about which measures to use for different situations or for specific types of
referral questions (Salvia & Ysseldyke; Sattler; Kamphaus & Frick 1996).
However, there has been limited research conducted to determine what effect
these evaluations have on the children they are meant to help. The purpose of
this research was to gain an increased understanding of the way in which a
psycho-educational evaluation (also called a psychological assessment) affects
children in domains such as self-esteem/self-concept, and anxiety. Additionally,
this research examined changes in anxiety levels and perceptions of self-
concept after the assessment was completed.

2
Psychological Assessment
The Content and Purposes of Psychological Assessment
A psychological evaluation typically consists of a variety of tests designed
to elicit specific information. Green (1981) proposed that a test provides a scale
of measurement to compare consistent individual differences for a specific
psychological concept. Tests utilized by psychologists require that each person
be assessed in the same way, so that a fair and equitable comparison among
people taking the test is available. Individual scores can then be ordered and
ranked according to the specific concept. While psychologists use many different
test measures to answer a variety of specific questions, an evaluation is not
complete until intelligence and achievement have been measured.
When psychologists measure intelligence, they are assessing a person’s
ability to adjust or adapt to the environment. In other words, they are assessing
the ability to learn or the ability to perform abstract thinking (Sattler, 1992).
Measuring achievement, in contrast, may be thought of as measuring what an
individual has learned. Both intellectual measures and achievement measures
are highly structured and can be quite lengthy, lasting up to four hours when
detailed achievement information is required. According to Kamphaus and Frick
(1996) the goal of psychological assessment with children is to diagnose the
source of the child’s difficulty and to make treatment recommendations based on
this diagnosis. Without basic knowledge about information processing and

3
intellectual strengths and weaknesses, it is impossible to make helpful or realistic
recommendations designed to improve functioning.
Tests used in psychological evaluations should be norm referenced
(Sattler, 1992). The term “norm referenced” indicates that the tests have been
standardized on a clearly defined group so the score any specific individual
obtains reflects a rank within the defined group. Norm referenced tests assess
many areas including intelligence, reading, arithmetic, spelling ability, visual-
motor skills, gross and fine motor skills, and adaptive behavior. According to
Sattler, norm referenced tests are indispensable in the assessment process.
Tests utilized in psychological evaluations may have a multitude of
purposes and can be used to measure personality characteristics, neurological
damage and/or functioning, problem-solving skills, and feelings or emotions.
During a psychological evaluation or assessment, several things are considered,
such as the way a child performs a variety of tasks in different settings and
contexts and the meaning of his or her performance in terms of total functioning
(Salvia & Ysseldyke, 1995).
Preparing a Child for a Psychological Assessment
According to Sattler (1992), children are likely to have some idea about
the purposes of the tests they are given during an assessment. They may, in
fact, react adversely to the test situation. He also states that even before the
assessment begins, some children may wonder why they are being tested and
how the results will affect their future (Sattler). During a psychological evaluation,

4
the tasks children are asked to complete can be formidable. Difficult questions or
items for which a child does not know an answer may produce stress (Sattler).
Children may ask an examiner if they have answered an item correctly, or they
may become flustered when they provide incorrect answers. Sometimes, a child
may have no idea what the correct answer is, fostering frustration, anxiousness
or feelings of insecurity.
According to Brooks (1990) the self-esteem of learning disabled children
is often fragile. Therefore, when children who have experienced difficulties in
academic settings undergo psychological assessments, the test session may be
especially stressful, causing anxiety and discomfort. Often, these children
already have experienced frustration in the academic setting and may perceive
the assessment as yet another academic challenge in which they are
unsuccessful.
Skillful examiners can communicate understanding, sincerity, acceptance,
and empathy to establish rapport and decrease possible negative reactions to
the testing situation. Kamphaus and Frick (1996) suggest that in assessment,
rapport refers to the interactions between the assessor and the person being
assessed (the client) that promote confidence and cooperation in the
assessment process. Sattler (1992) proposes several ways to achieve rapport
with children during assessment to prevent any negative reactions from
impacting the child in an undesirable manner. For example, he recommends that
examiners approach children by calling them by name and introducing

5
themselves at first contact. Providing a brief but frank explanation about the
purpose for the assessment is often helpful during the examiner’s initial
conversation with the child (Sattler). Kamphaus and Frick also believe explaining
an evaluation is important; they suggest that reviewing this with the child in
developmentally appropriate language will help to eliminate misconceptions and
to reduce unnecessary anxiety.
Often when assessing children the motivation for the evaluation on the
part of the child is low since they are frequently not the person requesting or
seeking the assessment (Kamphaus & Frick, 1996). Thus, conveying a sincere
interest in seeing the child succeed while providing unconditional acceptance
and support in the event of failure is crucial to maintaining rapport throughout the
evaluation (Sattler, 1992). Kamphaus and Frick point out that establishing
rapport may also involve the cooperation of multiple participants. They suggest
that an assessor be skilled in enlisting and fostering the cooperation of the client
as well as other persons needed to complete the assessment, e.g. teachers,
parents.
With respect to the elaborate but highly structured testing portions of an
evaluation, Sattler (1992) suggests brief, natural and casual praise for the child’s
effort rather than for specific answers. In fact, he makes a subtle but important
distinction between encouraging children for their effort rather than for the results
of their effort. Encouraging children to respond to all questions despite
reluctance is important and may both reduce anxiety and sustain interest. If an

6
examiner suspects that a child has experienced frustration on an item, Sattler
suggests statements like, “That was a bit difficult, but no one is expected to get
them all right. Now let’s try another one.” (p.86) Such brief explanations are
thought to alleviate any perceived apprehension during the assessment. Helping
children maintain a sense of self-esteem and self-acceptance is key to ensuring
a successful relationship (Sattler).
Possible Childhood Reactions and Responses to Assessment
It is possible, despite the best efforts of a skilled examiner and the use of
the aforementioned techniques and suggestions, for children to leave the
assessment situation feeling frustrated or discouraged. Frustration or discomfort
after the test situation may occur because an assessment is academically
challenging. As noted, praise should be only given for effort, not accuracy
(Sattler, 1992). Thus, no confirmation of correct answers is possible during
intellectual and achievement tests. Nor is it appropriate for examiners to provide
hints or assistance with answers. The lack of confirmation about correct or
incorrect answers may create insecurity or frustration for a child. Child and
Waterhouse (1953) noted that frustration produced a decrease in the quality of
performance to the extent that the frustration evoked other responses which
interfered with the ongoing performance. It is possible, therefore, that the
frustrating aspects of the assessment may make a child uncomfortable enough
that their performance, or their perception of their performance, is negatively
affected.

7
Some children have high needs for external motivation and confirmation.
Administering a series of challenging tasks without accompanying praise for
correct answers may be stressful to those children. According to Herbert and
Cohen (1996), stress occurs when individuals perceive that environmental
demands exceed their abilities to cope. Stress may be thought of as discomfort
and may be exhibited by a variety of physical and emotional responses. These
responses may include increased anxiety, decreased self-concept, decreased
sense of competence, or in more emotionally fragile children, increases in
depression and other psychological symptomatology.
Intelligence and achievement tests utilize “ceiling levels” in their
construction (Sattler, 1992). A ceiling level is attained after several incorrect
answers and is the point at which a subtest is discontinued. In practice, this may
result in a child feeling frustrated or upset after several situations during which he
has been asked a series of questions that he is unable to answer. The continued
experience of perceived failure with the lack of confirmed correct responses
together may heighten a child’s sense of insecurity or inadequacy.
In the United States, a person’s worth is determined to a large extent by
how he or she performs. Children are increasingly judged not by their human
qualities but by their accomplishments and achievements (Medeiros, Porter &
Welch, 1983). Papay and Spielberger (1986) have also commented on the
evaluative orientation in the majority of schools, and point out that higher levels
of temporary anxiety are typically evoked by complex or difficult tasks. This
8
societal tendency may result in pressure on children that may make grades or
academic competition very important (Medeiros et al., 1983). With the high
demand for performance that is typical during a psychological assessment, it
seems possible that a child’s sense of competence or self-esteem may decrease
and/or their anxiety level may increase as a result of experiencing a
psychological evaluation.
While there are many child characteristics that are valuable to investigate,
only some of them are potentially related to a psychological assessment or
evaluation. The effect a psychological evaluation has on children can be
examined in several domains. The purpose of the current research was to
examine the effect a psychological evaluation has on children in areas of self-
concept and anxiety. Additionally, locus of control, family interaction, and
parenting style history variables were examined.
Child Characteristics
Child Self-Esteem/Self-Concept
There are a variety of words and phrases that researchers use to describe
how people feel about themselves. The words self-esteem and self-concept
typically elicit a huge variety of possible ideas and definitions. William James
(1963) first described self-esteem as the ratio of a person’s perceived success in
a certain area compared to the importance the person attaches to success in
that area. He also theorized that failure in areas a person considered
unimportant would have little impact on the person’s general self-esteem. In

9
other words, James thought that if a person did not consider a specific area
important, it would not matter to that person if he or she performed poorly in that
area. There are many children and adolescents who profess to be unconcerned
about their lack of academic success. If James’ hypothesis is true, we would
expect that children and adolescents who attach little importance to academic
endeavors would be relatively unaffected by their own poor academic progress.
Harter (1982) stated that the assessment of an individual’s self-esteem is
critical to clinicians and researchers. Because psychological evaluations are
conducted so frequently and are heavily weighted by academic tasks, it follows
that determining the impact of a psychological evaluation on a child’s self-esteem
is also critical for clinicians. While much discussion has surrounded the impact of
other childhood experiences on self-esteem, little effort, if any, has been
invested in discovering whether academically challenging psychological
evaluations are in actuality causing changes in children’s self-concept.
Many researchers have noted that research with self-esteem and self-
concept has been less than clear due to the confusion in conceptualization of the
two terms. Harter (1982) identified problems with vague definitions of self-
esteem and self-concept in the literature. Burnett (1994) pointed out difficulties
concerning the delineation of the terms in psychosocial research. Additionally,
Burnett stated that the distinctions between the two constructs, as well as the link
between them, were not clear. After a comprehensive review of self-concept
research Marsh and his colleagues (1983b, 1985) concluded that many studies
10
of self-concept lack theoretical bases, have methodological shortcomings, use
imprecise definitions of self-concept and result in inconsistent findings.
According to Marsh and his colleagues (1985) self-concept is a common
personality construct, and therefore, researchers do not feel compelled to offer
theoretical or empirical support for self-esteem and self-concept constructs. In
fact, after lengthy literature reviews and research, Marsh and his colleagues
(1983a), claim there is no empirical support for the distinction between self-
esteem and self-concept.
These challenges in defining constructs have resulted in a variety of self-
esteem definitions by researchers. For example, Harter (1990 p.225) defined
self-esteem as “how much a person likes, accepts and respects himself [sic]
overall as a person.” Shavelson and Bolus (1982) broadly defined self-concept
as a person’s perception of themselves. They postulated that a person’s
perceptions are formed through experiences and interpretation of their
environment while being influenced by evaluations from significant others,
reinforcements, and attributions made about their behavior (Shavelson & Bolus).
After a literature review on self-concept and self-esteem, Burnett (1994)
proposed that self-concept has a cognitive and comparative belief about one’s
characteristics while self-esteem has a global cognitive and affective/feeling
orientation, focusing on how an individual feels about him or herself as a person.
In other words, in Burnett’s opinion, self-concept has more to do with thinking
and the way one compares oneself to others while self-esteem indicates a
11
feeling or emotional construct (Burnett, 1994). Most recently, Zimmerman,
Copeland, Shope & Dielman (1997) defined self-esteem as the evaluation
people make about themselves that expresses a self-judgment of approval,
disapproval, and personal worth
Along with confusion regarding the definitions of self-concept and self-
esteem, there are also different theories about how they are structured.
Shavelson and Bolus (1982) proposed that self-concept had both a descriptive
and an evaluative dimension whereby individuals may describe themselves e.g.,
I am happy and evaluate themselves e.g., I do well in school. Self-concept
becomes increasingly multifaceted as the individual develops from infancy to
adulthood. This Shavelson and Bolus theory of self-concept is hierarchical in
nature, multifaceted, and includes perceptions of behavior at the base with
inferences about self in general at the next level. They proposed that general
self-concept should be at the apex of the self-concept hierarchy with situation-
specific self-concepts low in the hierarchy. Their rationale for the structure of the
hierarchy was in part defended by the fact that measures of academic self-
concept and indices of achievement tend to correlate higher than correlations
between general self-concept and achievement. Shavelson and Bolus found
support for their multi-faceted interpretation of self-concept, but pointed out that
empirical testing of its hierarchical structure was lacking.
Marsh and his colleagues (1983a, 1983b) have found empirical support
for Shavelson’s hierarchical model of self-concept and pointed out that the

12
dimensions of self-concept do appear to be hierarchically arranged; though they
may not be in the particular arrangement suggested by Shavelson and Bolus
(1982).
With different definitions and models for self-esteem and self-concept
there are a variety of ways in which self-esteem in children and adolescents has
been measured over the years. Coopersmith (1967) and Piers and Harris (1964)
were some of the first researchers to quantify, measure, and describe self-
esteem with children and adolescents. According to Harter (1982), Coopersmith
assumed that children did not make distinctions among the domains in their
lives. His measure, therefore, could not separate differences in a child’s self-
concept in diverse areas. Harter theorized that children do not feel equally
competent in every skill domain. Her model of competence motivation for use
with children placed an emphasis on the child’s perception of competence
(Harter, 1990).
While there is still disagreement and difficulty defining the terms self-
esteem and self-concept, recent research with self-esteem and self-concept has
provided more information about the constructs. Low self-esteem has been
correlated in adolescence with low life satisfaction, loneliness, anxiety,
resentment, irritability, and depression (Chubb, Fertman & Ross 1997), and with
suicide, delinquency, substance use and poor academic outcomes (Zimmerman
et al., 1997). High self-esteem has been associated with academic success,
internal locus of control, and positive sense of self-attractiveness (Chubb et al.,

13
1997), and with high levels of academic achievement, and positive relationships
with peers (Zimmerman et al.). A four year longitudinal study with 174 students
indicated that adolescent females reported lower self-esteem than adolescent
males consistently throughout high school (Chubb et al.). The authors theorized
that this consistency indicated that critical years for self-esteem development
occur before high school.
The longitudinal study with 1160 students over a six year span of time by
Zimmerman et al. (1997) yielded results which were not consistent with previous
reports of stability and gradual increases in self-esteem during grades 7 through
12. They suggested that overall trends of self-esteem may not adequately
characterize the typical adolescent experience. A single model describing
adolescent development may not be adequate for youths in different self-esteem
trajectories as they negotiate a variety of developmental experiences.
Unfortunately, the bulk of informative research on self-esteem has been
focused on adolescents, not younger school-age children. While there is no
doubt that understanding the impact and causes of low self-esteem in
adolescence is important, there is also substantial need to understand such
concepts and the manner in which they impact life experiences for young
children.
Locus of Control
Rotter developed the locus of control concept to describe how much a
person believes that desired outcomes are dependent on his or her actions and

14
abilities (Larde & Clopton, 1983). Locus of control was originally conceptualized
as unidimensional, meaning that a person could be categorized on either end of
the general locus of control construct. An internal orientation indicated that a
person believed his or her actions were important factors in achieving valued
goals. An external orientation implied that a person believed fate, chance, God,
or powerful others were in control of desired outcomes. Kulas (1996) defined
internally controlled people as those who believe that reinforcement is due to
their own effort or ability, and externally controlled people as those who believe
that reinforcement is due to fate, chance or some other powerful external force.
He also inferred that internally oriented people may have a more integrated
personality and are more stable in their perceptions of control.
During the past 25 years, locus of control has become a widely
researched personality variable (Chubb, et al., 1997). Although Rotter's (1966)
Internal-External locus of control scale is one of the most widely used
instruments to assess general locus of control orientations, there are several
specific scales which have been designed for use in a variety of settings (Larde
& Clopton, 1983). According to Hau (1995) there are now a plethora of scales
which attempt to measure locus of control, and several that have been designed
specifically for use with children.
Nowicki and Segal (1974) theorized that antecedents to the development
of a locus of control orientation would be linked to the parent-child relationship.
Their findings indicated that perceived parental nurturance might be intimately

15
involved in the development of a child’s locus of control orientation. An internal
locus of control has been positively related to less interpersonal distance from
others (Duke & Nowicki, 1972). Further, training of maternal behaviors and skills
designed to increase independence and self-reliance are also related to an
internal locus of control (Wichern & Nowicki, 1976). De Man, Leduc and
Labreche-Gauthier (1992) assessed parental control in child rearing and locus of
control in 558 high school students. Boys and girls in the study who described
their family backgrounds as more restrictive tended to have an external locus of
control, believing that powerful others and chance determine. They concluded
that parental control is not a correlate of locus of control, but rather that it’s
dimensions are related to different patterns of child rearing.
Nowicki and Strickland (1973), the authors of one widely used locus of
control scale for children, the Nowicki-Strickland Locus of Control Scale, reported
that locus of control is fairly stable throughout the childhood years and becomes
more internal with age. They found that internal scores on their scale were
significantly related to academic competence and social maturity. Other
researchers have reported similar findings about the stability of locus of control
during childhood (Cairns, McWhirter, Duffy, & Barry, 1990; Chubb et al., 1997).
According to Chubb and colleagues (1997), locus of control in youth
becomes more internal over time as development and maturity continue. While
locus of control may be influenced by interventions over short periods, it does not
seem to be an easily changed aspect of personality. Both Chubb et al., and

16
Kulas (1996) reported that locus of control is likely established in a
developmental stage prior to adolescence. In Kulas’ longitudinal study with
adolescents, locus of control was also relatively stable. His findings did not
empirically support other researcher’s assertions that perceptions of internal
locus of control increase with age.
Many researchers suggest that locus of control is determined at least in
part by school achievement (Kulas, 1996; Nowicki & Segal, 1974; Nowicki &
Strickland, 1973). Kulas proposed that shifts in locus of control are determined
by school achievement. He theorized that locus of control is more stable than
school achievement since school performance may depend on temporary factors
associated with specific teachers or classmates. With respect to locus of control
differences in males and females, Archer and Waterman (1988) reviewed 22
studies on locus of control and reported that there was not enough evidence to
demonstrate that gender differences exist. In support of the Archer and
Waterman findings, Chubb et al., (1997) did not find significant differences in
locus of control between males and females. Internal scores on locus of control
scales have been identified as a correlate of independent, striving behavior
(Nowicki & Strickland, 1973). Powell, Denton, and Mattsson (1995) described
that individuals with an external locus of control orientation suffer higher levels of
stress, depression, anxiety, and illness than people with an internal locus of
control. They noted that depressed children who tend to have an external locus
of control lack belief in themselves as primary contributors toward success and
17
show low levels of perceived control and competence. These research findings
indicated that locus of control was a significant predictor of self-reported
depression in both male and female adolescents.
Self-esteem/self-concept and locus of control have been frequently paired
in research studies designed with children and adolescents as participants
(Cairns, McWhirter, Duffy, & Barry, 1990; Chubb, Fertman, & Ross, 1997; Enger,
Howerton & Hobbs, 1994; Huebner, & Dew, 1993; Hojat, Borenstein &
Shapurian, 1990; Marsh, Cairns, Relich & Barnes, 1984). Enger et al., (1994)
found a moderate relationship between locus of control and self-esteem. Their
findings indicated that students who scored higher on internal control had higher
self-esteem. In discussing their results, they proposed that students who assume
more responsibility for what happens in their lives tend to feel better about
themselves.
After many years of research with locus of control, the idea that it is a
multidimensional construct has been proposed (Connell, 1985; De Man, et al.,
1992). There are now measures designed to assess domain-specific dimensions
of locus of control in children (Connell). Previous measures of locus of control in
children have not addressed whether age-related increases in internality,
decreases in externality, or both should be expected. Connell proposes that the
framework of childhood is developmental and presents a multidimensional
scheme that provides an assessment of what children know about the attributes

18
that control their successes and failures and how much they do not know about
why they succeed and fail.
In sum, research has provided a great deal of information about locus of
control in childhood and adolescence. Locus of control is related to academic
competence and social maturity, but does not appear to vary significantly
between males and females. It may be linked to a child’s early relationship with
his or her parents, and it is considered a stable characteristic that seems to be
established prior to adolescence that is not easily changed after short term
interventions. Understanding how children feel about who or what controls their
successes and failures, as well as how much they do not know about why they
succeed or fail, is very important for researchers.
Anxiety
Anxiety in children has been of interest to psychologists for many years.
Watson and Rayner (1920) published their findings on conditioned fear in Albert,
an 11 month old baby, in a series of examinations conducted more than 75 years
ago. After a white rat was repeatedly presented to Albert and paired with a loud
noise, Albert exhibited conditioned fear of the rat and, subsequently, several
other white furry objects. Despite this long history of interest in the anxiety
children experience, Ollendick (1979) reported that there is still little
understanding of just what constitutes anxiety in children.
Francis and Ollendick (1987) described anxiety by pointing out that fear,
phobia, and anxiety are terms that are typically used interchangeably. Symptoms

19
associated with fear, phobia, and anxiety include avoidance behaviors,
autonomic nervous system reactions, and subjective feelings of nervousness
and distress. Fear is said to be a normal reaction to a real or perceived
threatening object or situation. A phobia is considered a special form of fear that
is disproportional to the degree of threat posed by the feared stimulus. Anxiety is
considered a set of physiological reactions, subjective feelings of distress, and
avoidance behaviors that occur without obvious precipitating external threats.
Hoghughi (1980) defined anxiety as an unpleasant emotional experience,
varying in degree from mild unease to intense dread. Physiological and
behavioral changes that accompany anxiety can be considered appropriate in
some circumstances, such as prior to examinations. The physical changes of
anxiety also have significant biological advantages for survival because the
increased alertness and awareness are a response to threat or unfamiliarity.
Hoghughi stated that anxiety levels are highly variable; thus different children will
show quite different responses to essentially the same anxiety-inducing
situations.
Finally, Schroeder and Gordon (1991) have defined anxiety as an
internally cued aversive emotional state with subjective discomfort and
physiological arousal. Some people appear to be predisposed to experience
anxiety as a response to a wide range of stimuli whereas others have more
transitory moments of anxiety that may fluctuate in duration and intensity.

20
Reynolds and Richmond (1979) proposed that anxiety tends to be
multidimensional in nature.
The terms “trait” and “state” anxiety have been used to discriminate types
of anxiety (Schroeder & Gordon 1991). Spielberger (1973) defines state anxiety
as transitory anxiety or subjective and consciously perceived feelings of
apprehension, tension, and worry. These transitory anxiety states vary in
intensity and fluctuate over time (Rhone, 1986). In contrast, trait anxiety is
described as relatively stable individual differences in anxiety proneness
(Spielberger). Papay and Spielberger (1986) point out that the distinction
between state and trait anxiety can also be considered the difference between
viewing anxiety as an emotional “state” contrasted with individual differences in
anxiety within personality traits. Reynolds (1980) support for the distinction
between state anxiety and chronic or manifest trait anxiety was apparent when
he failed to find a correlation between measures assessing both trait and state
anxiety.
Elevations in state anxiety are normally evoked in children when they are
exposed to stressful situations (Spielberger, 1973). In general, children who are
higher in trait anxiety experience state anxiety elevations more frequently and
with greater intensity than low trait anxious children. In a study designed to
evaluate the relationship between trait and state anxiety, as well as cognitive
behaviors and performance, Houston, Fox, and Forbes (1984) found that high
trait anxious children reported more state anxiety than low trait anxious children

21
in stressful situations, thus providing support for Spielberger’s (1973) contention.
In the Houston et al. (1984) study, the same mathematics test was presented to
children in two different conditions. For one group the task was presented as a
game that most children enjoy (low stress condition). The other group was
instructed that they were being given a math test for which they would be
evaluated and compared to other students (high stress condition). The results
indicated that children in the high stress condition relative to those in the low
stress condition reported more state anxiety and made more errors on the
mathematics task. Papay and Spielberger (1986) also found that higher levels of
state anxiety were typically evoked by complex or difficult tasks.
A psychological evaluation is academically challenging, demanding, and
highly structured and can be conceptualized as a complex or difficult task.
Assessments, therefore, appear to qualify as stressful situations, or ones that
are likely to elevate state anxiety. It follows that a psychological evaluation may
increase a child’s state anxiety level.
Parental Characteristics
Parent/Caregiver Styles
Early childhood experiences, and especially interactions with parents, are
thought to contribute significantly to the overall picture of personality and
behavior (Hojat, et al., 1990). These ideas have often been the rationale for
research about parenting styles. The relationship between parents and their
children and the resulting child behavior has been studied frequently by social

22
researchers (Baumrind, 1971; Blake & Slate, 1993; Enger et al., 1994; Gordon,
Jones, & Nowicki, 1979).
Baumrind (1971) defined three types of parents based on her extensive
research with parents and children. She described authoritarian parents as those
who shape, control, and evaluate their children’s behavior based on a set
standard of conduct. These parents tend to value obedience and often favor
punitive measures to curb the willfulness they perceive in their children when the
children’s behavior conflicts with what the parent believes is right. Verbal give
and take is not encouraged in these families since authoritarian parents believe
their children should not question the parent’s word regarding what is right.
The second category Baumrind (1971) identified was that of the
permissive parent. The permissive parent is identified by their nonpunitive,
acceptant, and affirmative manner toward their children’s impulses. Few
demands are made of children with permissive parents and policy decisions, as
well as family rules, are considered in consultation with the children. Children are
allowed to regulate their own activities as much as possible and are not
encouraged to obey externally defined standards. Permissive parents may use
reason, but typically not power, to accomplish their purposes.
The third category Baumrind (1971) described was authoritative parents
interested in directing their children’s activities in a rational, issue-oriented
manner. These parents encourage verbal give and take and share the reasoning
behind decisions and issues with their children. Authoritative parents exert firm

23
control at points of parent and child divergence but do not hem children in with
restrictions. The authoritative parent maintains special rights as an adult but also
sees the child’s individual interests and characteristics. Reason, as well as
power, are used to achieve parental objectives. Authoritative parents do not
regard themselves as infallible. Baumrind generalized that authoritative parents
were the most likely to facilitate the development of competence, responsibility
and independent behavior in children.
Lamborn, Mounts Steinberg and Dornbusch (1991) used Baumrind’s
general categories but presented evidence to distinguish permissive parents into
two different groups. Specifically, they separated permissive parents by indulgent
and neglectful characteristics and showed that failing to distinguish between
these two subgroups would confuse findings on the consequences of permissive
parenting in child development. Lamborn et al. (1991) postulated that families
whose low level of control is derived from an ideological orientation which has its
foundations in trust, democracy, and indulgence (indulgent permissiveness) are
functionally different from families whose permissiveness is a result of
disengagement from the responsibilities of child rearing (neglectful
permissiveness).
While parents may not adhere to every detail presented in the previous
descriptions of parenting styles, it is clear from the body of literature available
that parenting categories are a useful framework to discuss family interaction in
general terms.
24
Parental Relationship to Child Characteristics.
While broad descriptions of parenting styles are helpful to conceptualize
general family patterns, it is important to address the actual relationships
between parents and their children. It is also meaningful to assess the resulting
consequences of the nature of these relationships. From the earliest moments,
the parent-infant relationship is shaped by reciprocity (Givelber, 1985). Parents
have frequently been implicated as the principal causal agents in their children’s
behavioral, emotional, personality, and cognitive development (Holden &
Edwards, 1989). A mother and father’s acceptance and joy in a child become
incorporated into the child’s sense of him- or herself as the parent’s belief in the
child’s basic goodness and capability also become part of the child’s own sense
of his or her worth (Givelber).
Reciprocal relationships, like mutual ones, are one way in which a person
comes to know themselves (Powell et al., 1995). Mutuality within a relationship
that allows a person to feel heard, seen, understood, and known while conveying
emotional availability is vitally important to most people’s psychological well-
being (Jordan, 1991). High levels of mutuality in relationships may increase a
person’s sense of vitality, the desire to further connections with others, and
ultimately one’s self-esteem, while low levels of mutuality may lead to a reduced
capacity to cope and diminished self-esteem (Powell). In fact, adolescents in
detached relationships with parents reported greater anxiety, more depressive
symptomatology, and lower self-worth than those in individuated or connected

25
relationships with parents (Delaney, 1996). One very relevant dimension in
defining relationship types was the adolescent’s subjective feeling of closeness
toward each parent (Delaney). Hojat et al. (1990) also noted this pathway to high
self-esteem and suggested that parent responsiveness fosters the development
of a secure attachment which in turn is associated with increased self-esteem in
the child and a willingness to establish good social relations.
Studies have demonstrated the significant relationship between perceived
family environment and children’s psychological functioning (Burt, Cohen &
Bjorck, 1988). As research on specific parenting styles began to be repeatedly
utilized to investigate parent child relationships, trends describing general types
of child behaviors and characteristics were correlated with specific parental
styles. Families that were perceived by young adults as cohesive, organized and
facilitative of expression during childhood years were related to positive
psychological functioning during adulthood, whereas families perceived as
conflict-ridden and controlling were related to negative functioning. Hojat et al.
(1990) found satisfaction with peer relationships decreased as dissatisfaction
with the manner in which people had been parented during childhood increased.
Lamborn et al. (1991) asked 4100 adolescents to rate their parents on
acceptance/involvement and strictness/supervision dimensions and to report
their own behavior and psychological functioning. Findings indicated that there
were differences between adjustment and psychological functioning among the
youth, based on how they had characterized their parents in the four parenting

26
groups (authoritarian, authoritative, indulgent and neglectful) utilized by Lamborn
et al. Adolescents from authoritative homes were better adjusted, more confident
about their abilities, more competent in areas of achievement, and less likely
than their peers to engage in deviant behavior. Adolescents who characterized
their parents as authoritarian scored well on measures of obedience and
conformity to standards of adults, did well in school, and were less likely to be
involved in deviant activities. The authors theorized that these children had been
overpowered into obedience and the price for the obedience was paid in their
lower perceptions of their own abilities, self-confidence, and self-reliance. Youth
from indulgent families were somewhat disengaged from school and showed a
higher frequency of involvement in some deviant behaviors including drug and
alcohol use, as well as school misconduct. Adolescents from indulgent homes
were depicted as psychologically adjusted kids who were especially oriented
toward their peers and toward social activities valued by adolescents. In strong
contrast to the other three parent types, adolescents from neglectful families
were consistently compromised, whether the index measured competence, self-
perceptions, misbehavior, or psychological distress.
Results from a longitudinal study with 6,400 adolescents indicated that
youth who described their parents as authoritative (warm, firm and democratic)
reported better school performance and stronger school engagement then their
peers (Steinberg & Lamborn, 1992). These authors concluded that authoritative
parenting actually leads to school success and that non-authoritative parenting

27
appears to undermine the otherwise positive effect of parental encouragement to
succeed.
In addition to linking parenting styles to child characteristics, researchers
have also examined the effects of the verbal interaction between parents and
their children. The quality of verbal interaction between a child and their parent is
one indicator of the environment of the home. Blake and Slate (1993) describe
that verbal abuse adversely affects self-concept, leaving emotional scars as
devastating as those left after physical abuse. Gross and Keller’s (1992) results
indicated that psychological abuse is a more powerful predictor of depression
and low self-esteem than is physical abuse. Solomon and Serres (1999) used a
self-report measure with 94 fifth grade students that was designed to determine
whether children had been subjected to verbal aggression, physical punishment,
or both. Their results suggested that children who see themselves as having
been the targets of verbal aggression perceive themselves as less competent in
their school work, less comfortable with their own behavior, and feel generally
less worthy.
Blake and Slate (1993) identified four components of parental verbal
interaction that they felt influenced self-esteem: belittling and berating, non-
support or the absence of approval, non-communication, and rejection/hostility.
With a measure designed to operationalize these components, their results
indicated that low levels of self-esteem correlated with inadequate positive and
supportive communication as well as high levels of negative and defensive

28
parental communication. Parents whose children rated them as engaging in high
levels of positive verbal interaction had children who liked themselves and who
were more confident. Enger et al. (1994) also employed this measure of verbal
interaction in their research and found that students with high self-esteem
perceived their parents’ communication as more positive than did students with
lower self-esteem.
The bulk of the research suggests that parenting styles have tremendous
impact on how children relate to their parents and peers, and how they function
in their environment. The research on family interaction clearly indicates that
children who report connected relationships with parents have lower anxiety, less
depressive symptomatology, and higher self-worth than children who report
detached relationships with parents. Additionally, when families are perceived as
cohesive, organized and facilitative of expression, children exhibit more positive
psychological functioning.
Statement of Problem
Psychologists and other trained examiners evaluate children through the
use of intellectual and achievement measures on a regular and daily basis in a
multitude of settings. However, despite the knowledge that these evaluations are
academically and intellectually challenging, only a few studies have investigated
children’s responses to the experience of having intellectual and achievement
tests administered. In the context of attempting to validate a new anxiety
measure, Reynolds (1980) administered three anxiety tests to children prior to

29
administering a psychological evaluation. However, all three measures were
administered prior to the evaluation so no anxiety measures were obtained post-
evaluation. Swanson and Howell (1996) investigated test anxiety with 82
adolescents prior to the students taking the Stanford Achievement Test (SAT).
Their study did not include the administration of individually administered
intelligence tests, nor did it include any post-test anxiety measure.
Research examining the effect a psychological evaluation may have on
child characteristics such as self-concept or anxiety is scarce. Additionally, the
bulk of the literature on self-concept has been conducted with adolescents; few
studies have evaluated elementary students. Although the debilitating effects of
test anxiety can impact performance and have been an area of long-standing
clinical concern (Zatz & Chassin, 1983) no research has assessed anxiety in
children after they have psychological evaluations.
While self-concept is thought to be stable over time (March, 1980),
academic situations that children experience in negative ways may impact the
formation of self-concept more than researchers are aware. The failure to
accomplish developmental tasks due to innate inability frequently lowers self-
esteem (Jacobs, 1985) and leaves a child with the feeling, “I can’t get there from
here,” (p. 211). This type of failure may begin to jeopardize other areas of
functioning which have not previously been compromised.
Data support the connection between self-esteem and anxiety. Dorr,
Pozner and Stephens (1985) demonstrated that self-esteem and anxiety tend to
30
be independent but reciprocal. Fourth, fifth, and sixth grade students who
responded fearfully to “ego threats” tended to report lower levels of self-esteem
(Dorr et al., 1985).
Based on the lack of research investigating the effects of assessment on
children, it appears that there is an implied assumption that psychologists or
examiners do no harm to children during intellectual and achievement
evaluations. Without empirical evidence to corroborate this implied assumption,
clinical practitioners and researchers may be operating under a misconception,
failing to perceive any negative effects for the child being assessed as a result of
these routine procedures.
During an evaluation, there are a variety of areas that may influence a
child’s response to the evaluation situation. Locus of control may effect the way
in which a child copes with a stressful situation. Research indicates that
authoritative parenting styles produce more successful children (Lamborn et al.,
1991). Finally, the type of rapport or relationship a child experiences with parents
plays a large part in determining how the child functions with friends, at school
and in the world. The goal of this research was to explore changes to a child’s
self-esteem or anxiety level after the experience of a psycho-educational
assessment.

31
Hypotheses
Hypothesis 1
It was hypothesized that students would report higher state anxiety scores
on the post test anxiety measure than they reported on the pre-test anxiety
measure. It was expected that this would be true for children, in both referral
groups (TAG and SPED).
Hypothesis 2
It was hypothesized that students who had been referred to the TAG
program would report less state anxiety after the evaluation than those who had
been referred to SPED.
Hypothesis 3
It was hypothesized that lower pre-test general self-concept scores would
predict higher state anxiety after the evaluation.
Hypothesis 4
It was hypothesized that lower pre-test academic self-concept scores
would predict higher state anxiety after the evaluation.
Hypothesis 5
It was hypothesized that students who rated their parent/caregiver
interactions as lower (more negative) would have lower general pre test self-
concept scores.
Hypothesis 6

32
It was hypothesized that students who rated their parent /caregiver
interactions as higher (more positive) would report lower state anxiety after the
psychological evaluation.
Hypothesis 7
It was hypothesized that students who rated their parents as authoritative
would have higher pre-test general self-concept scores than students who had
rated their parents in the other three parent style groupings.

33
CHAPTER II
METHOD
Participants
Participants in this study were 75 fourth, fifth and sixth grade students
attending 26 different elementary campuses in the Dallas Public Schools (DPS).
The student participants were recruited after being referred for possible
placement in the Talented and Gifted Program (TAG) or after being referred for
evaluation and possible placement in Special Education (SPED). Students who
obtained intelligence scores in the mentally deficient range, Full Scale
Intelligence Quotient of less than 70 as measured by the Wechsler Intelligence
Scale for Children - Third Edition (Psychological Corporation, 1991) were not
included in the analysis.
To avoid language comprehension confounds caused by limited English
proficiency, students were not recruited for the SPED referral group if they spoke
other languages. TAG referral students were recruited for the study when they
were speakers of other languages if they had obtained scores above the 75th
percentile on the Language Total of the Iowa Tests of Basic Skills (ITBS) a
standardized test of academic English skills. Different criteria for these two
referral groups resulted in the inclusion of numerous bilingual students in the
TAG referral group and no bilingual students in the SPED referral group. The
34
breakdown of demographic variables based on referral type, sex, grade, and
ethnicity is listed in Table 1.
Measures
Several self-report measures were used as independent and dependent
variables to estimate the child’s locus of control, self-concept,
relationship/interaction with parent or primary caregiver, and anxiety.
Demographic variables such as the child’s birthdate, sex, ethnicity, grade in
school, and type of referral (SPED or TAG) were obtained from the examiners
and research assistants assisting in this research.
Anxiety. The State-Trait Anxiety Inventory for Children, (STAIC) a useful
measure of state and trait anxiety in children from kindergarten through 6th
grade (Papay & Spielberger, 1986), was used in this research. Only the A-State
scale (STAIC-A) was administered to assess temporal anxiety. The STAIC-A
scale assesses the intensity of a child’s feelings of tension, apprehension,
nervousness and worry at a given time (Papay & Spielberger, 1986). Each
STAIC-A item begins with the stem “ I feel,” followed by three alternative endings
containing a key descriptive term, (e.g., “worried”). The child responds by
checking the alternative that best describes how he/she feels “right now, at this
very moment,” (e.g., Item 9: “I feel - very worried - worried - not worried”). The
instructions for the STAIC-A scale may be modified to permit the evaluation of
state intensity for situations or time intervals that are of special interest to
researchers (Spielberger, 1973).

35
The norm group for the STAIC consisted of 1,500 students in grades 4, 5,
and 6 from four different counties in Florida. Some schools had a predominantly
African-American student body. This resulted in 35 to 40 percent African-
American students within the total norm sample. Alpha reliability of the STAIC-A
with the norm group was .82 for males and .87 for females. For the current
research the STAIC-A was administered to participants three times. Alpha
reliabilities were calculated and resulted in .83, .85, and .88, respectively, for the
three administrations.
Self-esteem/self-concept. To assess personal self-concept, the Self
Description Questionnaire I (SDQ-I) was used (Marsh, 1990). The SDQ-I has
undergone factor analysis, and multitrait-multimethod analysis. Research has
yielded support for its multidimensional and hierarchical organization. The SDQ-I
is designed to measure self-concepts for children and was conceptualized and
developed to measure self-concept in non-academic, academic and general
areas, allowing researchers to assess a person’s perception of their abilities in a
variety of domains.
The SDQ-I measures specific areas of academic self-concept in children.
Thus, the academically challenging experience of being evaluated with
intellectual and achievement measures was directly linked to four of the 11 SDQ-
I subscales. There are 76 items on the SDQ-I and children are asked to respond
to simple declarative sentences (e.g., “I’m good at mathematics”, “I make friends
easily”) with one of five responses (e.g., false, mostly false, sometimes

36
false/sometimes true, mostly true, true). The 11 subscales are Physical Abilities,
Physical Appearance, Peer Relations, Parent Relations, Reading, Mathematics,
General School, General Self, Total Non-Academic, Total Academic and Total
Self. Additionally, there are six control scores which were designed to provide a
measure of validity for individual student responses. These scores provide
information on inconsistency between correlated paired items, consistency
between uncorrelated pair items, negativity bias, positivity bias, and an individual
profile variation. The use of these scores is optional but suggested when there
are suspicions that a child has not responded appropriately.
Testing time for the measure varies but may average 15 to 20 minutes
(Marsh, 1990). The SDQ-I is suitable for children as young as 2nd grade and,
with appropriate modifications, for older students through high school (Marsh,
1990). Internal consistency reliability estimates for the various scales and total
scores are all in the .80’s and .90’s (Marsh, 1990). Alpha reliability internal
consistency scores were calculated on the subscales that were used in this
study. The scores for the Reading, Math, General Self, and General School
scales were .91, .93, .86, and .84 respectively. Alpha reliability consistency
scores were also calculated on the responses to these same four subscales
upon re-administration on a different date. These scores were .47, .39, .27, and
.46, respectively.

37
Locus of Control. To determine locus of control, the Measure of Children’s
Perception of Control (MMCPC), was used (see Appendix A). As mentioned
previously, this measure examines developmental change and different ways
children understand control within domain specific dimensions. The MMCPC is a
48-item instrument that measures children’s perceptions of control in four
domains: cognitive, social, physical and general (Connell, 1985). Additionally, the
MMCPC offers the assessment of both what children know about whose
attributes control their success and failures as well as what they do not know
about why they succeed and fail. The items are declarative statements using a
four point Likert format for endorsement including very true, sort of true, not very
true, not at all true. A sample internal control item is “If I want to do well in
school, it’s up to me to do it.” Each item is scored from 1 to 4, where “very true”
is scored 4, and indicates high endorsement of the source of control presented in
the statement. Perceptions of control over success outcomes and failure
outcomes are assessed separately.
The MMCPC was established from factor analytic procedures, the use of
internal consistency analyses and comparison of questionnaire responses with
responses children gave in structured interviews. A sample of 355 students in
third through sixth grade yielded alpha reliabilities from .70 to .52. which is similar
to other locus of control measures (Nowicki & Strickland, 1973). Domain scale
alpha reliability scores for the current sample were calculated and yielded .59,
.60, .79, and .48 cognitive, general, physical, and social domains respectively.

38
Parenting Style. To categorize the students’ parents into recognizable
parent style groups, the Index of Parenting Style (IPS) (see Appendix B) was
used (Lamborn et al., 1991). This questionnaire contains 24 items on parenting
practices that have been taken or adapted from existing measures. Based on
previous work (Steinberg et al., 1989) several items were selected to correspond
with dimensions of parenting. The acceptance/involvement and
strictness/supervision domains were selected for use in this study. Items 1-15
make up the acceptance/involvement scale and items 16-24 make up the
strictness/supervision scale. The psychological autonomy dimension mentioned
by Lamborn et al. (1991) was not used since the students for this sample were
distinctly younger than earlier samples and therefore in a different developmental
stage.
The acceptance/involvement scale measures the extent to which a child
perceives his or her parents as loving, responsive and involved, with items such
as: “I can count on them to help me out if I have some kind of problem.” Alpha
reliability for the acceptance/involvement dimension with 4,100 14-18 year olds
attending schools in Wisconsin and California was .72 (Lamborn et al., 1991).
The strictness/supervision dimension assessed parental monitoring and
supervision of the child with items such as: “My parents know exactly where I am
most afternoons after school.” Some of the items relating to curfew hours were
adjusted for the elementary age sample in this study. Alpha reliability for the
strictness/supervision domain with the Lamborn et al. sample was .76. Alpha

39
reliability was calculated for the students in this study, and resulted in .48 for the
parent warmth and involvement dimension and .71 for the strictness and
supervision dimension.
Verbal Interaction. To assess family interaction and/or a child’s perception
of their verbal interaction with their primary and secondary caregivers, the Parent
Verbal Interaction (PVI) questionnaire was used for this study (see Appendix C).
The PVI is a self-report measure which consists of thirty statements. A three
point Likert scale is used to describe how parents verbally interact with their
children. The alpha reliability of this measure with a sample of 197 southern,
rural, and predominantly white, high school students was .95 (Blake & Slate,
1993; Enger et al., 1994), indicating a high degree of internal consistency. Alpha
reliability was calculated for students in this research and resulted in a Guttman
split-half score of .91 for the female/primary caregiver scale and .92 for the
male/secondary caregiver.
Items are answered with three possible choices, “often,” “sometimes,” and
“never.” All the declarative statements use the same Likert scale choices. The
child was asked to specify their relation to the persons they conceptualized when
answering the items, for example, “grandmother,” or “step-father.” Most students
reported on biological mothers and fathers as primary and secondary caregivers
(see Table 1). The higher the score obtained, the better the perceived interaction
between the child and their caretaker.

40
Intelligence. The Wechsler Intelligence Scale for Children - Third Edition
(WISC-III) (Psychological Corporation, 1991) is a popular and well validated
intelligence scale for children, allowing assessment of intellect from age 6 to 16
(Sattler, 1992). The WISC-III was standardized on 2,200 children in four
geographical regions of the United States matched closely to census data from
1988. The WISC-III consists of 13 subscales, with 6 Verbal Scale subtests and 7
Performance Scale subtests. The Verbal subscales are Information, Similarities
Arithmetic, Vocabulary, Comprehension, and Digit Span. The Performance
subscales are Picture Completion, Coding, Picture Arrangement, Block Design,
Object Assembly, Symbol Search and Mazes. From these subtests, a Full Scale
Intellectual Quotient, a Verbal Intellectual Quotient, and a Performance
Intellectual Quotient are yielded. WISC-III reliability is considered outstanding, as
the three scales have reliability coefficients of .89 or above for the entire age
range covered by the standardization group.
Achievement. The Wechsler Individual Achievement Test (WIAT)
(Psychological Corporation, 1992) is the companion achievement measure for
Wechsler Intelligence Scales. The WIAT was correlated with other achievement
measures across a variety of individually and group administered tests. The
standardization sample consisted of 4,252 children in 13 age ranges from 5
years through 19 years, and matched by the census data from 1988. The
subtests included in the WIAT are Basic Reading, Mathematics Reasoning,
Spelling, Reading Comprehension, Numerical Operations, Listening

41
Comprehension, Oral Expression and Written Expression. These subtests are
combined to yield six composite scores including Reading, Mathematics,
Language, Writing, Screener and Total.
Procedure
Authorization from the Institutional Review Board at the University of North
Texas and from the Office of Institutional Research of the Dallas Public Schools
was obtained prior to data collection.
Students in Dallas Public Schools are typically referred to the TAG
program by either a faculty member or a parent. The screening process TAG
students experience prior to placement involved the completion of questionnaires
and at times a brief non-verbal intelligence test, typically administered by TAG
teachers. The actual procedure varies by campus. Subsequent to the screening,
a faculty committee at the student’s campus makes a formal recommendation for
placement in TAG. Similarly, students referred to SPED are usually referred by a
faculty member and then have a formal psycho-educational evaluation. A
committee reviews results of the assessment to determine eligibility for SPED
services.
Students were recruited to participate in this study only on campuses
where principals had given approval for data collection to occur. The researcher
contacted parents of the students via letters, phone calls and/or home visits.
Information about the project and two copies of the appropriate consent form
(see Appendices D, E, & F) were provided to the parents. If the consent form

42
was returned with signatures to the researcher, the student was enrolled in the
project.
When the consent form was returned, a research assistant was assigned
to conduct the interview with the student. Research assistants were
undergraduate students majoring in Psychology at the University of North Texas
(UNT). The research assistants were trained by the researcher to administer the
self-report measures used for the current research and were provided with
specific instructions for completing the interview (see Appendix G). The
interviews occurred at the participants’ school campus during school hours and
lasted approximately 45 minutes. Research assistants began by reading the
Child Assent Form (see Appendix H) to students and requesting that they sign
the form if they wished to participate in the study. Upon obtaining the student’s
signature and assent, the research assistants read all the interview measures
which included, in order of administration, the STAIC-A, the SDQ-I, the MMCPC,
the IPS and the PVI to the student participants and marked the responses the
students endorsed.
On a different date, after the interview was completed, students were
tested with intelligence and achievement measures by trained examiners. The
students in the TAG referral group were tested by graduate student psychology
examiners who were supervised by faculty at the UNT Psychology Department.
The graduate students were also provided with specific instructions to complete
the test session (see Appendix I). A brief report which summarized the child’s
43
strengths and weaknesses was returned to parents and, when requested, results
were presented at a face to face meeting with the researcher.
Students in the SPED referral group were tested by DPS employees of
the department of Psychological, Social and Diagnostic Services (PSDS). Nine
of these examiners were licensed psychologists and seven were licensed
educational diagnosticians. Several examiners tested more than one student.
Specific instructions were provided for the examiners working for the public
school district (see Appendix J). The psychological evaluation for these students
was not completed for the benefit of this research, but in a naturalistic setting
that would have occurred whether or not the student was enrolled in this study.
During the testing session, which was completed in one day, students
were administered the STAIC-A at the start of the test session. Immediately after
the administration of the WISC-III and the WIAT, the STAIC-A was administered
again. The last measure given to student participants during the test session was
composed of 32 items from the SDQ-I which comprise the Reading, Math,
General School and General Self subscales. The test session process and the
measures given to both referral groups were the same so comparisons could be
made between the two groups. None of the interviewers or examiners at UNT
and DPS were compensated financially for the assistance they provided with this
project.

44
CHAPTER IV
RESULTS
Preliminary Data Analysis
Data Analysis began with an examination of the distributional
characteristics of the variables. Results of the evaluation of assumptions of
normality were satisfactory. The skewness and kurtosis of the distributions were
also evaluated and found generally satisfactory. Alpha reliability internal
consistency scores were calculated on the scales where appropriate.
Independent variables used in this study included student referral type,
pre-test anxiety scores, and parenting style group. Dependent variables included
pre-and post-test anxiety scores, general self concept scores, and academic self
concept scores. Predictor variables were general self-concept, academic self-
concept, and parent verbal interaction. Means and standard deviations of the
self-concept variables by referral group and with all participants are included in
Table 2. Intercorrelations for the self-concept subscales are listed in Table 3 and
4. This study employed Analysis of Variance (ANOVA), t-tests, and multiple
regression analysis. SPSS was used for all analyses. Means and standard
deviations of the locus of control subscales are listed by referral group and for all
participants in Table 5, and intercorrelations for the locus of control sub-scales
are listed in Table 6.
Descriptive Statistics

45
Although there were a total of 75 student participants, data on only 58
students was utilized to analyze hypotheses one through six, since these
hypotheses required the use of data from both the interview and the test session.
Hypothesis seven employed only data that was derived from the interview and
therefore was calculated by including data on the 74 subjects who were
interviewed. Data on the remaining 17 students was not used for a variety of
reasons. For example, one SPED referral student obtained a Full Scale IQ of 66,
and that data was not included in any analysis due the subject’s questionable
ability to comprehend the self-report measures. This is the reason for the
difference between the total number of participants (75) and the number of
subjects whose data was interpreted (74). Additionally, there were occasions
when test sessions were attempted with students but due to circumstances
beyond the control of the researcher or examiner, testing was not completed in
one day. It was felt that including this data would not accurately describe
possible changes in temporal “state” anxiety resulting from a psychological
evaluation. To explore the relationship between self-report variables
intercorrelations between sub-scales were run and are listed in Table 7.
Hypothesis Testing
Hypothesis 1. The first hypothesis predicted that students pre-test anxiety
would be lower than their post-test anxiety. It was expected that this would be
true for all students without distinction between referral type. It was expected that
student’s anxiety would increase after having a psycho-educational assessment

46
due to the intellectually and academically challenging tasks required during an
assessment. To test this hypothesis, a repeated measures ANOVA was used to
compare total STAIC-A scores (see Table 8). The STAIC-A administration at the
start of the interview session was considered time one (T1), the STAIC-A
administration at the start of the test session was time two (T2), and the STAIC-A
administration after the test session was time three (T3 ). Results indicated that
there was a significant difference among anxiety levels for the three STAIC
administrations F (2,53) = 6.77 p = .002).
Tukey post hoc analyses were run to find differences between the three
STAIC-A mean scores. Results suggested that there was no difference between
(T1) and (T2), indicating that students anxiety at the start of the interview session
was not significantly different than their anxiety at the start of the test session. A
difference was found between (T1) and (T3 ), suggesting that students were
significantly more anxious at the start of the interview than they were at the end
of the test session. Additionally, there was a significant difference between (T2)
and (T3 ) indicating that students were more anxious at the start of the test
session than they were at the end of the test session. This trend was consistent
across groups (TAG and SPED) and between grade levels. These results
indicate that students anxiety at the start of the interview and at the start of the
test session was equal, but significantly higher than the anxiety they reported at
the end of the test session.

47
Hypothesis 2. The second hypothesis stated that students who had been
referred to the TAG program would report less state anxiety after the evaluation
than students who had been referred to SPED. A T-test was used to determine a
difference between the mean (T3 ) STAIC-A scores of the TAG group M = 27.07
and of the SPED group M = 27.67. The mean scores were not statistically
different t (42) = -.41, p = .68, indicating that hypothesis 2 was not supported by
the data.
Hypothesis 3, 4, and 5. Hypothesis 3, 4, and 5 were tested by using path
models because all four hypotheses employ the same dependent variable. The
path model for hypotheses 3, 4, and 5 are shown below.
#3
#4
#5
Hypothesis 3 stated that lower pre-test general self-concept scores would
predict higher state anxiety after the psycho-educational evaluation. Hypothesis
4 stated that lower pre-test academic self-concept would predict higher state
anxiety after the evaluation. Hypothesis 5 predicted that students who had rated
their caregivers interactions as more positive would report lower state anxiety
after the evaluation. The Parent Verbal Interaction measure was used by totaling
Parent VerbalInteraction
Post-TestAnxiety
GeneralSelf-Concept
AcademicSelf-Concept

48
the verbal interaction scores. Scores of students from two-parent homes were
averaged, and for children in single parent homes, only the score for the single
parent was used.
Colinearity diagnostics indicated the existence of a multi-colinearity
problem among the predictor variables since the variance inflation factor (VIF) for
all three variables was greater than one: general self (VIF = 1.45), academic self-
concept (VIF = 1.20), and parent verbal interaction (VIF = 1.25). It was assumed
that the multi-colinearity problem existed between parent and general self-
concept because of the formation of the model. To investigate this, general self-
concept was removed from the analysis and the multiple regression was run
again. With general self-concept removed, the variance inflation factor for
academic self-concept and for parent verbal interaction was (VIF = 1.03). These
results indicate that without general self-concept (VIF = 1.03) the VIF scores of
two remaining predictors were much closer to 1.00 and thus, the multi-colinearity
problem was resolved. Additionally, the adjusted r square value for the second
regression increased to (R2 = .088).
However, hypothesis 3 suggesting that pre-test general self concept
scores would predict post-test anxiety was not supported since general self-
concept was not a direct predictor of post test anxiety (β = -.03, p =.82).
Hypothesis 4, which stated that lower pre-test academic self-concept
would predict higher post-test state anxiety was supported. Pre-test academic
self-concept significantly predicted post-test anxiety, standardized beta, (( = -.26,

49
p =.04), however, when the effect of pre-test anxiety was controlled, the
relationship between academic self concept and anxiety was no longer
significant. Thus, the significance in the original regression appears to be due to
pre-testing anxiety and academic self-concept does not significantly predict post-
test anxiety.
Hypothesis 5 which stated that parent verbal interaction would predict
lower state anxiety was not supported, since parent interaction was not a
significant predictor of post test anxiety (β = -.19, p = .16).Hypothesis 6
suggested that students who rated their caregiver interactions as more negative
(lower) would have lower general pre-test self-concept scores, or that parent
verbal interactions would predict general self-esteem. The model for hypothesis
6 is shown below.
#6
The relationship between general self-concept and parent caregiver
interaction was evaluated by regressing general self-concept onto parent
caregiver interaction, (β = .13, p =.01). Parent caregiver was a significant
predictor of general self-concept, supporting hypothesis 6.
Hypothesis 7. Hypothesis 7 stated that students who had rated their
caregivers as authoritative would demonstrate higher general self-concept
scores than students who had rated their caregivers in the other three parenting
GeneralSelf-Concept
Parent VerbalInteraction

50
categories. A one way ANOVA was used to test this hypothesis using the Index
of Parenting Style scores as the independent variable and general self-concept
score students endorsed during the interview as the dependent variable.
Because all data necessary to test this hypothesis was derived during the
interview, data on 74 students was used for this analysis. The IPS dimensions,
warmth/involvement and strictness/supervision were standardized as the
measure contained a variety of item types (three point Likert scale, five point
Likert scale, and true false items).
When Lamborn et al. (1991) used the IPS with a sample of over 4,000
subjects, the results were trichotomized and excluded all scores that fell in the
middle tertiles of each dimension. However, when they performed the analyses
using a median split procedure to detect differences, the results did not change
substantially (Lamborn et al.).
For the current research sample, a median split procedure was chosen
and students were assigned to one of the four parent style categories based on
the scores each student had endorsed and whether the scores were above or
below the median on each dimension. Students placed in the Authoritative group
had endorsed scores above the median on both the warmth/involvement
dimension and the strictness/supervision dimension. Students in the
authoritarian parent group had endorsed scores lower than the median on the
warmth/involvement dimension, but scores above the median on the
strictness/supervision dimension. Students in the Indulgent parent group had

51
demonstrated scores above the median on the warmth/involvement dimension,
but scores below the median on the strictness/supervision dimension. Students
in the Neglectful parent group had demonstrated scores below the median on
the warmth/involvement dimension and on the strictness/supervision dimension.
The differences between the means on the general self-concept measure
were not significantly different between the four parenting group categories
F(3,54) = 1.48, p = .231). Authoritative parenting group general self-concept
mean score (M = 36.04; SD = 3.34), Authoritarian parenting group general self-
concept mean score (M = 36.04; SD = 4.17), Permissive parenting group general
self-concept mean score (M = 32.73; SD = 8.55), Neglectful parenting group
general self-concept mean score (M = 32.58; SD = 4.70) Since the mean self-
concept scores were not statistically significant, the data did not support this
hypothesis(see Table 9). Therefore, students who had rated their caregivers as
authoritative did not differ significantly in general self-concept from students who
had rated their parents in the other three parent style categories.
Exploratory Analysis
Although a specific hypothesis was not proposed regarding changes
between interview and post-test self-concept subscale scores and for the
reading, mathematics, general school, and general self-concept subscales, this
data was analyzed. T-tests were run to determine changes in these subscales
after the psychological evaluation. While there were decreases in each of the
subscale totals at the post-test, administration, the only sub-scale that reached a

52
level of significance was the general school subscale at interview administration
(M = 29.50) compared to post-test administration (M = 27.74) (t = 2.11, p = .04) .
This indicated that students had significantly lower general school self-concept
after experiencing a psycho-educational assessment.
Additional regression analyses were calculated with the locus of
control measure by regressing the cognitive domain total score (β = .008, p
=.963), the general domain total score (β = -.013, p =.935), the physical domain
total score (β = -.045, p =.965), and the social domain total score (β = -.129, p
=.348) onto the STAIC-A (T3 ) anxiety measure. None of the locus of control
domain subscales significantly predicted post-test anxiety. Additionally, the locus
of control results appear to indicate that students referred to SPED have greater
variability in their endorsement of locus of control domains. The standard
deviations for the SPED sample was consistently larger than that of the TAG
sample.

53
CHAPTER IV
DISCUSSION
This investigation involved the examination of anxiety and self-concept in
fourth, fifth and sixth grade students both before and after experiencing a
psycho-educational assessment. Psychosocial variables, which included the
student’s perceptions of their relationships to primary caregivers, were gathered
on a date prior to the psycho-educational evaluation. Findings included initial
evidence that psycho-educational assessments do not result in increased anxiety
in students after the test session, potentially beneficial findings for psychology
and psychometric professionals who evaluate children daily. Students endorsed
decreased anxiety after the evaluation was completed rather than increased
anxiety, suggesting that fear of unknown situations may be more anxiety
provoking than the actual situation itself. Additionally, negative verbal interaction
with parents significantly predicted lower general self-concept scores, providing
evidence that the manner in which parents verbally relate to their children may
have significant impact for the mental health of children.
Anxiety
Reynolds (1980) investigated anxiety in children before psychological
evaluations in previous research. However, changes in anxiety as a result of the
assessment were not examined in his study. When Swanson and Howell (1996)

54
investigated test anxiety in students who were about to take the SAT there also
were no post-test measures of anxiety administered to the students. Thus,
previous efforts toward understanding anxiety in the course of psycho-
educational assessment have not assessed anxiety upon completion of the
assessment process.
The results of the current study give clinicians previously unavailable,
empirical information about the impact a psycho-educational evaluation has on
the level of anxiety students experience before and after an evaluation. It was
hypothesized that students anxiety would increase after an assessment due to
the intellectually challenging and academically demanding aspects of a psycho-
educational evaluation. In fact, the data indicated the opposite effect. Students
were significantly less anxious upon completion of the assessment than they had
been at the start of the session. Neither were there significant differences on the
anxiety measure between the three grade levels. It was also expected that
anxiety scores endorsed for this study might be markedly inflated as a result of
the evaluation process. This was also not the case. The results of this research
indicated that although students endorsed anxiety before and after the
evaluation at significantly different levels, the means and standard deviations of
responses by students in this study were comparable to those obtained in the
norming sample for the anxiety measure used in this research (Spielberger,
1973).

55
Additionally, the anxiety students endorsed was not impacted significantly
by referral group, TAG versus SPED. In previous research, investigators have
noted that children with learning disabilities exhibit higher levels of test anxiety
than their peers without disabilities (Bryan, Sonnefeld & Grabowski, 1983;
Swanson & Howell, 1996). Although the data from the current study did not
support this trend, it may be related to the fact that the students recruited for the
project had not been formally diagnosed or given an eligibility of learning
disabled. In fact, since participation in this study occurred during the evaluation
process, it is possible that several of the participants were not subsequently
diagnosed as learning disabled as a result of the assessment. Conversely, it may
be that children with learning disabilities experience more anxiety in classroom
testing sessions rather than in one-on-one psycho-educational testing.
This empirical examination of anxiety before and after psycho-educational
assessment indicates that psycho-educational evaluations did not result in high
anxiety scores after the assessment. In fact, students’ anxiety appeared to
decrease upon completion of the assessment. One possible explanation may be
that lower levels of anxiety are attributable to the perception by the student that
the experience is finally at an end. Relief about the end of the task may be
responsible in part for the decrease in anxiety scores. Additionally, children may
mentally exaggerate what will occur during an evaluation with fear of the
unknown as the central theme. Reduction of anxiety would then follow once the
child knows what the assessment involves. Although less likely, the possibility

56
also exists that psychological evaluations are not particularly stressful or anxiety
provoking for children. Studies designed to derive qualitative information from
children regarding their perceptions might be useful to investigate this possibility.
Structured interviews or open-ended questions given before and after psycho-
educational assessments would further examine this possibility. Without more
data, however, it is only possible to surmise from this research why the anxiety
children report is not increased after a psychological evaluation. Although these
results are initial findings, it may indicate good news for psychologists and
professional examiners who must evaluate children frequently in the course of
their professional duties.
Self-Concept
Marsh (1990) has stated that self-concept is relatively stable over time.
The SDQ-I has been used extensively to investigate the effects of intervention
programs designed to improve self-concept by measuring self-concept before
and after interventions. When specific dimensions of self-concept are relevant to
an intervention, the SDQ has been effective in the documentation of increases in
self-concept. The current research employed this measure to investigate the
existence of decreases in self-concept after a psycho-educational assessment.
This measure was employed because it delineates specific dimensions of self-
concept. These analyses would not have been possible with a global measure of
self-concept.

57
The means and standard deviations for all the SDQ-I subscales and
control scores were comparable to those provided by Marsh (1990). However,
the use of four subscales which were administered as a short form post-test
measure for reading, math, general-school and general-self concept was of
questionable value as the alpha reliability internal consistency scores were
substantially lower than those obtained when the measure was administered in
its entirety. Since the internal consistency scores were so different upon re-
administration, it is possible confusion played a part in the lower scores.
Although it could have been fatigue as well, this appears less likely as the post-
test anxiety measure did not suffer a similar decrease in reliability and was
administered immediately prior to the administration of the self-concept post-test
measure. Further investigation to determine reliability for subscales from this
measure administered alone would be appropriate before attempts to utilize the
measure in a similar manner are pursued.
Locus of Control
The results obtained from regressions calculated with the locus of control
measure indicated that none of the locus of control domain sub-scales
significantly predicted post-test anxiety. Additionally, the locus of control results
appear to indicate that SPED referral students demonstrate more variability than
TAG referral students when attempting to define who or what controls what
happens to them. Perhaps frustrating academic experiences cause students to
have less certainty about attributions for events in their lives.

58
Parent Characteristics
The connection between a child’s self-concept and their relationship to
their primary caregivers has been examined extensively (Delaney, 1996;
Givelber, 1985; Hojat, et al., 1990; Lamborn, et al., 1991; Powell, et al., 1995).
The current study used measures of self-concept and anxiety to investigate the
impact that parent style and verbal interaction with parents had on student’s self-
concept. By utilizing both broad and specific measures of student’s perceptions
of their parents, it was possible to investigate the impact of these relationships in
different dimensions.
The hypothesis that poor parent verbal interactions would predict lower
self-concept was supported. The trend toward investigating the verbal
interactional patterns between parents and children is increasing, as indicated by
recently designed scales to measure the verbal patterns between parents and
their children (e. g., Blake & Slate, 1993; Solomon & Serres, 1999). Solomon
and Serres investigated verbal interaction with parents in conjunction with a self-
esteem measure and characterized harsh or poor verbal interactions as verbal
aggression. Their findings revealed that children who reported frequent verbal
aggression from primary caregivers perceived themselves as less competent
than those who reported less verbal aggression. The results of the current
research support Solomon and Serres’ findings that poor verbal interaction with
parents predicts lower general self-concept. Understanding how verbal
interaction with parents interacts with children’s general self-concept is important

59
as researchers seek a more complete understanding of what assists and
impedes children in their development toward adulthood.
Hypothesis 6, which suggested that positive parent verbal interaction
would predict lower anxiety was not supported by the current research. Although
positive verbal interaction with parents provides students with a better foundation
for self-concept, it may not buffer them from anxiety in stressful academic
situations. Thus, students with good parental relationships may still experience
increased anxiety in challenging academic situations.
Although hypothesis 7, which stated that children who categorized their
parents as Authoritative would have higher general self-concept, was not
supported, data analysis revealed a great amount of variability within the
Permissive parent group. These results may suggest the need to refine the
measure of parenting style when it is used with younger students who are less
likely than adolescents to portray their parents negatively (Solomon & Serres,
1999). As this measure contained several items which were answered “true” or
“false”, younger children may have more difficulty differentiating parenting
practices when provided with only two choices for some items, resulting in poor
categorization between parenting groups.
Limitations of the Current Research
The current study was limited by a variety of factors. One important
problem was the large number of individuals who acted as data collectors. There
were a total of 9 persons who conducted interviews and 19 persons who

60
collected test session data. While this study could not have been done without
the generous assistance of those 28 individuals, it is possible that the variability
inherent in utilizing so many different data collectors might have altered results.
Nevertheless, multiple examiners are typically employed by large school districts
to administer evaluations. Thus, such variability is often part of the assessment
process, even though it makes well controlled experimental designs more
problematic.
Another possible limitation of this study involved whether accurate
responses were received from students relating to their relationships with their
parents. Confidentiality was guaranteed to parents (see Appendices D, E and F)
that their child’s data would not be used individually or revealed to anyone but
the primary researcher. The child assent form (see Appendix H) explained to
students that they were taking part in a voluntary project and that they could
choose not to participate at any time. The child assent form also explicitly stated
that if a child decided not to participate in the study, no individuals would be
angry or upset at the decision. However, it was not explicitly stated that self-
report information would not be given to parents or teachers. In most cases,
students were aware that their caregivers had spoken to the primary researcher
about the nature of the study, and they were aware of the direct connection
between the primary researcher and the data collectors. Additionally, the parent
verbal interaction questionnaire was extremely face valid. A sample item is “my
mother/father has threatened to slap, hit or beat me.” Given the omission on the

61
child assent form of an explicit statement regarding release of information to
parents after the interview, and given that specific questions about negative
parenting practices were asked, children may have been less than forthright with
their responses.
Another limitation of this research involved the measure of Parenting
Style. As mentioned previously, the measure included a variety of different item
types including 11 items with a three point Likert scale, two items with a five point
Likert scale, and 11 true/false items. Refinement of this measure by employing
similar Likert scales for all items might provide better distinctions on items that
currently are true/false choices, such as, “I can count on my mother to help me
out if I have some kind of problem”, may result in finer distinctions between the
two dimensions and the four parenting groups derived from the dimensions.
Comparisons between the means and standard deviations of the IPS
scores from the current research and the Lamborn et al. study were made. The
data from this study showed less variability than was noted by Lamborn et al.
which could be attributed to the adolescent age ranges (14 to 18 year olds). The
subjects of this research were much younger, typically between the ages of 9
and 12 years old. According to Solomon and Serres (1999), children in this age
range are less likely than adolescents to perceive and portray their parents
negatively. It is possible that younger students who are less likely to see their
parents negatively might need a measure that offers more item discrimination.
Despite these issues, the percentage of students assigned to parent style
62
grouping in the current study was very comparable to the percentages yielded in
the Lamborn et al. study, indicating that the breakdown into parenting style
groups was fairly consistent between the two samples.
Finally, future research should focus on the construct of locus of control.
Although not an integral part of the hypotheses, exploratory analyses were
conducted to determine whether the four main domains of locus of control,
cognitive, general, social and physical are related to post-test anxiety or general
self-concept. These results were not significant, suggesting locus of control
domains do not predict anxiety of self-concept. However, the lack of findings
should be interpreted cautiously, and should be the focus of subsequent
research.
Future Implications
Further investigation of anxiety during the course of psycho-educational
assessment can provide more information about ways in which anxiety impacts
students during an evaluation and what, if anything, practitioners need to do
about it. Since there are now scales available that strive to measure the
construct of test anxiety (Friedman & Bendas-Jacob, 1997) as compared to
anxiety in a more general form, future studies might want to incorporate these
measures into research efforts investigating anxiety during psycho-educational
assessment.
Additionally, researchers might want to investigate differences between
ethnic/cultural groups and overall anxiety trends during psycho-educational

63
assessment. The bulk of the students in this study were ethnic minorities, in
large part due to the make-up of the school district where the research was
conducted. The Dallas Public School District is commonly know as a minority-
majority district in that the majority of the students enrolled have been identified
as ethnic minorities. No hypotheses were suggested relating to ethnicity or
cultural factors because such questions were beyond the intent and scope of this
project. However, it is possible that the exclusion criteria which prevented the
enrollment of bilingual students in the SPED sample, may have in some way
altered the results of the study. The exclusion criteria resulted in a majority of
Hispanic students in the TAG sample (30%), and a majority of African-American
students in the SPED sample (31%). With such an unintended but discrepant
ethnic make-up between the two groups, it is possible that both the supported
and un-supported hypotheses are simply artifacts or confounding factors relating
to differences between anxiety in ethnic groups. If certain cultural groups
demonstrate higher levels of anxiety when compared to other cultural groups, or
when engaged in one-on-one test situations, that may have effected the current
results. Similarly, potential differences among ethnic minorities on measures of
general self-concept and/or other forms of self-concept may have contributed to
the results obtained in the current study. Future research with an emphasis on
anxiety and self-concept among different ethnic groups might provide illumination
on the effects of psycho-educational testing on anxiety and self-concept.

64
Another possible area of interest to researchers might be the effect a
history of grade retention or academic failure has on student’s academic self-
concept. This information was not included in the current study since it was also
beyond the scope of this project and such data was not available to the
researcher. Many students referred to Special Education have a history of
retention. Thus, empirical studies designed to investigate the impact grade
retention has on academic self-concept could provide helpful information to
psychologists and teachers as they work and interact with these students.
Final Conclusions
This study has provided initial empirical information that the impact of
psycho-educational evaluations on school age children is more anxiety provoking
before the session begins than after the session has ended. This research is
groundbreaking as the effects a psycho-educational assessment has on children
has not previously been investigated. While the hypothesis suggesting anxiety
would increase after the session was not supported, these findings represent
positive information for psychologists and professional psychometricians who
frequently evaluate different children each day of the week. With such a large
number of students having assessments administered, the current results are
indeed relevant and timely. Additionally, the current research supported previous
findings regarding verbal interaction between parents and their children,
indicating that negative verbal interactions predict lower general self-esteem
scores in children. In fact, other researchers have suggested that negative verbal
65
interaction can also be considered verbal aggression. With aggression becoming
a more frequent issue, the results of the current study are relevant not only to
psychology professionals, but to parents everywhere who hold primary
responsibility for the care, guidance and support of their children.

66
APPENDIX A
MULTIDIMENSIONAL MEASURE OF CHILDREN’S
PERCEPTION OF CONTROL (MMCPC)
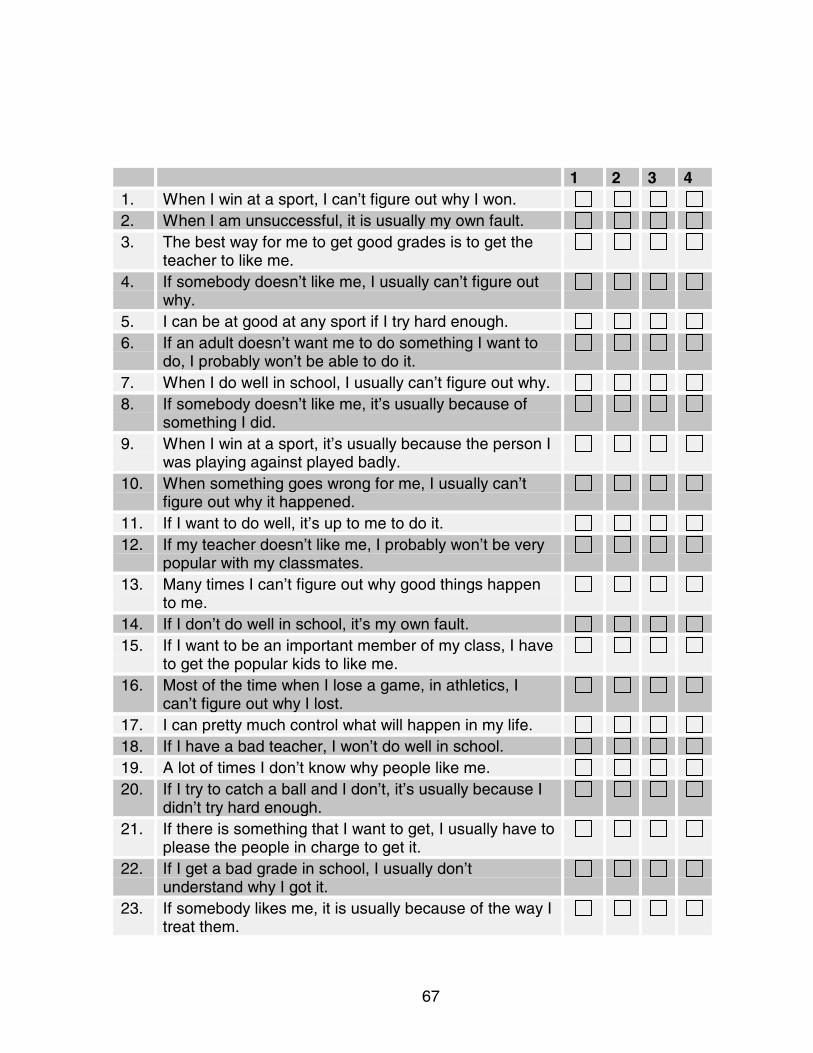
67
1 2 3 41. When I win at a sport, I can’t figure out why I won.2. When I am unsuccessful, it is usually my own fault.3. The best way for me to get good grades is to get the
teacher to like me.4. If somebody doesn’t like me, I usually can’t figure out
why.5. I can be at good at any sport if I try hard enough.6. If an adult doesn’t want me to do something I want to
do, I probably won’t be able to do it.7. When I do well in school, I usually can’t figure out why.8. If somebody doesn’t like me, it’s usually because of
something I did.9. When I win at a sport, it’s usually because the person I
was playing against played badly.10. When something goes wrong for me, I usually can’t
figure out why it happened.11. If I want to do well, it’s up to me to do it.12. If my teacher doesn’t like me, I probably won’t be very
popular with my classmates.13. Many times I can’t figure out why good things happen
to me.14. If I don’t do well in school, it’s my own fault.15. If I want to be an important member of my class, I have
to get the popular kids to like me.16. Most of the time when I lose a game, in athletics, I
can’t figure out why I lost.17. I can pretty much control what will happen in my life.18. If I have a bad teacher, I won’t do well in school.19. A lot of times I don’t know why people like me.20. If I try to catch a ball and I don’t, it’s usually because I
didn’t try hard enough.21. If there is something that I want to get, I usually have to
please the people in charge to get it.22. If I get a bad grade in school, I usually don’t
understand why I got it.23. If somebody likes me, it is usually because of the way I
treat them.

68
1 2 3 424 When I lose at an outdoor game, it is usually because
the kid I played against was much better at that gameto begin with.
25. When I win at an outdoor game, a lot of times I don’tknow why I won.
26. When I don’t do well at something, it is usually my ownfault.
27. When I do well in school, it’s because the teacher likesme.
28. When another kid doesn’t like me, I usually don’t knowwhy.
29. I can be good at any sport if I try hard enough.30. I don’t have much chance of doing what I want if adults
don’t want me to do it.31. When I get a good grade in school I usually don’t know
why I did so well.32. If someone is mean to me, it’s usually because of the
way I treat them.33. When I play an outdoor game against another kid, and
I win, it’s probably because the other kid didn’t playwell.
34. A lot of times I don’t know why something goes wrongfor me.
35. If I want to get good grades in school, it’s up to me todo it.
36. If the teacher doesn’t like me, I probably won’t havemany friends in that class.
37. When good things happen to me, many times theredoesn’t seem to be any reason why.
38. If I get bad grades, it’s my own fault.39. If I want my classmates to think that I am an important
person, I have to be friends with the really popular kids.40. When I don’t win an outdoor game, most of the time I
can’t figure out why.41. I can pretty much decide what will happen in my life.42. If I don’t have a good teacher, I won’t do well in school.
1 2 3 443. A lot of times there doesn’t seem to be any reason why

69
somebody likes me.44. If I try to catch a ball and I don’t, it’s usually because I
didn’t try hard enough.45. To get what I want, I have to please the people in
charge.46. When I don’t do well in school, I usually can’t figure out
why.47. If somebody is my friend, it is usually because of the
way that I treat him/her48. When I don’t win at an outdoor game, the person I was
playing against was probably a lot better than I was.

70
APPENDIX B
INDEX OF PARENTING STYLE (IPS)

71
T = true F = false1 I can count on my father to help me out, if I have some
kind of problem.T F
2 I can count on my mother to help me out if I have somekind of problem.
T F
3 He keeps pushing me to do my best in whatever I do. T F4 She keeps pushing me to do my best in whatever I do. T F5 He keeps pushing me to think independently. T F6 She keeps pushing me to think independently. T F7 He helps me out with my school work if there is
something I don’t understand.T F
8 She helps me out with my school work if there issomething I don’t understand.
T F
9 When he wants me to do something, he explains why. T F10 When she wants me to do something, she explains why. T F
N = never S = sometimes U = usually11 When you get a poor (bad) grade in school, how often do
your parents try to encourage you to try harder?N S U
12 When you get a good grade in school, how often do yourparents praise you?
N S U
1=don’t know 2=know a little 3=know a lot13 How much do your parents really know who your friends
are?1 2 3
1= almost every day 2=a few times a week 3=almost never14 How often do your parents spend time just talking with
you?1 2 3
15 How often does your family do something fun together? 1 2 3
1=not allowed out 2=before 8pm 3=8 to 9pm 4=9 to 10pm 5=as lateas I want16 In a typical week, what is the latest you can stay out at
night on school nights?1 2 3 4 5
17 In a typical week, what is the latest you can stay outon Friday or Saturday nights?
1 2 3 4 5

72
Y = yes N = no18 My parents know exactly where I am most afternoons after
school.Y N
1 = don’t try 2 = try a little 3 = try a lot19 How much do your parents TRY to know where you go at
night?1 2 3
20 How much do your parents TRY to know what you do withyour free time?
1 2 3
21 How much do your parents TRY to know where you are mostafternoons after school?
1 2 3
1 = don’t know 2 = know a little 3 = know a lot22 How much do your parents REALLY know where you go at
night?1 2 3
23 How much do your parents REALLY know what you do withyour free time?
1 2 3
24 How much do your parents REALLY know where you aremost afternoons after school?
1 2 3

73
APPENDIX C
PARENT VERBAL INTERACTION

74
Female: 1=often 2=sometimes 3=neverMale: 4=often 5=sometimes 6=neverFemale: Male 1 2 3 4 5 61. My parent praises me when I do somethingwell.2. My parent yells at me.3. I argue with my parent.4. My parent calls me names that hurt myfeelings.5. I talk my problems over with my parent.6. My parent accepts my opinions about things.7. My parent belittles me by saying things like,“you are dumb,” or “you are lazy.”8. My parent compliments me.9. My parent listens to me.10. My parent uses profanity when he/she isangry with me.11. My parent has threatened to slap, hit, or beatme.12. My parent tells other people nice things aboutme.13. My parent is angry with me whenever we talk.14. My parent says that my brother or sister issmarter, better looking, nicer or more talentedthan I am.15. My parent tells me s/he is proud of me.16. My parent says negative things about me infront of others.17. Even when I do something well, my parenttells me I could do better.18. My parent finds fault with everything I do.19. My parent tells me s/he loves me.20. My parent tells me I am doing well when I tryeven if I do not do it perfectly.21. I know I can talk to my parent, even when Ido something wrong.22. My parent supports my extracurricularactivities.
1 2 3 4 5 6

75
23. My parent makes negative remarks about theway I look.24. My parent tells me I am wanted and special.25. My parent speaks to me in a warm caringtone of voice.26. My parent calls attention to my mistakes infront of others.27. My parent tells me s/he wishes I had neverbeen born.28. My parent asks me how I feel about things.29. My parent tells me I am a liar.30. Whenever I try to talk to my parent aboutsomething serious, I feel safe and accepted.
76
APPENDIX D
ENGLISH VERSION
PARENT INFORMED CONSENT (TAG)
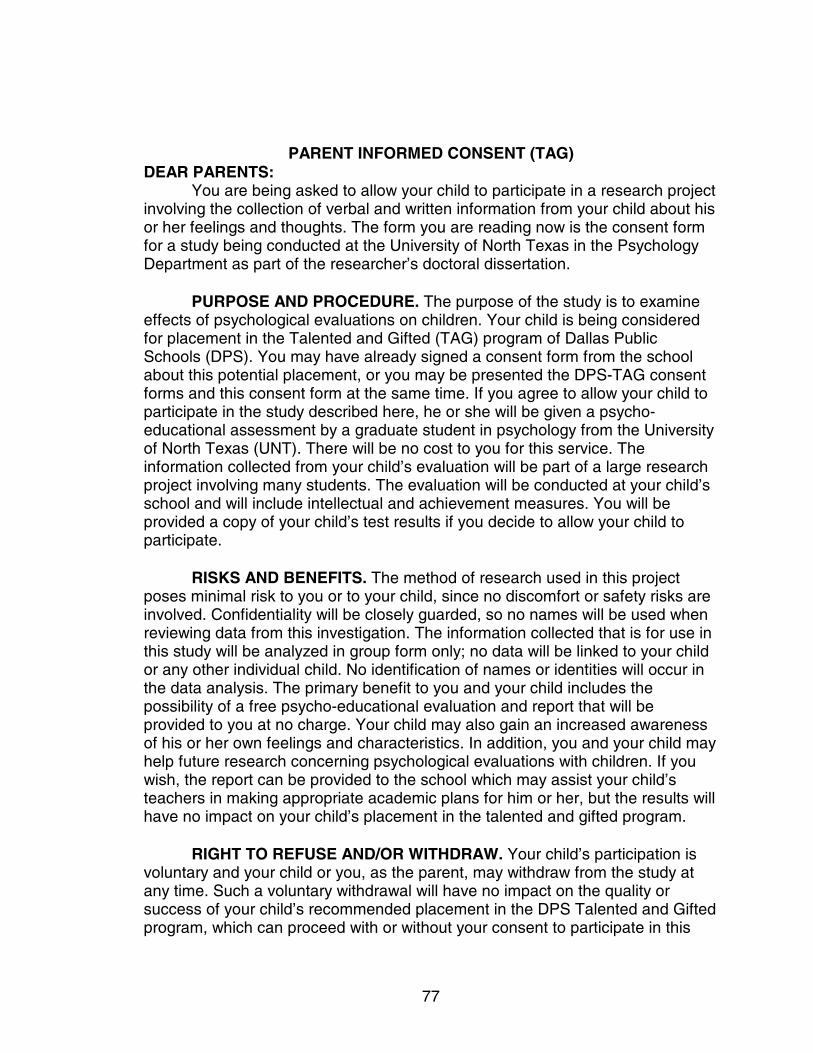
77
PARENT INFORMED CONSENT (TAG)DEAR PARENTS:
You are being asked to allow your child to participate in a research projectinvolving the collection of verbal and written information from your child about hisor her feelings and thoughts. The form you are reading now is the consent formfor a study being conducted at the University of North Texas in the PsychologyDepartment as part of the researcher’s doctoral dissertation.
PURPOSE AND PROCEDURE. The purpose of the study is to examineeffects of psychological evaluations on children. Your child is being consideredfor placement in the Talented and Gifted (TAG) program of Dallas PublicSchools (DPS). You may have already signed a consent form from the schoolabout this potential placement, or you may be presented the DPS-TAG consentforms and this consent form at the same time. If you agree to allow your child toparticipate in the study described here, he or she will be given a psycho-educational assessment by a graduate student in psychology from the Universityof North Texas (UNT). There will be no cost to you for this service. Theinformation collected from your child’s evaluation will be part of a large researchproject involving many students. The evaluation will be conducted at your child’sschool and will include intellectual and achievement measures. You will beprovided a copy of your child’s test results if you decide to allow your child toparticipate.
RISKS AND BENEFITS. The method of research used in this projectposes minimal risk to you or to your child, since no discomfort or safety risks areinvolved. Confidentiality will be closely guarded, so no names will be used whenreviewing data from this investigation. The information collected that is for use inthis study will be analyzed in group form only; no data will be linked to your childor any other individual child. No identification of names or identities will occur inthe data analysis. The primary benefit to you and your child includes thepossibility of a free psycho-educational evaluation and report that will beprovided to you at no charge. Your child may also gain an increased awarenessof his or her own feelings and characteristics. In addition, you and your child mayhelp future research concerning psychological evaluations with children. If youwish, the report can be provided to the school which may assist your child’steachers in making appropriate academic plans for him or her, but the results willhave no impact on your child’s placement in the talented and gifted program.
RIGHT TO REFUSE AND/OR WITHDRAW. Your child’s participation isvoluntary and your child or you, as the parent, may withdraw from the study atany time. Such a voluntary withdrawal will have no impact on the quality orsuccess of your child’s recommended placement in the DPS Talented and Giftedprogram, which can proceed with or without your consent to participate in this

78
research. In other words, the placement suggested by the school will not beaffected by your child’s participation or lack of participation in this study.
FOR FURTHER INFORMATION. If you have any questions or concerns,you may contact the researcher, Martha Buenrostro at 972/982-1290 or thefaculty supervisor of this project, Dr. Silverthorn, at 940/565-2655 or metro817/267-3731 ext. 2655.
INFORMED CONSENT. I understand the risks and benefits of allowingmy child to participate. I understand that my child or I can withdraw fromparticipation at any time.
//Signature of parent date Name of student/age/gradeThis project has been reviewed and approved by the University of North TexasInstitutional Review Board for the protection of Human Subjects in Research940/565-3940

79
APPENDIX E
SPANISH VERSION
PARENT INFORMED CONSENT (TAG)

80
CONSENTIMIENTO INFORMADO DE PADRE
ESTIMADOS PADRES:Se pide su permiso para que su niño/niña participe en una investigación
que requiere la colección de información verbal y escrita. Su niño/niña daráinformación segun sus pensamientos y sentimientos. Con su firma esta dandopermiso para la participación de su hijo/hija en la investigación que es parte deun requisito de la Escuela Graduada del Departamento de Psicología de laUniversidad de North Texas.
INTENTO Y PROCEDIMIENTO. El intento de la investigación es examinar losefectos de evaluaciónes psicológicas en los niños. Su escuela está en elproceso de evaluar la elegibilidad de su niño para participar en el programa TAG(programa para niños talentosos). Si está de acuerdo con la participación de suhijo/hija en este investigación, una estudiante de la escuela graduado de laUniversidad de North Texas le dará a su hijo/hija lo siguiente: una evaluación deinteligencia, una evaluación de aprovechamiento y una prueba de integraciónvisual y motor. Se ofrece este servicio gratis. La evaluación se conducirá en laescuela de su niño/niña. Recibirá Ud. una copia de los resultados de laevaluación si decide dejar que su hijo/hija participe. El proyecto incluiráaproximadamente 90 alumnos de las escuelas en Dallas.
RIESGOS Y BENEFICIOS. El método de la investigación que se usará en esteproyecto no presentará riesgos significantes a su hijo/hija. La confidencialidadserá respetada. Los nombres no se usarán cuando se revisen los resultados. Elbeneficio primario es la evaluación psicológica y el reporte que le daremos. Elreporte que reciba estará escrito en ingles. Si gustaria una explicación enespañol será disponible y se podrá comunicar con Marta Buenrostro al (972)982-1290. Esta evaluación se hace como parte de una investigación y elproceso que se usa para determinar participación en el programa de TAG esdiferente. Asi que los resultados de esta evaluación no afectarán la decisión dela escuela segun la selección de niños al programa TAG.
DERECHO DE NEGAR O SALIR DE UNA INVESTIGACIÓN. La participaciónde su hijo/hija es voluntaria. Su hijo/hija o Ud., como padre, pueden salir de lainvestigación cuando gusten. El salirse de la investigación no afectará laselección o recomendación de el programa TAG.
PARA OBTENER MAS INFORMACIÓN. Se podrá comunicar con MartaBuenrostro al (972) 982-1290 o la Profesora encarga de la investigación Dra.Persephanie Silverthorn, al (940) 565-2655 o metro (817) 267-3731 ext. 2655.

81
CONSENTIMIENTO INFORMADO. Entiendo los beneficios y riesgos de dejar ami hijo/hija que participe en este investigación. Entiendo también que mi hijo/hijao yo podemos dejar la investigación en cualquier momento.
//Firma de Padre fecha Estudiante/edad/gradoEste proyecto ha sido revisado y aprobado por el Cuerpo Institucional deInvestigaciónes el la Universidad de North Texas. Para preguntas hacia losderechos de participantes, se pueden comunicar al telefono Metro (817) 267-3731 ext. 3940.

82
APPENDIX F
PARENT INFORMED CONSENT (SPED)

83
PARENT INFORMED CONSENT (SPED)
DEAR PARENTS:You are being asked to allow your child to participate in a research project
involving the collection of verbal and written information from your child about hisor her feelings and thoughts. The letter you are reading is the consent form for astudy being conducted at the University of North Texas (UNT) in the PsychologyDepartment as part of the researcher’s doctoral dissertation.
PURPOSE AND PROCEDURE. The purpose of the study is to examineeffects of psychological evaluations on children. If you agree to allow your childto participate, this information will be collected during the psychologicalevaluation that has already been recommended by the faculty of the school yourchild attends to find out if your child will receive Special Education services. Youmay have already signed a consent form from the school about this upcomingevaluation or you may get this form at the same time you receive the consentpaperwork from the school.
RISKS AND BENEFITS. The method of research used in this projectposes minimal risk to you or your child, since no discomfort or safety risks areinvolved. Confidentiality will be closely guarded, so names will not be used whenreviewing results of this investigation. The information collected that is for use inthis study will be analyzed in group form only; no data will be linked to your childor any other individual child. No identification of names or identities will occur inthe data analysis. The benefit to your child includes the possibility that he or shewill gain an increased awareness of his or her own feelings and characteristics.In addition, you and your child may help benefit future research in the area ofpsychological evaluation of children.
RIGHT TO REFUSE AND/OR WITHDRAW. Your child’s participation isvoluntary and your child or you, as the parent, may withdraw from the study atany time. Such a voluntary withdrawal will have no impact on the quality orsuccess of your child’s recommended evaluation and referral to SpecialEducation, which can proceed without your consent to participate in thisresearch. In other words, the evaluation suggested by the school will not benegatively affected by your child’s participation or lack of participation in thisstudy.
FOR FURTHER INFORMATION. If you have any questions or concerns,you may contact the researcher, Martha Buenrostro at 972/982-1290 or thefaculty supervisor of this project, Dr. Silverthorn, who can be reached at 940/565-2655 or metro 817/267-3731 ext. 2655.

84
INFORMED CONSENT. I understand the risks and benefits of allowingmy child to participate. I understand that my child or I can withdraw fromparticipation at any time.
//Signature of parent date Name of student/age/gradeThis project has been reviewed and approved by the University of North TexasInstitutional Review Board for the protection of Human Subjects in Research940/565-3960

85
APPENDIX G
INSTRUCTIONS FOR INTERVIEW

86
Instructions to Research Assistants
Thank you for your willingness to assist in this research. Your help isappreciated!! You will be administering several self-report measures to schoolage children in the 4th 5th and 6th grades in Dallas Public Schools. You musthave your UNT student ID badge with you when you go to these campusesto assist in this research. If you have any questions regarding these instructionsplease contact Martha Buenrostro at 972/982-1290 or 972/681-5669.
1. Go to the school office and sign in as a visitor. (Wear UNT ID badge)2. Ask office staff where child can be found. (teacher’s room number)3. Ask office staff where testing can take place. (Set up materials before
bringing student.)4. Go to the child’s classroom and give teacher the LIGHT BLUE notification
form. Be sure to ask about lunch breaks (if applicable) so you can let thechild eat at the same time as the class. Ask where the child should returnwhen testing has been completed. (gym, music etc.)
5. Introduce yourself to the student and call them by name. Provide briefexplanation about testing. (Part of a study, parent has already signedpermission, etc.).
6. Take child to testing location where materials are set up.7. You should read all the items to the child and mark the answers they
indicate. Some explanations may be needed for the child to understand theconcepts involved. When the questionnaire format changes, go over thechange briefly with the child. If you have problems or want clarification,contact Martha Buenrostro @ 972/982-1290 or 972/681-5669.
8. Read the PINK child assent form to student, have student sign the form;you sign below.
9. Administer the following measures in this order: How I Feel Questionnaire STAIC (20 items). YELLOW Self Description Questionnaire SDQ (76 items). BRIGHT BLUE Multidimensional Measure of Children’s Perception of Control MMCPCRED Index of Parenting Style IPS (24 items). BRIGHT ORANGE Parent Verbal Interaction Questionnaire PVIQ (30 items). PEACH10. Tell the child you appreciate their help and accompany child back to class.11. Score the Self Description Questionnaire using WHITE scoring sheets and
“mini” manual.12. Put all the measures and the Child Assent Form in the envelope.Call Martha Buenrostro to arrange pickup of materials.

87
APPENDIX H
CHILD ASSENT FORM

88
CHILD ASSENT FORM
The following form will be read to the child prior to the psychological evaluation.Parental consent will have been obtained prior to reading the form to the child.
You are being asked to participate in a study about children who havepsychological evaluations. Your parent has already agreed that you can be inthis study, if you want to. You can decide to be in the study or you can decidethat you don’t want to be in the study. Nothing bad will happen if you decide notto participate in the study, and no one at the school will be mad or upset at you ifyou choose not to participate.
If you decide that you do want to be in the study, you will be asked manyquestions about how you feel about yourself. Your answers to the questionsabout you can not be right or wrong, because they are just about how you thinkand feel. You will also be asked to do different types of work like what you do atschool in your classroom. Some of these things will be easy for you and somewill be hard, but no one is expected to get them all right. Just do the best youcan.
This form was read and explained to me. I agree to participate in thisstudy. I understand that I can change my mind and that I can stop being in thestudy at any time.
Child date
Examiner date
1. This project has been reviewed and approved by the University of NorthTexas Institutional Review Board for the Protection of Human Subjects inResearch 940/565-3940.

89
APPENDIX I
INSTRUCTIONS FOR
GRADUATE STUDENT EXAMINERS

90
Instructions to Graduate Student Examiners
Thank you for your willingness to assist in this research. Your help isappreciated!!I am collecting data for my dissertation. If you have questions, contact me foradditional information. Martha Buenrostro (972) 982-1290.
1. Go to school office and sign in as a visitor. (Show UNT ID badge)2. Ask office staff where child can be found. (Teacher, grade, room number, PE,
recess etc.)3. Ask office staff where testing can take place. (Get room and testing materials
set up before retrieving child).4. Go to the child’s classroom and ask teacher to allow student to be tested. Be
sure to ask about lunch breaks so you can let the child eat at the same timeas his/her class. Ask where the child should return when testing has beencompleted.
5. Introduce yourself to child and call the child by name. Provide briefexplanation about testing (part of a study, parent has already signedpermission, etc.).
6. Take child to testing location where materials are set up.7. You need to read all the self-report measures to child and mark the
answers they indicate. Some explanations may be needed for the child tounderstand the concepts involved.
A) Administer the BLUE How I Feel Questionnaire (STAIC A). B) Administer the WISC-III (standard administration).
C) Administer the WIAT (standard administration).D) Administer the PURPLE How I Feel Questionnaire (STAIC A).E) Administer the GREEN Self Description Questionnaire (state).
8. After testing, score results and prepare report as quickly as possible. Focuson strengths and weaknesses and practical recommendations for anyproblem areas. Obtain supervising psychologist signature so report can beprovided to parents ASAP.
9. Place all completed test materials (protocols), and the original signedreport in the envelope.
10. Contact Martha to report case as completed and to arrange for pick up ofpacket.

91
APPENDIX J
INSTRUCTIONS FOR
DALLAS PUBLIC SCHOOL EXAMINERS

92
Instructions to PSDS Examiners
Thank you for your willingness to assist in this research. Your help isappreciated!! I am collecting data for my dissertation about the effectassessment has on children. Below are specific instructions for assisting with thisresearch. If you have questions, contact me for information: Martha Buenrostro(972) 982-1290.
1. Take student to testing location where materials are set up.
2. Begin by administering the BLUE How I Feel Questionnaire to child. Mark
student’s answers.
3. Administer the WISC-III (standard administration).
4. Administer the WIAT (standard administration).
5. Administer the PURPLE How I Feel Questionnaire.
6. Administer the GREEN Self Description Questionnaire (state).
7. After testing, photocopy the front page/Summary Record Form from the
WISC and the WIAT protocols. Place the photocopies along with
measures in the envelope provided. Put envelope in Martha Buenrostro’s
mail box.

93
APPENDIX M
TABLES

94
Table 1
Demographic Variables of Student Participants
________________________________________________________________ TAG SPED
n % n %________________________________________________________________
Sexa
Female 23 31.1 8 10.8
Male 18 24.3 25 33.8
Gradea
Fourth Grade 12 16.2 22 29.7
Fifth Grade 18 24.3 4 5.4
Sixth Grade 11 14.9 7 9.5
Ethnicitya
African American/Black 5 6.8 23 31.1
Hispanic/Latino 22 29.7 6 8.1
Other 4 5.4 0 0.0
Caucasian/White 10 13.5 4 5.4
Caregiverb
Female/Primary Caregiver 35 50.0 28 40.0
Other 2 2.8 5 7.0
Father/Secondary Caregiver 29 44.6 23 35.4
Other 9 11.0 11 9.0
(table continues)

95
________________________________________________________________
TAG SPEDn % n %
_______________________________________________________________WISC-III Full Scalec
below 85 0 0 17 61
85-100 18 60 9 32
100-115 10 33 2 07
above 115 2 07 0 0
WISC-III Verbalc
below 85 4 13 19 68
85-100 14 47 7 25
100-115 8 27 2 07
above 115 2 13 0 0
WISC-III Performancec
below 85 3 10 13 46
85-100 13 43 10 36
100-115 10 33 4 14
above 115 4 13 1 04
_______________________________________________________________
Note. N = 74 for variables with asex, agrade, and aethnicity, N = 70 for b female
caregiver, N = 65 for bmale caregiver, cWISC-III scores N = 30 for TAG group, N
= 28 for SPED group.

96
Table 2
Means, Standard Deviations, Range: Self-Concept Sub-scales by Referral Type
________________________________________________________________________________________TAG SPED TOTAL
M SD range M SD range M SD range_________________________________________________________________________________________________________________________________________
Physical Abilities 30.02 6.53 17-40 34.15 4.34 24-40 31.86 5.99 17-40
PhysicalAppearance
29.44 7.21 15-40 31.21 7.02 12-40 30.23 7.13 12-40
Peer Relations 31.15 6.83 13-40 30.88 6.73 15-40 31.03 6.74 13-40
Parent Relations 34.66 5.74 17-40 36.03 5.79 21-40 35.27 5.76 17-40
Reading 32.02 7.33 14-40 29.48 9.18 8-40 30.89 8.24 8-40
Math 32.61 7.99 12-40 32.27 7.96 12-40 32.46 7.92 12-40
General School 30.41 6.43 14-40 25.94 7.81 9-38 28.42 7.38 9-40
General Self 34.17 5.15 18-40 33.55 5.17 19-40 33.89 5.13 18-40
Total Non-Academic
31.49 4.98 20-40 33.21 3.94 25-40 32.26 4.60 20-40
Total Academic 32.02 4.90 23-40 29.18 5.78 13-38 30.76 5.46 13-40_________________________________________________________________________________________
Note. N = 41 for TAG group, N = 33 for SPED group, N = 74 for Total. Five - point Likert-type scale, 1 to 5.

97
Table 3
Self Description Questionnaire I Sub-scale Intercorrelations
_________________________________________________________________________________________________________________________________________
____physicalability
physicalappear
peerrelation
parentrelation
reading math generalschool
generalself
non-academic
academic totalself
_____________________________________________________________________________________________________________
physicalability
1.00
physicalappearance
.421** 1.00
peerrelations
.206 .546** 1.00
parentrelation
.072 .309** .505** 1.00
reading .022 .135 .125 .275* 1.00
math .170 .285* .254* .167 -.166 1.00
generalschool
-.077 .185 .214 .332** .546** .394** 1.00
generalself
.289* .600** .517** .442** .364** .239* .420** 1.00
non-academic
.594** .817** .792** .639** .192 .309** .231* .365** 1.00
academic .070 .318** .294* .349** .608** .597** .868** .486** .365** 1.00
total self .375** .665** .645** .586** .496** .556** .687** .677** .801** .847** 1.00
_____________________________________________________________________________________________________________
Note. N = 74. *p< .05. **p < .01.

98
Table 4
Post-test Self Description Questionnaire Sub-scale Intercorrelations
_________________________________________________________________________________________________
___
post-reading post-math post-generalschool
post-generalself
_______________________________________________________________________________post-reading
1.00post-math
.058 1.00post-generalschool .668** .571** 1.00
post-generalself .579** .302* .559** 1.00
________________________________________________________________
Note. N = 58. *p< .05. **p < .01.

99
Table 5
Means, Standard Deviations, Range: Locus of Control Sub-scales
___________________________________________________________________________________________TAG SPED TOTAL
M SD range M SD range M SD range__________________________________________________________________________________________Cognitive Domain 32.29 4.29 22-44 35.64 6.39 23-48 33.78 5.54 22-48
General Domain 32.37 5.30 19-43 32.33 6.32 20-46 32.32 5.77 19-46
Physical Domain 30.02 5.24 19-41 31.64 7.16 18-44 30.74 6.17 18-44
Social Domain 29.27 4.25 20-38 29.18 5.67 19-38 29.22 4.89 19-38
Internal Control 52.88 6.97 37-65 52.97 7.39 35-63 52.90 7.15 35-65
Powerful Others 33.05 6.19 20-43 35.00 9.42 18-60 33.91 7.80 18-60
Unknown 38.02 8.42 22-59 40.82 9.86 22-57 39.27 9.13 22-59
Cognitive/Internal 16.17 2.28 11-20 17.48 2.24 12-20 16.75 2.33 11-20
Cognitive/Powerful Others 7.66 2.46 4-14 8.12 3.26 4-16 7.86 2.83 4-16
Cognitive/Unknown 8.46 2.72 4-14 10.03 3.81 4-16 9.16 3.32 4-16
(table continues)

100
___________________________________________________________________________________________ TAG SPED TOTAL
M SD range M SD range M SD range__________________________________________________________________________________________General/Internal 11.15 2.41 4-16 10.58 2.87 4-16 10.89 2.62 4-16
General/Powerful Others 10.85 2.62 4-16 10.64 3.44 4-16 10.75 2.99 4-16
General/Unknown 10.37 2.72 4-16 11.12 2.52 6-16 10.70 2.64 4-16
Physical/Internal 13.00 2.29 7-16 13.21 2.71 8-16 13.09 2.47 7-16
Physical/Powerful Others 8.02 2.08 3-12 8.76 2.73 3-12 8.35 2.40 3-12
Physical/Unknown 9.00 2.89 4-16 9.67 3.30 4-16 9.29 3.07 4-16
Social/Internal 12.56 2.28 8-16 11.70 3.15 5-16 12.17 2.71 5-16
Social/Powerful Others 6.51 2.03 4-12 7.48 3.60 4-16 6.94 2.85 4-16
Social/Unknown 10.20 2.62 5-16 10.00 2.85 4-16 10.10 2.70 4-16___________________________________________________________________________________________
Note. N = 41 for TAG group, N = 33 for SPED group, N = 74 for Total. Four - point Likert-type scale, 1 to 4.

101
Table 6
Locus of Control Sub-scale Intercorrelations
_________________________________________________________________________________cognitive general physical social internal powerful unknown
________________________________________________________________________________cognitive 1.00
general .551** 1.00
physical .685** .644** 1.00
social .455** .495** .580** 1.00
internal .499** .687** .616** .558** 1.00
powerful .646** .602** .651** .608** .347** 1.00
unknown .719** .614** .771** .561** .375** .412** 1.00
__________________________________________________________________________________Note. N = 74.

102
Table 7
Sub-scale Intercorrelations Among Self-Report Variables
_________________________________________________________________________________________________________________________________________
____
anxietyT1 anxietyT2 anxietyT3 cognitiveb generalb socialb internalb strictnesc warmthc verbald
_______________________________________________________________________________________________________________
physical abilitya -.003 -.163 -.116 .157 .099 .085 .134 .060 .069 .156
physical appa -.336** -.320* -.229 .036 .094 -.031 .020 .162 .378** .276*
peer relationsa -.285** -.192 -.042 -.172 -.125 -.248* -.179 .111 .342** .249*
parent relationa -.150 -.240 -.189 -.029 -.061 -.192 -.151 .374** .399** .195
readinga -.300** -.251 -.248 -.089 .077 .074 .005 .294* .173 .031
matha -.135 -.184 -.132 -.044 -.061 -.148 -.034 -.050 .008 .226
general scha -.382** -.254 -.310* -.065 -.020 -.058 -.003 .191 .109 .159
general selfa -.346** -.290* -.159 -.015 .081 -.050 .109 .416** .301** .425**
non-academica -.267* -.309* -.195 -.006 .000 -.129 -.056 .194 .418** .309**
academica -.386** -.332** -.323* -.123 .011 -.065 -.002 .210 .147 .201
(table continues)

103
_________________________________________________________________________________________________________________________________________
____anxietyT1 anxietyT2 anxietyT3 cognitive
b
generalb socialb internalb strictnesc warmthc verbald
_______________________________________________________________________________________________________________
strictnessc-.237* -.151 -.115 .008 .158 .064 .169 1.00 .317** .445**
warmthc-.126 -.224 -.359** .038 .176 -.011 .138 .317** 1.00 .170
verbald -.266* -.212 -.240 .165 .274* -.029 .174 .445** .170 1.00
anxietyT1 1.00 .653** .450** .272* -.206 .128 -.041 -.237* -.126 -.266*
anxietyT2 .653** 1.00 .657** -.066 -.285* .066 -.174 -.151 -.224 -.212
anxietyT3 .450** .657** 1.00 -.053 -.237 -.042 -.223 -.115 -.359** -.240
post-reade -.191 -.135 -.327* -.101 .136 .020 .156 .026 .152 -.052
post-mathe -.014 -.224 -.354** -.048 .108 -.076 .091 -.046 .210 .289*
post-gen/sche -.172 -.156 -.394* -.099 .165 .018 .175 -.048 .313* .089
post-gen/selfe -.320* -.496** -.409** -.020 .083 -.010 .033 .161 .353** .043______________________________________________________________________________________________________________
Note. AnxietyT1, T2, T3 are STAIC totals. a Self Description Questionnaire-I. b Multidimensional Measure of
Children’s Perception of Control. c Parenting Style Dimensions. d Parent Verbal Interaction. e Post-test Self
Description - I subscales. *p< .05. **p < .01.

104
Table 8
Means, and Standard Deviations of STAIC-A
_______________________________________________________________
N M SD______________________________________________________________F (2, 53) = 6.77, p =.002
STAIC-A (T1)
TAG 30 29.30a 4.36
SPED 28 31.64a 6.44
STAIC-A (T2)
TAG 29 29.03a 3.72
SPED 27 29.30a 6.42
STAIC-A (T3 )
TAG 30 27.07b 3.97
SPED 27 27.67b 6.58
______________________________________________________________
Note. N = 58. SPED = Referral for Special Education, STAIC-A = State Trait
Anxiety Scale for Children - A scale, TAG = Referral for Talented and Gifted.
Different letter superscripts show significant differences between means based
on Tukey’s post hoc analysis.

105
Table 9
Means, Standard Deviations, and Demographics of Parenting Style Groups
______________________________________________________________
Authoritative Authoritarian Permissive Neglectful___________________________________________________________
_____________________________________
F(3,54) = 1.48, p = .231
Warmth/Involvement M 3.62 -2.13 2.01 -3.84
SD 2.32 2.90 1.57 2.61
Strictness/Supervision
M 4.39 1.85 -3.43 -2.61
SD 1.73 7.23 4.65 3.06
TAG Referral Group
n 13 3 9 16
% 17.6 4.1 12.2 21.6
SPED Referral Group
n 12 3 8 10
% 16.2 4.1 10.8 13.5
Total Sample
n 25 7 16 26
% 33.8 9.5 21.6 35.1
________________________________________________________________
Note. N = 74 Represents standardized score totals from PSI with a median split
on warmth/involvement dimension and strictness/supervision dimensions.

106
REFERENCES
Archer, S. L., & Waterman, A. S., (1988). Psychological individuation:
Gender differences or gender neutrality? Human Development, 31, 65-81.
Baumrind, D., (1971). Current patterns of parental authority.
Developmental Psychology Monographs, 4, (1 in part 2).
Blake, P. C., & Slate, J. R., (1993). A preliminary investigation into the
relationship between adolescent self-esteem and parental verbal interaction.
School Counselor, 41(2), 81-85.
Bryan, J. H., Sonnefeld, L. J., & Grabowski, B. (1983). The relationship
between fear of failure and learning disabilities. Learning Disability Quarterly, 6,
217-222.
Brooks, R. B., (1990). Fostering self-esteem in the learning disabled child
and adolescent: The search for islands of competence. The Learning Consultant
Journal, 11, 28-33
Burnett, P. C., (1994). Self-concept and self-esteem in elementary school
children. Psychology in the Schools, 31, 164-171.
Burt, C. E., Cohen, L. H., & Bjorck, J. P., (1988). Perceived family
environment as a moderator of young adolescents’ life stress adjustment.
American Journal of Community Psychology, 16(1), 101-122.

107
Cairns, E., McWhirter, L., Duffy, U. & Barry, R., (1990). The stability of
self-concept in late adolescence: gender and situational effects. Personality and
Individual Differences, 11(9), 937-944.
Chubb, N. H., Fertman, C. I., & Ross, J. L., (1997). Adolescent self
esteem and locus of control: A longitudinal study of gender and age differences.
Adolescence, 32 (125), 113-12
Connell, J. P., (1985). A new multidimensional measure of children’s
perception of control. Child Development, 56, 1018-1041.
Coopersmith, S., (1967). The antecedents of self-esteem. San Francisco:
W. H. Freeman.
Delaney, M. E., (1996). Across the transition to adolescence: Qualities of
parent/adolescent relationships and adjustment. Journal of Early Adolescence,
16(3), 274-300.
DeMan, A. F., Leduc, C. P., & Labreche-Gauthier, L., (1992). Parental
control in child rearing and multidimensional locus of control. Psychological
Reports, 70, 320-322.
Dorr, D., Pozner, R. Stephens, J., (1985). Relationship of trait anxiety to
self-esteem of children in grades 4, 5, and 6. Psychological Reports, 57(2), 467-
473.
Duke, M., & Nowicki, S., (1974). A new measure and social learning
model for interpersonal distance. Journal of Experimental Research in
Personality, 6, 119-132.
108
Enger, J. M., Howerton, D. L., & Cobbs, C. R., (1994). Internal/external
locus of control, self-esteem, and parental verbal interaction of at-risk black male
adolescents. Journal of Social Psychology, 134(3), 269-274.
Francis, G., & Ollendick, T. H., (1987). Anxiety disorders. In C. L. Frame &
J. L. Matson (Eds.), Handbook of assessment in childhood psychopathology.
New York: Plenum Press
Friedman, I. A., & Bendas-Jacob, O. (1997). Measuring perceived test-
anxiety in adolescents: A self-report scale. Educational Measurement, 57(6),
1035-1046.
Givelber, F., (1985). The parent-child relationship and the development of
self-esteem. In J. E. Mack & S. L. Ablon (Eds.), The development and
sustenance of self-esteem in childhood. New York: International Universities
Press, Inc.
Gordon, D. A., Jones, R. H., & Nowicki, S., (1979). A measure of intensity
of parental punishment. Journal of Personality Assessment, 43(5), 485-496.
Green, B. F., Jr. (1981). A primer of testing. American Psychologist, 36,
1001-1011.
Gross, A. B., & Keller, H. R., (1992). Long term consequences of
childhood physical and psychological maltreatment. Aggressive Behavior, 18,
171-185.
Harter, S., (1982). The perceived competence scale for children. Child
Development, 53, 87-97.

109
Harter, S., (1990). Processes underlying adolescent self-concept
formation. In R Montemayor, G. R. Adams, & T. P. Gullotta (Eds.), From
childhood to adolescence: A transitional period? (pp. 205-239). Newbury Park,
CA: Sage.
Hau, K. T. (1995). Confirmatory factor analyses of seven locus of control
measures. Journal of Personality Assessment, 65(1), 117-132.
Herbert, T. B., & Cohen, S. (1996). Measurement issues in research on
psychosocial stress. In H. B. Kaplan (Eds.), Psychosocial stress. San Diego:
Academic Press.
Hoghughi, M., (1980). Assessing problem children: Issues and practice.
London: Burnett Books.
Hojat, M., Borenstein, B. D., & Shapurian, R., (1990). Perception of
childhood dissatisfaction with parents and selected personality traits in
adulthood. Journal of General Psychology, 117(3), 241-253.
Holden, G. W., & Edwards, L. A., (1989). Parental attitudes toward child
rearing: Instruments, issues and implications. Psychological Bulletin, 106(1), 29-
58.
Houston, B. K., Fox, J. E., & Forbes, L., (1984). Trait anxiety and
children’s state anxiety, cognitive behaviors, and performance under stress.
Cognitive Therapy and Research, 8(6), 631-641.
Huebner, S. E., & Dew, T., (1993). Validity if the perceived life satisfaction
scale. School Psychology International, 14(4), 355-360.

110
Jacobs, D. H. (1985). Learning problems, self-esteem and delinquency. In
J. E. Mack & S. L. Ablon (Eds.), The development and sustenance of self-
esteem in childhood. New York: International Universities Press, Inc.
James, W., (1963). The principles of psychology. New York: Holt,
Rinehart & Winston. (Original work published in 1890)
Jordan, J. V., (1991). The meaning of mutuality. In J. V. Jordan, A. G.
Kaplan, J. B. Miller, I P. Stiver, & J. L. Surrey (Eds.), Women’s growth in
connection. New York: Guilford Press.
Kamphaus, R. W., & Frick, P. J., (1996). Clinical assessment of child and
adolescent personality and behavior. Boston, Massachusetts: Allyn & Bacon.
Kulas, H. K., (1996). Locus of control in adolescence: A longitudinal study.
Adolescence, 31(123), 721-729.
Lamborn, S. D., Mounts, N. S., Steinberg, L., & Dornbusch, S. M., (1991).
Patterns of competence and adjustment among adolescents from authoritative,
authoritarian, indulgent and neglectful families. Child Development, 62, 1049-
1065.
Larde, J., & Clopton, J. R. (1983). Generalized locus of control and health
locus of control of surgical patients. Psychological Reports, 52, 599-602.
Marsh, H. W., (1984). Using the national longitudinal study of 1988 to
evaluate theoretical models of self-concept: The self-description questionnaire.
Journal of Educational Psychology, 86(3), 439-456.

111
Marsh, H. W., (1986). Global self-esteem: It’s relation to specific facets of
self-concept and their importance. Journal of Personality and Social Psychology,
51(6), 1224-1236.
Marsh, H. W., (1990). Self description questionnaire - I manual.
Campbelltown, Australia: Publication Unit, University of Western Sydney.
Marsh, H. W., Barnes, J., & Hocevar, D., (1985). Self-other agreement on
multidimensional self-concept ratings: Factor analysis and multitrait-multimethod
analysis. Journal of Personality and Social Psychology, 49 (5), 1360-1377.
Marsh, H. W., Relich, J. D., & Smith, I. D., (1983a). Self-concept: The
construct validity of the interpretations based on the SDQ. Journal of Personality
and Social Psychology, 45(1), 173-187.
Marsh, H. W., Smith, I. D., & Barnes, J., (1983b). Multitrait-multimethod
analyses of the self-description questionnaire: Student-teacher agreement on
multidimensional ratings of student self-concept. American Educational
Research Journal, 20(3), 333-357.
Matthews, D. B., & Odom, B. L., (1989). Anxiety: A component of self-
esteem. Elementary School Guidance & Counseling, 24(2), 153-159.
Medeiros, D. C., Porter, B. J., & Welch, I. D., (1983). Children under
stress: How to help with the everyday stresses of childhood. New Jersey:
Prentice-Hall.

112
Nowicki, S., Jr., & Segal, W., (1974). Perceived parental characteristics,
locus of control orientation and behavioral correlates of locus of control.
Developmental Psychology, 10(1), 33-37.
Nowicki, S., Jr., & Strickland, B. R., (1973). A locus of control scale for
children. Journal of Consulting and Clinical Psychology, 40(1), 148-154.
Ollendick, T. H., (1979). Fear reduction techniques with children. In M.
Hersen, R. M. Eisler & P. M. Miller (Eds.), Progress in behavior modification.
New York: Academic Press.
Papay, J. P., & Spielberger, C. D., (1986). Assessment of anxiety and
achievement in kindergarten and first and second grade children. Journal of
Abnormal Child Psychology, 14(2), 279-286.
Piers, E. V., (1969). Manual for the piers-harris children’s self-concept
scale. Nashville: Counselor Recordings & Tests, 1969.
Piers, E. V., & Harris, D. B., (1964). Age and other correlates of self-
concept in children. Journal of Educational Psychology, 55, 91-95.
Powell, J. W., Denton, R., & Mattsson, A., (1995). Adolescent depression:
Effects of mutuality in the mother-adolescent dyad and locus of control.
American Journal of Orthopsychiatry, 65(2), 263-273.
Psychological Corporation. (1992). Wechsler individual achievement test
WIAT - manual. San Antonio: Harcourt Brace & Company.
Psychological Corporation. (1991). Wechsler individual intelligence scale
for children WISC-III - manual. San Antonio: Harcourt Brace & Company.

113
Reynolds, C. R., (1980). Concurrent validity of ‘What I think and feel’: The
revised children’s manifest anxiety scale. Journal of Consulting and Clinical
Psychology, 48(6), 774-775.
Reynolds, C. R., & Richmond, B. O., (1979). Factor structure and
construct validity of ‘What I think and feel’: The revised children’s manifest
anxiety scale. Journal of Personality Assessment, 43(3), 281-283.
Reynolds, W. M., (1990). Introduction to the nature and study of
internalizing disorders in children and adolescents. School Psychology Review,
19(2), 137-141.
Rhone, L. M., (1986). Measurement of test anxiety among selected black
adolescents: Appropriateness of four anxiety scales. Journal of School
Psychology, 24(3), 313-319.
Rotter, J. B. (1966). Generalized expectancies for internal versus external
control of reinforcement. Psychological Monographs, 80(1), No. 609.
Rotter, J. B. (1975). Some problems and misconceptions related to the
construct of internal versus external control of reinforcement. Journal of
Consulting and Clinical Psychology, 43, 56-67.
Salvia, J., & Ysseldyke, J. E., (1995). Assessment (6th ed.). Boston:
Houghton Mifflin.
Sattler, J. M, (1992). Assessment of children (3rd ed.). San Diego: Jerome
M. Sattler.

114
Schroeder, C. S., & Gordon, B. N., (1991). Assessment and treatment of
childhood problems. New York: Guilford Press.
Shavelson, R. J., & Bolus, R., (1982). Self-concept: The interplay of
theory and methods. Journal of Educational Psychology, 74(1), 3-17.
Solomon, C. R., & Serres, F., (1999). Effects of parental verbal
aggression on children’s self-esteem and school marks. Child Abuse & Neglect,
23(4), 339-351.
Spielberger, C. D., (1973). STAIC preliminary manual. Palo Alto:
Consulting Psychologists Press, Inc.
Steinberg, L., Elmen, J., & Mounts, N., (1989). Authoritative parenting,
psychosocial maturity, and academic success among adolescents. Child
Development, 60, 1424-1436.
Steinberg, L., & Lamborn, S. D., (1992). Impact of parenting practices on
adolescent achievement: Authoritative parenting, school involvement and
encouragement to succeed. Child Development, 63(5), 1266-1281.
Swanson, S. & Howell, C., (1996). Test anxiety in adolescents with
learning disabilities and behavior disorders. Exceptional Children, 62(5), 389-
397.
Waterhouse, I. K., & Child, I. L., (1953). Frustration and the quality of
performance. Journal of Personality, 21, 298-311.
Watson, J., & Rayner, R. (1920). Conditioned emotional reactions.
Journal of Experimental Psychology, 3, 1-14.

115
Wichern, F., & Nowicki, S., Jr. (1976). Independence training practices
and locus of control orientation in children and adolescents. Developmental
Psychology, 12(1), 77.
Zatz, S., & Chassin, L., (1983). Cognitions of test-anxious children.
Journal of Consulting and Clinical Psychology, 51(4), 526-534.
Zimmerman, M. A., Copeland, L. A., Shope, J. T., Dielman, T. E., (1997).
A longitudinal study of self esteem: Implications for adolescent development.
Journal of Youth & Adolescence 26 (2), 117-141.


![Cost-Effectiveness of Short-Term Inpatient Psychotherapy Based … · 2015-08-30 · [BSI], psychosocial functioning (Outcome Questionnaire -45 [OQ-45]) and quality of life (EuroQol;](https://static.fdocuments.in/doc/165x107/5ccbe5aa88c993b6028e009c/cost-effectiveness-of-short-term-inpatient-psychotherapy-based-2015-08-30.jpg)