AF08i 6o-2261 · AF08i 6o-2261 SHOCK INITIATION OF LOW-DENSITY PRESSINGS OF AMMONIUM PERCHLORATE...
28
AF08i 6o-2261 SHOCK INITIATION OF LOW-DENSITY PRESSINGS OF AMMONIUM PERCHLORATE MARJOPIE W. EVANS, B. 0. REESE, AND L. B. SEELY POULTER LABORATORIES .,__ STANFORD RESEARCH INSTITUTE LE . RI CH O USE MENLO PARK, CALIFORNIA FOR " -TC AD E. L. LEE LIVERMORE, CALIFORNIA .WMu Sponsored by AIR FORCE OFFICE OF SCIENTIFIC RESEARCH PROPULSION DIVISION DIRECTORATE OF ENGINEERING SCIENCES WASHINGTON, D.C. UNDER CONTRACT AF 49(638)1124 6 -1N;presented at THE FOURTH SYMlPOSIUM ON DETONATION NAVAL ORDNANCE LABORATORY WHITE OAK, SILVER SPRING, MA, YLAND October 1905. $ DEC15 " 10
Transcript of AF08i 6o-2261 · AF08i 6o-2261 SHOCK INITIATION OF LOW-DENSITY PRESSINGS OF AMMONIUM PERCHLORATE...

AF08i 6o-2261
SHOCK INITIATION OF LOW-DENSITY PRESSINGSOF AMMONIUM PERCHLORATE
MARJOPIE W. EVANS, B. 0. REESE, AND L. B. SEELY
POULTER LABORATORIES .,__
STANFORD RESEARCH INSTITUTE LE . RI CH O USEMENLO PARK, CALIFORNIA FOR " -TC AD
E. L. LEE
LIVERMORE, CALIFORNIA .WMu
Sponsored by
AIR FORCE OFFICE OF SCIENTIFIC RESEARCHPROPULSION DIVISION
DIRECTORATE OF ENGINEERING SCIENCES
WASHINGTON, D.C.
UNDER CONTRACT AF 49(638)1124
6
-1N;presented at
THE FOURTH SYMlPOSIUM ON DETONATIONNAVAL ORDNANCE LABORATORY
WHITE OAK, SILVER SPRING, MA, YLAND
October 1905.
$ DEC15" 10

DISCLAIMER NOTICE
THIS DOCUMENT IS BEST QUALITY
PRACTICABLE, THE COPY FURNISHED
TO DTIC CONTAINED A SIGNIFICANT
NUMBER OF PAGES WHICH DO NOT
REPRODUCE LEGIBLY.

SHOCK INITIATION OF LOW-DENSITY PRESSINGSOF AMMONIUM PERCHLORATE-
ABSTRACT
Initiation and detonation behavior of 13-micron ammonium per-
chlorate was studied at loading density 1.00 g/cm. Steady detonationvelocities were determined experimentally at three diamet- rs and ex-trapolated to 3.75 ± 0. 15 mm/Vsec at infinite diameter. Calculationswith the BKW equation of state gave 4. 25 mm/[Lsec--as good agree-
ment as could be expected for a low-energy chlorine-containing explo-
sive. By introducing 24-kbar flat-topped plane shocks into pellets ofvarious lengths, it was determined that steady full-strength detonationwas reached after about 15 mm travel. The growth of pressure in the
accele-ating wave was followed approximately by means of free-surfacemeasurements on thin Plexiglas at the top surfaces of Lhe pellets, and
these measurements indicated the prcssure to be 55 ± 10 kbar in thefull-strength wave. Reducing the air pressure in the pressings to
5 microns left the build-up to detonation unaffected. The position ofthe shock Hugoniot for the pressings relative to the Hugoniot of thesolid crystal is discussed in terms of heat production during collapse
and possible reaction processes.
INTRODUCTION
A salient feature of initiation behavior in secondary high explo-
sives is the high sensitivity of a low-density granular pressing relativeto that of a homogeneous crystal of the same compound. Thus forPETN approximately 110 kbar is required to detonate a large single
crystal, I whereas ]ow-dens:ty pressings of small PETN crystals canbe initiated with shocks of a few kilobars. 2 For a shock wave to
change into a detonation wave, an energy-producing chemical reactionIILuLt pruucd f£L enough to - uppurt th e 1c ahtad of it. Many
workers have absumed that attaining a high reaction rate depends onattaining high temperature; in fact, most of them have assumed theArrheniub law. 3 It has been shown4 that the average temperature of
This research was supported at Stanford Research Institute by the
U.S. Air Force Office of Scientific Research under Contract No.
AF 49(638)-1124. The detonation calculations were performed at
Lawrence Radiation Laboratory under the auspices of the US AEC.

the material in a shocked granular explosive will barely suffice forh'.gh reaction rates in very insensitive materials, but for moderatelysensitive secondary explosives it falls far short. Thus, the weakshock required to initiate granular PETN cannot raise more than a
small fraction of the total mass of the pressing to the necessary tern-
perature. Because of such instances, one is forced to postulate hut-spots, encompassing only a very small fraction of the mass in the
pressing but containing the greater part of the energy.
Bowden has demonstrated that in impact processes hot-spots canbe formed by (a) compression of interstitial gas, (b) intergranularfriction, and (c) high-velocity flow. 5 Similarly, f-r shock initiation ofgranular explosives it has been proposed that hot-spots can be formedby compression of interstitial gases, 6 shock interaction within grains,
intergranular friction, 7 jetting, 8, 9 or stagnation. 10, 11
Cachia and Whitbread showed that removing the interstitial gas
fron. tetryl left the gap-test sensitivity unchanged. 12 It has also beenshown z that distance of shock travel before detonation is unaffected by
the interstitial gas in granular PETN at density . o g/cm 3 . Althoughonly a few granular explosives have thus far been investigated for inter-stitial gas effects, an effect of interstitial gas on initiation behavior is
yet to be demonstrated. The situation with the other proposals is moreequivocal and it may never be possible to eliminate any of them as pos-sible mechanisms. Nevertheless, by studying a wide range of condi-tions it may be possible to establish definitely that some of them are
active.
Failure diameter and variation of steady detonation velocity withcharge diameter are controlled by chemical and hydrodynamic eventsin divergent flow behind the detonation front. Similarly, shock initia-tion characteristics are influenced by chemistry and flow patterns be-hind an initiating shock as well as by peak pressure. Presumably withadequate understanding of reactive flow, the relationships between vari-ous detonation properties could be written down and all could be derivedfrom fundamental chemical and hydrodynamic properties of the material.Approximate theories have been developed for the effect of charge diam-
eter on detonation velocity, 11-15 and thorough experimental studieshave been completed in the case of homogeneous explosives, 16-18 A
relationship has been developed between failure diameter, shock sensi-tivity, decomposition kinetics, and flow divergence 19 rhe goal seeinswithin reach.
A quite different situation holds for low-density granular explo-
sives. The behavior of granular pressings under shocks of less than
2

100 kbar peak pressure has not been investigated thoroughly, even fornonreactive systems. The hydrodynamics are much more complicatedthan for the homogeneous case. In a random arrangement of grains,intergranular friction, shock interaction, jettarg, stagnation, and tur-bulence undoubtedly occur, and these det.ai3s, probably no: calculable,are likely to be the crucial events in starting (Temical reaction. Insuch a complex physical situation several modes for chemical reactionmay be possible.
As a contrast to PETN, on which some studies have been made,we have undertaken an investigation of the detonation and shock initia-tion of ammonium perchlorate, a low-energy explosive relatively in-sensitive even in the granular form at low densities. Extensive infor-mation on its thermal decomposition 2 0 recommends it among such ex-plosives for an investigation in which sensitivity is to be related tochemical kinetics. Results on deflagratlon 1 of ammonium perchloratemay be useful in explaining growth from shock to detonation and deter-rnination of the minimum temperature for deflagration may have a bear-
ing on shock sensitivity. So far our studies have been limited to pureammonium perchiorate with a weight-median grain diameter of 13 pt ata loading density of 1. 00 g/cm 3 .
CALCULATION OF DETONATION CHARACTERISTICS
Chapman-Jouguet detonation properties were calculated forammonium perchlorate over the loading density range from 0. 55 to1. 95 g/cm 3 by means of the Ruby code developed by Levine andSharples, 22 ).s-ng the method of White, Johnson, and Dantzig in theequilibrium calculations. 23 The code solves simultaneously algebraicequations given by the sho'ck conservation equations, the chemical equa-tions, the Becker -.Kisthakowsky- Wilson (BKW) equation of state, andthe Chapman-Jo'guct ;ordition applying to detonations. The BKW equa-tion of state has been .ised for detonation cal.ulations ior about twenty-five years, 24 empiri ally as a method for fitting well-known measure-ment- .nd also for predicting properties of new explosives of a similartype. The calculation has been improved and adapted to computers bya num-er of workers. 25, 26 Gowan and Ficke f2 7 obftined new values,for the constants in the BKW equation by fitting their calculations tofour explosives for which accurate values of detonation velocity and CJpressure \ver available. The Ruby code uses the same constants.
The case of ammonium perhiorate is outside the range of cundi-tions usually treated by Ruby code calculations. ThL energy of reactionis less than for most explosi'.,es, the calculations 1'ave been carried
3
- -V--
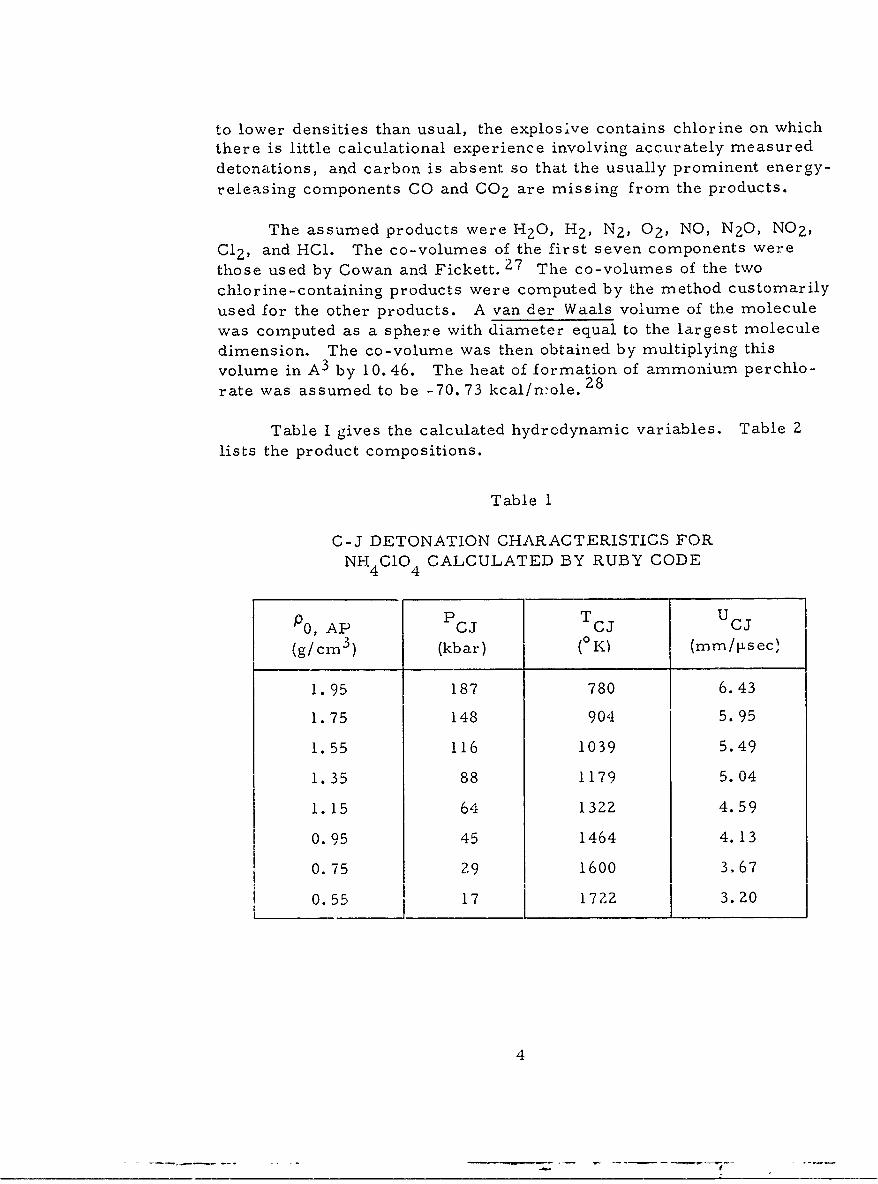
to lower densities than usual, the explosive contains chlorine on which
there is little calculational experience involving accurately measured
detonations, and carbon is absent so that the usually prominent energy-
releasing components CO and CO 2 are missing from the products.
The assumed products were HZO, H Z , N 2 , 02, NO, N 2 0, NO 2 ,C12, and HC1. The co-volumes of the first seven components were
those used by Cowan and Fickett. 27 The co-volumes of the two
chlorine-containing products were computed by the method customarily
used for the other products. A van der Waals volume of the molecule
was computed as a sphere with diameter equal to the largest molecule
dimension. The co-volume was then obtained by multiplying this
volume in A 3 by 10.46. The heat of formation of ammonium perchlo-
rate was assumed to be -70. 73 kcal/nole. 28
Table I gives the calculated hydrodynamic variables. Table 2
lists the product compositions.
Table 1
C-J DETONATION CHARACTERISTICS FOR
NH4 ClO 4 CALCULATED BY RUBY CODE
PO, AP CJ TCJ UCj
(g/cm3 ) (kbar) (0 K) (mm/ Lsec)
1. 95 187 780 6.43
1.75 148 904 5.95
1.55 116 1039 5.49
1. 35 88 1179 5.04
1.15 64 1322 4.59
0. 95 45 1464 4.13
0.75 29 1600 3.67
0.55 17 1722 3.20
4
t

in o o 0 o o 0 0 0
10 (DO gfA N~ 1V N -V 0 a',
of 0 0 o) C 0 C 0 0 0
I 4 ' O\c ~ 'C -P ~r -
N eC) 'C) in in N- (C) 10
a', -4 -4 '1 4 -4 ~ - ~0 in '0 rC) 10 - n C 0 '
re Nn 'C) r N - -~ N
(I ~ ~ L -r I n 0 1
N r- ( ) t CiI N CC e N
I I I I I I I I
u~000 0 0 0 0 0 0t, 0 -4 4 -4)<~
, 0 r- 'A N ON 0 00 '0N f) N 0 ~cn n" N N
0 * 4 * 4 ;
N 0 - C) C) ' C) C)
) ~ ~ ~ ~ .~4 -4-4 ~ 4 - ~ 4 - -
1:: 0 q 0 0 0 0 0 0, 0o 0
- -0 n N n N 1 0 f OD 0 1 C N
0'
o I) 0 0) 0 0 0 0 0 0 0
04 1 - 4 C4 ON-4 n -04- 0 N N 4 (n MO a' a '
of N 04 CCC) 0c 0 C)
o 'x x xN 0 4 - t --1 CC)
-4 N -1 .-- 00 CC) or, m N 1 N
(.) CC) -C) 0~ ' c C) -
0c 0- 0q 0 0 0 N
N '0. z- 0 C) 0 0 Nu C
0 )
-W7-

EXPERIMENTAL
All of the experiments reported here used propellant grade aITmio-
nium perchlorate specified as MPD-28 A Type ii. Analysis showedpurity to be 99. 3% ammonium perchlorate or better in each sample.
The material was reground to the particle size shown in Fig. 1.
WlOO i l iTTlrF -7i'i I II-
0
40-j
W -
I I0 10 100DIAMETER - microns GA39286
FIG. 1 PARTICLE SIZE DISTRIBUTIONOF AMMONIUM PERCHLORATE
The booster explosive was cast Composition B-3 (64/36:RDX/TNT). Plane-wave generators made of cast Baratol [70/30:Ba(NO 3)2/TNT] and Comp B were obtained in two sizes known as P-40 (10 cmdiam) and P-80 (Z0 cm diam).
Plexiglas used in the experiments was obtained cast from themonomers. The brass was obtained as the free machining type in theform of plates. Attenuators were machined to size, lapped, andpolished.
A 35-mm rotating-mirror smear camera writing 3. 81 mm/p 3ec
was used for all of the initiation experiments and some of the velocitymeasurements. Exposures were rriade on Eastman Tri-X film whichwas developed for 6j minutes in UFG developer. Other velocity mets-urements were made on raster oscilloscopes, either specially manu-factured by Denver Research Institute to write at 2. 5 lisec per sweepor consisting of a separate Cordin Electronics 12. 5-pisec raster z veepcomponent controlling a Tektronix 535 oscilloscope.
b

Determination of Detonation Velocity
Detonation velocity of ammonium perchlorate was determined atthree charge diameters, 3. 5, 10, 1, and 23. 2 cm, with charge lengthsten times the diameter in each case. At 3. 5 cm the charges were con-fined in cellulose acetate-butyrate tubing 1.5 mm thick in which elasticwave velocity was determined to be 1. 9 mm/pisec, substantially belowthe detonation velocity of the ammonium perchlorate at this diameter.The charges were loaded in increments to 1. 01 ± 0. 01 g/cm3 andboosted with a 4-inch gap-test donor consisting of a P-40 plane-wavelens and solid Plexiglas attenuator. Velocity in the charge was meas-ured by ionization probes through the wall at 25. 4-mm intervals. Inthis way "fires" from the gap test could be used to give velocity dataafter initiation phenomena had disappeared.
At the two larger diameters the ammonium perchlorate wasloaded in cardboard rings one-half diameter high. These rings werestacked with a copper-foil ionization switch across the diameter ofeach segment, so that signals from the center of the charge could berecorded on the Cordin-Tektronix oscilloscope. The 10. 3-cm chargewas boosted with a 10-cm-diameter, 2.5-cm-thick Conp B slabinitiated by a bursting-wire detonator and a 12. 5 diameter by 6. 3 mmRDX pellet. A velocity record was also obtained on the smear cameraat this diameter through 1-cm holes punched at the center of each seg-ment and faced on the inside with transparent tape. The 23. 3-cmcharge was boosted with a 20. 3-cm by 5-cm Comp B charge initiatedin the same way. Only oscilloscope timing was obtain ,d ol this shot.
At 3. 5-cm-diameter thirteen shots yielded up to nine velocitydeterminations each. The shot-to-shot standard deviation was Us =
0. 11. One experiment only was performed at each of the larger twodiameters, 10. 1 and Z3.3 cm. The standard deviations of the incre-mental velocities COi were 0. 07 and 0. 05 rnm/-sec, respectively. InFig. Z these results are plotted with the error indicated at Z0 for the0. 286 cm - ' reciprocal diameter data and Za i for the two large shots.Extrapolation to infinite diameter gave 3. 75 ± 0. 15 mm/ sec, the un-certainty being estimated by extrapolation of the opposite extremes ofthe plotted errors.
7

5
4.- = 3.75 t0.15 mm/isecE
0
0
-J
z
Wz
o 0
0 01 0.2 03
I/CHARGE DIAMETER -- cm 1 39Z 1
FIG. 2 DETONATION VELOCITY OFAMMONIUM PERCHLORATEPLOTTED AGAINST RECIPROCALCHARGE DIAMETER
Minimum Shock for Initiation at 3. 5-cm Diameter
The minimum pressure required to initiate steady detonation in
long charges was qualitatively established by a variant of the gapmethod. The donor explosive was a P-40 plane-wave lens againstwhich was placeU an attenuator of solid Plexiglas. The ammonium per-
chlorate charge, 3.5 cm in diameter, packed as described in the sec-
tion on velocity determination, was centered on the attenuator. Theemergent wave at the attenuator-ammonium perchlorate interface was
plane to 0. 05 1sec over the test charge diameter. The Plexiglas free-surface velocity for the 50% gap thickness was determined by means of
the moving image camera, using a parallel mirror above the surface.
Light from an argon explosive flash was reflected into the camerauntil the reflectivity of the mirror was aestroyed by arrival of the mov-ing surface. The resulting camera record gave the time required forthe surface to traverse the distance to the bottom surface of the mirror.
From this a free-surface velocity of 1. 00 ± 0.03 mm/ tsec was obtained,corresponding to a calculated shock presslire in the Plexiglas of 16.5± 0. 5 kbar. In the same experiment a Manganin resistance-wire pres-sure gauge Z 9 measured a confirming value of 17.0 ± I kbar for thePlexiglas shock pressure. The time profile of the wave at the inter-
face was not determined.
The velocity of the wave genf,.rated in the ammonium perchloratewas first measured over the second 25. 4-mm interval as 2. 5 mm/Isec.
8

It becamo. steady after about 75 mm it -1.81 _t (0. 2_' .1/~ I.14-gives pressure-particle velocity plotb mvneaurcd 1' tv'( ou wl~i.
perimenters for Plexiglas. 30, 31 W(" have2 absumed thdit the 1eiararefactioni curve is a mirror reflection of the Ilugoniot. A p01... l1necorresponding to the 2. 5 mm/ xsec measured in the becund inte-rvalintersects the rarefaction curve at 1-4 kbar in the tmnionium purchilo-rate. Thus 14 kbar is the minimum pressure wVhich will initiatu thlibmaterial at this diameter with the pressure-time profile delivered b>this booster -attenuator system. Data to be presented in the next 6e( -
ion show that initiating shocks in this particle-size arnmonium per-chlorate at this density accelerate very little until just before rapidbuild-up to full detonation velocity.
32 11 / 128 /
~24 /
NOL- /120 -R
-16 /w /(14 kbat)
(U) 2 /
4 /
0 0.1 0.2 0.3 0.4 0.5 0.6 0 7 0.8PARTICLE VELOCITY, up - mm/,usec
GA- 3928-8
FIG. 3 HUGONIOTS FOR PLEXIGLASNOL curve is from Ref. 30, SRIcurve is from Ref. 31. The p0 U1iineis for ammonium perchiorate atdens ity 1.0 q,/"cm 3 and intersectsthe Plexiglas expansion curveat 14 kbar

Plane- Wave Initiation Measurements
Shock initiation of ammonium perchlorate wa3 studied for approxi-mately flat-topped shocks at about 24 kbar. For this pressure, transi--tion to steady detonation occurs in times which are long enough to estab-lish the incoming wave velocity but short enough that the transition occursbefore the initial shock is influenced by reflectioas or rarefactions.
The driver system for the majority of the shots was a P-80 plane-wave lens detonated directly against a 1/2-inch-thick brass driver plate.The duration of the initial pulse before reflections accelerate the brasswa. determined by observing with a moving-image camera a reflectedimage of a wire on the polished driver plate. 32 For this driver systemthe free-surface velocity was constant for 12. 5sec before the first re-flection arrived, as is shown in Fig. 4. The long reverberation time wasnot the re sult of spalling, as the brass was recovered in one solid piece.
ARGON FLASH
i I I SURFACE MEETSPOLISHED METAL WIRE
SURFACE WIRE
A,-
IMAGE45012.5 sec -
DRIVER PLATE SMEAR CAMERA RECORD
FIG. 4 MEASUREMENT OF BRASS DRIVER PLATE FREESURFACE MOTION BY THE WIRE REFLECTIONTECHNIQUE. Experimental arrangement is shown atleft and the resulting film ol right.
Pellets of ammonium perchlorate were formed at loading density1.00 ± 0.005 g/cm 3 by packing the powder into Plexiglas rings, whosediameters were a, least three times their height. Pellets of various
heights were arranged on the brass driver plate in two rows so theycould be photographed through two parallel slits by a moving-imagecamera. The wave was sufficiently plane over an area approximately15 cm in diameter that ai many as four pellets could be observed on
10

one slit, depending on their diameter and th (ther oetu rliento to
be .nade.
For most of the experiments one-half of th, .surtdce of each phl-
let was covered with a thin sheet of Plexiglab. On small pel!uts a I, .
mm thickness was adequately rigid, but 1i)r large pelletb i. Z nin \-i,',
necessary. Over the covered half of the pell(ts an angled mirror was
placed for measurement of the free-surface velocity of the Plexlglaa.
An explosive argon flash was reflected specularly from the mirror into
the camera and also served t,) illumninate the uncovered surface of th,,
pellet.
The overall array of pellets of various lengths is shown in Fig. 5.
The following were directly indicated by the films: (a) arrival time of
the shock at the bottom of the pellets, (b) planarity of the wave, (c) free-
surface velocity of the driver, (d) arrival times at the tops of the pellets,
(e) wave shapes at the tops of the pellets, and (f) free-surface velocity
of the Plexiglas sheet. A typical record ihowing these features is shown
in Fig. 6, and for clarity a line tracing of this record is given in Fig. 7.
DRIVER PLATEINCLINED MIRRORFOR FREE- SURFACE
PLANE-WAVE VELOCITY OF DRIVERLENS /
INCLINED MIRRORFOR FREE-SURFACEVELOCITY OF PELLETCOVER
THIN PLEXIGLASCOVER OVER HALF OF
IA PELLET
BARE PELLET SURFACE
PLEXIGLAS RING TO
HOLD PELLET MATERIALAT BOTTOM FACE
MIRRORS AT DRIVERSURFACE FOR TIME,'ERa
FIG. 5 CHARGE ARRANGEMENT FOR A TYPICALSHOT TO INVESTIGATE INITIATIONCHARACTERISTICS OF AMMONIUMPERCHLORATE. Two rows of pellets arephotographed simultaneously through doublecamera slit.
11

C)
C)j
LuI
Cc),
Lu
Lu
(.<
U-
12

FM CA C
T F
A Aa Aort
FIG. 7 DRAWING C," SMEAR CAMERA RECORD CORRESPONDINGTO FILM IN FIG. 6
Signals caused by the arrival of the shock at the surface of the
driver plate are indicated by the lines marked A and At for the two
slits, respectively. From these signals -Ln indication of planarity is
obtained. When there is some variation in the arrival time of the wave,
individual signals at the bottoms of the Plexiglas rings can be used for
their respective pellets. The free-surface velocity of the driver is
obtained from the angle of the trace marked B.
A drop in intensity of scattered light from the uncovered half of
the pellet indicates the arrival of the shock at the top surface. Two
such signals, one on each slit, are marked C and C'. On the covered
half of the pellets the free-surface velocity of the Plexiglas iq obtained
from the angles of traces such as D and D'.
From these primary data the following derived quantities may be
calculated: (a) driver plate pressure, (b) wave pressure .x the bottom
of the pellet, (c) shocked density at the bottom of the pellet, (d) wave
transit time, (e) wave pressure at the top of the pellet, (f) shocked
density at the top of the pellet.
13

Figure 8 gives a plot of wave transit time versus pellet thickness.
The error lines show two standard deviations with three to five MIas-
urements having been made at each point. The incoming wave has a
velocity of 2. 75 mm/ Lsec. After about 15 mm of travel the wave veloc-
ity increases. Establishing the precise time at which detonation is
achieved is practically impossible. However, at whatever point the
transition occurs the velocity will thereafter be 3. 75 ± 0. 15 mm/ .sec,
the vaLue determined above as Doc, as long as the wave remains plane.
A line of this slope has therefore been fitted to the points for pellet
thicknesses above 15.5 mm. A thickness-time plot for an overdriven
wave has also been given in Fig. 8.
10 - _ _ _ _ _ _ _ _ _ _ _ _ _ _ _
0 P,. AP = 24 ± I kbor (4)
8 - 0 P,, AP = 70 kbor -3
6 (4 )
a: l
- (4)
o ' _ __________0 4 8 12 16 20 24 23
PELLET THICKNESS - mm GA-3928-12
FIG. 8 TIME-DISTANCE PLOTS OF DATAOBTAINED FROM AMMONIUMPERCHLORATE PELLETS WITHENTERING SHOCKS AT 24 kbarAND 70 kbar
The wave shapes marked E and F in Figs. 6 and 7 indicate the
effects of the Plexiglas retaining rings. For a short pellet 5 mm in
height (at E), the wave next to the Plexiglas leads the central part of
the wave because the wave velocity in the center is less than in Plexi-
glas. or a long pellet 15 mm in height (at F), the wave next to the
Plexiglas lags behind because the wave velocity in the ammonium per-
chlorate is greater than in the Plexiglas. The shock velocity in Plexi-
glas should be 3. 6 mm/[sec near the driver plate but would fall in the
long retaining rings to sound velocity, while the velocity in the ammo-
nium perchlorate increases from 2. 75 to 3. 75 mm/[isec.
14

The pressure at the top of the pellet p)1 1i calculated irom thepressure transmitted to the Plexiglab by uze of the exprceson 5 5 , 3-1
Po P1 Ut PoAP UiPi Pt 2o u
wh e r e
PoPI is the density of the unshocked Plexiglas,
PoAP is the density of the unshocked ammonium per-chlorate pressing,
U. is the velocity of the shock in the ammoniumi perchlorate at a given pellet height,
U is the velocity of the shoc-k transmitted to thePlexiglas, and
Pt is the pressure in the Plexiglas calculatedfrom the free-surface velocity of the Plexiglas.
This technique of studying a developing detonation by observing wavepressure is a variant of that first used by Fauquinon 3 5 who measuredthe shock velocity induced in Plexiglas blocks by receptor charges ofvarious lengths and from that estimated the wave pressures.
Figure 9 gives the wave pressure at the top of the pellet as afunction of pellet thickness. The value at zero thickness is the enter-ing pressure calculated from the brass free-surface measurement. Inthe ammonium perchlorate the wave pressure increases over the first15 mm and then reaches a value of about 55 ± 10 kbar. The shape ofthis plot depends on the slope of the curve in Fig. 8, and thus is not anindependent experimental confirmation that build-up is taking place.A simpler indication is given by the trend in Plexiglas particle veloci-ties. The average of eleven measurements made on the four shortestpellets was 1.01 mm/ Lsec with a standard deviation Ti = 0.09. Theaverage of eleven measurements made on pellets 17.8 and 20. 4 mmlong was 1.23 mm/itsec with ". 0. 26.
i
An auxiliary experiment was carried out to confirm that the 24-kbar plane-wave initiation system would lead in a long charge to awave that could be identified as a detonation by its steadiness and :.ightoutput. An ammoniun perchlorate rate stick 10. 16 cm in diameterwas packed in the cardboard rings described for the velocity determin-ations, but now provided with a narrow vertical cellulose acetate window
15

100 -- -
80
60<. ̂ 0 0 0
0 0 0W 4
a: 20--
00 4 8 12 16 20 24 28
PELLET THICKNESS - mmGA- 3928-13
FIG. 9 PRESSURES CALCULATED FROM FREESURFACE VELOCITIES OF PLEXIGLASAT TOP OF AMMONIUM PERCHLORATEPELLETS
of the same thickness as the tube wall to permit observation with amoving-image camera. Increments were stacked to a hel. 1 t of 30. 5cm. Initiation was by a P-80 plane-wave lens and a 1/2-inch-thickbrass driver plate. The initiating system thus provided the 24-kbarinput wave used in the plane-wave - 1et initiation experiments.
At the start of the trace near the driver plate a low-velocityregion was observed, but after about 15 mm of travel the trace becamestraight at 3. 96 rnrn/Fsec, the steady velocity for a 10-cm-diameter
ammonium perchlorate charge at 1. 0 g/cm 3 .
At the top of the charge, free-surface velocity of a 3. 2-ram-thickPlexciglas cover plate was measured with the inclined mirror method.
The wave was curved so that the free-surface velocity could be meas-ured only at the axis and even there with no great acc':racy. The cal-culated wave pressure was 59 ± 10 kbar.
Vacuum Experimnts
A chamber with a glass face plate was built over the brassdriver plate of four of the pellet shots bo that the initiation behavior ofammonium perchlorate could be studied when most of the interstitialair had been removed. In order to permit a valid comparison withouta large number of shots, similar shots were prepared from what werebelieved to be identical components. Construction of a vacuum shotand its control were carried forward simultaneously and the two shotswere fired in succession with as little delay as possible.
16

The data are listed in Tablc 3. The ift er e in tir dflit till,'
between the vacuum shots and the curresponding one-at1no.,ph1'1,r' .bht
are small relative to the error limit6 shown in i"g. 8 and ,Lptr.entlyof random sign.
Table 3
COMPARISON OF x, t DATA FROM SHOTSUNDER VACUUM AND AT ONE ATMOSPHERE
ressure t .Lsec
I atm 6 [Hg 5 ±j-Igx
Mm Shot 10,608 Shot 10 607
2.49 0. 9e
2.53 0.96
5.10 2.01
5.15 2.01
7.62 2.85
7.62 2.82
12.62 4.50
12.68 4.57
15.24 5.50
15.25 5.49
17.75 6.09
17.75 6.16
Shot 10, 899 Shot 10,960
20.40 7.02
20.45 6.98
25.40 8.60
25.50 8.73
17

DISCUSSION
The vaiue 3. 75 ± 0. 15 mm/ tsec for the ideal detonation velocitycompares well with 3. 70 mm/isec found by Anderson and Pesante 3 6
for I Z- t ammonium perchlorate by extrapolation of data in the diame-ter range between 1.9 and 10. 2 cm. For a low-energy insensitive ex-plosive it is possible that velocity data collected at what might normallybe considered large diameters will be in a nonlinear part of the recip-rocal diameter plot. For this reason we have fired one shot at over23 cm diameter even though it had to bc fired underground. The datafrom this shot con-irm the line established at the smaller diametersand, therefore, we believe the extrapolation is valid and that Doo rep-resents a true experimental estimate of the ideal detonation velocity.
The velocity computed by the Ruby Code (4.25 mm/[isec, Table 1)is significantly higher than the experimental determination. The cal-culation has been established by comparing calculated and experimentalvalues of detonation velocity and pressure and adjusting equation-of-state constants until optimum agreement is produced. Checks havebeen possible on a number of CHON explosives so that adequacy ofthe equations and the parameters is well-established for this class.Any explosives at density below 1. 2 g/cm 3 are not accurately calcu-lated with this equation of state with the present constants. Calcula-tions involving chlorine may involve further modifications. Therefore,the agreement between experimental and calculated values of velocityis believed to be as good as expected. in ioticeable improvementwould involve a considerable series of accurate measurements onarnmonium perchlorate and similar compounds and perhaps shockmeasurements on liquid HCI and Cl 2 .
Minimum Pressure for Initiation at 3. 5 cm Diameter
The gap-test resilts were obtained with a 10-cm-diar-meter Plexi-glas attenuator and a 10-cm plane-wave lens. The wave shape as itleft the Plexiglas was plane over the 3. 5-cm-diameter area occupiedby the test charge. The wave-speed traces of the disturbance in thedrnnonium perchiorate obtained at edge ol the charges became straightafter about 70 mm and this indicates that initiation phenomena lasted
almost this long. Since the wave shape of the shock was changing andthe pressure falling, it seems reasonable that 70 mm is close to thelongest initation zone that could be observed at this diameter.
Ouz: value of 14 kbar may srern to be in conflict with a value of6 kbar reported by Jaffe and Prace. 27 However, it is believed thisconflict is only apparent birce the Jaffe and Pri':e experiments differed
18
from ours in several important respects: (a) lower density, 0. 85 g/cm ,
(b) larger particle size, (c) a charge container of steel in which soundvelocity is higher than the detonation velocity of ammonium perchlorate.
Plane- Wave Initiation
Ammonium perchlorate was chosen for study because it is insen-sitive and low-powered. The insensitivity leads directly to a relativelyhigh velocity for the initiating shock, the low power leads directly to alow detonation velocity, and the combination of these two factors leadsto a very real experimental difficalty in determining when initiationoccurs. It has been impossible to establish the final detonation velocityfrom measurements in the pellet experiments alone because a certainamount of error in the x, t data is inevitable, and because the longestpellets may have been perturbed by edge effects. Therefore, a linewith slope equal to the ideal velocity D0o was adjusted (visually) inintercept to fit the data above 15 mm. There is some slight evidencein the x, t plot that the transit times on the pellets of greatest lengtihave been increased by edge effects.
Pressure Measurements
Additional evidence of initiation was obtained by the Pressuremeasurements. It is impossible in practice to make free-surfacemeasurements on the explosive itself when it is at low density in thegranular form. Instead, the microscopically complex wave in thepressing induced a shock i,, Plexiglas. On thls material, free-surfacemeasurements can bE made easily and converted to the pressure in theammonium perchlorate by solving the Plexiglas -explosive interfaceequation. Accurate measurements of this kind would require verypainstaking work and a careful study of the effect of Plexiglas thickness.We have actually accomplished only rather gross measurements inwhich it was assumed that effects of wave shape might lower the pres-
sure only about 10 or 20%. The results in F:g. 9 support our inter-pretation of the x, t data. Note that there is an indication that the pres-sure is falling off in the same interval. A further indication was thewave shape observed for the longest pellets, which in most cases hadonly a very small plane region at the center and in some had none at all.
Effect of Vacuum on Initiation
The vacuum experiments give evidence as to wh1ether the gascompression mechanism can be responsible for shock initiation ofammonium perchlorate. The data in Table 3 show that within theaccuracy of our experiments the build-up of the wave is unaffected by
19

the presence or absence of interstitial gas. The exact interpretation
that can be placed on this statement needs son- e discussion.
We evacuated the pellets rather than filled them with a high spe-
cific-heat gas because the results are more dcfinitive. When the mass
of gas is reduced by a factor of 10 5 as in these vacuum experiments,
the total energy for transfer to the grains is reduced by a roughly simi-lar amount. Thus, if calculations of grain surface temperatures are
in question, changes in the heat transfer coefficient are avoided. if
the equilibrium temperature of small grains is being calculated, reduc-
tion of the energy available has a direct effect.
The overall shock initiation process in granular explosives should
probably be considered to consist of at least two phases: (1) the pri-mary initiation process--creation of small nuclei of decomposition, and
(2) the growth process- -acceleration of the shock to the point where it
becomes a steady detonation. The fact that we cannot tell the differ-
ence between normal atmospheric air density and 10 - 5 of this density
in the arrival times of the shock at various positions during growth of
the wave indicates at least that the interstitial gas does not affect thebuild-up process. This is no cause for surprise, since even for a
grain-burning mechanism the rate during the shock-growth period need
not depend on the ambient pressure that existed before the first hot-
spots were created. It is, nevertheless, a fact that the interslitial gas
does not affect the rate of build-up of a 24-kbar shock in ammonium
perchlorate at 1 g/cm 3 .
Our vacuum cxpc-.'mcnts also imply something about the primary
initiation process. The very least that can be said is that this primary
process does not depend uniquely on the presence of interstitial gas --
an explosion did occur. Most theoretical calculations of th,. heat trans-
fer to the solid from the gas will be very seriously altered by changing
the density and total mass of the gas by a factor of 105. It might be
maintained Lha* the gas compression mechanism was active at one
atmosFb r , but another mechanism took over at 5 Ip- Hg. However, it
is very unlikejy that substitution of mechanisrmswould occur so pre-
cisely. The real problem is to show why the process active at 5 1. Hg,
which clearly exists but does not involve the inter stitial gas, is not
adequatC to explain initiation at one atmosphere.
Sine our re,3ulr. was obtained at 24 kbar, considerably above the
minimum pressure necessai y for initioion, it might also be main-
tained that initiation by lower pressu:e shocks, 14 kbar for instance,may bc controlled by the interstitial gas.
20

Hugoniot of Ammonium Perchlorate Pressings
In Fig. 10 are four circles representing a p, v point from theplane-wave initiation experiments at 24 kbar, a point from the gap-testexperiments at 14 kbar, and two higher pressure points which almostcertainly correspond to complete reaction of the ammonium perchlorate.
Zel'dovich and Kompaneets are reported3 8 to have developed thetheory for Hugoniot curves of porous materials using the Mie-Graneisenequation of state. They assumed that (1) the pressing required zerocompaction force, (2) the specific internal energy of the crystal equaledthat of the granular material, (3) the pressing could be treated as ahomogeneous fluid, ignoring granularity. The general form of theHugoniot for a pressing of fairly high porosity is shown by the clashedline in Fig. 10. The exact shape and position of the curve depends onthe equation of state of the solid material and the porosity of the press-ing.
Russian experimentalists have found that the dashed curve is notrealized, but that the top part of the curve bends toward normal crystaldensity as illustrated by the dotted curve. In the case of powderedmetal., this occurs at relatively high pressures and is ascribed to elec-tron effects and change in the lattice specific heat. Recently data havebeen reported 3 9 on granular pressings of ionic crystals which arecases closer to that of ammonium perchlorate. However, in all this
Russian work the main interest has been extremely high pressures.
In our present data on ammonium perchlorate the experimentalpoint at 14 kbar lies at a larger volume than that of the solid crystal,and from this we conclude that the Hugoniot is positively sloped aspredicted by Zel' dovich. However, since the volume at 24 kbar issmaller than at 14 k] r, we must conclude we are in a region wherepressure is double-valued. It thus becones of some importance todetermine if, in fact, the Hugoniot assumes a positive slope below 10kbar and if the volume approaches that of the crystal under the actionof vur, weak shocks.
Also in Fig. 10 is a square which represents the volume expectedfrom static pressure at 2 kbar. Such a pressure is not negligible rela-tive to weak shocks.
We have attempted two shots at very low pressure. These ex-per:,nents have turned out to be more difficult than originally antici-pated because of a short rcvcrbcration time in the multilayered attenu-ator, a poorly defined brass Hugoniot at very low pressures, poor
21

100
90 - * f t
I
w50
i 40
30 -
20
10
'4 -
0 05 06 07 08 09 10 l
VOLUME cm3/9 r,9-3928 14
FIG. 10 HUGONIOT CURVES FOR AMMONIUM PERCHLORATE
O Measurements on NH 4ClO4 pressings at four
shock pressures.
D Static compression of granular pressing.
Asumed Hugoniot of ammonium perchlorate
crystal.Typical Hugoniot of porous pressing predicted
by Zel'dovich.
....... Typical Hugoniot of pressing found by
Russian experimenters.
.... -Rayleigh line for low-pressure shock in
ammonium perchlorate pressing.
Hugoniot proposed foi aammonium perchlorate
pressing.
z2

quality optical signals from the emergence of very low intensily shocks,and difficulty in producing thin pellets of good quality. Ncvertheless,it is clear that the shock velocity ovcr the first 3 mm of travel in thepressing is in the neighborhood of 0.75 rnm/lis,-c, only sliyhlIy abovesound velocity, 0.54 mm/usec. 40 The Ray-igTh line cori (,spondirg tothis velocity is drawn at the bottom of the graph in Fig. 10. A pressurebetween 2 and 3 kbar was obtained from the fr. surface velicity of thebrass by the graphical solut.on of the brass -per chlo: ate interface equa-tion.
Taking into account the four data points that we have, the factthat 2 kbar will compress the material to 95% crvsfal density, and theindications of the preliminary low-pressure shock experime'ts, wehave drawn the Hugoniot of the pressings ,the heavy solid line) to re-semble these used by the Russian experimenters. The main differencebetween this curve and the Russian Hugoniots is the low pressure atwhich the high-volume bulge occurs. This, at about 10 kbar, is so low
that it must have an explanation in addition to the one offred for thehigher pressure bulge in inert materials. In general terms, however,the explanation is the same, The material exists a+ the two volumesV1 on the crystal Hugoniot and V0 1 on the Hugoniot for the pressingnot only because the specific internal energy is higher at V 0 1 than atV1, but also be .ause the percentage of internal energy in the thermalterm is higher at V 0 1 .
The pressing is considered in the theory to be homogeneous, thatis, the material is a fluic at the expanded state Ir 0" The positive"00slope of the Hugoniot arises from irreversible work during compaction.The hete-ogeneily itself can be expected to cause heating throughjetting, turbulence, and stagnation. In this sense the shape of theHugoniot of the pressing is an indication of the number and temperatureof holl-spots.
The upper par' )I the Hugoniot of the pressing has b' an drawnbelow thc points at 70 and 98 kbar because these almost certainly lieon t -ie fuiy reacted H-ugoniot. However, it is not ciear that the pointsat. 24 and 14 kbar represent, inert mate:ia'--some reaction may occurvery rapidly in the hot-spots. In fact, release of chemical energy isan e c Hlent candidate among pzssib"e explanations of the large finalvolum( s on the porous Hugcr',ot. Detailed comparison of the ammonium
perchlortc curve with tbat of an incrt tha' is- mechanically similarry ay indlicate the dcr ec of ch mical reaction.

REFERENCES
I. T. E. Holland, A. W. Campbell, and M. E. Malin, J. Appi.
Phys. 28, 1217 (1958)
2. G. E. Seay and L. B. Seely, J. Appl. Phys. 32, 1092 (1961)
3. H. W. Hubbard and M. H. Johnson, J. Appl. Phys. 30, 765
(1959)
4. Marjorie W. Evans, C. M. Ablow, B. 0. Reese, and A. B.Amster, Intl. Conf. on Sensitivity and Hazards of Explosives,SZ, paper 5 (Brit. Min. Aviation, 1963)
5. F. P. Bowden and A. D. Yoffe, Initiation and Growth of .Lxplo-sion in Liquids and Solids, (Cambridge Univ. Press, 1952), p 2
6. J. Taylor, Detonation in Condensed Explosives (Clar. Press,Oxford, 1952) p 174
7. F. P. Bowden and A. D. Yoffe, Fast Reactions in Solids (Acad.Press, N.Y. 1958)
b. R. W. Watson and F. C. Gibson, Nature Z04, 1296 (1964)
9. F. P. Bowden and M. P. McOnie, Nature 206, 383 (1965)
10. J. H. Blackburn and L. B. Seely, Nature 194, 370 (196Z)
ii. L. B. Seely, Proc. Electr. initiator Symp. (Franklin Institute,Philadelphia)Ch. 27
12. G. P. Cachia and E. G. Whitbread, Proc. Roy. Soc. (London)A246, 268 (1958)
13. H . Jones, Proc. Roy. Soc. (London) A189, 415 (1947)
14. H. Eyring, R. E. Powell, G. H. Duffey, and R. B. Parlin,Chem. Rev. 45, 69 (1945)
15. W. W. Wood and J. G. Kirkwood, J. Chem. Phys. 22, 1920
16. A. W. Campbell, W. C. Davis, and J. B. Ramsay, Phys.
F]uids 4, 498 (1961)
t7. E. A. Igel and L. B. Seely, 2nd ONR Symp. on Detonation,
(U.S. Dept. Navy, Washington, 1955)
18. M. A. Cook, Science of High Explosives (Reinhold, N.Y. 1958)
19. Marjorie W. Evans, J. Chem. Phys. 3b, 193(1962)
24

Z0. P. W. M. Jacobs and A. R. Tariq K8rvi.y, 8th Comb. Syrp.1960 (Williams and Wilkins, Balto, 1962) 672, and rcfs. cited
21. Marjorie W. Evans, R. B. Be-yer, and L, M:Culley, J. Chem.Phys. 40, 2431 (1964) and refs. _itcd
22. H. B. Le'rine and R. E. Sharples. "Op-ra-or's Manual, Ruby,"
UCRL-6815 (Lawrence Radiation Labore, -rv, March 196Z)
23. W. B. White, S. M. Johnson, and T. B. Dantzig, j. Chem. Phys,
28, 751 (1958)
24 G. B. Kistiakowsky and E. B. Wilson, Jr., OSRD 114, Aug. 1941(ASTIA, Libr. of Congress, Washington)
25. S. R. Brinkley, Jr., J. Chem. Phys. 15, 107 (1Q47)
26. C. L. Mader, "Detonation Calculations with BKW Equation,"
LA-2900 (TID-4500) (U.S. Dept. Com, Washington, 1963)
27. R. D. Cowan and W. Fickett, J. Chem. Phys. 24, 932. (1956)
28. JANAF Interim Chemical Tables, Dow Chem. Co., Midland,
Mich.
29. D. Bernstein and D. D. Keough, J. Applo Phys. 35, 1471 (1964)
30. 1. Jaffe, R. Beauregard, and A. Amster, 3rd Detonation Sym-posium 1960 (ONR, 1961) 584
31. D. N. Schmidt and Marjorie W. Evans, Nature 207 (to be pub-
lished
32. W. C. Davis and G. B. Craig, Rev. Sc . Instr. 32, 579 (1961)
33. R. E. Duff and E. Houston, J. Chem. Phys. Z3, 1268 (1955)
34. W. E. Deal, 2nd Detonation Symposium (ONR, 1955) 209
35. C. Fauquinor, Comptes Rendub 251, 38 (1960)
36. W. H. Andersen Lnd R. E. Pesante, 8th Comb. Symp. (Williams-rd Wilkins, BaIt., 1962)
37. Donna Pric',- and I. Jaffe, AIAA Jour. 1, 394 (1963)
38. K. K. Kruprikov, M. 1o Brazhnik, arid V. P. Krupnikoxa,
JETP (USSR) 42, 675 (1962)
39. S. B. Kormer, M. V. S nitsyn, A. i. Funtikov, V. D. Urlin,
and A. V. B1incv, TETP (USSR" 47, 1202 (1964)
40. R. C. Gc' t-clmar, and Marjorie W. E -an.:, Nature 198, 67)(1963)
25

ACKNOWLEDGMENTS
The authors wish to thank Dr. A. B. Amster who directed ex-ploratory experiments on steady wave velocity and shock sensitivity,and Dr. Gordon D. Anderson and Dr. Michael Cowperthwaite for dis-cussions of Hugoniots of porous materials.
26