
AETHALOMETERTM STANDARD OPERATING PROCEDURES … Quality/monitor/QAPlans/pm25_cbc... ·...
22
Aethalometer 2.32.2 Version: 1.3 Jan. 29, 2015 Page 1 of 21 AETHALOMETER TM STANDARD OPERATING PROCEDURES SECTION II OPERATORS RESPONSIBILITIES
Transcript of AETHALOMETERTM STANDARD OPERATING PROCEDURES … Quality/monitor/QAPlans/pm25_cbc... ·...

Aethalometer 2.32.2 Version: 1.3
Jan. 29, 2015 Page 1 of 21
AETHALOMETERTM STANDARD OPERATING PROCEDURES SECTION II
OPERATORS RESPONSIBILITIES

Approval Sign-Off Sheet
Aethalometer 2.32.2 Version: 1.3
January 29, 2015 Page 2 of21
I certify that I have read and approve of the contents of this revision of the AETHALOMETERTM STANDARD OPERATING PROCEDURES, Section II, OPERATOR RESPONSIBILITIES" with an effective date of January 29, 2015.

Aethalometer 2.32.2 Version: 1.3
Jan. 29, 2015 Page 3 of 21
Table of Contents
2.32.2 Aethalometer Monitoring Site Operation Procedures ................................................ 4 2.32.2.1 Procedures for Site Operation and Calibration for Aethalometer Monitors .............. 4 2.32.2.2 Calibration.................................................................................................................. 5 2.32.2.3 Bi – Monthly Inspection (every 14 days) .................................................................. 7 2.32.2.4 Monthly Inspection (once every 30 days) ................................................................ 10 2.32.2.5 Six Month Inspection ............................................................................................... 13 2.32.2.6 Periodic Maintenance (as needed) ........................................................................... 15 2.32.2.7 Site Calls .................................................................................................................. 16 2.32.2.8 Data Reporting and Validation for Regional Offices .............................................. 17 2.32.2.9 Quality Assurance Procedures ................................................................................. 18 2.32.2.10 Accuracy Audits and Reporting ............................................................................... 18 2.32.2.11 Monitor Shutdown Procedure .................................................................................. 20
List of Appendix APPENDIX A .............................................................................................................................. 21

Aethalometer 2.32.2 Version: 1.3
Jan. 29, 2015 Page 4 of 21
2.32.2 Aethalometer Monitoring Site Operation Procedures Note: The following is a list of "significant changes" from Revision 1.2. 1) QA updated per QAP/SOP 2.39 "Standard Operating Procedure (SOP) for Preparing Quality
Assurance Plans/SOPs". 2) Correct time link changed. 3) EDAS language removed and AvTrend language added. 2.32.2.1 Procedures for Site Operation and Calibration for Aethalometer Monitors
The Aethalometer instrument provides real-time readings of the concentrations of black or elemental carbon aerosol particles in the atmosphere. It uses an optical measurement to detect black carbon. The advantage of the Aethalometer is that it performs an immediate optical analysis and data readout without having to wait for a sample analysis from a laboratory. The instrument works by drawing ambient air through its sampling inlet about fifteen feet above ground level at a varying flow rate of a few liters per minute (lpm) dependent upon the instrument environment. The Aethalometer collects the sample on a quartz filter tape and performs a continuous optical analysis while the sample is collecting. A BGI PM2.5
Sharp Cut Cyclone© runs ahead of the Aethalometer sample stream to ensure that only the particles having aerodynamic diameter less than 2.5 µm are collected and analyzed. As with many environmental instruments, instrument settings may need to be adjusted to suit the specific environmental surroundings. Urban sites may use different settings than rural sites. For example, the Aethalometer at South Dekalb, which is an urban site, might use different instrument settings than an Aethalometer at a rural or mountaintop site. A flow rate of 5.1 lpm, or within 10% of that value, is satisfactory for most urban sites. Rural sites generally have a higher flow rate of 6.0 lpm.
All original records (records documenting observations, i.e. calibration logbook and site logbook) must be legible, complete, dated, and signed by the operator and retained as part of the permanent analyzer calibration record. The operator’s signature on the calibration logbook form certifies that the calibration has been performed in accordance with this QA/SOP and that the information contained on the form is accurate. All records will be reviewed and verified by the Regional Chemist and audited by Raleigh Headquarters. A. Continuous monitoring principles that applies to the Aethalometer system: • General: Site visits and quality assurance checks for the Aethalometer program. • Site Documentation: Download data on site - minimum of every 14 days (site visits),
uploaded/ FTP’d data monthly.

Aethalometer 2.32.2 Version: 1.3
Jan. 29, 2015 Page 5 of 21
• Aethalometer Preventative Maintenance: cleaning inlets, data review, install new tape roll, bypass filter change and site support.
• Biweekly and Monthly Checks • Sample Flow Check - Performed every 14 days or less. • Sample Flow Audit – Monthly • Optical Strip Check – 6 Months
• Calibration: • It requires no calibration other than periodic checks of the air flow meter response
B. Equipment: • Magee Model AE21/AE22 Aethalometer • ESC 8816 Data Logger (PDL) • Dedicated site PC • Wireless modem / Ethernet 2.32.2.2 Calibration
The Aethalometer™ software includes an internal calibration feature that allows the system to perform a two-point calibration for the response of the internal mass flow meter or controller. The instrument must first be allowed to stabilize under normal ‘power-on’ operating conditions for a minimum period of one hour before this calibration is performed. The Aethalometer is a self-contained, automatic instrument. It requires no consumable materials, no gas cylinders, and no operator attention. It runs automatically: plug it in, walk away. It requires no calibration other than periodic checks of the air flow meter response. Aethalometer needs to be sent to manufacturer every two years for pump mass flow recertification. The program first allows the user to switch between ‘Standard’ and ‘Volumetric’ flow units. (If ‘Volumetric’ flow units are selected, it is necessary to input the barometric pressure and ambient air temperature). This function is not password protected. The program next allows the user to re-calibrate the flowmeter: this function is protected. If a re-calibration is required, see section 2.32.2.2 b). a) Flow Volume Units: The program allows the flow to be expressed in terms of either Standard Units or Volumetric Units. Standard Units report the airflow rate as SLPM, i.e. volume occupied by a given mass of air at a temperature of 20°C and a pressure of 1013 mb. This mass flow rate is the signal that is provided by the mass flow meter in the instrument. The Aethalometer data is reported as ng/m³ or µg/m³, where the “m³” is understood to be a standard cubic meter. Volumetric Units convert the mass of air to a volume calculated at certain specified ambient conditions of temperature and pressure. The user must enter these conditions – the instrument does not measure them. The mass flow rate signal provided by the mass flow meter is scaled by

Aethalometer 2.32.2 Version: 1.3
Jan. 29, 2015 Page 6 of 21
proportionality factors for temperature (input in degrees C) and pressure (input in millibars). When volumetric units are selected for the flow, the flow rate display on the screen is shown as vLPM, and the BC calculation is presented as ng/vm³ or µg/vm³. The volumetric calculation requires user input of ambient temperature and pressure. These factors may be entered without going through the flowmeter recalibration procedure. This allows for entering different mean ambient temperatures or different pressures if the instrument is moved to a location of different elevation, without disturbing the fundamental calibration of the mass flow meter response. b) Flowmeter Re-Calibration This is a ‘protected’ function and requires the Security Code as a password. This procedure calibrates the flowmeter response by measuring the flowmeter zero voltage and determining the flow scale factor. These two factors are used during measurements to calculate the actual airflow through the flowmeter. Notes: • You will need a standard external flowmeter or calibrator capable of reading airflow rates in
the range of 2 to 10 slpm, with a low resistance to flow. Connect this calibrator firmly to the Sample Inlet Port with no possibility of an air leak.
Note: Only perform this re-calibration if you have serious reason to believe that the flowmeter response is incorrect. • Allow the instrument to warm up for at least 30 minutes with power and airflow ‘on’, before
performing the re-calibration. The computer and electronics control the internal pump, and this allows the program to set ‘zero’ and ‘span’ flows. All that is required of the operator is to connect a standard external flow calibrator, and observe its reading. The routine first automatically reduces the pump speed slowly to zero, while measuring the signal from the internal flowmeter. When this has reached a steady low value as determined by no more change in voltage output, the value of the reading is used as the flowmeter zero voltage. The pump is then re-started and run up to its previous speed. When the flowmeter signal is steady, the screen displays the flow rate in liters per minute derived from the new zero and the previous scale factor. The user must then compare the displayed value of flow with the actual value as measured by the external standard. • Pressing the keypad ↑and ↓ arrow keys will change the flow scale factor. • Press these keys until the displayed value agrees with the measurement from the external
calibrator. • Press ENTER key when the displayed value is correct.

Aethalometer 2.32.2 Version: 1.3
Jan. 29, 2015 Page 7 of 21
Upon return to the main system menu the user is asked to confirm writing the newly measured response factors to the setup file. The previous flow calibration values are not replaced until this confirmation is made. In case of any doubt, repeat the procedure. 2.32.2.3 Bi – Monthly Inspection (every 14 days)
a) Site Checks - Upon arrival at the site, observe the outside of the sampling building and probe, looking for vandalism or security breaches. If there is any evidence of vandalism contact the appropriate law enforcement department (generally this is the city police department if the monitor is within city limits, and the county sheriff’s department if outside city limits) and headquarters. Record your observations and monitor checks in the e-log. Visually inspect the tubing, especially at any bends to ensure that it has not been accidentally kinked, crimped or cut.
Check Aethalometer instrument area to ensure that there are no insects, moisture, dust or other particles in around the instrument. Perform visual inspection of BGI PM2.5 Sharp Cut Cyclone© intake area to ensure that the intake is not clogged by any flow obstructions.
Visually inspect the tubing, especially at any bends, to ensure that it has not been accidentally kinked, crimped or cut.
b) Station Temperature Check- measure and record the site temperature in ºC. Adjust the
site thermostats as necessary to maintain the 20º to 30ºC range. If the temperature is outside of the 20º to 30ºC range, notify the Regional Chemist and the ECB to correct the problem and invalidate data if necessary.
c) Check the Aethalometer display for normal operation – Observe the analyzer, computer,
and data logger for indications of power failure, and if needed, correct the cause. Check for reasonable readings, no error messages, and proper lights on, etc. If the analyzer lost power, allow an equilibration period of at least an hour for the instrument(s) to stabilize.
Aethalometer display
• If the colored light on the control panel is green, operation is okay (After a tape advance, during re-initialization, the light will be flashing green).
• If the colored light on the control panel is a flashing yellow, the instrument needs attention but is still running, and the data is okay (flashing yellow light could mean that the data disk is almost full, the tape is almost all used, or the air flow rate has changed more than 10%). See the troubleshooting guide in the manufacturer manual for flashing yellow and red lights.
• A constant yellow light indicates that the instrument has been paused by the operator and is ready for measurement.
• If the light is red, there is a problem and the instrument has stopped. If the tape has become hung up, bend back the small wire on the feeder spool (left-hand side). This

Aethalometer 2.32.2 Version: 1.3
Jan. 29, 2015 Page 8 of 21
should fix the tension problem and will avoid having to shut the instrument off and on again for a long reboot cycle.
Disable channels
• {ESC} to Home Menu on PDL • Select: "C" Configuration Menu • Select: "D" Configure Data Channels • Select: "M" "Disable/Mark Channel Offline" • Use arrow key to select pollutant, <ENTER> • Highlight "BCAE20" then press, <ENTER>, highlight "UV" then press <ENTER> • Record time that channel is disabled
d) Check Date/Time Computer - Check the computer time and date at the lower right hand
corner of the computer screen. If the time and date are not correct; click START button, control panel, date/time or right click computer time on taskbar, select Adjust Date/Time, type in changes and select OK.
Sources for getting the correct time: 1. Call the ECB and ask for the NIST time. 2. Call the NIST Colorado time @ (303) 499-7111 (long distance). 3. Correct time loaded into cell phone. 4. Correct time website, http://tycho.usno.navy.mil/ e) Check Date/Time on Data Logger - The times for the PDL and computer must be
EASTERN STANDARD TIME. NOTE!! The PDL must have the same NIST time ±1 minute with the analyzer.
PDL time and date:
• Select the AvTrend icon, enter the username followed by the password, hit "OK" • Select: "Utilities" • Select: "Link to Logger" • From the drop down menu locate the site to run the calibration on • Select: "Connect" • Select: "L" to log onto the site data logger (use site password) • Select: "C" configuration menu • Select: "S" configure System Parameters • Highlight "Logger Time" • Type in correct time in the format of: HH:MM:SS • {ESC}{ESC}{ESC}
f) Check Aethalometer Date/Time 1. Press STOP key, watch screen. Press STOP key again. Enter "Security Code" of 111
(before clock countdown expires). Should present you back at the Main Menu. If the code
Aethalometer 2.32.2 Version: 1.3
Jan. 29, 2015 Page 9 of 21
entered is not correct, or is not entered fast enough, measurement operations simply continue as normal.
2. Press ↓ arrow to get next menu item, ‘Change Sys. Settings’, press ENTER. 3. The first item is Date & Time, press ENTER. Use the arrow keys to move the
blinking cursor over each number. 4. Use the ↑↓ keys to change the numbers so that the date and time are correct, press
ENTER when done. When asked whether to ‘Write Settings?’ press YES. To return to the Main Screen showing the flow reading, press ENTER three times (once in the "Operate" window, once in the "UV Mode" window, and once when asked to enter "Auto Mode"). The Aethalometer must be "stopped" to change the time, but does not need to be taken offline, since the –5 volt output during this time automatically flags the data as void in the data logger. If there is a continual trend of system time error (for example, a system generally gains 2 minutes each week), set the time somewhat off in the opposite direction of the trend to reduce the need for frequent system time changes. For the fast clock example above, set it 4 or 5 minutes slow each clock reset.
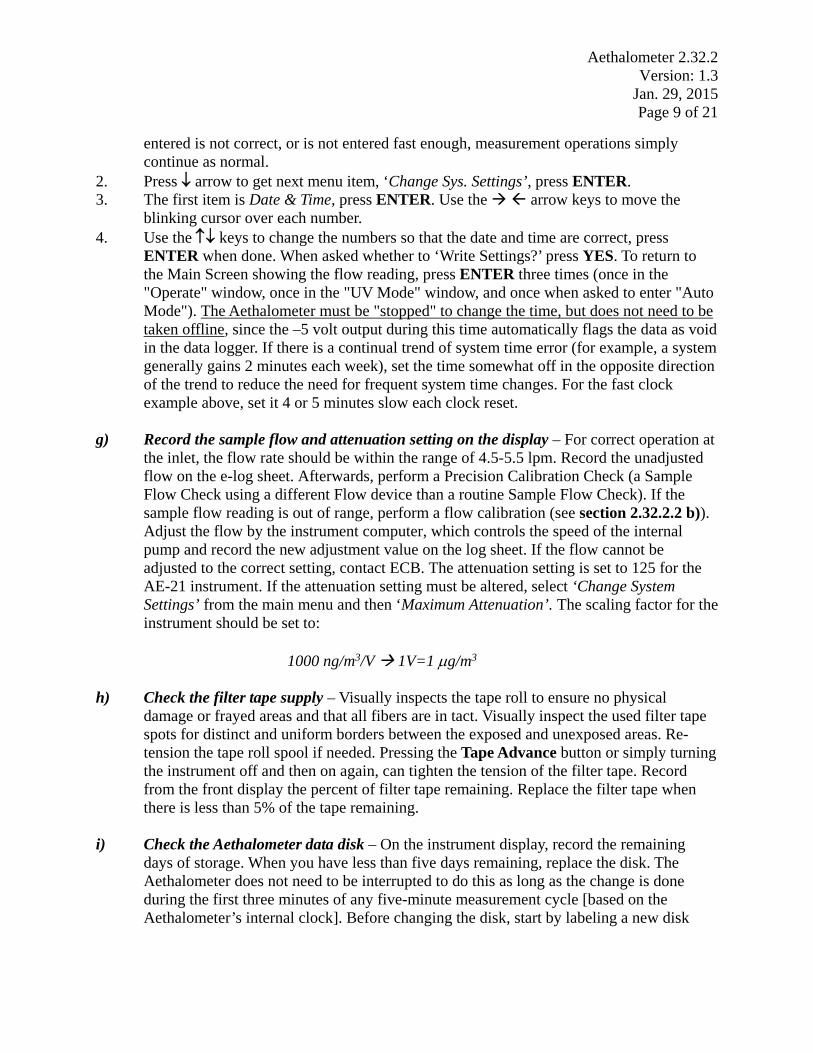
g) Record the sample flow and attenuation setting on the display – For correct operation at
the inlet, the flow rate should be within the range of 4.5-5.5 lpm. Record the unadjusted flow on the e-log sheet. Afterwards, perform a Precision Calibration Check (a Sample Flow Check using a different Flow device than a routine Sample Flow Check). If the sample flow reading is out of range, perform a flow calibration (see section 2.32.2.2 b)). Adjust the flow by the instrument computer, which controls the speed of the internal pump and record the new adjustment value on the log sheet. If the flow cannot be adjusted to the correct setting, contact ECB. The attenuation setting is set to 125 for the AE-21 instrument. If the attenuation setting must be altered, select ‘Change System Settings’ from the main menu and then ‘Maximum Attenuation’. The scaling factor for the instrument should be set to:
1000 ng/m3/V 1V=1 µg/m3
h) Check the filter tape supply – Visually inspects the tape roll to ensure no physical
damage or frayed areas and that all fibers are in tact. Visually inspect the used filter tape spots for distinct and uniform borders between the exposed and unexposed areas. Re-tension the tape roll spool if needed. Pressing the Tape Advance button or simply turning the instrument off and then on again, can tighten the tension of the filter tape. Record from the front display the percent of filter tape remaining. Replace the filter tape when there is less than 5% of the tape remaining.
i) Check the Aethalometer data disk – On the instrument display, record the remaining
days of storage. When you have less than five days remaining, replace the disk. The Aethalometer does not need to be interrupted to do this as long as the change is done during the first three minutes of any five-minute measurement cycle [based on the Aethalometer’s internal clock]. Before changing the disk, start by labeling a new disk
Aethalometer 2.32.2 Version: 1.3
Jan. 29, 2015 Page 10 of 21
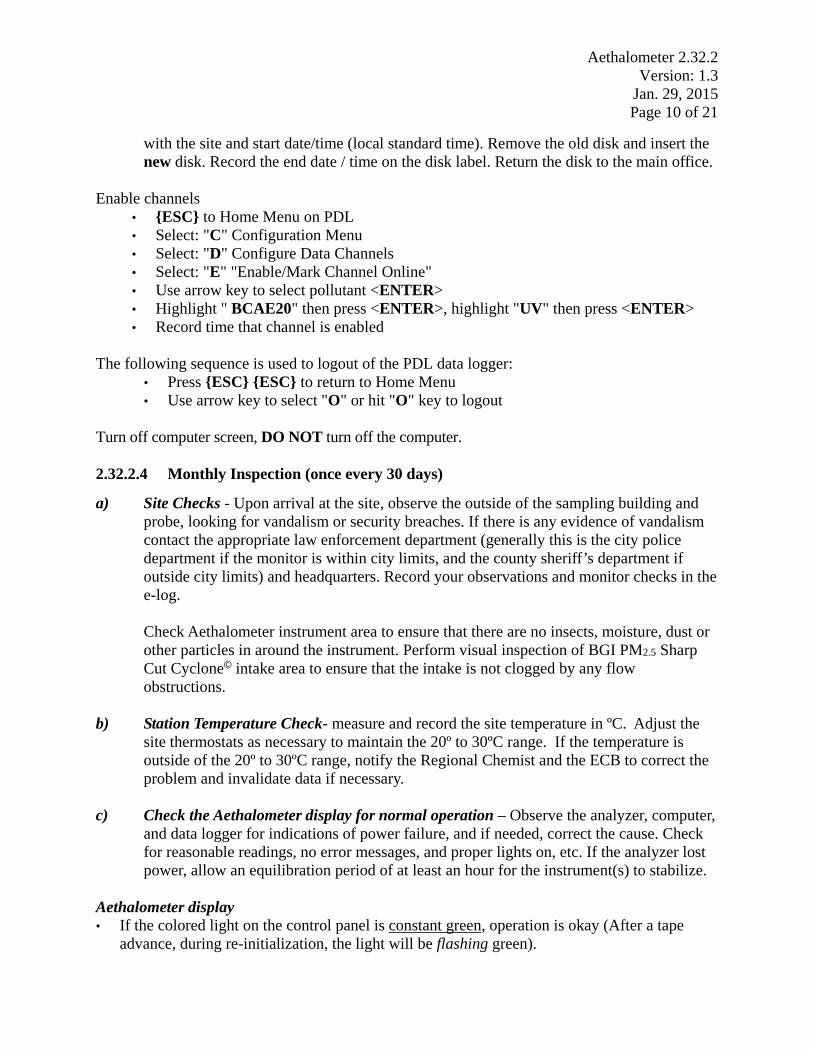
with the site and start date/time (local standard time). Remove the old disk and insert the new disk. Record the end date / time on the disk label. Return the disk to the main office.
Enable channels
• {ESC} to Home Menu on PDL • Select: "C" Configuration Menu • Select: "D" Configure Data Channels • Select: "E" "Enable/Mark Channel Online" • Use arrow key to select pollutant <ENTER> • Highlight " BCAE20" then press <ENTER>, highlight "UV" then press <ENTER> • Record time that channel is enabled
The following sequence is used to logout of the PDL data logger: • Press {ESC} {ESC} to return to Home Menu • Use arrow key to select "O" or hit "O" key to logout
Turn off computer screen, DO NOT turn off the computer. 2.32.2.4 Monthly Inspection (once every 30 days)
a) Site Checks - Upon arrival at the site, observe the outside of the sampling building and probe, looking for vandalism or security breaches. If there is any evidence of vandalism contact the appropriate law enforcement department (generally this is the city police department if the monitor is within city limits, and the county sheriff’s department if outside city limits) and headquarters. Record your observations and monitor checks in the e-log.
Check Aethalometer instrument area to ensure that there are no insects, moisture, dust or other particles in around the instrument. Perform visual inspection of BGI PM2.5 Sharp Cut Cyclone© intake area to ensure that the intake is not clogged by any flow obstructions.
b) Station Temperature Check- measure and record the site temperature in ºC. Adjust the
site thermostats as necessary to maintain the 20º to 30ºC range. If the temperature is outside of the 20º to 30ºC range, notify the Regional Chemist and the ECB to correct the problem and invalidate data if necessary.
c) Check the Aethalometer display for normal operation – Observe the analyzer, computer,
and data logger for indications of power failure, and if needed, correct the cause. Check for reasonable readings, no error messages, and proper lights on, etc. If the analyzer lost power, allow an equilibration period of at least an hour for the instrument(s) to stabilize.
Aethalometer display • If the colored light on the control panel is constant green, operation is okay (After a tape
advance, during re-initialization, the light will be flashing green).

Aethalometer 2.32.2 Version: 1.3
Jan. 29, 2015 Page 11 of 21
• A constant yellow light indicates that the instrument has been paused by the operator and is ready for measurement.
• If the colored light on the control panel is a flashing yellow, the instrument needs attention but is still running, and the data is okay (flashing yellow light could mean that the data disk is almost full, the tape is almost all used, or the air flow rate has changed more than 10%). See the troubleshooting guide in the manufacturer manual for flashing yellow and red lights.
• If the light is constant red, Instrument is not ready to run: stopped either by a serious error or when operator is in a menu/setup mode.. If the tape has become hung up, bend back the
small wire on the feeder spool (left-hand side). This should fix the tension problem and will avoid having to shut the instrument off and on again for a long reboot cycle. Flashing red - a serious error has occurred, the instrument has stopped.
Disable channels
• {ESC} to Home Menu on PDL • Select: "C" Configuration Menu • Select: "D" Configure Data Channels • Select: "M" "Disable/Mark Channel Offline" • Use arrow key to select pollutant, <ENTER> • Highlight " BCAE20" then press, <ENTER>, highlight "UV" then press <ENTER> • Record time that channel is disabled
d) Check Date/Time Computer - Check the computer time and date at the lower right hand
corner of the computer screen. If the time and date are not correct; click START button, control panel, date/time or right click computer time on taskbar, select Adjust Date/Time, type in changes and select OK.
Sources for getting the correct time: 1. Call the ECB and ask for the NIST time. 2. Call the NIST Colorado time @ (303) 499-7111 (long distance). 3. Correct time loaded into cell phone. 4. Correct time website, http://tycho.usno.navy.mil/ e) Check Date/Time on Data Logger - The times for the PDL and computer must be
EASTERN STANDARD TIME. NOTE!! The PDL must have the same NIST time ±1 minute with the analyzer.
PDL time and date:
• Select the AvTrend icon, enter the username followed by the password, hit "OK" • Select: "Utilities" • Select: "Link to Logger" • From the drop down menu locate the site to run the calibration on • Select: "Connect" • Select: "L" to log onto the site data logger (use site password)

Aethalometer 2.32.2 Version: 1.3
Jan. 29, 2015 Page 12 of 21
• Select: "C" configuration menu • Select: "S" configure System Parameters • Highlight "Logger Time" • Type in correct time in the format of: HH:MM:SS • {ESC}{ESC}{ESC}
f) Check Aethalometer Date/Time
a. Press STOP key, watch screen. Press STOP key again. Enter "Security Code" of 111 (before clock countdown expires). Should present you back at the Main Menu. If the code entered is not correct, or is not entered fast enough, measurement operations simply continue as normal.
b. Press ↓ arrow to get next menu item, ‘Change Sys. Settings’, press ENTER. c. The first item is Date & Time, press ENTER. Use the arrow keys to move the
blinking cursor over each number. d. Use the ↑↓ arrow keys to change the numbers so that the date and time are correct. Press
ENTER when done. When asked whether to ‘Write Settings?’ press YES. To return to the Main Screen showing the flow reading, press ENTER three times (once in the "Operate" window, once in the "UV Mode" window, and once when asked to enter "Auto Mode").
g) Clean the cyclone – The cleaning interval for the cyclone is dependent upon the environment it is in. In harsh industrial environments, daily attention may be required. In normal ambient environments, a once a month cleaning is generally sufficient. To clean, the following method must be taken:
a. Unscrew the grit pot at the top of the cyclone and remove it. b. Dispose of the contents and clean and dry it. c. Remove the three screws from the side of the cyclone and remove the side. The parts can
now be cleaned, thoroughly. The cleaning method of first choice is immersion in an ultrasonic cleaner with water and mild soap. Usually hand wiping with a water-dampened lint free cloth will suffice.
h) Perform an external flow check – The flow check should be done while the Aethalometer instrument is in its normal run mode. Do not stop data collection to do this test, since that can change the flow. The "TAPE SAVER" function must be off to perform the following flow check procedure:
Measure the sample flow at the sample inlet of the Aethalometer instrument using a
currently certified BIOS flow meter, dry test meter, rotameter, or some other calibrated volumetric flow measurement device with a range of 3 to 5.1 LPM. The external flow meter must be at ambient temperature for readings to be valid.

Aethalometer 2.32.2 Version: 1.3
Jan. 29, 2015 Page 13 of 21
Record the flow from the Aethalometer display. Correct the external volumetric flow measurement to a standard condition of 20°C and 29.92" Hg as follows:
STP flow = actual flow * [293/(273+ambient T in °C)] * [Barometer (inches Hg)/29.92]
Calculate the percent error of the Aethalometer flow compared to the external flow standard:
%Error = 100x (Aethalometer display – external STP flow)/external STP flow. If the flow difference is more than 10% do a flow calibration (section 2.32.2.2 b). i) Check the filter tape supply – Visually inspect the tape roll to ensure no physical damage or frayed areas and that all fibers are in tact. Visually inspect the used filter tape spots for distinct and uniform borders between the exposed and unexposed areas. Re-tension the tape roll spool if needed. Pressing the Tape Advance button or simply turning the instrument off and then on again, can tighten the tension of the filter tape. Enable channels
• {ESC} to Home Menu on PDL • Select: "C" Configuration Menu • Select: "D" Configure Data Channels • Select: "E" "Enable/Mark Channel Online" • Use arrow key to select pollutant <ENTER> • Highlight " BCAE20" then press <ENTER, highlight "UV" then press <ENTER> • Record time that channel is enabled
The following sequence is used to logout of the PDL data logger:
• Press {ESC} {ESC} to return to Home Menu • Use arrow key to select "O" or hit "O" key to logout
Turn off computer screen, DO NOT turn off the computer. 2.32.2.5 Six Month Inspection
a) Perform optical strip test – The optical strip test will be performed semi-annually. There is an optical test strip (neutral density filter) provided with the Aethalometer instrument for the purpose of this test. Do Not Lose This Strip! Keep the Test Strip Clean, Flat and Smooth! The following procedure may be used for performing the optical strip check: 1. Press STOP key, watch screen. Press STOP key again. Enter Security Code of ‘111’ before expiration of clock countdown. This should return you to the Main Menu, where you can press the down-arrow to get the menu item ‘Optical Test’ and press ENTER. Enter the security code again. The automated test procedure will then give you a series of prompts. You do not necessarily have to do the operation directly after each prompt. However, at the close of the test, each prompt must have been answered in order for the test to be complete.

Aethalometer 2.32.2 Version: 1.3
Jan. 29, 2015 Page 14 of 21
2. The Optical Test Strip has a serial number printed at one end that should match the serial number of the instrument. Enter this number when prompted. Check that there is a floppy disk in the disk drive. 3. Open the door and remove the two thumbscrews that secure the rectangular metal cover over the sampling chamber in the center of the instrument. This provides access to the area where the filter tape passes through the optical system. 4. Cut the filter tape on the left side of the chamber with scissors. Press ENTER when prompted. Lift up the optical chamber (by pressing the "Tape Advance" button) to pull the tape out. Take off the round banana clip sticking outward for better access. The remaining tape will be pulled out onto the right-hand spool. Take the clear cover off the tape roll on the right side and unwind all the remaining tape on the spool. Save the spool for later use. 5. When prompted, insert the optical test strip from the left-hand side. Its printed serial number should be facing upwards on the right-hand side. Push it in from the left until the tip of the arrow printed on it is just visible in alignment with the edge of the base block. Press ENTER when ready. 6. The first phase of the test will proceed automatically. The lamp will turn ON and OFF to determine the optical transmission signals for the ‘front’ portion of the test strip 7. At the end of the first set of measurements, the transmission values will be displayed. It is not necessary to write them down, as they are saved to disk. Press ENTER to proceed. The mechanism will go through three tape-advance cycles in order to pull the test strip forward. It takes approximately 5 minutes (because readings are taken in five minute increments). 8. The second phase of the test will cycle the lamps again and measure the optical transmission signals for the ‘rear’ portion of the test strip. The program will then calculate the quantities ‘S Density’, ‘R Density’, and ‘Balance’. The signals, results and other information will be written to a file on the disk under file name ‘Otxxxxxx.TXT’ where ‘OT’ represents Optical Test, and ‘xxxxxx’ is the date coded in either ‘US’ or ‘EURO’ format, i.e. MMDDYY or DDMMYY. This text file should be printed out and saved in the site logbook. If there is no printer at the site, copy this text file to the hard drive of the laptop and print it out in the office. 9. The display screen will then prompt the user to re-insert the filter tape from the left-hand side. Press “Tape Advance” button to lift optical chamber and pull the strip through. After pulling it through, re-attach it to the tape on the right-hand take-up spool. Replace the rectangular metal cover with its two thumbscrews. 10. After optical strip test, allow at least 10 minutes for the machine to stabilize before trusting readings again (by that time, the machine would have taken 2 five-minute measurements). Note: copy / paste the optical test strip results to the e-log.

Aethalometer 2.32.2 Version: 1.3
Jan. 29, 2015 Page 15 of 21
b) Data Verification – verify the concentration reported by the datalogger agrees with the aethalometer display within 200 ng while the optical strip is in place. Record the results in the e-log. 2.32.2.6 Periodic Maintenance (as needed)
Install New Tape Roll – The display screen on the Aethalometer shows an estimate of the percentage of the tape roll that remains. When this falls below 10%, the ‘Check’ lamp on the display panel will be lit. When the tape is eventually all used, it is necessary to install a fresh roll, according to the procedures given below. The menu option ‘Install New Tape’ offers an abbreviated set of sequential instructions with prompts to guide the operator through the necessary steps. The first screen in the ‘Install New Tape’ section asks ‘List Instructions?’ When YES is selected, the display screen guides the user through all the operations required for changing the tape. After each phrase, the user must press any key to proceed. The following procedure shows the steps the operator must take to install a new tape, with the software prompts the user will see on the display screen, shown first in parentheses and italics: a. Press STOP key, watch screen. Press STOP key again. Enter security code of "111", before expiration of clock countdown. This should return you to the main menu, where you can press the down arrows to get the menu item "Change System Settings".
b. At the ‘Change Sys. Settings’ prompt. Press ENTER. Move down to the ‘Install New Tape’ option and press ENTER. The screen will ask, ‘List Instructions?’ Press YES. It will then give you a series of prompts. c. Remove spool screws - remove the two thumbscrews securing the clear plastic front spools. d. Remove cover screws - remove the two thumbscrews securing the analyzer chamber center cover plate. e. Pull out guide rod - Pull out the gray plastic guide rod (with banana jack) on the left side of the analyzer chamber. f. Cut old tape - Use scissors, cut the tape on the left hand (supply) side. Leave a few centimeters. g. Remove supply roll - Remove the old roll of tape from the supply side. Open the box of new tape; take out the new roll, the new cardboard center, and the new spring clip. (Remove take up roll) h. Install new roll - put the new roll of tape on the supply side. Using tape, stick the start of the new tape to the end of the old tape on the left of the analyzer. i. Lift up chamber 2mm - Press and hold the Tape Advance button. The inlet assembly will lift about 2 mm – just enough to release the clamping force on the tape.

Aethalometer 2.32.2 Version: 1.3
Jan. 29, 2015 Page 16 of 21
j. Push tape through. Lift up chamber 2 mm.
k. Pull 10 cm tape - With your right hand, pull the old tape out to the right, with the new tape stuck to it. Pull about 20 cm. of new tape through. Cut off the old tape. Remove the filled spool of used tape from the right-hand (take-up side), and discard. Be sure not to dislodge the o-ring, which is behind the cardboard center. l. Install take - up hub - Put the empty cardboard center (from the new tape box) onto the take-up hub. m. Clip tape to hub - Take about 10 cm. of the new tape, and clamp it under the spring clip onto the cardboard center. Put the cardboard center onto the right-hand take-up hub, turn it counter-clockwise to roll up the slack tape onto itself. n. Push in guide rod - Replace the clear flange on the supply spool side. Tighten the thumbscrew firmly but not excessively. Check by pulling on the unrolling portion on the left, that the supply roll can turn against a little friction. Plug the guide rod back in to its banana jack. o. Replace cover - Replace the clear flange on the take-up side of the spool. Tightening the thumbscrew clamps the cardboard hub against the o-ring behind it, which provides the grip to pull the tape. Press the “Tape Tension” switch; roll up any slack tape on the right-hand side. It is critical that the tension on the tape is set correctly or the tape will not advance properly. p. Replace spool - replace the analyzer chamber cover plate. q. Tighten spool screws” - Replace the two thumb screws and ensure that they’re tightened.
The screen then asks: ‘Is the tape properly replaced?” Entering YES will re-set the tape counter to 100% and conclude the process.
2.32.2.7 Site Calls (See Section III: Regional Office Responsibilities: AvTrend set-up; Retrieval, Review, Correction and Storage of Data; Report Submission, for site operator’s duties between visits.) To minimize travel some site operational checks must be made from the office. Site calls are recommended every working day. Calls to a site can be made at any time; however an effort to avoid calling during the first 5 minutes of an hour should be made in order to avoid conflict with the calls made by the automated polling process of the Statistician headquarters computer. At a minimum request, poll yesterday’s data, and today’s data. If calling on a Monday, retrieve the data for Friday, Saturday, and Sunday as well.

Aethalometer 2.32.2 Version: 1.3
Jan. 29, 2015 Page 17 of 21
Review the Reports For Flagged Data. Flags are assigned to data to indicate its validity. If no flag follows a value, the data is assumed accurate and valid. These data are used in all appropriate averages. If any of the flagged data appears unusual make a note to check the back up data collected during the next site visit. If several values are invalid, a site visit may be needed. If a channel is incorrectly marked "D" (down) the data may be valid and you will need to notify headquarters of any valid data to be reported. Compare the monitor results for each day. Review the power failure report. Review the log for temperature inside the building. See Section III: Regional Office Responsibilities on "polling" for complete flag and review procedures. 2.32.2.8 Data Reporting and Validation for Regional Offices (See Section IV: Continuous Monitor QA Plan Section, Headquarters Responsibilities.) Data Validation for Regional Offices: The regional office is responsible for data validity. Verify that all periods of missing or invalid data have been accounted for, and the reasons have been identified for missing or invalid data on the Monthly AIRS Report. All monthly data should be submitted to headquarters within 10 working days from the end of the collection month. All data, including logbooks and supporting printouts must be kept for five years. Data Reported Automatically
The operator must review all data submitted by the primary data logger. This is done preliminarily by reviewing printouts created by site calls and site visits. Note any unusual high (10 µg/m3) or low data (–0.1 µg/m3) with invalidation flags. Negative Aethalometer readings less than – 0.1 µg/m3 (hourly average) are considered invalid data. Large five minute-averaged negative readings (< -0.1µg/m3) indicate extremely low levels of elemental carbon (near minimum detection limit), and are typically accompanied by large positive values according to the instrument manufacturer. These negative and positive fluctuations generally balance out and yield a valid hourly average. When requested, provide copies of the primary data logger printouts and logbook pages. The photocopies must show: (1) External Flow Check - Monthly For flagged data, verify the flags are appropriate and note your findings on the printouts. Note: Use of the Monthly File Listing for the checks below is preferred.
Aethalometer 2.32.2 Version: 1.3
Jan. 29, 2015 Page 18 of 21
Verify any valid data identified by the data logger as "invalid" data (by flags). Verify that all periods of missing or invalid data have been accounted for, and the reasons have been identified for missing or invalid data on the Monthly AIRS Report. 2.32.2.9 Quality Assurance Procedures
The Quality Assurance Program requires strict adherence to approved procedures including the performance of specific tasks and activities. The determination of adherence to the approved procedures and the quality of ambient air data collected at each site includes the biweekly precision point analysis performed by the site operators, and a complete systems audit performed by the staff of the Ambient Monitoring Section of the Division of Air Quality of each monitoring site and the ECB. This approach provides the essential ongoing and independent evaluation of data quality and reliability for the entire ambient air quality data set collected at each site and statewide. Strict adherence to the established approved procedures is required to enable the Division of Air Quality to certify that the data collected is true and representative of the ambient levels of carbon particulate matter in the State of North Carolina. Certain information must be available to the auditor. a. Procedures for the Operator (Monitoring Technician) The major part of the monitoring technician's role in the Quality Assurance Program is the carrying out of his/her duties in accordance with the preceding operating procedures and performing the following duties: b. Precision Calibration Checks Every two weeks (EVERY 14 DAYS OR LESS), a one-point flow check on each analyzer is required. Document the flow check results on the appropriate e-log and send to Headquarters for each quarter. Data validation must be conducted by the operator on a routine basis according to this QA plan. The Regional Ambient Monitoring Coordinator should verify that all site visits and flow checks are conducted as required. 2.32.2.10 Accuracy Audits and Reporting
Accuracy Auditing The Regional Chemist and assigned staff will perform the Aethalometer monitoring site accuracy audits. 40 CFR 58 Appendix A requires each particle monitor running in a network to be audited at least once every six months. There are three parameters essential to the quarterly flow audit; temperature, pressure, and flows. The ambient temperature and ambient pressure hand held readout devices as well as flow check devices are certified annually by the ECB against a NIST traceable standard.

Aethalometer 2.32.2 Version: 1.3
Jan. 29, 2015 Page 19 of 21
Note: The auditor must not be the same operator who conducts the routine monitoring, calibrations, and analysis. The audit is conducted before making any monitor adjustments. The monitor must operate in its normal sampling mode. a) Perform an external flow check – The flow check should be done while the Aethalometer instrument is in its normal run mode. Do not stop data collection to do this test, since that can change the flow. The "TAPE SAVER" function must be off to perform the following flow check procedure:
Measure the sample flow at the sample inlet of the Aethalometer instrument using a
currently certified BIOS flow meter, dry test meter, rotameter, or some other calibrated volumetric flow measurement device with a range of 3 to 5.1 LPM. The external flow meter must be at ambient temperature for readings to be valid.
Record the flow from the Aethalometer display. Correct the external volumetric flow measurement to a standard condition of 20°C and 29.92 "Hg as follows:
STP flow = actual flow * [293/(273+ambient T in °C)] * [Barometer (inches Hg)/29.92]
Calculate the percent error of the Aethalometer flow compared to the external flow standard:
%Error = 100x (Aethalometer display – external STP flow)/external STP flow. When the audit values are more than 10%, call the regional ambient monitoring coordinator and inform him of the situation and print out a copy of the audit log. The regional ambient monitoring coordinator will investigate suspicious audits to determine if there is a problem and if so, where the problem is and how to solve the problem. If the problem is with the region’s audit equipment, the region generally obtains different audit equipment and repeats the audit. If the problem is with the site equipment, i.e., the monitor, the regional ambient monitoring coordinator contacts the ECB so they can repair the site equipment. If the problem is a major site operation problem, the regional ambient monitoring coordinator informs the site operator, the ECB supervisor and the projects and procedures supervisor. b) Perform optical strip test – The optical strip test will be performed semi-annually. There is an optical test strip (neutral density filter) provided with the Aethalometer instrument for the purpose of this test. The following procedure may be used for performing the optical strip check: 1. Press STOP key, watch screen. Press STOP key again. Enter Security Code of ‘111’ before expiration of clock countdown. This should return you to the Main Menu, where you can press the down-arrow to get the menu item ‘Optical Test’ and press ENTER. Enter the security code again. The automated test procedure will then give you a series of prompts. You do not necessarily have to do the operation directly after each prompt. However, at the close of the test, each prompt must have been answered in order for the test to be complete.

Aethalometer 2.32.2 Version: 1.3
Jan. 29, 2015 Page 20 of 21
2. The Optical Test Strip has a serial number printed at one end that should match the serial number of the instrument. Enter this number when prompted. Check that there is a floppy disk in the disk drive. Systems Auditing The Regional Ambient Air Monitoring staff shall conduct the Annual Systems Audit. All records and documentation must be available for review. All audit values and information are to be entered on the flow rate/optical strip audit log (See Appendix A) and the AQ-99 form and forwarded to the Project and Procedures Branch supervisor at least 15 days before the end of each quarter. Note: The auditor must not be the same operator who conducts the routine monitoring, calibrations, and analysis. The audit is conducted before making any monitor adjustments. The monitor must operate in its normal sampling mode. Data Verification The Regional Ambient Monitoring Coordinator is responsible for all data verification activities. 2.32.2.11 Monitor Shutdown Procedure
1. Select the AvTrend icon, enter the username followed by the password, hit "OK" 2. Select: "Utilities" 3. Select: "Link to Logger" 4. From the drop down menu locate the site to shut down 5. Select: "Connect", when the site has connected 6. Select: "L" to log onto the site data logger (use site password). 7. Down the associated parameter (BCAE20 / UV) channels 8. Turn the Aethalometer power off. Pull the power plugs out for protection from lightning. 9. Submit site shutdown form.
Aethalometer 2.32.2 Version: 1.3
Jan. 29, 2015 Page 21 of 21
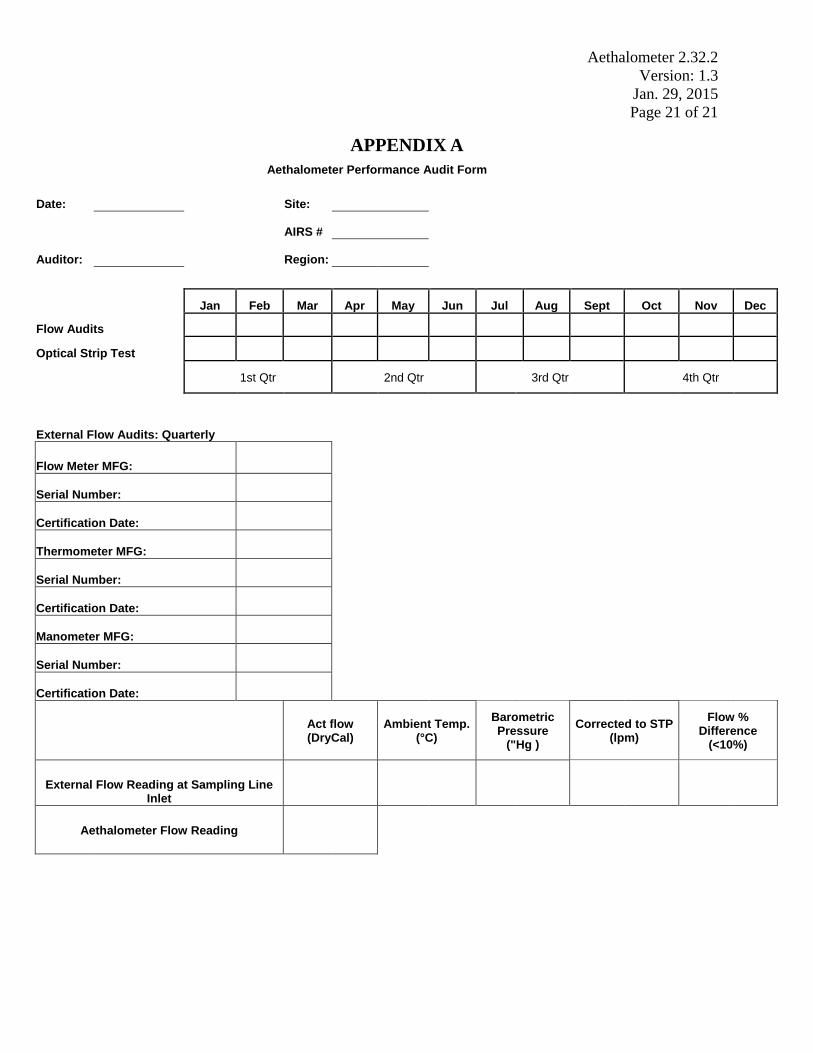
APPENDIX A Aethalometer Performance Audit Form
Date: Site:
AIRS #
Auditor: Region:
Jan Feb Mar Apr May Jun Jul Aug Sept Oct Nov Dec
Flow Audits
Optical Strip Test
1st Qtr 2nd Qtr 3rd Qtr 4th Qtr
External Flow Audits: Quarterly
Flow Meter MFG:
Serial Number:
Certification Date:
Thermometer MFG:
Serial Number:
Certification Date:
Manometer MFG:
Serial Number:
Certification Date:
Act flow (DryCal)
Ambient Temp. (°C)
Barometric Pressure
("Hg ) Corrected to STP
(lpm) Flow %
Difference (<10%)
External Flow Reading at Sampling Line
Inlet
Aethalometer Flow Reading

Sign-Off Sheet
I certify that I have read, understand and agree to follow the contents of Revision 1.3 of the
"AETHALOMETER TM STANDARD OPERATING PROCEDURES, Section JI, OPERA TOR RESPONSIBILITIES" with an effective date of January 29, 2015. Sign, date and return to the Ambient Monitoring Section Chief.
Site Operator: --F-''--l-__,_....,'"'---+----H--=----"'-""----1-____.1-/--"""--_ ___ ________ _
Site Operator: '>=4---+--1-+----'-"'--'l.....L..-""""--~-~-=--.'...L_--_,__/ -=-S_' __________ _
Site Operator: --------------------------
Site Operator: ________ _________________ _
Site Operator: _________________________ _


![Operating Procedures 1 G2 - OPERATING PROCEDURES [6 Exam Questions - 6 Groups] G2APhone operating procedures; USB/LSB utilization conventions; procedural.](https://static.fdocuments.in/doc/165x107/56649e4d5503460f94b4351a/operating-procedures-1-g2-operating-procedures-6-exam-questions-6-groups.jpg)