Aerospace Industry Competitiveness...
38
Aerospace Industry Competitiveness Study April, 2009 Prepared for the Economic Development Council of Snohomish County By Deloitte Consulting EDC of Snohomish County (425) 248-4221
-
Upload
truongtuyen -
Category
Documents
-
view
218 -
download
0
Transcript of Aerospace Industry Competitiveness...

Aerospace Industry Competitiveness Study
April, 2009
Prepared for the Economic Development Council of Snohomish CountyBy Deloitte Consulting
EDC of Snohomish County (425) 248-4221

- 2 -
Table of Contents
Executive Summary: 3Background 4
Context and Scope 5Economic Impact 6
Market Context: 7Market Challenges 8OEM Competitive Analysis 10Recent Aerospace Incentive Packages 11
Competitive Assessment Summary: 12Comparison Framework 13
Recommendations: 14Training/Education Recommendation 16Research and Development Recommendation 17Dedicated Aerospace Council Recommendation 18Cost-Related Recommendations 20Labor Management Relations 21
Competitive Assessment Details: 22Wage Rates 23Labor Management Relations 25Aerospace Skills-base 26Unemployment Insurance 28Workers’ Compensation 29Other Taxes (e.g., B&O/Income, Property, Sales) 30Training Programs 32Educated Workforce 33Innovation Environment 34Transportation 35Facility Costs 36Quality of Life 37Cost of Living 38

- 3 -
Washington is not keeping its competitive edge in attracting and retaining the commercial aircraft industry
Executive Summary
The aerospace industry is important to the state of Washington– The aerospace industry accounts for over $36B in economic value to the state
– Washington is the highest per capita aerospace employer at 44 jobs per 1,000 workers
The commercial aircraft industry faces cost competitiveness, which impacts location decisions– Aircraft OEM customers (i.e., airlines) face economic uncertainty, driving cost pressure
– Labor is being replaced by technology allowing for increased mobility
– Subsidies from national government and/or state agencies significantly impact company competitiveness
Washington has not been a player in recent site selection decisions by aerospace companies
While Washington offers many advantages to aerospace companies, its disadvantages outweigh the advantages in attracting and retaining aerospace companies relative to other states– Washington exhibits a number of advantages, including current aerospace base/footprint, availability of skilled labor force,
competitive tax environment, access to leading R&D and quality of life
– Competitive disadvantages include wage rates, labor relations, training, cost of living, and real estate/utility costs
Washington should proactively address the gaps, including enacting appropriate legislation– Short term opportunities exist in unemployment insurance tax, training, research and development funding and building a
government entity dedicated to the aerospace industry
– Longer-term opportunities potentially include taxes, workers compensation and transportation/infrastructure

Background

- 5 -
Context and scope of project
Leaders in Washington believe there is a growing gap in Washington’s ability to compete with other states for attracting and retaining aerospace companies; Washington’s primary competitors for aerospace companies appear to be:– Charleston, South Carolina
– Global Transpark, North Carolina
– San Antonio, Texas
– Wichita, Kansas
Washington remains a leader in aerospace, but omission in recent aerospace site selection projects have highlighted disadvantages in Washington’s ability to attract new aerospace companies to the state
State officials requested an objective assessment of the competitiveness of the Washington state business climate for the A&D industry as it compares to competitor states outlined above
The output of this study will be utilized by elected leaders in Washington to identify and outline gap closure recommendations and actions to maintain the states competitiveness in attracting and retaining aerospace companies
Context and Scope
- 6 -
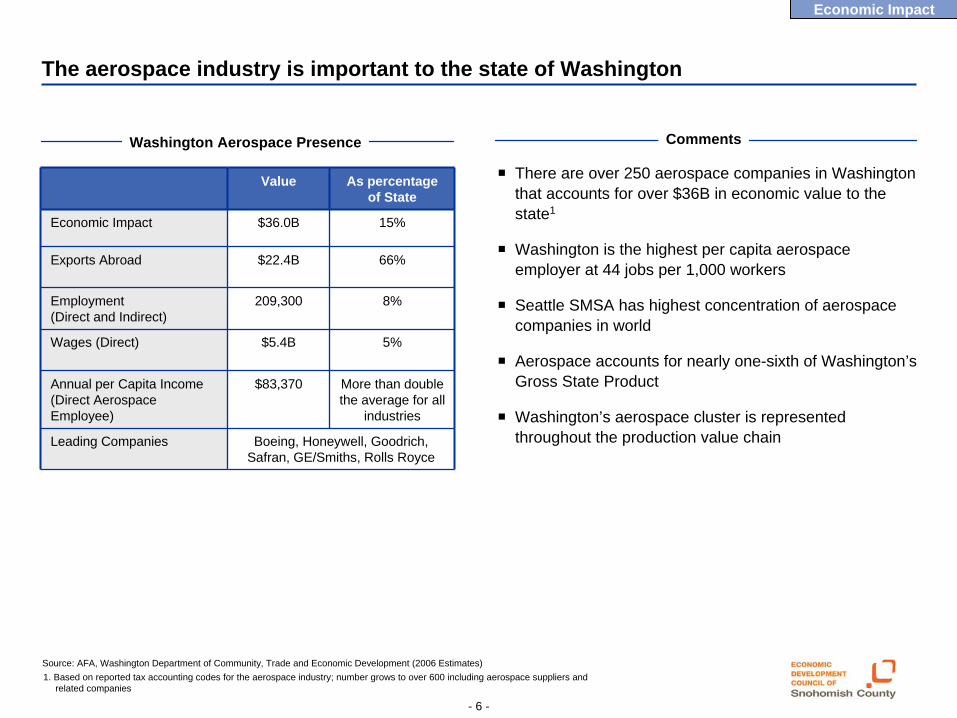
The aerospace industry is important to the state of Washington
Washington Aerospace Presence
Value As percentage of State
Economic Impact $36.0B 15%
Exports Abroad $22.4B 66%
Employment (Direct and Indirect)
209,300 8%
Wages (Direct) $5.4B 5%
Annual per Capita Income (Direct Aerospace Employee)
$83,370 More than double the average for all
industries
Leading Companies Boeing, Honeywell, Goodrich, Safran, GE/Smiths, Rolls Royce
There are over 250 aerospace companies in Washington that accounts for over $36B in economic value to the state1
Washington is the highest per capita aerospace employer at 44 jobs per 1,000 workers
Seattle SMSA has highest concentration of aerospace companies in world
Aerospace accounts for nearly one-sixth of Washington’s Gross State Product
Washington’s aerospace cluster is represented throughout the production value chain
Comments
Source: AFA, Washington Department of Community, Trade and Economic Development (2006 Estimates)
Economic Impact
1. Based on reported tax accounting codes for the aerospace industry; number grows to over 600 including aerospace suppliers and related companies

Market Context

- 8 -
Systemic challenges for the airline industry have created cost pressure on aircraft manufacturers
Since deregulation in 1978, the commercial airline industry has collectively lost over $20B– Roughly 85% of shareholder value has been destroyed since
2000 according to the Amex Airline Index
– Since 2000, airlines have filed for bankruptcy protection 42 times; 24 worldwide carriers have ceased flying or filed for bankruptcy in 2008 alone1
Current commercial airline market conditions present numerous operating challenges for aircraft OEMs– US airlines have rapidly and materially re-sized their business
leading to decreased capacity through retirement of aircraft, flying less and in some cases deferring planned deliveries
– Contraction of financing markets is limiting the ability of aircraft OEMs to finance future production
According to ILFC, the leading leasing company in the aerospace industry, Boeing and Airbus may have to cut production by up to 35 percent by mid-2010 in response to the expected drop in the industry’s ability to take delivery
Implications to Aircraft OEMsHistorical Commercial Airline Industry Performance(Operating Profit in billions)
Annu
al In
dust
ry O
pera
ting
Pro
fit (b
illion
s)
Source: ATA, Credit Suisse, Goldman Sachs, Consultant Analysis
1. As of third quarter 2008
Market Challenges

- 9 -
Since the 90s, aerospace industry employment in the United States has declined relative to industry revenues, due in large part to technology adoption
Comments
Despite rising defense budgets and commercial aircraft orders over the long term, the trend for industry employment shows decline
Aerospace companies have made significant investments in automation, rapid design and prototyping, process improvement and information technology– Select advancements include digital production definition,
digital pre-assembly, collaboration tools, simulation and modeling, and elimination of mock-ups
While several factors have impacted employment, innovation and technological advances have allowed manufacturers to reduce their requirement for production and other workers
US Aerospace Manufacturing IndustryRevenue and Production Workers from 1991-2007
Num
ber o
f Pro
duct
ion
Wor
kers
in In
dust
ry
(Tho
usan
ds)
Industry Revenue ($B
)
CAGR : 2.6%
CAGR : -0.2%
Source: Aerospace Industries Association
Market Challenges

- 10 -
Airbus has steadily increased its market share, surpassing Boeing in total aircraft delivered and in employee productivity
Deliveries
Source: Company Annual Reports; BGC Partners; Airbus – Operating margin calculated as (Profit before finance costs and income tax) / Revenue; Boeing – Operating margin calculated as (Earnings from operations – settlement with US DoJ – Other) / Revenue
Orders
Boeing
Airbus
Airbus
Boeing
Revenue per Employee in Thousands (USD)
Boeing
Airbus
Number of Employees per Aircraft Delivered
Boeing
Airbus
Rev
enue
per
em
ploy
ee (0
00s)
OEM Competitive Analysis

- 11 -
Site Selection Key Takeaways
South Carolina wins Global Aeronautica
334,000 sq-ft facility in Charleston where Global Aeronautica assembles, integrates, tests and applies surface finishes to 60% of Boeing’s 787 fuselages
$116M allocation in performance-based subsidies with potential to increase with additional job creation: South Carolina promised $29M more if total employment reaches 1,400, and an additional $15M in subsidies if Global Aeronautica lands the 787 cockpit work
Vought, whose JV interest in Global Aeronautica was recently bought by Boeing, employs 600 people in its neighboring facility, and is targeting 775 employees by 2011
North Carolina wins Spirit
500,000 sq-ft composite aero-structures plant sits on 307 acres in Kinston, North Carolina for the initial production of Airbus A350-XWB barrel sections
$570M facility and over 1,000 jobs to be created over the next six years
Spirit President/CEO Jeff Turner: “North Carolina met our requirements for financial incentives andthis location offers a strong industrial base, a runway and port access, a growing labor force and an excellent technical training system.”
Kansas wins Spirit
375,000 sq-ft, $260M plant in Wichita for manufacturing/testing of the Cessna Citation Columbus
State subsidies and local incentives totaled $18M, while property tax abatements comprised the remaining $16M, for a total incentive package valued at $34M
The company was also motivated by the close proximity to Cessna, a key customer
The expansion will create an estimated 700 jobs with a projected annual payroll of more than $42M
Virginia wins Rolls Royce
$170M engine plant, set to open this year, to build/test RB262 regional and corporate jet engines
In addition to generous tax breaks, UVA will construct the Commonwealth Center for Advanced Manufacturing with a state subsidy, on land donated by Rolls Royce, near its new plant
Recent aerospace site selection decisions highlight the aggressiveness of competitor states in attracting aerospace manufacturers
Recent Aerospace Incentive Packages

Competitive Assessment Summary

- 13 -
Factors Key Dimensions
Incumbency Aerospace footprint
Labor
Wage rates
Labor management relations
Aerospace skill-base
Unemployment insurance
Workers compensation
Taxes Other taxes (e.g., B&O/Income, Property, Sales)
Learning and Innovation
Training programs
Educated workforce
Innovation environment
InfrastructureTransportation
Utilities and other facility costs
Intangibles
Quality of life
Cost of living
The following framework was used to gauge Washington’s competitiveness
Comparison Framework Comments
The competitive assessment focused on the ability of states to attract and retain aerospace companies
The competitive set included the following:– Everett, Washington
– Moses Lake, Washington (where relevant)
– Charleston, South Carolina
– Global Transpark, North Carolina
– San Antonio, Texas
– Wichita, Kansas
Over 45 primary interviews were conducted with state agencies, suppliers, business leaders, former aerospace executives, labor and industry experts
Comparison Framework

Recommendations

- 15 -
Recommendations Ease of Implementation
Importance to Aerospace
Training/Education
Research and Development
Office of Aerospace and Defense
Cost-Related Recommendations
Unemployment Insurance Tax
Workers Compensation
Other Taxes
Transportation Infrastructure
Utilities
Labor Management Relations
Very High High Medium Low None
Legend
Recommendations
Recommendations
1
2
3
4
5

- 16 -
Training/Education Recommendation
Establish a state sponsored, fully integrated infrastructure for aerospace training
– Institute a state committee for Training and Education with a charter to evaluate and approve training programs across the state
– Conduct a statewide As-Is assessment of training programs related to aerospace
– Designate a central facility where training can be accessed
– Invest in necessary technology to support an integrated network of training programs / monitor completion
Build a formal process for incorporating R&D from in-state universities and research institutions into training programs so as to increase the speed of technology transfer into the workforce
Set a minimum threshold for state-sponsored funding dollars for aerospace training programs to prevent program halts
Use training programs as a forum to grow and manage the existing and potential skilled workforce pipeline
– Develop a system to track all individuals who have completed aerospace training programs within a 10-year period so as to monitor and market training programs to Washington’s skilled workforce for aerospace
– Launch a public relations campaign aimed at high school and college-aged students, highlighting the benefits of careers in aerospace, ultimately fueling the demand for aerospace training programs
– Track the pipeline from Washington military bases (6 bases, including Naval Station Everett) and market aerospace workforce training offerings to those entering the workforce who may have aerospace or aerospace-applicable skills
Build a process infrastructure to grow and manage labor pipeline
– Work with labor to target training programs specifically designed to grow key skills with targeted curriculum
– Develop mentorship and/or training opportunities for ex-aerospace employees to assist with training activities
1
Training/Education Recommendation

- 17 -
Research and Development Recommendation
Establish methods to fund, develop, coordinate and operationalize aerospace-relevant R&D– Establish a steering committee to evaluate research proposals, grant awards, & obtain corporate support
– Partner with Washington Technology Center to advance and strengthen current technology research initiatives and investments
Create university and private industry partnership– Work in conjunction with the industry to connect research , product development efforts and need for funding in key areas such
as composites, optronics, miniaturization, and biofuels with universities
Update training programs to include relevant topics/areas/skills as research gets productized– Organize training/seminars across state and/or business sponsored aerospace training programs
2
Research and Development Recommendation

- 18 -
Key Objectives
Maintain and grow the aerospace presence in WashingtonActively promote the benefits of Washington as world leading destination for aerospace companiesProvide support in key areas of importance for the industry, including but not limited to
– Infrastructure– Technology advancement and innovation– Education and training of a skilled workforce– Labor relations– Taxation and other economic policies
Provide a forum to foster working relationships across business, labor, education, and government stakeholdersHelp identify potential upcoming “footprint” moves by Aerospace companies and actively mobilize around aerospace employment situations as they arise
Organization Structure
Position this organization under Community, Trade and Economic Development (CTED)Appoint the organization’s lead to the Governor’s Office; establish regular dialogue between leader and Governor/advisorsBuild a strong and influential Advisory Board with appropriate business, labor, education, and government representationStaff with several full-time resources with appropriate backgrounds and interest – aerospace experience a plus
Primary Activities
Provide the nucleus for helping to retain aerospace businessHelp identify, attract, and capture new aerospace business / opportunities for the state – be the marketing voiceBe an objective voice for the aerospace industry to the GovernorEstablish forums to facilitate communication among aerospace constituents
Secondary Activities
Monitor the availability of skilled labor by coordinating with training centers to understand workforce pipelineGather and maintain current intelligence on competitor states’ actions to attract and retain aerospace businesses
Dedicated Aerospace Council Recommendation3
Dedicated Aerospace Council Recommendation

- 19 -
Example - Dedicated Aerospace Council in Texas
Texas State Governor
Advisory Council on Physical Fitness
Economic Development and Tourism
Budget, Planning and Policy
Small Business Assistance Aerospace & Aviation Texas Tourism
Profile: Texas Office of Aerospace & Aviation
Key Objectives
Office objectives include: – Analyze and promote space, aviation and defense related research– Analyze the state’s economic position in the aerospace, aviation and defense industry– Develop short and long-term business strategies to promote the retention, development and expansion of the aerospace, aviation
and defense industry in the state– Promote the development of spaceports in Texas
Key Constituents
Day-to-day operations consist of three full-time employees and reports into the Economic Development and Tourism department under the Office of the Governors
A Board of Directors is appointed by the Governor to champion aerospace projects throughout the state and help navigate business, research, political and labor issues and concerns for the aerospace industry– Board of Directors meets with Governor every couple of months– Board of Directors provides insights and assists in managing labor relations when needed
Accomplishments
Since 2003, Office of Aerospace and Aviation has worked with companies to create 3,700 new jobs and more than $900M in investments – Of the $900M in investments, Vought accounts for $600,000 and Boeing accounts for $1.3M– Of the 3,700 new jobs created, Lockheed Martin accounts for 1,562 and Boeing accounts for 400
Texas was the first to have a statewide economic development effort focused on growing the aerospace industry
3
Dedicated Aerospace Council Recommendation

- 20 -
Cost-Related Recommendations
Unemployment Insurance Tax
Align average unemployment insurance tax rate to more competitive levels
Workers Compensation
Align workers compensation benefit levels (and thus cost to employers) with competing states
TaxesConsider targeted tax credits on capital investment and jobs created Consider rebates on B&O taxes created through Industry’s purchases on in-state suppliers
Transportation Infrastructure
Explore infrastructure projects to reduce traffic on major supply routes on Interstate 405 and Interstate 5; dedicate freight lane on Interstate 5 to ease heavy highway traffic to, from, and around EverettImprove public transportation around Paine Field by extending passenger rail system from Everett to Tacoma
Utilities Consider create ways to align utility costs with competitive states to retain and attract Aerospace business
Cost-Related Recommendations
Cost-related Recommendations4

- 21 -
Labor Management Relations5
Labor Management Relations
LaborManagementRelations
Explore opportunities where the state can play a role in improving labor management relations via the Aerospace Council and other means
Labor Management Relations

Competitive Assessment Details

- 23 -
Sources: Bureau of Labor Statistics, ERI 20091. Ranking excludes eight states because data does not meet BLS or state agency disclosure standards
Higher labor costs in the state of Washington hinder the state’s competitiveness in the aerospace industry
StateAverage Aerospace Wages
Ranking1
(Best to Worst)
South Carolina 30th
Kansas 32nd
Texas 38th
North Carolina 39th
Washington 47th
Labor costs in the state of Washington are among the highest in the country within the aerospace industry
City Machinist Mean Annual Salaries (2008)
Kinston, NC $42,500
San Antonio, TX $43,500
Charleston, SC $45,500
Wichita, KS $46,500
Everett, WA $53,500
Machinists are paid higher salaries in Everett than in any of the other cities in the competitive set
While wages in North Carolina and Texas remain high statewide, salaries in Kinston and San Antonio fall below their respective state averages and are the lowest of the cities considered
Machinist wages in Wichita and Charleston are closer to those of Everett
Comments Comments
Machinist Annual Salary Average Aerospace Wages
Wage Rates

- 24 -
The wage gap between Everett and the competitor set is less for direct labor than for indirect
Indirect Wages1
(% of Everett)
Direct Wages1
(% of Everett)
Source: ERI 20091. 2008 mean annual salaries are typical of Aircraft program mix
Direct wages (assembly and machinist jobs) for Everett exceed those of the competitor cities by an average of 13%
The gap for indirect wages (engineering, support and management) is actually greater—approximately 15%
The wage gap is likely to narrow as demand for labor increases in cities with smaller current aerospace labor bases (excluding Wichita and possibly San Antonio); this impact is estimated to be 3-4%
Comments
Wage Rates

- 25 -
Four of the last seven negotiations between Boeing and IAM resulted in a strike– For Boeing and its suppliers there continues to be a
concern around regularity of strikes and impacts to the bottom-line
– Over the last 4 – 5 years, work stoppages have cost Boeing ~$9B in lost revenues and ~$2B in lost profits
In the last decade, only Washington and Kansas experienced major aerospace work stoppages– Two of the four stoppages in Kansas were at Boeing and
the others were at Hawker Beechcraft and Bombardier respectively
“It takes two hands to clap – fault might be on both sides, but the risk remains – why take an unnecessary risk?” – Economic Development Council Member
“There does not appear to be mutual appreciation across all parties, leading to a challenging working environment”– Aerospace Industry Expert
CommentsIndustry Example: Historical Financial Impact of IAM Strikes to Boeing
1. All amounts shown are in 2009 dollars, which were calculated by multiplying dollar value at time of event and aggregate inflation rate since that time
2. Based on consultant calculations using revenues lost per day, estimated revenue recuperation time, applicable interest rates, wages and estimated penalties
3. Work stoppages in the past 10 years involving more than 1,000 employees
The frequency and high costs of work stoppages, fairly or unfairly, reflect negatively on Washington
Year 1989 1995 2005 2008
Length (days) 48 69 28 57
Loss in Boeing revenues1
$4.6B $2.9B $2.3B $6.5B
Loss in Boeing profits1
N/A $872M2 $570M $1.3B
State WA NC SC KS TX
Number of major work stoppages in last decade (aerospace only)
3 0 0 4 0
Total work stoppage duration in days (aerospace only)
124 0 0 114 0
Recent Aerospace Work Stoppages3
Source: Aerospace analysts estimates, Boeing annual reports, Boeing executive conference calls and Consultant research, Bureau of Labor Statistics
Labor Management Relations

- 26 -
Washington offers the greatest number of employees in aerospace manufacturing
Washington has a larger existing workforce for aerospace manufacturers than other states– Washington leads the competitive set by over 30,000
employees in aerospace manufacturing
– Washington has the second highest share of total aerospace employment in the nation at 12.0% (behind California)
Washington’s engineering population is more focused on aerospace work than engineers in competitor states– There are more aerospace engineers employed in
Washington than any other type of engineer, whereas other states have more general mechanical engineers than any other type
– Aerospace engineers employed in Washington -10,590; Texas - 8,230; Kansas – 2,560; North Carolina – 480
Comments
1. Private sector, non-government, excludes workers in research and development establishments2. There has been significant growth in the aerospace industry in South Carolina between 2007 and the present. As such, this data may
not be representative of the aerospace footprint currently in the state.
Source: Bureau of Labor Statistics, California Research Bureau
WA
KS
TX
NCSC
Employees in Aerospace Productsand Parts Manufacturing1,2
Perc
ent o
f Wor
kfor
ce
Aerospace Skills-base

- 27 -
The strong existing employee base allows Washington aerospace employers to set more stringent hiring requirements
WA NC (example)
KS (example)
Education1 HS, AA HS, AA HS, AA
ExperienceRequired
HS: 3-6 yrs2
AA: 1-3 yrs HS: 4-6 yrsAA: 2-4 yrs
HS: 2+ yrsAA: 1+ yr
Certification/Training
Boeing requires 87 hours of post-hire
training
Statewide integrated
customized aerospace training
A&P3, customized aerospace training
Tech
nici
ans/
M
achi
nist
s
Source: Aerospace companies job openings, primary research and Consultant analysis1. VS: Vocational School, HS: High School, AA: Associate’s Degree, BS: Bachelor’s Degree, MS: Master’s Degree, PHD: Doctorate Degree2. Minimum years of experiences required for a given education level3. Airframe & Power plant license, issued by FAA and accredited institutions of higher learning4. Engineering positions include aerospace, mechanical, electrical, metallurgical and other aerospace related engineering disciplines
Washington entry level technician/machinist positions require 3-6 years of experience with high school education, while Kansas only requires 2 years; North Carolina is similar to Washington, albeit on a much smaller workforce base
Washington and Texas engineering positions require similar education and experience, but South Carolina’s engineering positions require significantly less
Management positions in Washington require many years of industry and management experience, while management positions in North Carolina and especially South Carolina’s require fewer years
CommentsRequirements for Entry Level Aerospace Positions
WA TX (example)
SC (example)
ExperienceRequired
BS: 2-5 yrsMS: 3-5 yrsPhD: N/A
BS: 2-9 yrsMS: 3-7 yrsPhD: 4+ yrs
BS: 2-6 yrs
Certification None A&P None
Engi
neer
s4
WA NC (example)
SC (example)
Education BS, MS, PHD BS, MS BS, MS
ExperienceRequired
BS: 12-15 yrsMS: 12+ yrsPhD: 10+ yrs
BS: 5-11 yrsMS: 9-11 yrs
BS: 6+ yrsMS: 4+ yrs
Mgmt ExperienceRequired 5+ yrs 0 0Su
perv
isor
s/
Man
ager
s
Aerospace Skills-base

- 28 -
Washington UI rates are high, but the state’s trust fund balance provides flexibility
Washington’s average UI rates are the highest among the competitive set
Amongst the states analyzed, Washington has the second highest number of months of benefit left and as well as the highest trust fund balance– Higher relative salaries in WA are contributing to the
AWBA salaries being significantly higher than other states
While states such as North Carolina and South Carolina currently have lower UI taxes, they were forced to borrow federal funds and face potential increases in UI tax rates for all instate employers– Non-repayment of federal funds within 34 months results
in an incremental reduction of the federal government’s 5.4% tax credit per year by .30%
A key consideration for aerospace companies is managing the volatility around the UI tax calculations, a predictable tax rate is preferred for business planning purposes
Comments
State Average tax rate on
total wages
Average weekly benefit amount (AWBA)
AWBA as % of average
weekly wage
Recipiency rates2
Trust Fund Balance and number of months
of benefits left
WA 1.02% (6th)
$355 (5th)
40.7% (13th)
40.0% (27th)
$4.0B (1st)18.72 (2nd)
NC 0.80% (12th)
$287 (28th)
38.4% (25th)
46.0% (17th)
$190.7M (37th)1.32 (42nd)
SC 0.50% (31st)
$240 (45th)
35.2% (33rd)
44.0% (22nd)
<0 (50th)3
0 (50th)
TX 0.31% (47th)
$303 (21st)
35.0% (34th)
25.0% (47th)
$1.3B (6th)3.72 (34th)
KS 0.48% (33rd)
$316 (11th)
44.3% (5th)
37.0% (28th)
$566.4M (20th)9.96 (17th)
Source: 2008 4th Qtr DOL Unemployment Data Report, WA Employment Security Division, Consultant Analysis1. All data and percentages calculated for 20082. % of unemployed actually receiving benefits3. South Carolina borrowed $122 Million from the federal unemployment fund
UI Statistics and National Rankings1
Unemployment Insurance

- 29 -
Washington’s high benefits and high claim rates result in high Workers’ Compensation costs for employers– Washington has the third highest benefits per $100
covered wages in the country
– Claim rates in Washington, especially for incidents requiring days away from work and cash benefits, are much higher than other states in the competitive set
– Unlike South Carolina, Texas and Kansas, Washington does not allow lump sum settlements between employers and injured workers, increasing the duration and potentially the total amount of benefits paid by employers
For state funded employers, even though their employees pay ~25% of the costs, the remaining 75% still make Washington the second most expensive in the competitive set, behind South Carolina
For self-insured employers who cover all of the benefit payouts, the costs in Washington are the highest in the competitive set
CommentsWorkers’ Compensation ComparisonAcross States
1. 2006 data 2. 2009 data3. Washington, Texas and Kansas data from aerospace manufacturing, while North and South Carolina data
estimated using manufacturing industry 4. Medical benefits liability cannot be released
Employers in Washington pay for one of the most expensive Workers’ Compensation systems in the country
State Benefits per $100 Covered Wages1
Max Daily
Benefit2
Max Daily Benefit as %
of State Average Daily
Wage
Claim Rates Compromise and Release
Days Away from Work
Claim Rate1,3
Non-Days Away from Work Claim
Rate1,3
WA $1.63 $206 120% 1.6% 4.0% No
NC $0.96 $172 110% 0.9% 3.3% Yes
SC $1.33 $136 100% 1.0% 2.5% Yes
TX $0.44 $150 100% 1.2% 3.9% Yes4
KS $0.87 $106 75% 0.7% 3.7% Yes
Source: National Academy of Social Insurance, Workers’ Compensation Divisions of WA, NC, SC, TX and KS, Bureau of Labor Statistics, Work World
Workers Compensation

- 30 -
Washington’s B&O tax rate on aerospace is comparable to the states considered
Overall business tax climate has improved across all competitive states, in part because they are aggressively providing tax incentives– Competitive states are aggressively providing similar
incentives to Boeing’s 2003 B&O reduction to lure companies to relocate
– For example, Kansas provides one-time corporate income tax credits of 10% on capital investment and up to $2,500 per job created
Most states have income taxes rather than the B&O that Washington has; the B&O tax disproportionately impacts businesses with low operating margins or during down-cycle years with little or negative profit
Washington also taxes a component multiple times as it passes down the supply chain, while most other competitive states only tax on value added, putting Washington at a disadvantage when elements of the supply chain are also in the state
1. Baseline of aerospace industry taxes in each site, does not include additional incentives and concessions2. City of Everett charges a 0.1% B&O tax rate on gross revenues, 0.025% on revenues over $6B3. States may impose other business taxes, such as the franchise tax in North Carolina and South Carolina
Sources: Grant County, South Carolina Department of Commerce, Greater Wichita Economic Development Coalition, WA DOR, NC DOR, SC DOR, Office of TX Comptroller, www.taxfoundation.org, CRDA
Site Location Corporate Tax Rate
Everett, WA 0.39%2 on gross revenues
Moses Lake, WA 0.29% on gross revenues
Kinston, NC3 6.90% on operating income
Charleston, SC3 5.00% on operating income
San Antonio, TX 1.00% on the lesser of gross income or 70% of gross revenues
Wichita, KS 7.10% on operating income
Aerospace corporate tax rate across sites1 Comments
Other Taxes

- 31 -
Washington has the lowest property tax rates, but sales tax rates are at the high end of the range
Washington offers Boeing the lowest property tax rates, however other states offer tax incentives and exemptions to fill the gap– Boeing is currently paying 0.87% property tax on its plants
in Everett - lowest among sites analyzed
– However, other states are aggressive in providing incentives and discounts to lower their effective tax rate. For example, Wichita does not levy personal property taxes and will offer up to 40 years of tax exemptions on real properties for relocating companies
Across all states considered, machines & equipment and components are generally tax exempt for aerospace companies
Taxes on construction and supplies are relatively similar and range from 7-9%; Washington falls toward the higher end of the range
1. Baseline of aerospace industry taxes in each site, does not include additional incentives and concessions2. Property tax rates levied on 100% of fair market value3. Real properties include land and buildings, personal properties include machines & equipment
Comments
Sources: Snohomish County Assessor, Grant County, South Carolina Department of Commerce, Bexar County Assessor, Greater Wichita Economic Development Coalition, WA DOR, NC DOR, SC DOR, Office of TX Comptroller, KS DOR, www.taxadmin.org, www.taxfoundation.org,, KS Treasury, CRDA
Site Location Real Property3 Personal Property3
Everett, WA 0.87% 0.87%
Moses Lake,WA
1.27 - 1.28% 1.27 - 1.28%
Kinston, NC 1.50% 1.50%
Charleston, SC 2.69% 2.69%
San Antonio, TX 2.50- 3.00% 2.50 – 3.00%
Wichita, KS 2.95% 0%
Aerospace property tax rates across sites1,2
Site Location Construction Machines & Equipment
Supplies Components
Everett, WA 8.6% 0% 8.6% 0%
Moses Lake, WA
7.9% 0% 7.9% 0%
Kinston, NC 6.8% 1% 6.8% 0%
Charleston, SC
7.5% 0% 7.5% 0%
San Antonio, TX
8.1% 1.9% 8.1% 1.9%
Wichita, KS 0% 0% 7.1% 0%
Aerospace sales tax rates across sites1
Other Taxes

- 32 -
Washington has opportunities to improve aerospace training offerings, effectively increasing the pipeline of aerospace-skilled labor in the state
Across the competitive set, Kansas and North Carolina provide strong examples of well-funded training offerings that incorporate current technologies and are delivered in an integrated and organized manner
– Scale: Kansas’ National Institute for Aviation Research provides aerospace workforce training and proprietary research for aerospace companies, leveraging15 advanced labs. The state is also awaiting the opening of the National Center for Aviation Training (NCAT), a 207,000 sq-ft research and training facility that will further expand offerings
– Integration: North Carolina’s Advanced Machining Center develops curriculum for a state-wide consortium of 14 schools that provide aerospace workforce training. There is also coordination among the 58 community colleges in NC, the 3rd largest community college system in the U.S.
– Inclusion of R&D: There is little formalized inclusion of R&D in training programs in Washington. There is also little collaboration between South Carolina’s workforce training organization, ReadySC, and universities in the state. By contrast, North Carolina training facilities use 3D modeling to enhance training on aircraft engines/fuselages and pay attractive wages plus expenses to attract top instructors/researchers
– Funding: For most states of interest, community colleges (including workforce training programs) are primarily funded at the state level, but local funding (i.e. county-level) has proven to be a powerful source, as seen in Kansas’ NCAT, a $50M facility
Training Programs

- 33 -
Washington has a more educated workforce than any of the competitor states
Washington has the highest percentage of bachelor’s degrees among its adult population as compared to any other state in the competitive set– 47% of adults in Seattle hold bachelor’s degrees, the
strongest proportion of college-educated residents in any large city
Across top universities in U.S. states, the University of Washington achieves the best retention rate, ranked #1 in the nation, with 74% of graduates remaining in-state
Among the competitive states, Washington also has the most engineers as a share of total workforce (1.6%), while North and South Carolina have the least
Proximity to leading edge technology companies is a competitive advantage for Washington – ability to leverage technology platforms into aerospace design and manufacturing is key differentiator
Comments
Source: U.S. Bureau of the Census (2003), Bureau of Labor Statistics; National Science Foundation
Engineers as a Share of the Workforce (2006)
Per
cent
of W
orkf
orce
Percent of People Over 25 with Bachelor’s Degree
Per
cent
of P
eopl
e
Educated Workforce

- 34 -
States in the competitive set display research strengths in different areas, but nearly all states make strong contributions to the R&D for new technologies
Washington is a leader in R&D, demonstrated by the University of Washington ranking as the #2 recipient of federal research grants among all private and public universities in the country; While Washington has nationally leading R&D programs, the competitor states have developed larger, more extensive funding and grant programs to stimulate research efforts
Overall, Washington and the other states have exhibited a strong commitment to research and development of new technologies:– Composites (including advanced materials): While Washington’s FAA-sponsored Advanced Materials in Transport
Aircraft Structures consortium is a leader in composite research, Kansas also has impressive efforts in composites R&D at the National Institute for Aviation Research (NIAR)
– Miniaturization (including nanotech): UW’s Center for Nanotechnology is ranked 7th among micro- and nanotech institutions, while Texas ranks 5th at the state level for their diversity of projects and state and privately funded grants
– Optronics (including photonics): The Carolinas Photonics Consortium includes five universities across North & South Carolina that comprise the largest concentration of photonics-based resources in the U.S
– Biofuels: The University of Texas System ranks No. 1 for biotechnology patents in the world while Kansas is ranked 4th & 5th for state bioscience investments & research funding, respectively
Innovation Environment

- 35 -
Although Everett’s transportation infrastructure is robust, San Antonio has stronger highway and railway offerings
Attribute Everett, Washington
Moses Lake, Washington
Global Transpark, North Carolina
Charleston, South Carolina
San Antonio, Texas
Wichita, Kansas
Highways
Travel to Everett is adversely affected by heavy traffic flow on I-405, especially around the I-405/I-67 interchangeTruck traffic from Puget Sound ports to grow to 1.7M trucks on I-5 by 2020
Average worker commute for Moses Lake is 16 minutes, 26 min is national average Commuter rail stops 1 mile from Boeing facility
Kinston is 50 miles from Raleigh, the closest city with major highway connectionsExtensive bus routesGTP has easy access to major trucking routes and a 4-lane expressway connects GTP with 2 state highways
Traffic fatalities on state roads are 50% above national average, and fatalities on non-interstate roads are highest in nation
Public surveys and transportation-related agencies regard Texas as having the best highways in US
As of 2004, Kansas had no rural or interstate highways in poor condition (this is an improvement)State transportation program is expected to lose over $300M over the next three years
Railways
Rail traffic expected to exceed truck traffic in WA by 2020Passenger rail project extends up to Lynwood & does not include Paine Field
No rail access to Grant Country Airport (Approval to extend expected in 1 month)Improved rail access with $18M investment in Rail Bridge Project
Rail system: 3,600 miles and 20 carriersConsidering high speed rail2 rail freight carriers 4-5 miles from GTP
Availability of railroads does not appear to be extensive throughout South Carolina
571 miles throughout San Antonio carry 6,500 railcars/day, 110 freight tons/yrNo passenger rail offerings at this time
Rather extensive rail freight networkKansas teamed with Amtrak to consider adding passenger rail service
Seaways
Closest port to Far East of any US city 11 deep draft ports, 7 in Puget Sound
(Seattle) Seaport Access Project: I-90Route 18 access to Port of Tacoma
Kinston is 50 miles from closest seaport (which has 2 modern deep-water ports)
4th busiest port in USIndustry-leading productivity, ample capacity to grow
Nearest seaport: 140 miles (Corpus Christi) Among top 25 US ports in tonnage/yr
There are 372 miles between Wichita and the closest seaport (St. Louis)
Airways
10,000 ft runway at Boeing field, Seattle12,217 ft at Paine field (Snohomish County)
Grant County Int’l Airport has 13,500 ft runway and is an alternate landing for NASA space shuttle
Global Transparkaccommodates the world’s largest cargo jets, with an 11,500 ft runway
11,000 ft runway at the GSP Airport (upstate South Carolina)
11,000 ft runway at the Port of San AntonioSA Airport longest runway is 8,500 ft
Poor air service has deterred businessesLongest runway is 15,500 ft (Municipal Airport )
Transportation

- 36 -
Facility-related costs are higher in Everett than other locales
Average construction costs in Everett are much higher than the national average of $515.53 per sq. ft. while Texas, North and South Carolina, and Kansas remain below average
Moses Lake, San Antonio, and Wichita have relatively low electricity costs per kilowatt-hour for industrial facilities
Water rates vary greatly based on facility size and usage, but Moses Lake and Wichita have low commercial/ industrial rates
State Construction Costs($/sq. ft.)
Electricity Rates ($/kWh)
Water Rates($/1,000 gallons)
Everett, WA $592.86 $0.057 $2.451
Moses Lake, WA $536.15 $0.029 $1.00
San Antonio, TX $448.51 $0.032 $1.98
Charleston, SC $453.67 $0.051 $1.50
Global Transpark, NC $448.51 $0.060 $1.50
Wichita, KS $469.13 $0.037 $1.17
Comments
Facility Costs
Source: Marcus & Millichap, Consultant analysis, and external discussions1. Based on average rates, does not include discounts (actual aerospace rates in Everett are reported to be approximately $1.34 / 1,000
gallons, including filtration charge and assumed usage of over 15,000 cubic feet)

- 37 -
Washington exceeds the competitive states in most quality of life measures
Forbes magazine ranks the state of Washington 7th in a national Best State to Live poll primarily due to its high Well-Being Index (7th) and Work Quality Index (9th)
Washington ranks 10th in the United Health Foundation’s Health Ranking in 2008 due to the low prevalence of smoking and a low percentage of children in poverty. North Carolina ranks low at 36th because of the high prevalence of smoking and obesity and South Carolina is 48th with a low high school graduation rate and a high violent crime rate
Among the competitive states, Washington has the lowest poverty rate as a percent of population
Washington has a high positive net migration rate as more people are moving into the state than are leaving because of the attractive cultural and economic factors and opportunities
Quality of Life Statistics
Comments
State Forbes’ Best State to Live Ranking, 2009
America’s Health Rankings, 2008
State Crime Rate Rankings, 2009
Percent of Persons in
Poverty, 2007
Net Migration Rate, 2000-20061
Washington 7th 10th 30th 10.2% 20.3
Kansas 22nd 22nd 29th 11.7% -23.7
North Carolina 34th 36th 33rd 15.5% 39.2
South Carolina 26th 48th 48th 14.1% 38.7
Texas 21st 46th 36th 16.1% 19.2
Source: United Health Foundation, U.S. Bureau of the Census, Forbes, CQ Press, PEW Center on the States1. Computed by subtracting the number of out-migrants from the number of in-migrants, expressed as a rate per 1,000 people in the
population group
Quality of Life

- 38 -
Although Washington offers a 0% personal income tax rate and the lowest home owner’s insurance cost, overall, cost of living factors are highest in Washington
Attribute Everett, WA Moses Lake, WA Kinston, NC San Antonio,
TXCharleston,
SC Wichita, KS
Personal income tax rate 0 0 6% - 7.75% 0 2.5% - 7% 3.5% - 6.45%
Average home prices $357,200 $233,910 $223,400 $152,800 $206,700 $121,800
University tuition1 $6,218/year $6,218/year $3,860/year $4,000/year $7,806/year $6,878/year
Average commute time2 28 minutes 25 minutes 23 minutes 23 minutes 22 minutes 17 minutes
Average fuel prices3 $2.17/gallon $2.17/gallon $1.90/gallon $1.81/gallon $1.80/gallon $1.88/gallon
Average home owners insurance premium4
(reflects natural disaster risk)$603/year $603/year $649/year $1,409/year5 $851/year $866/year
1. In-state tuition only for state universities (Washington State Univ, NC State Univ, Univ of Texas at San Antonio, SC State Univ, Wichita State Univ.)2. Rounded to the nearest minute, by county. All appropriate counties were used for each city, with the exception of Kinston, NC. Lenior County
commute time was not available so closest county is used here (Wake County)3. By state, for regular gas4. Annual premium, by state, reflective of natural disaster risk5. Texas is #1 in the country for highest average home owner’s insurance premium*All numbers reflect 2008 data
Cost of Living