Aerosols: Climate & Air Quality · Aerosols: Climate & Air Quality. ESRL Theme Presentation 4...
13
Introduction - Christoph Senff Aerosol Sources, Sinks, Distributions, and Processes - Chuck Brock ESRL Research on Aerosol Direct Radiative Forcing of Climate - John Ogren Aerosol - Cloud Interactions - Graham Feingold Coupled Modeling Systems that allow for Aerosol/AirQuality/Weather/Climate interactions - Georg Grell Wrap-up & Outlook - John Ogren Discussion Aerosols: Climate & Air Quality ESRL Theme Presentation 4 September 2008
Transcript of Aerosols: Climate & Air Quality · Aerosols: Climate & Air Quality. ESRL Theme Presentation 4...

Introduction -
Christoph Senff
Aerosol Sources, Sinks, Distributions, and Processes -
Chuck Brock
ESRL Research on Aerosol Direct Radiative
Forcing of Climate -
John Ogren
Aerosol -
Cloud Interactions -
Graham Feingold
Coupled Modeling Systems that allow for Aerosol/AirQuality/Weather/Climate interactions -
Georg Grell
Wrap-up & Outlook -
John Ogren
Discussion
Aerosols: Climate & Air Quality
ESRL Theme Presentation 4 September 2008

Aerosols come in all shapes and sizes
0.01 0.1 1 10 Particle Diameter , µm ~ 100 μmA few nm

Mechanical Processes
Mineral dustSea saltVolcanic emissionsPlant particles
Chemical Processes
Combustion & conversion from gases:
SulfateNitrateAmmoniumOrganicsBlack carbon
Aerosol Size Distribution
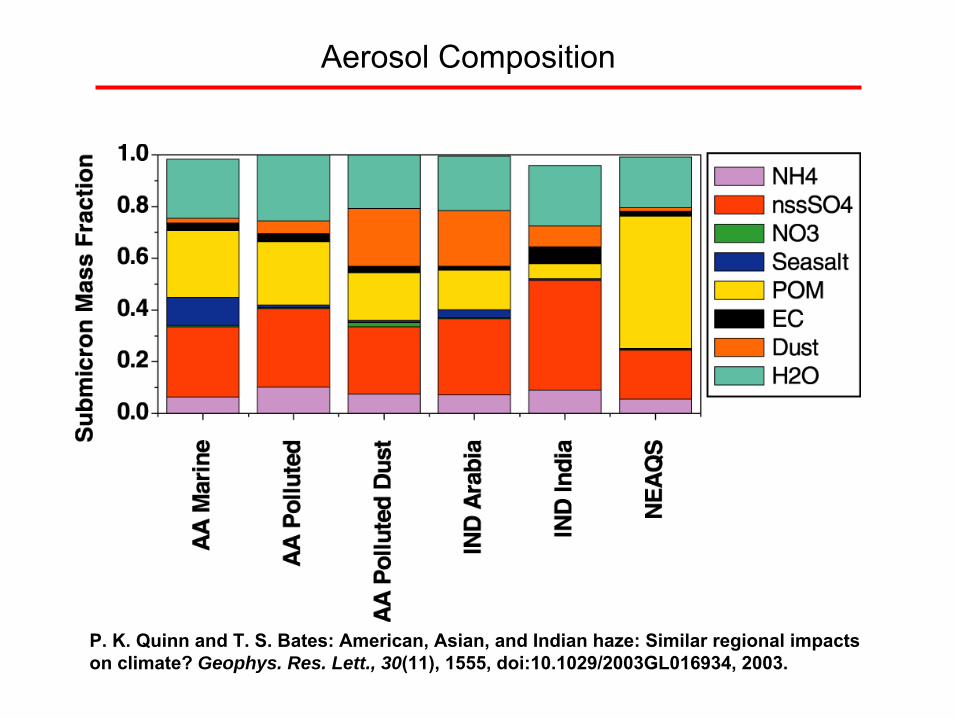
Aerosol Composition
P. K. Quinn and T. S. Bates: American, Asian, and Indian haze: Similar regional impacts on climate? Geophys. Res. Lett., 30(11), 1555, doi:10.1029/2003GL016934, 2003.

Aerosols & Air Quality → Health Effects
After: C.-Y. Wu, Y.-M. Hsu, University of Florida
From: THE EPA’S PARTICULATE MATTER (PM) HEALTH EFFECTS RESEARCH CENTERS PROGRAM, 2002.
> 10μm
2.5 …10μm
< 2.5μm< 0.1μm
Exposure response between PM2.5 and daily deaths

EPA National Ambient Air Quality Standard (NAAQS) for Particulate Matter (PM):
Standard Averaging TimePM10 150 µg/m3 24-hour
PM2.5 15 µg/m3
35 µg/m3
Annual24-hour
Aerosols & Air Quality

(1997 24-hour standard: 65 µg/m3)
Areas attaining or not attaining the 2006 24-hour PM2.5 standard (35 µg/m3) will be designated in December 2008.

PM10 annual average, μg/m3
(2004)City, Country
169 Cairo, Egypt150 Delhi, India128 Kolkata, India125 Tianjin, China123 Chongqing, China109 Kanpur, India109 Lucknow, India104 Jakarta, Indonesia101 Shenyang, China19 Boulder, CO20 WHO guideline
Most Polluted World Cities by PM
from: World Bank study by K. D. Pandey
et al., 2006: “Ambient Particulate Matter Concentrationin Residential and Pollution Hotspot Areas of World Cities: New Estimates Based on the Global Model of Ambient Particulates (GMAPS)”

PM2.5 = 0.5 μg/m3
PM10 = 1.7 μ
g/m3PM2.5 = 36.6 μg/m3
PM10 = 76.6 μg/m3
Rocky Mountain National Park
IMPROVE (Interagency Monitoring of Protected Visual Environments) Program
Long term monitoring program (established in 1985) to track visibility changes and determine causes of visibility impairment in National Parks and Wilderness Areas (Class I areas)
Aerosols & Air Quality →
Visibility

Aerosols & Climate
from: Dr. S. N. Tripathi, Department of Civil Engineering Indian Institute of Technology Kanpur
Direct Effect:Perturbation of the radiation budget via scattering and absorption of incoming solar and outgoing infrared radiation

Indirect Effects:Modification of the microphysical and hence the radiative
properties, lifetime, amount, and morphology of clouds.
Aerosols & Climate
Cloud albedo
effect Cloud lifetime effect Semi-direct effect
Clean cloud Polluted cloud Absorbing aerosol
Surface
Top of atmosphere

From: IPCC’s
Fourth Assessment Report, Working Group I, Technical Summary
Radiative
Forcing (RF)Change in the radiation budget at the tropopause
relative to a pre-
industrial background at 1750, averaged globally and annually

Introduction -
Christoph Senff
Aerosol Sources, Sinks, Distributions, and Processes -
Chuck Brock
ESRL Research on Aerosol Direct Radiative
Forcing of Climate -
John Ogren
Aerosol -
Cloud Interactions -
Graham Feingold
Coupled Modeling Systems that allow for Aerosol/AirQuality/Weather/Climate interactions -
Georg Grell
Wrap-up & Outlook -
John Ogren
Discussion
Aerosols: Climate & Air Quality
ESRL Theme Presentation 4 September 2008