BEARD RESEARCH, INC. and ) CB RESEARCH & DEVELOPMENT, INC ...

Aerodyne Research, Inc.Utilization of Tunable Infrared Laser Sensors for
Cross-Road Mobile Source Emissions Characterization and Qualifications
Prepared by:M.S. Zahniser, D.D. Nelson, J.B. McManus and C.E. Kolb
Aerodyne Research, Inc.45 Manning Rd.
Billerica, MA 01821
Prepared for:NARSTO Emission Inventory Workshop on
Innovative Methods for Emission Inventory Development and EvaluationUniversity of Texas
Austin, TX
October 15, 2003ARI-VGR-116

Outline
• Motivation• Traditional Automotive Remote Sensing• TILDAS Remote Sensing• NO and N2O Emissions from Automobiles• NO Emissions from Heavy Duty Diesel
Trucks• Quantum Cascade Implementation• Summary

Traditional Remote Sensing
Retro-Reflector
RemoteSensor
ExhaustPlume
VideoCamera
Data Acquisitionand Display
Advantages:• Thousands of cars per day• Split second inspection• Real world emissions• Faster & cheaper
Limitations:•Species coverage is limited -works best for CO monitoring•Range is severely limited •Site selection constrained

0%
20%
40%
60%
80%
100%
120%
4.459 4.458 4.457 4.456 5.256 5.254 5.253 5.252
Wavelength (microns)
Rel
ativ
e S
ign
al S
tren
gth
LASER 1 ON LASER 2 ON
CO2NO
N2O
LAS
ER
S O
FF
TILDAS Remote Sensing
∆II
NL))0
= −exp( ( )σ υ
AbsorptionCross-Section
Frequency
MolecularDensity
Path Length

NO = 0.0104 * CO2
N2O = 0.0018 * CO2
0
5
10
15
20
25
30
35
40
45
50
0 1000 2000 3000 4000 5000
CO2 Excess Column Density (ppm-m)
NO
an
d N
2O E
xces
s C
olu
mn
Den
sity
(p
pm
-m)
TILDAS Data Processing
ppm NO = * CO2NOCO2
stoichiometric0
500
1000
1500
2000
2500
3000
3500
4000
4500
5000
-34 0 34 67 101 134 168 202 235
Time After Car Passed (ms)
CO
2 C
olu
mn
Den
sity
(pp
m-m
)
0
10
20
30
40
50
NO
an
d N
2O C
olu
mn
Den
sity
(pp
m-m
)
CO2NON2O

High Sensitivity
Precision ~ 5 ppm of the exhaust-10
0
10
20
30
40
50
60
70
80
90
100
-5 0 5 10 15 20 25 30 35 40 45 50 55
Time After First Measurement (minutes)
NO
Em
issi
on
of U
LE
V (p
pm
)
ENGINE OFF
ULEV NOx Emission Standard
NOx Result for This Vehicle on
FTP Test
2 PASSES NOT DETECTED
0
500
1000
1500
2000
2500
3000
3500
40001
NO
Em
issi
on L
evel
s (p
pm) Maximum
Level Observed
Average US Car
ULEVStandard

NO vs. Manufacturer
0
100
200
300
400
500
600
700
83 84 85 86 87 88 89 90 91 92 93 94 95 96
Model Year
Ave
rage
NO
Em
issi
on (p
pm)
ALL VEHICLES (1141)
Manufacturer 1 (418)
Manufacturer 2 (142)

TDL Setup / EPA Parking Lot
RetroReflector
TILDASInstrument
EPA’sInstrumented
Truck2nd TurningMirror
1st TurningMirror
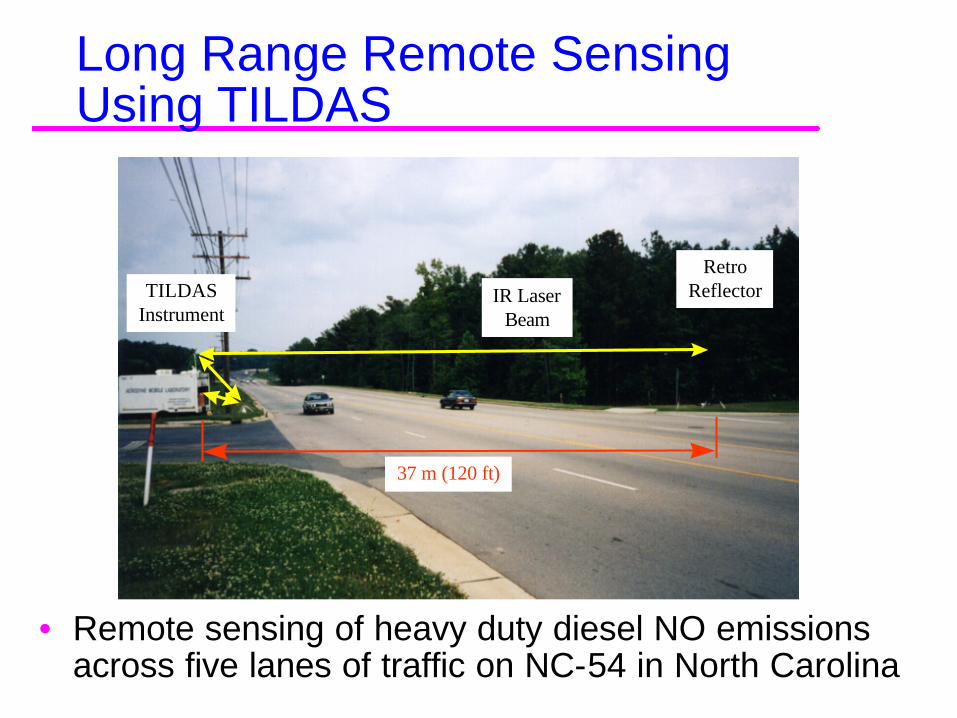
Long Range Remote Sensing Using TILDAS
• Remote sensing of heavy duty diesel NO emissions across five lanes of traffic on NC-54 in North Carolina
RetroReflectorTILDAS
InstrumentIR Laser
Beam
37 m (120 ft)

NO and CO2 Plumes from Heavy Duty Diesel on NC-54
• NO and CO2 plumes measured at 32 Hz on Route 54 in NC
• Optical pathlengthof approximately 280 ft
• NO emission index is NO/CO2 = 0.0101(5)
NO and CO2 Plumes
-10.0
0.0
10.0
20.030.0
40.0
50.0
60.0
0 0.5 1 1.5 2
Time (s)
NO
(p
pm
-m)
NO
CO2
NO vs. CO2 Column Density
010
2030
4050
60
0 1000 2000 3000 4000 5000 6000
CO2 (ppm-m)
NO
(p
pm
-m)

NOx Emission DistributionsLight-Duty Gasoline Heavy-Duty Diesel
0%
10%
20%
30%
40%
50%
60%
70%
80%
0 1000 2000 3000
NO Emission (ppm)
Per
cen
tag
e o
f Rem
ote
Sen
sin
g M
easu
rem
ents
Remote Sensing
10% Vehicles = 50% Emissions
0%
10%
20%
30%
40%
50%
60%
70%
80%
0 1000 2000 3000
NO Emission (ppm corrected for excess air)
Per
cen
t or
Rem
ote
Sen
sin
g M
easu
rem
ents
Remote Sensing
10% Vehicles = 17% Emissions

QUAD-QC Open Path TILDAS
• Four QC Lasers with time-multiplexing
• NO, NO2, N2O, NH3,CO
• CO2 reference• Cross-road retro-
reflector• Range 100 meters

Automobile Exhaust Plume Spectra
LASER 12240 cm-1
LASER 2967 cm-1
LASER 31906 cm-1
CO2
N2ONH3
NO

Automobile Exhaust Plume
8
6
4
2
0
CO
2, %
0.80.60.40.20.0TIME (s)
40
30
20
10
0
N2O
, ppm
60
40
20
0
NH
3, p
pm300
250
200
150
100
50
0
NO
, ppm
1994 Mitsubishi mmol/mol CO2
CO2
N2O 0.46 NH3 0.83 NO 3.4
start of plume

Catalytic Converter Warm-up
0
200
400
600
800
NO
, ppm
0 2 4 6 8 10 12CO2, %
cold start ∆t = 93 s ∆t = 133 s ∆t = 172 s ∆t = 208 s ∆t = 244 s ∆t = 280 s
0
20
40
60
80
NH
3, p
pm
0 2 4 6 8 10 12CO2, %
cold start ∆t = 93 s ∆t = 133 s ∆t = 172 s ∆t = 208 s ∆t = 244 s ∆t = 280 s
NO NH3
NO emissions decrease
NH3 emissions increase

Emission Ratios to CO2
Multiple passes with same automobile
1994 Mitsubishi “Expo”160,000 km odometer
NH3N2ONO

Summary
Tunable IR Laser Remote Sensing Advantages• Increased sensitivity (10 – 1000 over NDIR) • Increased specificity (e.g. NH3, N2O, NO2,
individual VOCs)• Self calibrating (no cal gases required)• Increased range (up to 100 meters)• Easier adjustment for exhaust emission heights
(for HDD measurements)• Automated/Remote instrument operation

Acknowledgments• Aerodyne Colleagues
– David Nelson– Mark Zahniser– Barry McManus– Joda Wormhoudt– Patrick Kirwin
• MIT Collaborators– Jose Jimenez– Greg McCrae
• ADL Collaborator– Stephan Schmidt
• EMDOT Collaborator– Mike Koplow
• WPI Collaborator– Babara WyslouzilFunding Sources
• NSF, NASA and DOE SBIR Programs• NASA HSCT Program• South Coast Air Quality Management District• EPA-ORD• Environmental Systems Products