Aerodynamic Design and Cross-country Flight Performance ...
10
TECHNICAL SOARING 79 VOLUME 30, NO. 3 – July 2006 Aerodynamic Design and Cross-country Flight Performance Analysis of Diana-2 Sailplane Krzysztof Kubrynski Warsaw University of Technology, Institute of Aeronautics and Applied Mechanics Warsaw, Poland [email protected] Presented at the XXVIII OSTIV Congress, Eskilstuna, Sweden, 8-15 June 2006 Abstract The aerodynamic design philosophy and computational analysis of cross-country flight performance of Diana-2 sailplane in different thermal conditions are presented. To address the second issue, a continuous spectrum of thermal models is created. For specified thermal model (thermal strength vs distance from core center, interthermal descent, length and strength of cloud streets), the sailplane mass and aerodynamic characteristics optimum flight parameters (circling speed and bank angle, interthermal glide speed and speed in cloud streets) is found applying optimization technique. Finally expected cross-country speed for different thermal conditions and water ballast weight, as well the optimum water ballast amount, can be predicted. The main goal of the analysis is the optimization of sailplane parameters and helping pilots make decisions regarding optimum balasting technique in flight. An estimation of the influence of bugs and rain on the sailplane aerodynamic characteristics is also presented. Introduction The SZD-56 Diana sailplane was designed in 1989. Its first flight was in 1990. SZD's chief engineer, Bogumil Beres, designed the ‘56, which was quickly acclaimed for its unique wing structure and other innovative features. The sailplane has many unusual features, e.g. very light structure (175 kg empty weight), very thin (13%) high aspect ratio (27.6) monocoque wing. Unaffected by a massive spar, the '56 wings hold their precise, unwavering contours year after year. Additionally, the spar-less design leaves extra room for ballast: the '56's wet wings hold 160 liters. In the late 80's and early 90's, glider aerodynamics progressed quickly thanks to both extensive wind tunnel experimental work and the development of advanced computational methods in fluid dynamics. SZD Bielsko-Biala did not have these kinds of resources at that time. Other gliders built 3 to 6 years after the Diana had a chance to use all these new tools and ideas, which allow for reducing the profile drag and lowering adverse aerodynamic inference. Because of these advantages, these newer gliders achieved much better performance. Consequently, Diana, one of the most technologically advanced sailplane but equipped with less modern aerodynamics (a Wortmann type, based on 70’s technology, free transition type airfoil), fell into background. In 2003 the decision was made to design new, advanced aerodynamics for Diana. In the case of high performance racing class sailplanes, the wing produces most of the drag. Because of this fact and the expected costs, modernization was restricted mainly to the design of a new wing and minor fuselage and undercarriage modifications. The main objective of modern sailplane design is the maximization of overall performance that can be measured by cross-country speed for specified thermal conditions. To address such a problem, a mathematical model of cross- country flight must be established. Such an approach must take into account the thermal model, sailplane aerodynamic characteristics (dependent on various design parameters and “aerodynamic technology”), and the mass (water ballast amount). The problem is very complicated (especially weather and thermal conditions), so only a very simplified approach can be used. Real design process is iterative in nature. Hence, subsequent modifications of design parameters and aerodynamic solutions, estimation of resulting efficiency are completed and the final design choices are made. The presented results describe final configuration of the Diana-2. Cross-country performance analysis A typical cross-country flight pattern is shown in Fig. 1. It includes circling in a thermal, interthermal descent, and cloud streets. Thermal strength (including diameter and vertical velocity distribution), interthermal descent strength r d (expressed as a fraction of max. thermal strength), and the cloud street’s relative length rl cs and strength r cs (expressed as a fraction of max thermal strength) are the parameters describing thermal conditions. The specification of thermal characteristics is the most challenging problem as they depend on a great number of factors (weather conditions, geographical region, ground features, altitude, time, etc.) and are in principle governed by stochastic rules. A very limited amount of measured data is available in the literature, making this problem even more difficult. Horstmann 1, 2 models are probably the most realistic approach. They include four standard thermal profiles: combination of strong (2) and weak (1) and wide (B) and narrow (A) thermals. A linear variation of the vertical velocity distribution outside a 60m-radius thermal core is assumed. The direct application of those
Transcript of Aerodynamic Design and Cross-country Flight Performance ...

TECHNICAL SOARING 79 VOLUME 30, NO. 3 – July 2006
Aerodynamic Design and Cross-country Flight Performance Analysis
of Diana-2 Sailplane
Krzysztof Kubrynski
Warsaw University of Technology, Institute of Aeronautics and Applied Mechanics
Warsaw, Poland
Presented at the XXVIII OSTIV Congress, Eskilstuna, Sweden, 8-15 June 2006
Abstract
The aerodynamic design philosophy and computational analysis of cross-country flight performance of
Diana-2 sailplane in different thermal conditions are presented. To address the second issue, a continuous
spectrum of thermal models is created. For specified thermal model (thermal strength vs distance from core
center, interthermal descent, length and strength of cloud streets), the sailplane mass and aerodynamic
characteristics optimum flight parameters (circling speed and bank angle, interthermal glide speed and speed
in cloud streets) is found applying optimization technique. Finally expected cross-country speed for different
thermal conditions and water ballast weight, as well the optimum water ballast amount, can be predicted. The
main goal of the analysis is the optimization of sailplane parameters and helping pilots make decisions
regarding optimum balasting technique in flight. An estimation of the influence of bugs and rain on the
sailplane aerodynamic characteristics is also presented.
Introduction The SZD-56 Diana sailplane was designed in 1989. Its
first flight was in 1990. SZD's chief engineer, Bogumil Beres,
designed the ‘56, which was quickly acclaimed for its unique
wing structure and other innovative features. The sailplane has
many unusual features, e.g. very light structure (175 kg empty
weight), very thin (13%) high aspect ratio (27.6) monocoque
wing. Unaffected by a massive spar, the '56 wings hold their
precise, unwavering contours year after year. Additionally, the
spar-less design leaves extra room for ballast: the '56's wet
wings hold 160 liters. In the late 80's and early 90's, glider
aerodynamics progressed quickly thanks to both extensive
wind tunnel experimental work and the development of
advanced computational methods in fluid dynamics. SZD
Bielsko-Biala did not have these kinds of resources at that
time. Other gliders built 3 to 6 years after the Diana had a
chance to use all these new tools and ideas, which allow for
reducing the profile drag and lowering adverse aerodynamic
inference. Because of these advantages, these newer gliders
achieved much better performance. Consequently, Diana, one
of the most technologically advanced sailplane but equipped
with less modern aerodynamics (a Wortmann type, based on
70’s technology, free transition type airfoil), fell into
background. In 2003 the decision was made to design new,
advanced aerodynamics for Diana. In the case of high
performance racing class sailplanes, the wing produces most of
the drag. Because of this fact and the expected costs,
modernization was restricted mainly to the design of a new
wing and minor fuselage and undercarriage modifications.
The main objective of modern sailplane design is the
maximization of overall performance that can be measured by
cross-country speed for specified thermal conditions. To
address such a problem, a mathematical model of cross-
country flight must be established. Such an approach must
take into account the thermal model, sailplane aerodynamic
characteristics (dependent on various design parameters and
“aerodynamic technology”), and the mass (water ballast
amount). The problem is very complicated (especially weather
and thermal conditions), so only a very simplified approach
can be used. Real design process is iterative in nature. Hence,
subsequent modifications of design parameters and
aerodynamic solutions, estimation of resulting efficiency are
completed and the final design choices are made.
The presented results describe final configuration of the
Diana-2.
Cross-country performance analysis A typical cross-country flight pattern is shown in Fig. 1.
It includes circling in a thermal, interthermal descent, and
cloud streets. Thermal strength (including diameter and
vertical velocity distribution), interthermal descent strength rd
(expressed as a fraction of max. thermal strength), and the
cloud street’s relative length rlcs and strength rcs (expressed as
a fraction of max thermal strength) are the parameters
describing thermal conditions. The specification of
thermal characteristics is the most challenging problem as they
depend on a great number of factors (weather conditions,
geographical region, ground features, altitude, time, etc.) and
are in principle governed by stochastic rules. A very limited
amount of measured data is available in the literature, making
this problem even more difficult. Horstmann1, 2
models are
probably the most realistic approach. They include four
standard thermal profiles: combination of strong (2) and weak
(1) and wide (B) and narrow (A) thermals. A linear variation
of the vertical velocity distribution outside a 60m-radius
thermal core is assumed. The direct application of those
TECHNICAL SOARING 80 VOLUME 30, NO. 3 – July 2006
models to the current problem is, unfortunately, not possible as
continuous spectrum of thermal strength is required.
A continuous family of thermals based on the assumption
of a linear interpolation between the Horstmann models was
created. Three thermal families are specified and used, A:
narrow, B: wide, C: middle thermal. The lift distribution
varies linearly between 60m and R_max, where its value is
zero. A parabolic lift variation is assumed inside the thermal
core. The rate of climb for a particular thermal shape,
specified sailplane mass, and the aerodynamic characteristics
can be specified as:
SINKTC www (1)
where the thermal lift at a specified circling radius and sink
velocity can be expressed as:
),V(R,w,MODEL_THERMALww CIRCCIRCCIRC0TTT
CSAERODYNAMI,MASS,,Vww CIRCCIRCSINKSINK (2)
The final equation for altitude balance takes form of:
CS
CSCSSINK
d
CSdSINKCIRCSINKT
V
Lww
V
LLwwtww
(3)
The average cross-country speed depends on the following:
,CSAERODYNAMI,MASS
,rl,r,r,w,MODEL_THERMALfV CSCSd0TCC
CSdCIRCCIRC V,V,,V (4)
It is seen that net rate of climb depends on the thermal model,
thermal strength wT0, sailplane mass, aerodynamic
characteristics, circling speed, and bank angle. Similarly, the
average cross-country speed depends on all above parameters
and, additionally, on the weather model (rd, rlCS, rCS), speed at
interthermal glide, and along cloud streets. For a specified
weather model, thermal strength, mass, and aerodynamic
characteristics of the sailplane, the optimum flight and circling
parameters, as well as final average cross-country speed, can
be easily found using nonlinear programming methods. Such
modeling of gliding tactics is equivalent to that of MacCready,
which is not the one actually applied by pilots due to relatively
low value of probability of arrival. Additional mathematical
analysis shows, however, that reasonable modifications to the
MacCready rules have little influence on the final average
cross-country speed – increasing significantly the probability
of arrival3, 4
. This justifies the treatment applied in the present
work.
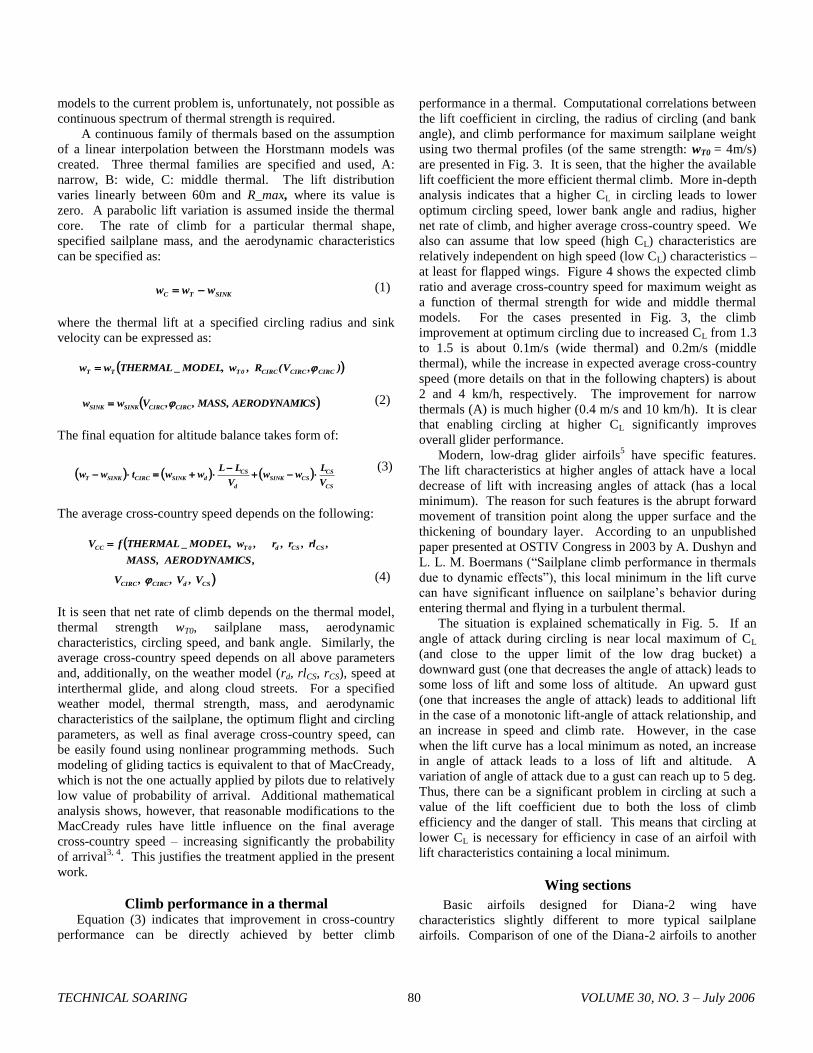
Climb performance in a thermal Equation (3) indicates that improvement in cross-country
performance can be directly achieved by better climb
performance in a thermal. Computational correlations between
the lift coefficient in circling, the radius of circling (and bank
angle), and climb performance for maximum sailplane weight
using two thermal profiles (of the same strength: wT0 = 4m/s)
are presented in Fig. 3. It is seen, that the higher the available
lift coefficient the more efficient thermal climb. More in-depth
analysis indicates that a higher CL in circling leads to lower
optimum circling speed, lower bank angle and radius, higher
net rate of climb, and higher average cross-country speed. We
also can assume that low speed (high CL) characteristics are
relatively independent on high speed (low CL) characteristics –
at least for flapped wings. Figure 4 shows the expected climb
ratio and average cross-country speed for maximum weight as
a function of thermal strength for wide and middle thermal
models. For the cases presented in Fig. 3, the climb
improvement at optimum circling due to increased CL from 1.3
to 1.5 is about 0.1m/s (wide thermal) and 0.2m/s (middle
thermal), while the increase in expected average cross-country
speed (more details on that in the following chapters) is about
2 and 4 km/h, respectively. The improvement for narrow
thermals (A) is much higher (0.4 m/s and 10 km/h). It is clear
that enabling circling at higher CL significantly improves
overall glider performance.
Modern, low-drag glider airfoils5 have specific features.
The lift characteristics at higher angles of attack have a local
decrease of lift with increasing angles of attack (has a local
minimum). The reason for such features is the abrupt forward
movement of transition point along the upper surface and the
thickening of boundary layer. According to an unpublished
paper presented at OSTIV Congress in 2003 by A. Dushyn and
L. L. M. Boermans (“Sailplane climb performance in thermals
due to dynamic effects”), this local minimum in the lift curve
can have significant influence on sailplane’s behavior during
entering thermal and flying in a turbulent thermal.
The situation is explained schematically in Fig. 5. If an
angle of attack during circling is near local maximum of CL
(and close to the upper limit of the low drag bucket) a
downward gust (one that decreases the angle of attack) leads to
some loss of lift and some loss of altitude. An upward gust
(one that increases the angle of attack) leads to additional lift
in the case of a monotonic lift-angle of attack relationship, and
an increase in speed and climb rate. However, in the case
when the lift curve has a local minimum as noted, an increase
in angle of attack leads to a loss of lift and altitude. A
variation of angle of attack due to a gust can reach up to 5 deg.
Thus, there can be a significant problem in circling at such a
value of the lift coefficient due to both the loss of climb
efficiency and the danger of stall. This means that circling at
lower CL is necessary for efficiency in case of an airfoil with
lift characteristics containing a local minimum.
Wing sections
Basic airfoils designed for Diana-2 wing have
characteristics slightly different to more typical sailplane
airfoils. Comparison of one of the Diana-2 airfoils to another
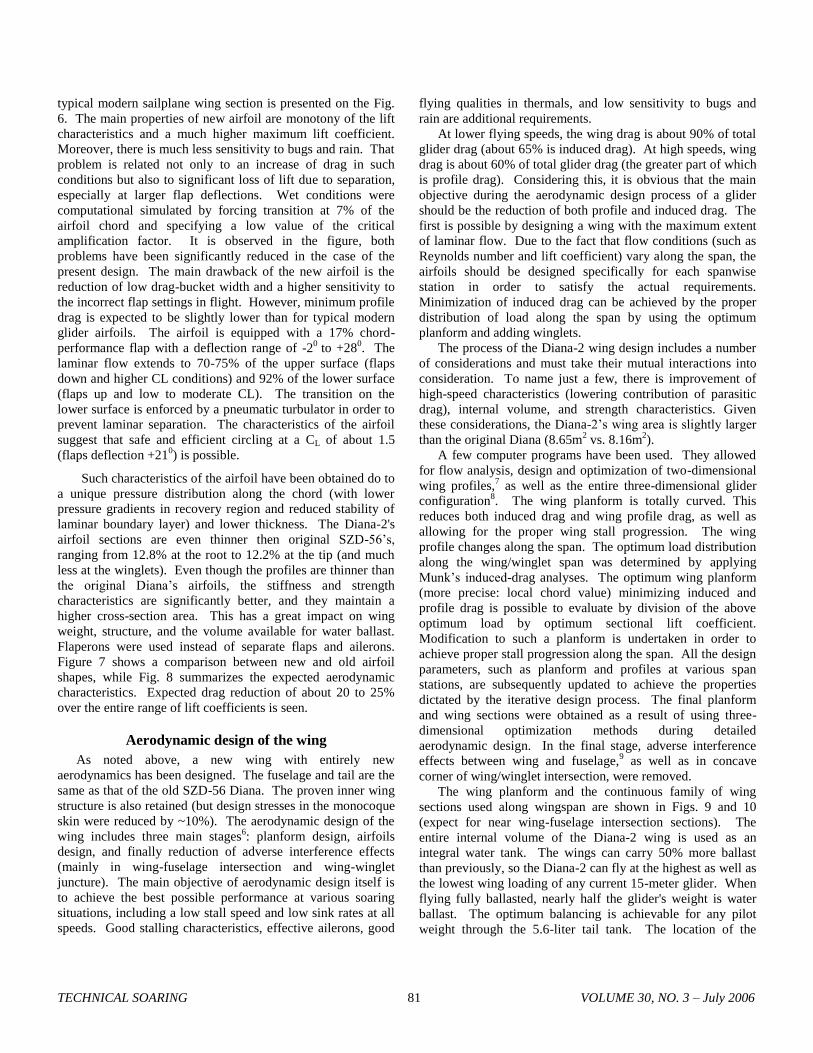
TECHNICAL SOARING 81 VOLUME 30, NO. 3 – July 2006
typical modern sailplane wing section is presented on the Fig.
6. The main properties of new airfoil are monotony of the lift
characteristics and a much higher maximum lift coefficient.
Moreover, there is much less sensitivity to bugs and rain. That
problem is related not only to an increase of drag in such
conditions but also to significant loss of lift due to separation,
especially at larger flap deflections. Wet conditions were
computational simulated by forcing transition at 7% of the
airfoil chord and specifying a low value of the critical
amplification factor. It is observed in the figure, both
problems have been significantly reduced in the case of the
present design. The main drawback of the new airfoil is the
reduction of low drag-bucket width and a higher sensitivity to
the incorrect flap settings in flight. However, minimum profile
drag is expected to be slightly lower than for typical modern
glider airfoils. The airfoil is equipped with a 17% chord-
performance flap with a deflection range of -20
to +280. The
laminar flow extends to 70-75% of the upper surface (flaps
down and higher CL conditions) and 92% of the lower surface
(flaps up and low to moderate CL). The transition on the
lower surface is enforced by a pneumatic turbulator in order to
prevent laminar separation. The characteristics of the airfoil
suggest that safe and efficient circling at a CL of about 1.5
(flaps deflection +210) is possible.
Such characteristics of the airfoil have been obtained do to
a unique pressure distribution along the chord (with lower
pressure gradients in recovery region and reduced stability of
laminar boundary layer) and lower thickness. The Diana-2's
airfoil sections are even thinner then original SZD-56’s,
ranging from 12.8% at the root to 12.2% at the tip (and much
less at the winglets). Even though the profiles are thinner than
the original Diana’s airfoils, the stiffness and strength
characteristics are significantly better, and they maintain a
higher cross-section area. This has a great impact on wing
weight, structure, and the volume available for water ballast.
Flaperons were used instead of separate flaps and ailerons.
Figure 7 shows a comparison between new and old airfoil
shapes, while Fig. 8 summarizes the expected aerodynamic
characteristics. Expected drag reduction of about 20 to 25%
over the entire range of lift coefficients is seen.
Aerodynamic design of the wing
As noted above, a new wing with entirely new
aerodynamics has been designed. The fuselage and tail are the
same as that of the old SZD-56 Diana. The proven inner wing
structure is also retained (but design stresses in the monocoque
skin were reduced by ~10%). The aerodynamic design of the
wing includes three main stages6: planform design, airfoils
design, and finally reduction of adverse interference effects
(mainly in wing-fuselage intersection and wing-winglet
juncture). The main objective of aerodynamic design itself is
to achieve the best possible performance at various soaring
situations, including a low stall speed and low sink rates at all
speeds. Good stalling characteristics, effective ailerons, good
flying qualities in thermals, and low sensitivity to bugs and
rain are additional requirements.
At lower flying speeds, the wing drag is about 90% of total
glider drag (about 65% is induced drag). At high speeds, wing
drag is about 60% of total glider drag (the greater part of which
is profile drag). Considering this, it is obvious that the main
objective during the aerodynamic design process of a glider
should be the reduction of both profile and induced drag. The
first is possible by designing a wing with the maximum extent
of laminar flow. Due to the fact that flow conditions (such as
Reynolds number and lift coefficient) vary along the span, the
airfoils should be designed specifically for each spanwise
station in order to satisfy the actual requirements.
Minimization of induced drag can be achieved by the proper
distribution of load along the span by using the optimum
planform and adding winglets.
The process of the Diana-2 wing design includes a number
of considerations and must take their mutual interactions into
consideration. To name just a few, there is improvement of
high-speed characteristics (lowering contribution of parasitic
drag), internal volume, and strength characteristics. Given
these considerations, the Diana-2’s wing area is slightly larger
than the original Diana (8.65m2 vs. 8.16m
2).
A few computer programs have been used. They allowed
for flow analysis, design and optimization of two-dimensional
wing profiles,7 as well as the entire three-dimensional glider
configuration8. The wing planform is totally curved. This
reduces both induced drag and wing profile drag, as well as
allowing for the proper wing stall progression. The wing
profile changes along the span. The optimum load distribution
along the wing/winglet span was determined by applying
Munk’s induced-drag analyses. The optimum wing planform
(more precise: local chord value) minimizing induced and
profile drag is possible to evaluate by division of the above
optimum load by optimum sectional lift coefficient.
Modification to such a planform is undertaken in order to
achieve proper stall progression along the span. All the design
parameters, such as planform and profiles at various span
stations, are subsequently updated to achieve the properties
dictated by the iterative design process. The final planform
and wing sections were obtained as a result of using three-
dimensional optimization methods during detailed
aerodynamic design. In the final stage, adverse interference
effects between wing and fuselage,9 as well as in concave
corner of wing/winglet intersection, were removed.
The wing planform and the continuous family of wing
sections used along wingspan are shown in Figs. 9 and 10
(expect for near wing-fuselage intersection sections). The
entire internal volume of the Diana-2 wing is used as an
integral water tank. The wings can carry 50% more ballast
than previously, so the Diana-2 can fly at the highest as well as
the lowest wing loading of any current 15-meter glider. When
flying fully ballasted, nearly half the glider's weight is water
ballast. The optimum balancing is achievable for any pilot
weight through the 5.6-liter tail tank. The location of the

TECHNICAL SOARING 82 VOLUME 30, NO. 3 – July 2006
center of gravity that minimizes trim drag is at 39% of mean
aerodynamic chord.
The design of the glider and modified wings, including
geometry definition, has been performed using Unigraphics
NX system. The wing mock-up was made using CNC
technology that enabled a precision of better than 0.1mm,
which is crucial to benefit from subtle aerodynamic design.
The basic parameters of the new Diana are:
Wing span 14.942 m
Wing area 8.657 m2
Empty mass 182 kg
Wing panel mass 46 kg
Water ballast (wings) 248 kg
Max. mass 500 kg
Min. wing loading 28 kg/m2
Max. wing loading 58 kg/m2
Sailplane performance analysis
The performance of Diana-2 was calculated using a rather
unusual methodology. As performance of the old Diana had
been measured and described in Mr. Richard Johnson’s flight-
test results, the evaluation of drag characteristics of the glider
was possible. The wing drag characteristics obtained for the
old Diana wing (calculated using a panel method with
boundary layer interaction) allowed for the estimation of the
drag characteristics of the remaining parts: fuselage, fin and
tail. By adding the drag of the new wing, calculated using the
same method, to these values, allows the drag characteristics of
the new Diana to be estimated. It should be noted that the
entire procedure was based on introducing numerical
corrections of the wing characteristics to Johnson's flight-test
results, which were used to predict the flight characteristics of
the Diana-2. Experimental characteristics are not always
smooth, so smoothing the parasitic drag characteristics was
necessary. Flight tests had been completed for only one wing
loading, so the same parasitic drag characteristics were used
for other wing loadings. Weight changes were considered only
in the numerical calculations of the wing characteristics. The
prediction for maximum L/D (with water ballast) exceeds the
almost mythical 50:1 boundary for racing class sailplanes.
Final speed polars for the clean wing at different sailplane
weights are presented on Fig. 11.
As the airfoils applied on new wing show considerable
high sensitivity to the proper flap settings, a detailed analysis
of flap position influence on the speed polars was of primary
importance. Computational optimum of flap position for
various sailplane weights and speeds are presented in Fig. 12.
Also of importance is the influence of insects/rain on the
glider performance. An approximation of the roughness
caused by bugs was achieved by specifying a much lower
value of critical amplification factor NCR used for analyzing
laminar boundary layer stability and transition. In the
presented computations NCR = 5 was used. Flow conditions
related to rain were approximated by specifying a very low
value of NCR and a forced transition at 7% of the chord on
upper and lower surfaces. Results for sailplane mass of 350kg
at various flow conditions and flap settings are presented in
Fig. 13. The conclusion is that the approximation of bugs
leads to only minor performance deterioration over a wide
range of speeds. In fact, the only significant lost of efficiency
is expected at high speeds. However, the optimum flap
settings change significantly. Rainy conditions are expected to
lead to much worse sailplane performance. On the other hand,
the estimated loss is still much lower then for any other high
performance glider. The other feature worth mentioning is the
very low sensitivity of wet wing to flap setting.
Cross-country performance of the sailplane
The methodology described for thermal flight analysis was
not only useful for selecting optimum design parameters for
the sailplane, but also for coming up with some rules to help
piloting decisions concerning the optimal ballasting of the
glider in flight (depending on weather conditions, thermal
strength, and size). The circling analysis was restricted to a
maximum allowable lift coefficient of CL=1.4, which is
probably slightly conservative.
Two basic weather models were used. The first one
included no cloud streets (rlCS = 0, rCS = 0) and interthermal
descent has an intensity of 10% of the maximum thermal lift in
the core (rd = 0.1), which is equivalent to about 20% of the
sailplane average climb rate. The second model was
characterized by cloud streets reaching 20% of the total way
between thermals with their mean lift of 30% of the thermal
core value (rlCS = 0.2, rCS = 0.3). The intensity of the
interthermal descent was the same as for the first model (rd =
0.1).
Figure 14 shows the relationship between the sailplane
mass and the expected average cross-country speed and net
climb rate for the first weather model (no cloud streets), wide
thermals and different thermal strengths (wT0 = 2.5 m/s & wT0
= 3.5 m/s). Similar results were obtained for both weather
models, three thermals (wide, medium and narrow) and
various thermal strengths WT0 (1.5 7.0 m/s). A relatively
strong influence of mass on climb rate is observed.
Nevertheless, the distribution of the final average cross-
country speed is very flat near optimum. The most significant
benefit from either heavy ballast or a lighter sailplane - which
correspond to either high or low allowable wing loadings - is
expected mainly for very strong and very weak thermal
conditions.
Figure 15 presents the optimum sailplane mass vs average
climb rate relationships for both kinds of weather conditions
and wide thermals. Additional boundaries of a 1% penalty on
the average cross-country speed (thin line) and constant
thermal strength conditions (broken oblique lines) are marked.
Solid points represent the measured values extracted from
flight logs (year 2005: Polish Open Class Nationals and
European Championships). The average climb rate was
defined as a sum of all the altitude gained in circling and the

TECHNICAL SOARING 83 VOLUME 30, NO. 3 – July 2006
difference of altitudes at start and finish divided by the total
time spent circling. The average cross-country speed includes
the real kilometers flown (not the task distance only).
Analogical analysis has been performed for narrow and
middle thermals. Examination of flight log results indicates
that the wide thermal model is the most relevant; however,
often lengths and strengths of cloud streets were greater then
assumed in the calculations. Hence the real average cross-
country speed is sometimes higher than predicted. Quite
unusual and slightly surprising is the significant
underestimation of calculated cross-country speed in strong
thermal conditions (climb rate about 2.5 m/s).
Commonly applied for average cross-country performance
analysis is the mixed weather model of Quast2, which consists
of some portions of wide and narrow thermals of strong and
weak types. Obviously, the main objective of the analysis
presented here is the determination of the amount of water
ballast optimal for various thermal strengths. A family of
mixed thermals – narrow and wide - with the same vertical
velocity at 60m-radius position from core center, was
specified. The same as in Quast’s model, the assumption was
made that 84% of the total flight distance is dominated by wide
thermals, whereas 16% by narrow thermals. Mean value of the
interthermal descent is 10% of the maximum vertical velocity
inside thermal core, which means approximately 20% of
average climb ratio. Figure 16 shows the relevant results.
It is worth noting that the mixed weather model similar to
Quast’s leads to a different optimum of sailplane’s mass
compared to the model including wide thermals only, but the
expected average cross-country speeds in both cases are rather
similar (the model including some amount of narrower
thermals predicts a few km/h lower speed). Comparison of the
presented computational results to those extracted from flight
log data suggests some overestimation of the narrow thermal
presence in Quast’s model.
The most important conclusions from the analyses
concerns the optimal amount of water ballast for various
average climb rates. Generally, the optimum is higher then the
values usually presented in literature. A maximum sailplane
mass of 500 kg is expected to be optimum for average climb
rate above 1.75 m/s in the case of wide thermals and no cloud
streets. In the case of cloud streets of 20% relative length and
30% strength, the maximum sailplane mass should be used at
climb rates above 1.5 m/s. The minimum practical achievable
mass of about 280 kg (in the case of 80 kg pilot + equipment)
achieves an optimum for 1 m/s and 0.9 m/s respectively.
Expectation is that removing of 50kg water ballast should
improve the average climb rate by about 0.15 m/s. The values
of masses should be slightly lower in the presence of some
fraction of narrow thermals. It is interesting that the mixed
model affects mainly high mass characteristics with little
influence on the light sailplane. On the other hand, the
dependency between mass and final cross-country speed is
very flat near the optimum. Over- or under-ballasting the
sailplane by 50 to 70 kg (about +/- 15% of the sailplane
optimum mass) leads to the loss of about 1% of the average
speed.
Conclusions The design process of a modern high-performance
sailplane is rather demanding issue. A high level of sailplane
aerodynamics has been achieved through the use of advanced
computational design tools and extensive wind-tunnel
investigations. Any further significant improvements in
sailplane flight performance through drag reduction (especially
profile drag) is almost impossible without the use of new flow
technologies (e.g. active flow control of boundary layer).
Some moderate improvement of overall sailplane performance
can still be achieved by careful aerodynamic design of every
detail of the sailplane and new solutions for sailplane structure
and technology. A relatively broad scale of possible
improvement in final flight performance is still possible in the
area of low-speed characteristics (climb performance). Apart
from proper design choices, wide and detailed final
performance analysis, including off-design conditions, must be
performed because of pilots’ requirements.
References 1Horstmann, K.H., Neue „Modellaufwindverteilungen und ihr
Einfluss auf die Auslegung von Segelflugzeugen“ OSTIV Publication
XIV, 1976 2Thomas, F., Fundamentals of Sailplane Design, College Park
Press, 1999 3Cochrane J.H., “MacCready Theory with Uncertain Lift and
Limited Altitude”, Technical Soaring 23(3) (July 1999), also:
http://www.gsb.uchicago.edu/fac/john.cochrane/research/Soaring 4Almgren, R., Tourin, A., “The Mathematics of Gliding Racing,”
RCA, Nov. 7, 2004 (http://www.math.toronto.edu/almgren/optsoar/) 5Boermans L.M.M, van Garrel A., “Design and Windtunnel Test
Results of a Flapped Laminar Flow Airfoil for High-Performance
Sailplane Applications” – ICAS 94-5.4.3 6Kubrynski K., “Wing-Winglet Design Methodology for Low
Speed Applications”, AIAA Pap. 03-0215, 41 Aerospace Science
Meeting, Reno, 2003 7Drela M., “XFOIL: An Analysis and Design System for Low
Reynolds Number Airfoils”, in Low Reynolds Number Aerodynamics,
Ed. T. J. Mueller, Lecture Notes in Eng. 54 (1989) 8Kubrynski K., “Subsonic Aerodynamic Design Via
Optimization”, Ed. K.Fuji, G.S.Dulikravich, Notes on Numerical
Fluid Mechanics, Vol. 68, 1999, Vieweg 9Boermans L.M.M, Kubrynski K., Nicolosi F., “Wing-Fuselage
Design of High-Performance Sailplanes” – Boundary Layer
Separation in Aircraft Aerodynamics, ed. Henkes R.A.W.M., Bakker
P.G. – Delft 1997 10Johnson, R.H., “A Flight Test Evaluation Of The SZD-56-1
Diana Sailplane” - Soaring-April 1999

TECHNICAL SOARING 84 VOLUME 30, NO. 3 – July 2006
Figure 1 Assumed cross-country flight pattern.
Figure 2 Assumed lift distribution in model thermals.
a)
b)
Figure 3 Influence of lift coefficient, circling radius and bank
angle on climb performance: a) wide thermal (B), b) middle
thermal (C).

TECHNICAL SOARING 85 VOLUME 30, NO. 3 – July 2006
a)
b)
Figure 4 Influence of lift coefficient and thermal strength on
climb rate and average cross-country speed (no cloud streets):
a) wide thermal (B), b) middle thermal (C).
Figure 5 Sketch of airfoil behavior at angle of attack changes
due to vertical gust.
a)
b)
Figure 6 Computational characteristics of Diana-2 airfoil and
typical modern airfoil – clean and wet conditions simulated, a)
no flaps, b) flaps down.
Figure 7 Old and new of Diana wing airfoils.

TECHNICAL SOARING 86 VOLUME 30, NO. 3 – July 2006
Figure 8 Drag polars of new and old Diana airfoils.
Figure 9 Wing planform (developed surface).
Figure 10 Geometry of the wing and winglet airfoils.
Figure 11 Diana-2 calculated speed polars.

TECHNICAL SOARING 87 VOLUME 30, NO. 3 – July 2006
Figure 12 Calculated optimum flap settings.
Figure 13 Simulation of clean wing, bugs and rain in
performance calculations (mass: 350 kg).
Figure 14 Sample computational cross-country flight
characteristics of Diana-2 at two thermal strengths.

TECHNICAL SOARING 88 VOLUME 30, NO. 3 – July 2006
a)
b)
Figure 15 Optimum Diana-2 mass vs. climb rate for wide
thermals and two weather models: a) no cloud streets, b) with
cloud streets.
a)
b)
Figure 16 Optimum sailplane mass and expected cross-
country speed for mixed thermals and two weather models a)
no cloud streets, b) with cloud streets