Aerodynamic and Acoustic Flight Test Results and Analysis ... · Results and Analysis for the...
57
NASA/TM—2014–218375 Aerodynamic and Acoustic Flight Test Results and Analysis for the Stratospheric Observatory for Infrared Astronomy Stephen B. Cumming, Mark S. Smith, Larry J. Cliatt and Michael A. Frederick Armstrong Flight Research Center, Edwards, California Click here: Press F1 key (Windows) or Help key (Mac) for help August 2014 https://ntrs.nasa.gov/search.jsp?R=20140016966 2018-06-04T09:26:48+00:00Z
Transcript of Aerodynamic and Acoustic Flight Test Results and Analysis ... · Results and Analysis for the...

NASA/TM—2014–218375
Aerodynamic and Acoustic Flight Test Results and Analysis for the Stratospheric Observatory for Infrared AstronomyStephen B. Cumming, Mark S. Smith, Larry J. Cliatt and Michael A. FrederickArmstrong Flight Research Center, Edwards, California
Click here: Press F1 key (Windows) or Help key (Mac) for help
August 2014
https://ntrs.nasa.gov/search.jsp?R=20140016966 2018-06-04T09:26:48+00:00Z

NASA STI Program ... in Profile
Since its founding, NASA has been dedicated to the advancement of aeronautics and space science. The NASA scientific and technical information (STI) program plays a key part in helping NASA maintain this important role.
The NASA STI program operates under theauspices of the Agency Chief Information Officer. It collects, organizes, provides for archiving, and disseminates NASA’s STI. The NASA STI program provides access to the NTRS Registeredand its public interface, the NASA Technical Reports Server, thus providing one of the largest collections of aeronautical and space science STI in the world. Results are published in both non-NASA channels and by NASA in the NASA STI Report Series, which includes the following report types:
� TECHNICAL PUBLICATION. Reports of completed research or a major significant phase of research that present the results of NASA Programs and include extensive data or theoretical analysis. Includes compila-tions of significant scientific and technical data and information deemed to be of continuing reference value. NASA counter-part of peer-reviewed formal professional papers but has less stringent limitations on manuscript length and extent of graphic presentations.
� TECHNICAL MEMORANDUM. Scientific and technical findings that are preliminary or of specialized interest, e.g., quick release reports, working papers, and bibliographies that contain minimal annotation. Does not contain extensive analysis.
� CONTRACTOR REPORT. Scientific and technical findings by NASA-sponsored contractors and grantees.
� CONFERENCE PUBLICATION. Collected papers from scientific and technical conferences, symposia, seminars, or other meetings sponsored or co-sponsored by NASA.
� SPECIAL PUBLICATION. Scientific, technical, or historical information from NASA programs, projects, and missions, often concerned with subjects having substantial public interest.
� TECHNICAL TRANSLATION. English-language translations of foreign scientific and technical material pertinent to NASA’s mission.
Specialized services also include organizing and publishing research results, distributing specialized research announcements and feeds, providing information desk and personal search support, and enabling data exchange services.
For more information about the NASA STI program, see the following:
� Access the NASA STI program home page at http://www.sti.nasa.gov
� E-mail your question to [email protected]
� Phone the NASA STI Information Desk at 757-864-9658
� Write to:NASA STI Information DeskMail Stop 148NASA Langley Research CenterHampton, VA 23681-2199
This page is required and contains approved text that cannot be changed.

NASA/TM—2014–218375
Aerodynamic and Acoustic Flight Test Results and Analysis for the Stratospheric Observatory for Infrared Astronomy Stephen B. Cumming, Mark S. Smith, Larry J. Cliatt and Michael A. FrederickArmstrong Flight Research Center, Edwards, California
Insert conference information, if applicable; otherwise delete
Click here: Press F1 key (Windows) or Help key (Mac) for help
Enter acknowledgments here, if applicable.
National Aeronautics andSpace Administration
Armstrong Flight Research CenterEdwards, CA 93523-0273
August 2014

Click here: Press F1 key (Windows) or Help key (Mac) for help
Available from:
Click here: Press F1 key (Windows) or Help key (Mac) for help
NASA Center for AeroSpace Information7115 Standard Drive
Hanover, MD 21076-1320443-757-5802

1
AbstractAs part of the Stratospheric Observatory for Infrared Astronomy program, a 747SP airplane
was modified to carry a 2.5-m telescope in the aft section of the fuselage. The resulting airborne observatory allows for observations above 99 percent of the water vapor in the atmosphere. The open cavity created by the modifications had the potential to significantly affect the airplane in the areas of aerodynamics and acoustics. Several series of flight tests were conducted to clear the operating envelope of the airplane for astronomical observations, planned to be performed between the altitudes of 35,000 ft and 45,000 ft. The flight tests were successfully completed. Cavity acoustics were below design limits, and the overall acoustic characteristics of the cavity were better than expected. The modification did have some effects on the stability and control of the airplane, but these effects were not significant. Airplane air data systems were not affected by the modifications. This paper describes the methods used to examine the aerodynamics and acoustic data from the flight tests and provides a discussion of the flight-test results in the areas of cavity acoustics, stability and control, and air data.
NomenclatureAA aperture assemblyCDS cavity door systemCFD computational fluid dynamicsCPT cable position transducer
�lC rolling moment coefficient due to angle of sideslip, deg-1
�mC pitching moment coefficient due to angle of attack, deg-1
demC pitching moment coefficient due to elevators, deg-1
rnC yawing moment coefficient due to non-dimensional yaw rate, rad-1
�nC yawing moment coefficient due to angle of sideslip, deg-1
drnC yawing moment coefficient due to rudder, deg-1
DLR Deutsches Zentrum fur Luft- und RaumfahrtEGI embedded GPS/INSFADS flush air data sensingFFT fast Fourier transformGPS global positioning systemINS inertial navigation systemKAO Kuiper Airborne ObservatoryLFD lower flexible doorn number of measurements in sample windowp pressure, psiPSD power spectral densityPUPO pull up, push over (maneuver)q dynamic pressure, psfRVSM reduced vertical separation minimumSOFIA Stratospheric Observatory for Infrared AstronomySPL sound pressure levelSPLmax sound pressure level, theoretical maximumTA telescope assemblyURD upper rigid door

2
� angle of attack, deg� angle of sideslip, deg
SubscriptsAC = oscillatory with respect to the moving averageavg = average over sample windowmax = theoretical maximumref = referenceRMS = root mean squared
IntroductionThe Stratospheric Observatory for Infrared Astronomy (SOFIA) is an airborne astronomical
observatory developed through a partnership between the National Aeronautics and Space Administration (NASA) and Deutsches Zentrum fur Luft- und Raumfahrt (DLR) (Cologne, Germany). The SOFIA airplane is a modified 747SP airplane (The Boeing Company, Chicago, Illinois) carrying an optical/infrared/sub millimeter reflecting telescope with an effective diameter of 2.5 m. The observatory was designed to perform observations between the altitudes of 35,000 ft and 45,000 ft, where it is above 99 percent of the water vapor in the atmosphere. The SOFIA program follows other NASA airborne observatories, most recently the Gerard P. Kuiper Airborne Observatory (KAO) (ref. 1).
The airplane was modified for use as an observatory by installing the telescope and associated equipment in the aft section of the airplane. To provide maximum optical performance, an open-air cavity was created and a door system was installed. The door system allows for an unvignetted elevation range of 23 deg to 59 deg. An unvignetted image is one without any distortions at the periphery of the image. For the SOFIA program, an unvignetted image was generally considered to be one unobstructed by any portion of the structure around the cavity door. A passive flow control system was designed and incorporated into the cavity and door design to minimize acoustic resonance in the cavity (refs. 2 and 3). Requirements for the SOFIA program dictated an operational lifetime in excess of 20 years, with 960 hr of observations per year for the observatory. Each research flight should provide the capability for 6 hr of observations at an altitude of at least 41,000 ft.
To ensure the airworthiness of the airplane, and the observatory as a whole, for this mission a substantial flight envelope expansion process was necessary. The structural integrity of the modified airplane had to be verified. The acoustic environment inside the cavity had to be characterized to ensure that acoustic levels remained below design limits, both to prevent structural fatigue and to allow the observatory to meet image quality requirements. The stability and controllability of the modified airplane also had to be evaluated, both in closed-door and open-door configurations. The calibrations of the production pitot-static system had to be verified, and the research air data system had to be calibrated. In addition, all of the new systems installed to support the telescope and the observatory had to be tested, and their functionality verified. Testing began in April 2007; the airplane was cleared for science operations after approximately four years. This paper concentrates on the cavity acoustics, stability and control, and air data portions of the flight-testing.
3
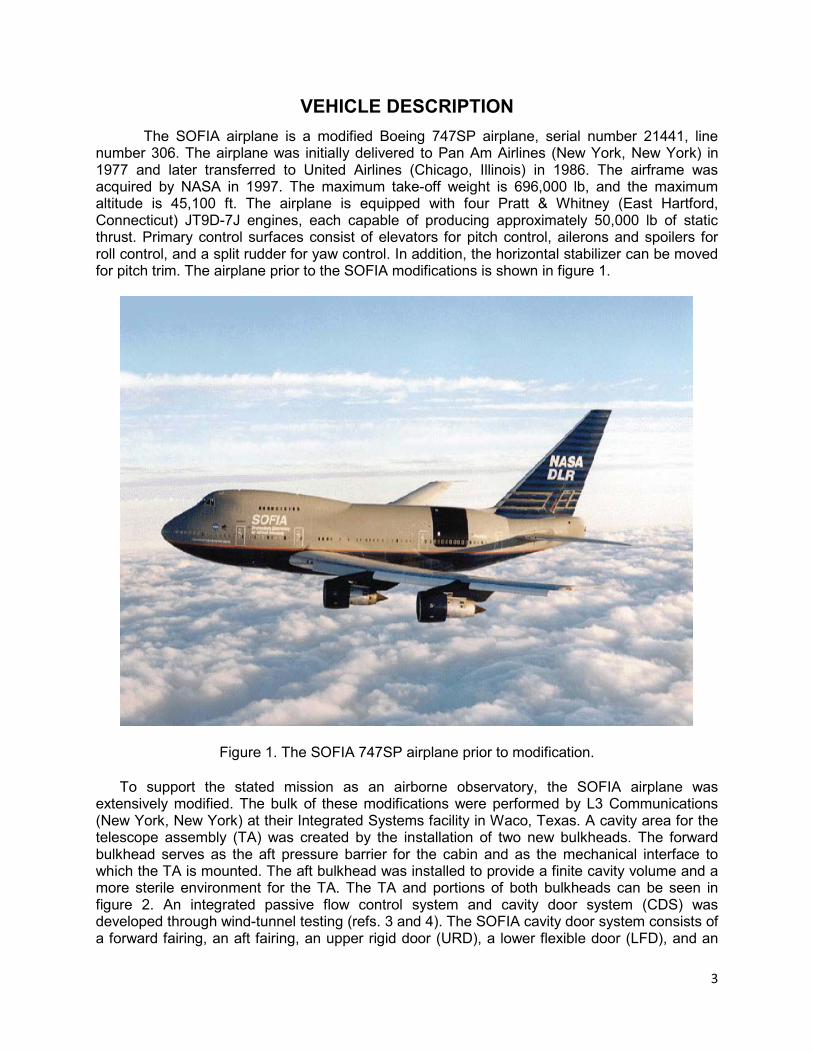
VEHICLE DESCRIPTIONThe SOFIA airplane is a modified Boeing 747SP airplane, serial number 21441, line
number 306. The airplane was initially delivered to Pan Am Airlines (New York, New York) in 1977 and later transferred to United Airlines (Chicago, Illinois) in 1986. The airframe was acquired by NASA in 1997. The maximum take-off weight is 696,000 lb, and the maximum altitude is 45,100 ft. The airplane is equipped with four Pratt & Whitney (East Hartford, Connecticut) JT9D-7J engines, each capable of producing approximately 50,000 lb of static thrust. Primary control surfaces consist of elevators for pitch control, ailerons and spoilers for roll control, and a split rudder for yaw control. In addition, the horizontal stabilizer can be moved for pitch trim. The airplane prior to the SOFIA modifications is shown in figure 1.
Figure 1. The SOFIA 747SP airplane prior to modification.
To support the stated mission as an airborne observatory, the SOFIA airplane was extensively modified. The bulk of these modifications were performed by L3 Communications (New York, New York) at their Integrated Systems facility in Waco, Texas. A cavity area for the telescope assembly (TA) was created by the installation of two new bulkheads. The forward bulkhead serves as the aft pressure barrier for the cabin and as the mechanical interface to which the TA is mounted. The aft bulkhead was installed to provide a finite cavity volume and a more sterile environment for the TA. The TA and portions of both bulkheads can be seen in figure 2. An integrated passive flow control system and cavity door system (CDS) was developed through wind-tunnel testing (refs. 3 and 4). The SOFIA cavity door system consists of a forward fairing, an aft fairing, an upper rigid door (URD), a lower flexible door (LFD), and an

4
aperture assembly (AA). This system can be seen in figure 3 in an open configuration. When closed, the URD covers the aperture and seals the cavity. The LFD provides a surface below the aperture, between the lower AA surface and the fuselage, as the elevation angle increases. The AA consists of sidewalls on the forward, upper, and lower sides of the aperture, and a ramp at the aft. The ramp serves as the primary means of flow control, minimizing shear layer ingestion into the cavity. In a nominal system configuration for astronomical observations, the URD moves to expose the aperture and the cavity, and the URD, the AA, and the LFD all rotate together, tracking the rotation of the TA. The TA was designed with three degrees of freedom, including elevation, cross-elevation, and line-of-sight. Figure 4 shows the SOFIA airplane flying in an open-door configuration.
Figure 2. View of the telescope assembly and cavity.

5
Figure 3. SOFIA cavity door system.
ED 10-0080-03
Figure 4. The SOFIA airplane flying in an open-door configuration.
6
In addition to the structural modifications, substantial flight-test instrumentation was added to the SOFIA airplane to support safety monitoring and the data collection envelope expansion flights. Cable position transducers (CPTs), or string potentiometers, synchros, and discrete switches were installed to measure control surface positions. Flush pressure ports were installed in the nose to provide data for angle of attack and angle of sideslip. The pitot static system of the airplane was instrumented to provide static- and total-pressure readings. A research total air temperature probe was installed to provide accurate total air temperature measurements. An embedded GPS/INS (EGI) unit was installed to provide airplane angular rates, linear accelerations, and Euler angles. A differential GPS unit was also installed to provide accurate altitude and ground speed values. The walls of the TA cavity, the URD, the LFD, and the AA were all instrumented with a total of 226 pressure sensors, to measure both steady-state and unsteady pressures. Standard 747SP airplane systems instrumentation, including fuel tank quantities and engine parameters were also available. Strain gages and accelerometers were also installed throughout the airplane structure to support structural integrity during ground and flight tests, and flutter flight tests.
PRELIMINARY ANALYSES AND TESTSPrior to the modifications to the SOFIA airplane and the flight-testing, substantial analyses
and tests were performed both to design the modifications and to develop predictions for flight test, including predictions related to structural responses, stability and control, and acoustics. From an aerodynamics and acoustics standpoint, there are three major tests of interest: a series of five 7-percent-scale wind-tunnel tests performed to design the cavity; a series of three 3-percent-scale wind-tunnel tests that investigated the effects of the cavity on airplane stability and controllability; and a series of baseline flights with the airplane prior to the SOFIA modifications. In addition to these three tests, substantial computational fluid dynamics (CFD) analyses were performed, focusing on the flow in and around the cavity as well as the effects of the cavity on the airplane (refs. 5 and 6).
A series of five 7-percent-scale wind-tunnel tests were performed in the 14-ft Transonic Wind Tunnel at the NASA Ames Research Center (Sunnyvale, California) (ref. 4), beginning in 1990 and ending in 1997. The tests were performed to serve as design and validation tests for the SOFIA program cavity design. Several 747 airplane variants were studied, including the 747SP airplane variant that was eventually selected as the airframe for the program. Various airplane configurations were tested, including a forward and aft cavity location, different aperture shapes, different cavity door and fairing designs, and different TA configurations. Mach numbers for these tests ranged from 0.30 to 0.92. The design was finalized after the fifth wind-tunnel entry. The final design was referred to as the “partial external door configuration.” The partial external door configuration developed from these tests is shown in figure 5. Throughout all of the 7-percent-scale wind-tunnel tests, pressure data were captured in and around the cavity. These data were used primarily to capture cavity acoustics inside the cavity and to examine flow effects just downstream of the cavity. For these tests, boundary layer trips were placed to accurately represent a scaled version of the boundary layer from flight data. The boundary layer profiles were measured and verified using data from flight tests with the 747 Shuttle Carrier Aircraft (SOFIA document – “Boundary Layer Measurement Flight Test for the SOFIA 747-SP”, dated January 15, 1998).

7
Figure 5. Partial external door configuration wind-tunnel model.
Acoustic data from the 7-percent-scale wind-tunnel tests were scaled to flight conditions following the wind-tunnel testing. To scale the frequency of the pressure fluctuations, the ratio of the speed of sound divided by the characteristic length of the wind tunnel to flight was used. This translates to the scale factor of the model multiplied by the ratio of the speed of sound in the wind tunnel to the speed of sound in flight. To scale the amplitude of the pressure fluctuations, they were multiplied by the ratio of dynamic pressure in flight to dynamic pressure in the wind tunnel. The pressure sensors used in these tests had a bandwidth of 1000 Hz.
A series of three 3-percent-scale wind-tunnel tests were performed at two facilities: the University of Washington (Seattle, Washington) Aeronautical Laboratory Kirsten Wind Tunnel (UWAL) and the Boeing Transonic Wind Tunnel (BTWT). These tests began in 1998 and were completed in 1999. The UWAL entry concentrated on low-speed flight conditions and was performed at Mach 0.245. The tests examined various flap settings and landing gear configurations. The BTWT entry covered a range of higher-speed flight conditions, from Mach 0.40 to Mach 0.975. The tests were performed primarily to compile stability and control data for the modified SOFIA airplane. The tests consisted of a baseline 747SP airplane model and a 747SP airplane with the SOFIA modifications. The models had fully moveable or removable control surfaces. The TA/AA elevation and URD positions could also be changed. In addition to the stability and control data collected, steady-state pressures along the fuselage and acoustics inside the cavity were also collected. Since these tests were designed to be consistent with Boeing wind tunnel testing procedures, the trip-dot method used by Boeing for the 747SP airplane was used in these tests instead of the boundary layer trip method used by
8
the 7-percent-scale wind-tunnel tests. (SOFIA document 05-N-19980930-001, “Synopsis of Low-Speed Wind Tunnel Test,” dated September 30, 1998, and SOFIA document 05-N-19981118-001, “Synopsis of High Speed Wind Tunnel Test,” dated November 18, 1998).
Prior to the SOFIA modifications, a series of baseline flights were performed with the 747SP airplane. The flight tests were performed by Kohlman Systems Research (Lawrence, Kansas). A total of 17 baseline flights were flown. The intent of these flights was to gather baseline data to support future flight testing with the modified airplane and to provide a baseline for Federal Aviation Administration (FAA) certification. The suite of instrumentation for these flights was similar to the instrumentation installed for the SOFIA envelope expansion flights, but without the additional sensors required due to the modifications. Baseline stability and control, handling qualities, and performance data were all collected. In addition, investigations into stall speeds, flutter, and airplane strains were all completed. As part of these flights, initial flow angle calibrations were created for a flush air data sensing (FADS) system that was installed to provide flow angle measurements. The FADS system used in this flight series was a four port configuration. Parameter estimation maneuvers from the baseline flights were later analyzed at the NASA Dryden Flight Research Center (Edwards, California) to provide stability and control data to which the results for the modified airplane could be compared.
FLIGHT TEST APPROACHSubstantial flight-testing of the SOFIA airplane was performed following the completion of
the observatory modifications. This testing was required to clear the airplane for science operation and allow for an observatory capable of meeting the planned operational lifespan of 20 years. The flight tests were designed to support NASA public-use certification for the airplane instead of the originally planned FAA certification. The NASA public-use designation was judged to be more appropriate for the airplane.
Flight-Test PhasesEnvelope expansion flight-testing of the SOFIA airplane was broken up into three phases, or
segments. Each flight segment had unique objectives. The first flight segment, designated Segment 0, consisted of closed-door envelope clearance for the ferry flight from Waco, Texas to the NASA Dryden Flight Research Center. The second segment, designated Segment 1, consisted of closed-door envelope expansion and collection of baseline closed-door data. The third segment, Segment 2, consisted of open-door envelope expansion and collection of data to clear the airplane for operational open-door flights. The closed-door and open-door flight envelopes that were cleared during Segments 1 and 2 are depicted in figure 6.

9
Figure 6. SOFIA closed-door and open-door flight envelopes.
Segment 0 was the initial set of test flights of the SOFIA 747SP airplane following the various modifications completed to transform the airplane into a flying observatory. This segment consisted of four flights, including a ferry flight. These flights cleared a flight envelope sufficient to ferry the airplane from Waco, Texas to the NASA Dryden Flight Research Center. Controllability, air data systems, and structural dynamics were all areas of interest during these flights, but the primary area of interest was airplane structural integrity after the modification. During this segment of flights, the FADS system was flown in the four-port configuration that had been calibrated during the baseline flights. Three envelope expansion flights were flown at Waco; flight-test maneuvers were performed and data were collected. Following the completion of the envelope expansion flights, the airplane was successfully ferried to the NASA Dryden Flight Research Center.
Segment 1 flights were flown to clear the operational closed-door envelope for the SOFIA airplane. This segment consisted of six flights. The primary objective of this flight series was to evaluate the structural integrity of the airplane over the full flight envelope. Other objectives included calibration of a five-port FADS and production air data systems and generating closed-door baseline data for airplane stability and control. Preliminary tests of TA functionality were also performed.
Segment 2 was the final envelope expansion segment, consisting of 25 flights flown primarily for open-door envelope expansion. The primary objective during these flights was to characterize the aero acoustic behavior of the open cavity. The airplane had to be cleared overthe operational flight envelope for each unique cavity configuration, which included AA elevation, TA elevation, and URD position. In order to both provide a range of AA/TA aligned elevations, and to minimize the amount of flight-testing required, the following AA/TA aligned elevations were flight-tested: 23°, 30°, 40°, 50°, and 57°. In addition, the following URD positions would be tested: 10-percent open, 40-percent open, 70-percent open and 100-percent open. For AA/TA elevations other than 23º, CDS systems prevented 100-percent open testing,

10
so these test points were performed at the 95-percent open URD position. Telescope assembly/ aperture assembly misalignment testing was also performed to fully clear operational configurations. Telescope assembly/ aperture assembly misalignment testing consisted of moving the TA through its elevation range with the aperture at the following fixed elevations: 23°, 40°, and 57°; and moving the TA +/- 2.5° in cross elevation.
Other objectives for Segment 2 included investigating possible effects on structural dynamics, cavity acoustics, stability and control, and air data systems, and collecting other data necessary to qualify the airplane to fly operationally for at least 20 years. This included collecting the required data to certify the airplane for reduced vertical separation minimum (RVSM) operations. An additional port was added to the FADS system to provide increased reliability for the system, requiring additional calibration data. The other data collected includedinformation on structural integrity and reliability of newly installed or modified airplane systems, including various TA systems.
This paper discusses Segments 0, 1, and 2, with emphasis on Segment 2 flight tests and results.
Flight Test Concerns
There were several areas of concern during the various envelope expansion phases of the SOFIA project. These areas included structural integrity, structural dynamics, cavity acoustics, stability and control, and air data systems. This paper discusses the areas of acoustics, stability and control, and air data systems.
There were no substantial aerodynamics-related concerns associated with Segments 0 and 1, but it was still important to verify that the modifications to the outer mold line of the airplane, that is, the fairings and URD, did not affect flow over the empennage significantly enough to affect stability or controllability. A scenario in which these effects were significant was not deemed likely. In addition, the five-port FADS system and the instrumented pitot-static system needed calibration to support future flight tests.
One major factor that was considered during the flight-test planning and the flight tests themselves was the reliability of the CDS. This system was designed to avoid damage to theairplane structure. As such, the system had multiple potential failure modes in which the door would fail in the open position. This meant that at any time during Segment 2 envelope expansion, the airplane needed to be cleared to return to base and land in the configuration under test, or at any URD position at that AA/TA elevation angle. During the KAO program, one of the most alarming acoustic resonances that was encountered occurred during an open-door landing, thus, acoustics in this situation were of particular interest. In order to clear the airplane for operations, open-door landings were planned during Segment 2 envelope expansion flights.
Cavity Acoustics ConcernsA primary area of concern during open-door flight-testing was the existence of substantial
acoustic energy concentrated over a narrow frequency range at one or more flight conditions. In particular, the possibility of cavity resonance was a major concern. A cavity acoustic resonance event could result in significant structural damage to either the airplane structure or the TA. The extent and location of the damage would depend on the specifics of the acoustic event, including the frequency and spatial coherence of the resonance. Structural damage could be severe if the acoustic frequencies were at, or close to, the natural frequencies of the structure of the airplane. The acoustics coupling with the structural modes of the cavity were identified as an

11
area of major concern, both by the project and independent review teams (ref. 3). Even if a severe resonance was not encountered, significant cavity acoustics could substantially degrade the pointing performance of the telescope. Based on results from the various wind-tunnel tests and CFD analyses, a maximum acoustic environment was defined for the telescope and associated systems. All systems were required to function within specifications for that environment. The environment is defined per the power spectral density (PSD) shown in figure7. The PSD was considered to be the maximum reasonable cavity acoustic level expected in flight after completion of the 7-percent- and 3-percent-scale wind-tunnel tests, and was used in the design of the TA components. Cavity structures were generally designed to withstand a sound pressure level (SPL) of 146 dB with all of the energy concentrated at the natural frequency of that structure. Since the natural frequencies of the cavity structure and the TA components were below 200 Hz, frequencies above that level were not generally considered significant.
(a) PSD.
Figure 7. Maximum cavity acoustic environment for telescope assembly component design.

12
(b) cumulative RMS pressure.
Figure 7. Concluded.
The 7-percent-scale wind-tunnel tests predicted an SPL inside the cavity of approximately 125 dB at the design point, an altitude of 41,000 ft and Mach 0.85, with no substantial energy at any particular frequency. The results from these tests indicated that the configuration was a robust design, with good margins for acoustics with respect to changes in Mach number, angle of attack, angle of sideslip, and AA/TA elevation. The 3-percent-scale wind-tunnel tests, which were focused on stability and control concerns but included acoustic measurements, predicted an SPL inside the cavity of approximately 147 dB at Mach 0.85, with energy concentrated over narrow frequency bands. The tests indicate the possibility of two modes: a leading-edge tone at low speeds, and a standing wave tone at high speeds. The 3-percent-scale wind-tunnel tests also indicated that acoustics could be substantially affected by aperture elevation.
Stability and Control ConcernsIn addition to the cavity resonance concerns, there was a concern that the unsteady flow
downstream of the open cavity could reach the empennage, possibly affecting the stability of the airplane or the effectiveness of the elevators or the rudder control surfaces. Some small effects were predicted by the 3-percent-scale wind-tunnel tests. The 7-percent-scale wind-tunnel tests predicted some supersonic flow over the aft fairings and some pressure fluctuations just aft of the aft fairings, but no substantial effects on the empennage.
The 3-percent-scale wind-tunnel tests predicted a small reduction in longitudinal static stability (
�mC ) and weathercock stability (
�nC ) during open-door flight of as much as 5 percent
and 6 percent, respectively. A small reduction in elevator effectiveness (demC ) was seen when
the cavity and telescope were at 60 deg elevation. In addition, the total drag of the airplane was predicted to increase by 2 to 4 percent, depending on the configuration.

13
While none of the stability and control predictions from the 3-percent-scale wind-tunnel test were of significant concern, there were concerns that the unsteady effects of the cavity may not have been captured accurately downstream, raising the possibility that the effects on the airplane could be more significant than predicted.
Air Data SystemsAnother area of concern during open-door flight testing was the possibility of effects on the
air data systems of the SOFIA airplane. Based on experience with downstream flow disturbances affecting air data systems, this possibility needed to be investigated. While the cavity of the SOFIA airplane is significantly aft of the air data system, the extent of the disturbance caused by the open cavity was an unknown.
INVESTIGATION METHODS
To evaluate the airplane and provide clearance for an operational lifetime of 20 years, methods were developed to assess concerns and provide envelope clearance for the areas of acoustics, stability and control, and air data. Various types of instrumentation were installed and analysis methods were modified, as appropriate. Acoustics methods and instrumentation used were unique for this application, and as such, described in greater detail.
AcousticsIn order to detect acoustic resonance or any other pertinent acoustic phenomena, pressure
sensors were installed in and around the SOFIA cavity. Locations of these sensors were determined by predicted cavity acoustics, including results from wind-tunnel testing and CFD analysis.
MeasurementsThe interior cavity (figure 8) had a total of 97 sensors placed along the interior walls where
the SOFIA telescope was housed. Initially, 90 pressure sensors were installed. Microphones were installed during the latter phases of flight-testing at locations that provided reasons for interest based on earlier flight data analysis. By the end of the open-door cavity envelope expansion, the sensor suite consisted of 90 Kulite® (Leonia, New Jersey) LLE-2DC-750 pressure transducers and seven Kulite® MIC 1A-LQ-080 microphones. The area of highest SPL activity on the cavity walls occurred on the aft bulkhead of the cavity. Figure 9 is a diagram of the sensor locations relative to the aft bulkhead, which experienced most of the acoustic activity on the cavity walls. The microphones installed on the aft bulkhead were placed to capture areas of notable SPL activity (PA8583m and PA8399m) and the location known to have minimum pressure RMS values, to establish a base noise level (PA8410m).

14
(a) View looking forward.
(b) View looking aft.
Figure 8. Isometric views of the SOFIA cavity.

15
Figure 9. Cavity aft bulkhead sensor locations.
Five Kulite® LLE-2DC-750 pressure transducers were mounted on the TA spider arms for acoustic monitoring during the Segment 2 envelope expansion flights. A perspective view, illustrating the structure of the TA, can be seen in figure 10; the sensor locations are highlighted in red in figure 11. The pressure data from these sensors, sampled at 1000 samples per second, were used to characterize the level of interaction between the cavity shear layer and the spider arms.
Figure 10. Perspective view of the telescope assembly.
16
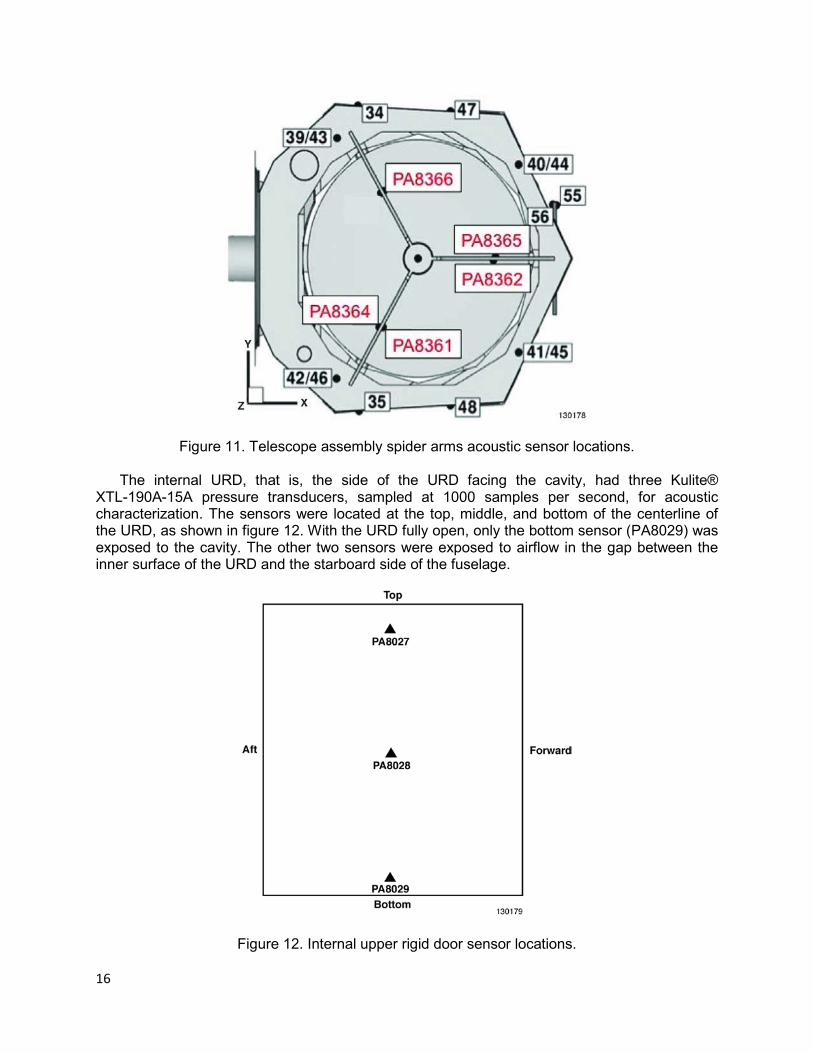
Figure 11. Telescope assembly spider arms acoustic sensor locations.
The internal URD, that is, the side of the URD facing the cavity, had three Kulite® XTL-190A-15A pressure transducers, sampled at 1000 samples per second, for acoustic characterization. The sensors were located at the top, middle, and bottom of the centerline of the URD, as shown in figure 12. With the URD fully open, only the bottom sensor (PA8029) was exposed to the cavity. The other two sensors were exposed to airflow in the gap between the inner surface of the URD and the starboard side of the fuselage.
Figure 12. Internal upper rigid door sensor locations.

17
Acoustic characterization of the internal LFD surface, which is the surface exposed to the cavity, was accomplished using five Kulite® XTL-191B-190-15A pressure transducers that were each sampled at 2000 samples per second. As shown in figure 13, three of the sensors were located at the top, middle, and bottom of the centerline of the LFD. The other two sensors were located adjacent to the top center LFD sensor.
Figure 13. Internal lower flexible door sensor locations.
Sixteen Kulite® LL-7A-125-15A pressure transducers were used to characterize the acoustic levels on the external AA. This sensor layout is shown in figure 14. Eight of the sensors (PA8279, PA8283, PA8285, PA8289, PA8290, PA8296, PA8299, PA8300) were sampled at 5000 samples per second, while the remaining eight sensors were sampled at 1000 samples per second.

18
Figure 14. External aperture assembly sensor locations.
The analog-to-digital converter for the entire pressure transducer suite was a 12-bit system with a pressure range from -1.7 to +15.5 psi. The respective data acquisition system channel of each pressure transducer was digitally filtered using a six-pole anti-aliasing filter at a corner frequency of one-fifth the sample rate of its pressure transducer. Such filtering resulted in the sensors sampled at 1000 samples per second having a bandwidth of 0-200 Hz, 2000 samples per second sensors having a bandwidth of 0-400 Hz, and 5000 samples per second sensors having a bandwidth of 0-1000 Hz.
Although the signal conditioning techniques for each pressure transducer were the same, the different frequency ranges, system characteristics, and locations of the sensors resulted in slightly different signal-to-noise ratios. It was, therefore, necessary to note the specific noise floor for each individual sensor location and sampling rate. Table 1 shows the respective SPL base noise levels for each pressure transducer.

19
Table 1. SOFIA pressure transducer base noise levels.
Sample rate (samples per
second)Surface Base noise
level (dB)
1000
Cavity 120TA 119
AA -external 116
AA-internal 113
URD -internal 113
2000
LFD -external 113
LFD -internal 112
URD -external 129
5000 AA -external 115
AnalysisMuch consideration was given to measuring the pressure spectrum within and around the
cavity. The primary two metrics for acoustic analysis were SPL and PSD. It is important to realize that high pressure levels are not intrinsically dangerous to the SOFIA airplane, whether at discrete frequencies in the spectrum or integrated in the form of a sound pressure level. Rather, it is the influence of the pressure distribution as a dynamic excitation of all structural components, including the TA, AA, URD, and LFD that is important. Since pressure field and structural vibrations are coupled, pressure levels are readily monitored, providing a picture of any resonance within the cavity. The overall objective of the acoustic measurement analyses was to ensure that opening the cavity door, and thereby exposing the interior cavity to the exterior flow field, would not lead to dynamic phenomena that would affect the airworthiness and long-term viability of the SOFIA airplane and the observatory as a whole. For most analyses the primary frequency domain of concern, described in the above section, was expected to cut off at 100 Hz. It was desirable that the pressure instrumentation measure frequency content up to 200 Hz to ensure the capture of any frequencies of interest, including frequencies with the potential to affect structures or TA components. Sampling was therefore done at no less than 500 samples per second, which corresponds to a Nyquist frequency of 250 Hz. All sensors used for acoustics analysis were sampled at 1000 samples per second or greater.
One-second average SPL was calculated for each pressure sensor, as shown in equation (1):
���
���
�
ref
RMS
ppSPL 10log20
(1)

20
where refp = 2.9e-9 psi, and RMSp is the RMS unsteady pressure in psi units, as shown in equations (2) and (3):
� ��
��n
iavgiRMS pp
np
1
21 (2)
��
�n
iiavg p
np
1
1 (3)
The quantity avgp is the average pressure over the sample window, and the value n is the
number of measurements in the window. The RMSp calculation uses a sample window equivalent to one second of pressure values, ending with the sample of interest. The window shifts by one sample, continuously adding the newest data point and discarding the oldest.
The frequency content of the acoustic measurements was observed through PSD analysis. PSD was estimated using Welch’s method (ref. 7). Welch’s method splits the data into overlapping segments, computes modified periodograms of the overlapping segments via a fast Fourier transform (FFT), and averages the resulting periodograms to produce the PSD estimate. Similar to SPL calculations, the sample window size was equivalent to one second of samples. The full data set was divided into an integer number of segments whose size was equal to the sample window size with overlap equal to 32 samples. Each segment was windowed with a Hanning window. The number of points used in the FFT was the next power of two greater than the length of the segment size. For PSD analysis, the oscillatory pressure values, ACp , relative to the sample window average were used instead of absolute measurements for the ith measurement in the window, as shown in equation (4).
� avgiiAC ppp �� (4)
Stability and Control
Standard parameter estimation techniques (ref. 8 and 9) were used to determine the stability and control derivatives of the SOFIA airplane. The primary tool used for parameter estimation was a program called pEst (ref. 10). Cramér Rao bounds, approximations of the estimated parameter variances, were used to provide a relative assessment of the accuracy of the results(ref. 8). The goal of the parameter estimation work was to determine if the modifications to the airplane negatively impacted its stability and the effectiveness of its control surfaces. Of particular interest were the effects on the elevator and rudder surfaces and the changes in directional stability.
Flight data from the baseline flight phase were obtained, so that parameter estimation work could be performed for the unmodified airplane. The analysis was performed between Segments 1 and 2 of the SOFIA flight tests. The maneuvers used during the baseline flight phase consisted of three pulses in alternating directions, essentially doublets with an extra pulse tacked on. There were some variations in pulse lengths. Two maneuvers were flown at each flight condition during the baseline flights.
21
Doublets were the only maneuvers used for parameter estimation during the SOFIA flighttest phases. Longitudinal axis derivatives were estimated using pitch doublets. Lateral-directional derivatives were estimated using maneuvers that consisted of a yaw doublet immediately followed by a roll doublet. Maneuvers were typically performed in sets of three to provide repeatability. During Segment 2, the starting directions of the yaw-roll doublets were alternated for each repeat, as a way to potentially indicate asymmetries in the aerodynamics.
Air Data
The production pitot-static system was calibrated through a series of constant pressurealtitude accelerations and constant pressure altitude decelerations. The accelerations and decelerations were performed at multiple altitudes for various Mach number ranges. The acceleration maneuvers included tower flybys flown approximately 500 ft above the ground past an instrumented tower. These flybys provided more accurate calibration data due to the proximity to the tower sensors, the ability to get meteorological measurements at one-minute intervals, and the accuracy of the tower sensors. Meteorological data from sounding balloons and tower instrumentation were used to calculate free stream static pressure at the airplane flight altitude, which was provided by a differential GPS. This true static pressure was used along with data from the production pitot-static system to create static-position error correction curves (ref. 11).
The FADS system needed to be calibrated to account for differences in the effective angles of attack and sideslip and the true � and � (ref. 12). These calibrations were done by comparing FADS flow angle estimates to calculated parameters created by blending wind measurements and inertial data, usually for specific maneuvers. For the purposes of calibration, the blended solutions were considered to be truth data. Pull up, push over (PUPO) maneuvers were used for angle of attack calibration because they provided a range of � for relatively constant Mach and altitude. Wings-level angle of sideslip sweep maneuvers (typically referred to as beta sweeps) were used to provide good data for � calibration. The truth values to which the FADS results are calibrated came from GPS or inertial data that were corrected with wind information.
FLIGHT-TEST RESULTSThroughout Segments 0, 1, and 2, 35 flights were completed to expand the flight envelope
for the SOFIA airplane and collect data to clear the airplane for operational service. Substantial data were collected in the areas of acoustics, stability and control, and air data.
Acoustics
Acoustics data were collected throughout the SOFIA airplane’s flight envelope, over the full range of AA/TA elevations, at various URD positions during Segment 2 flights. These data were used to characterize the cavity acoustic environment throughout the flight envelope. Acoustics will be discussed with respect to factors affecting overall SPL, the characteristics of PSDs at various locations, and other areas of interest during the flights. The areas that will be discussed are the TA spider arms, the URD, the LFD, the AA, and the cavity walls.
Flight Condition Effects on Sound Pressure LevelA series of test points were flown throughout envelope expansion during Segment 2 to
characterize the acoustic field within and around the cavity at science observation flight conditions and off-design conditions. Any flight conditions or cavity configurations that resulted

22
in acoustic resonance or any other risk to the structures in and around the cavity needed to be identified. During normal aircraft operations (i.e. steady climb, cruise, and descent) there were no acoustic anomalies experienced within the cavity. As expected, pressure levels generally increased with dynamic pressure, showing an increase with Mach number at constant altitude and a decrease with altitude at a constant Mach.
The TA spider arm sensors experienced an average SPL that varied between 120 and 131 dB, with the highest average SPL occurring at a flight condition of an altitude of 15,000 ft and Mach 0.59. The aft spider arm sensors, PA8365 and PA8362 in figure 10, consistently registered the highest SPL of all the spider arm sensors. These two sensors had the most interaction with the cavity shear layer due to their location further aft of the cavity leading edge.
The average SPL on the internal URD varied between 124-137 dB while the average SPL of the internal LFD varied between 118-128 dB. Two of the URD sensors displayed interesting behavior at various flight conditions. Sensor PA8027, located at the center top of the URD, registered up to 146 dB at the highest dynamic pressure test point (Mach 0.69, 15,000 ft). This sensor was exposed to the flow on the starboard portion of the fuselage behind the forward fairing when the URD was open. The right inboard LFD sensor (PA8267) consistently registered the highest SPL of all of the internal LFD sensors.
The AA ramp is exposed to the flow when the URD is open and serves as the reattachment region for the cavity shear layer. As expected, the highest SPL of all of the surfaces were observed on the AA. The average SPL on the AA ramp ranged from 143-155 dB duringSegment 2 envelope expansion. The aft surface of the ramp typically displayed the highest SPL, with individual sensors approaching 161 dB at the altitude of 15,000 ft and Mach 0.69 flight condition. As stated previously in the Measurements section, the AA was instrumented with a combination of 200 and 1000 Hz bandwidth sensors. The energy content due to the additional bandwidth was determined to be, on average, 0.4-1.4 dB or roughly 0.13-0.45-percent of the average SPL using all 16 sensors. Since the energy content due to the additional bandwidth was negligible, no filtering was applied to the 1000-Hz bandwidth sensors when they were averaged with the 200-Hz bandwidth sensors.
Measurements on cavity walls as a whole did not demonstrate an adverse acoustic atmosphere. The average SPL level of the cavity walls was generally just above the base noise level of the sensors shown in table 1, less than 123 dB; however, there exists a region within the cavity that is referred to as the “hot spot” due to the high SPL levels it experienced in relation to the rest of the cavity. Unsurprisingly, the hot spot was located on the aft bulkhead portion of the cavity walls, closest to the side of the URD. The sensors located in this area were PA8385, PA8389, PA8386, and PA8406, as seen in figure 9. With the URD 100-percent open, the highest average SPL across the entire bulkhead was about 127 dB. This occurred at flight conditions of a 15,000-ft pressure altitude and Mach 0.69, with the AA at an elevation of 23º. Atthese same conditions, however, the hot spot experienced an average 133 dB. At nominal scientific observation conditions (Mach 0.85, 42,000 feet, URD at 100%), the highest SPL values occurred when the AA was at 57º. Figure 15 shows the average SPL at these conditions for two different AA settings. The hot spot is visible toward the upper right-hand part of the image. As the AA setting increases, the area of maximum SPL can be seen shifting slightly. Pressure levels never reached levels capable of causing damage during science observation conditions. For the purposes of this paper, an altitude of 42,000 ft and Mach 0.85 will be considered the nominal science observation flight condition.

23
(a) Aperture assembly = 30°.
(b) Aperture assembly = 57°.
Figure 15. Cavity aft bulkhead hot spot at the nominal science observation flight condition.
Figure 16 shows the change of SPL at the cavity hot spot due to flight conditions for AA settings of 23°, 40° and 57°. A moving average algorithm was used to fit the test point data so that the trends could be easily identified. An AA elevation of 57° typically resulted in the highest

24
SPL levels at any given flight condition; however, there is no discernable trend regarding smaller AA settings.
Figure 16. Sound pressure level versus Mach. Cavity hot spot, upper rigid door at 100-percent.
Prior to the open cavity door flight testing, several wind-tunnel tests had been done to predict the effects of flight condition on the cavity acoustic field. Figure 17 shows a comparison between data from the flights and scaled data from the final 7-percent-scale wind-tunnel test series (SOFIA document 05-N-19980415 – 001, “SOFIA V Design Validation Test Final Report”,dated April 15, 1998). While the absolute values from the test do not necessarily match the flight data, the trends are similar.

25
Figure 17. Scaled 7-percent wind-tunnel sound pressure level versus Mach. Cavity hot spot. Upper rigid door at 100-percent and aperture assembly at 23°.
Configuration Effects on Sound Pressure LevelsDifferent configurations and settings of the various SOFIA components changed the
acoustic characters inside and around the cavity. These different configurations included the position of the URD, elevation angle of the AA when aligned with the TA, and also the offset when the TA and AA were misaligned.
A comparison between the measured TA SPL and AA elevation for various flight conditions is shown in figure 18a. For a given flight condition, the SPL typically peaked at an AA elevation of 40º, and then decreased as the AA was moved to higher or lower elevations. The one exception to this trend was at the 15,000 ft, Mach 0.59 flight condition. At this test point the TA spider arm SPL peaked at an AA elevation of 50º. A similar comparison is shown in figure 18bbetween cavity wall SPL and AA elevation. For a given flight condition, the SPL typically reached its minimum at an AA elevation of 40 degrees, and then increased as the AA was moved to higher or lower elevations.

26
(a) Effects on telescope assembly spider arm sound pressure level.
(b) Effects on cavity wall sound pressure level.
Figure 18. Effect of aperture assembly setting on sound pressure level.
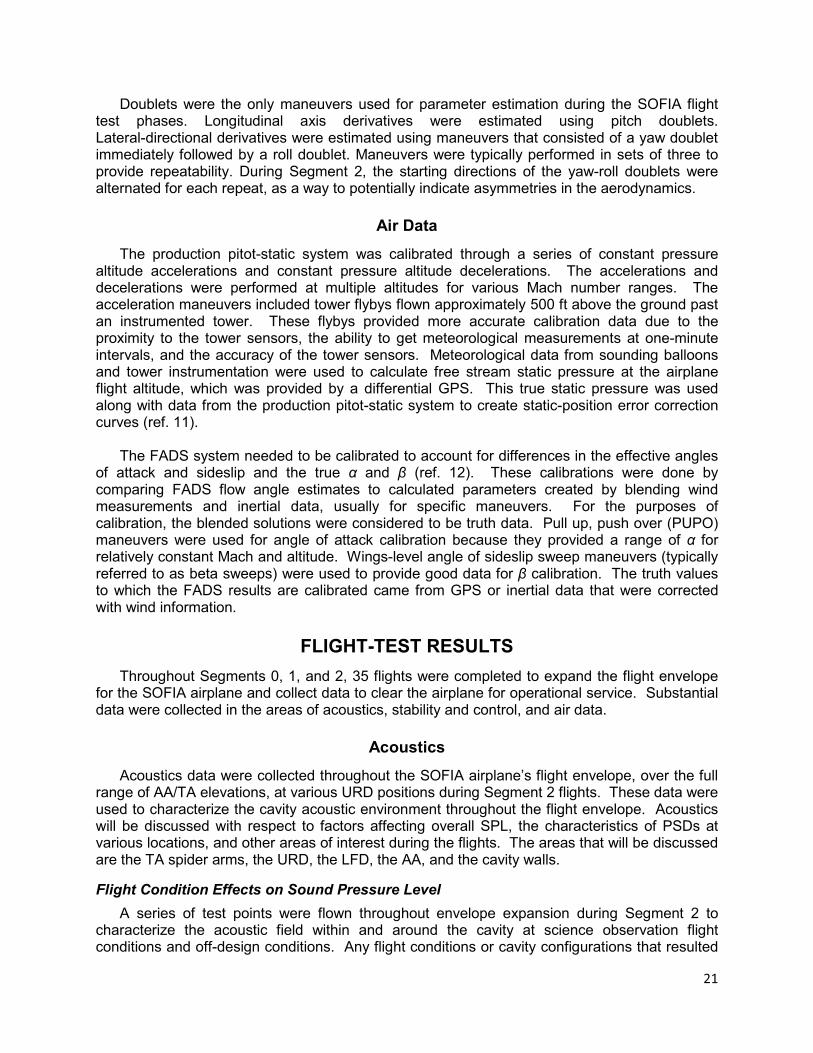
Figure 19 shows the TA SPL variation due to URD position. For AA elevations of 23 and 57º, the overall SPL increased by about 3 dB as the URD was moved from 10-percent to fully open. At an AA elevation of 40º, the SPL increased by about 6 dB.
27
Figure 19. Sound pressure level versus door opening for telescope assembly spider arms at the nominal scientific observation flight condition.
Extensive TA misalignment testing was performed at 35,000 ft over a Mach number range of 0.83-0.87. Two types of misalignment were studied: TA elevation angle and TA cross elevation. During the TA elevation misalignment points, the AA was parked at a constant elevation while the TA was moved to various elevations below and above the AA setting. As shown in figure 20, the overall SPL increased as the TA elevation was moved above the fixed AA elevation angle. The opposite effect occurred when the TA was moved to elevations below the AA elevation.

28
Figure 20. Telescope assembly spider arm sound pressure level variation due to telescope assembly misalignment at the nominal scientific observation flight condition.
The TA cross alignment testing involved both positive and negative cross elevation changes. Positive cross elevation displacement moved the TA further out into the cavity shear layer whereas negative cross elevation displacement moved the TA back into the cavity. At positive cross elevations, the overall spider arm SPL increased by roughly 1 dB; at negative cross elevations, the SPL decreased by about 1 dB.
Door position had a minor effect on the overall SPL of the URD and LFD. With regard to the URD, the overall SPL at 70-percent open was typically 2 dB higher than at URD full open. The LFD was least affected by the door position, showing a change of about 1 dB over the range of door positions tested.
The external AA showed sizeable variations in SPL for different door positions. As one might expect, the SPL increased as the URD opened because the external AA became exposed to the outside flow. As shown in figure 21, the overall SPL increased by about 11 dB as the AA was fully exposed to the outside air.

29
Figure 21. Sound pressure level versus door opening for the aperture assembly ramp at the nominal science observation flight condition.
Changes in door position for a given flight condition did not generally result in large changes in SPL within the cavity. SPL consistently increased with URD opening. A change of less than 5 dB between 10-percent and 100-percent was typical. SPL levels due to change in AA at those same conditions resulted in even less variance. Figure 22 shows the variation of SPL with change in door opening and AA elevation at an altitude of 42,000 ft and 0.85 Mach, nominal scientific observation flight conditions.

30
Figure 22. Sound pressure level versus door opening for the cavity hot spot at the nominal scientific observation flight condition.
Sideslip Effects on Sound Pressure LevelsVariations in angle of sideslip resulted in overall SPL changes for the cavity and other
surfaces, with some surfaces being affected more than the others. During sideslip maneuvers, positive sideslip placed the cavity on the lee side of the flow whereas negative sideslip placed the cavity on the upstream side of the flow. The highest SPL levels seen during sideslip maneuvers generally occurred at low-altitude, low-speed test points due to the ability to reach large sideslip angles. Sideslip angle effects were less prevalent at higher speeds and altitudes due to the smaller available sideslip.
Figure 23 shows the effect of sideslip angle on the overall spider arm SPL at nominal scientific observation conditions. The spider arm sensors for the 40º and 57º AA elevations displayed peaks of roughly 4 dB above baseline levels as the airplane sideslip angle changed from positive to negative. This peak was not present with the AA at its lowest elevation of 23º.

31
Figure 23. Telescope assembly spider arm sound pressure level variation with sideslip angle at the nominal scientific observation flight condition.
Figure 24 shows the variation in URD SPL with sideslip at nominal scientific observation conditions. At AA elevations of 23º and 40º, SPL increased with increasing sideslip angle. At 57º AA, there was virtually no change in overall SPL level with sideslip angle. Aircraft sideslip had only minor effects on the overall SPL of the internal LFD. Figure 25 shows the variation in SPL with sideslip at typical science observation conditions. A small increase of roughly 2 dB at positive sideslip angles is apparent for all three AA elevations.

32
Figure 24. Internal upper rigid door sound pressure level variation with sideslip angle at the nominal science observation flight condition.
Figure 25. Internal lower flexible door sound pressure level variation with sideslip angle at the nominal science observation flight condition.
The external AA experienced an increase in overall SPL of about 6 dB at the lower speed points (15,000 ft at Mach 0.33) during sideslip maneuvers. At a more typical cruise condition of 42,000 ft and Mach 0.85, the SPL variation due to sideslip was on the order of 2 dB, as shown

33
in figure 26. At this flight condition, both the 23º and 40º AA elevations showed an increase in SPL with sideslip whereas the 57º elevation showed a decrease in SPL with positive sideslip,and an increase in SPL with negative sideslip.
Figure 26. External aperture assembly sound pressure level variation with sideslip angle at the nominal scientific observation flight condition.
Figure 27 shows the effect sideslip angle had on the cavity hot spot at relatively low dynamic pressure flight conditions. For these flight conditions, off-baseline (non-zero) sideslip angles in both the positive and negative directions generally resulted in higher SPL, with the highest levels observed at maximum negative sideslip for AA settings above 30°, and highest levels observed at maximum positive sideslip for AA settings 30° and below. These test conditions provided the highest in-flight SPL in the cavity, with one sensor within the hot spot (PA8385) reaching just over 145 dB. There was no aircraft structural response to the 145 dB event. Figure 28 shows the pressure PSD of the event. As can be seen in the figure, there were no substantial frequency peaks during this event. The behavior of the cavity hot spot SPL with respect to angle of sideslip at a nominal science observation flight condition can be seen in figure 29. For this flight condition, angle of sideslip does affect SPL level, but the effects are not consistent for different AA/TA elevations.

34
Figure 27. Sound pressure level versus angle of sideslip for the cavity hot spot at an altitude of 15,000 ft and Mach 0.33.
Figure 28. Power spectral density analysis for negative sideslip for the cavity hot spot at an altitude of 15,000 ft and Mach 0.33.
35
Figure 29. Sound pressure level versus angle of sideslip for the cavity hot spot at the nominal science observation flight condition.
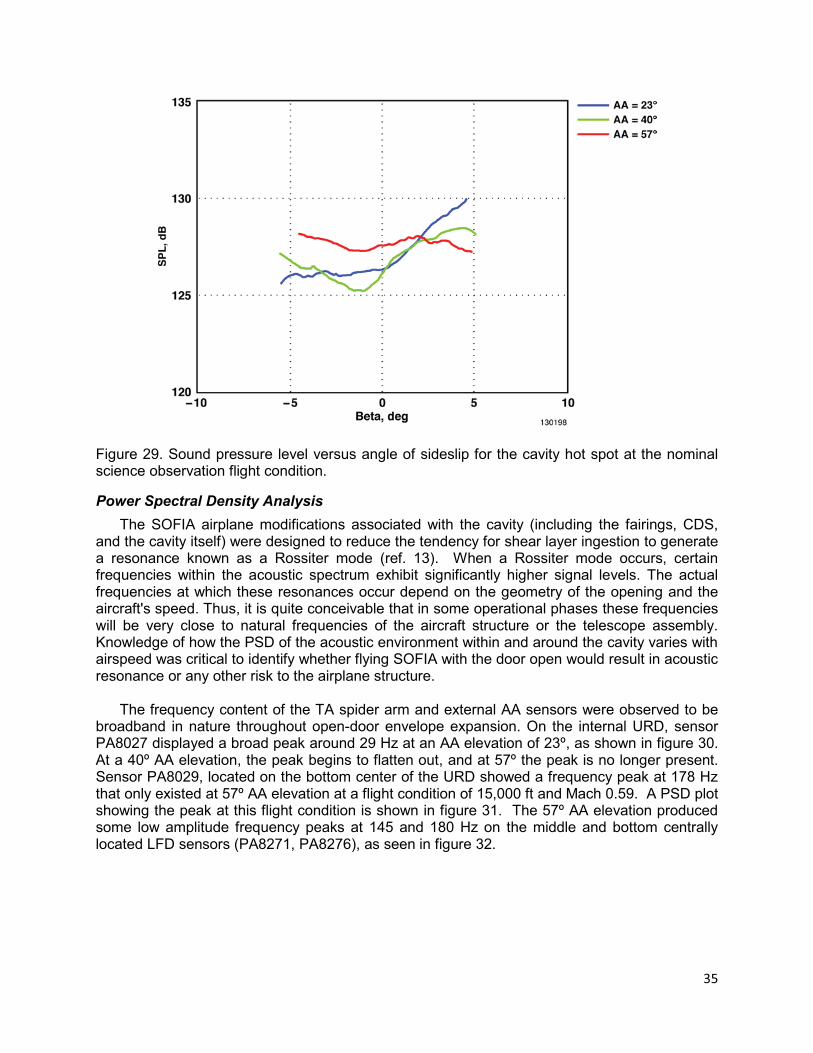
Power Spectral Density AnalysisThe SOFIA airplane modifications associated with the cavity (including the fairings, CDS,
and the cavity itself) were designed to reduce the tendency for shear layer ingestion to generate a resonance known as a Rossiter mode (ref. 13). When a Rossiter mode occurs, certain frequencies within the acoustic spectrum exhibit significantly higher signal levels. The actual frequencies at which these resonances occur depend on the geometry of the opening and the aircraft's speed. Thus, it is quite conceivable that in some operational phases these frequencies will be very close to natural frequencies of the aircraft structure or the telescope assembly. Knowledge of how the PSD of the acoustic environment within and around the cavity varies with airspeed was critical to identify whether flying SOFIA with the door open would result in acoustic resonance or any other risk to the airplane structure.
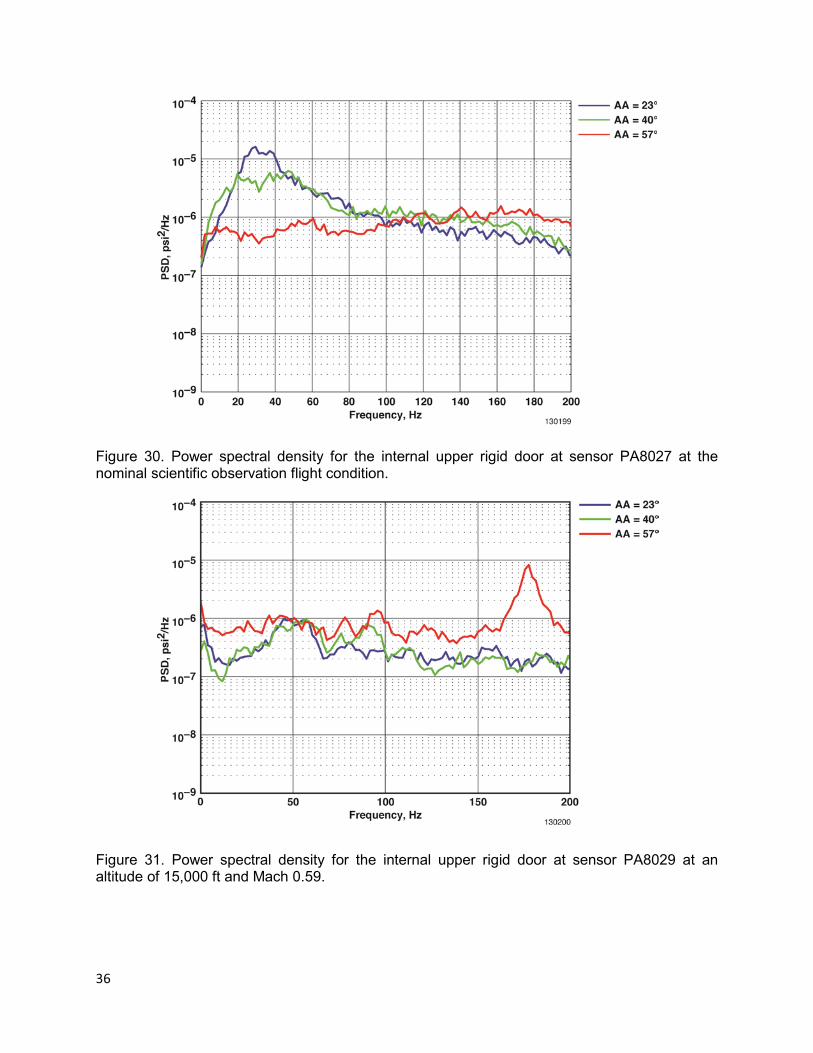
The frequency content of the TA spider arm and external AA sensors were observed to be broadband in nature throughout open-door envelope expansion. On the internal URD, sensor PA8027 displayed a broad peak around 29 Hz at an AA elevation of 23º, as shown in figure 30.At a 40º AA elevation, the peak begins to flatten out, and at 57º the peak is no longer present. Sensor PA8029, located on the bottom center of the URD showed a frequency peak at 178 Hz that only existed at 57º AA elevation at a flight condition of 15,000 ft and Mach 0.59. A PSD plot showing the peak at this flight condition is shown in figure 31. The 57º AA elevation produced some low amplitude frequency peaks at 145 and 180 Hz on the middle and bottom centrally located LFD sensors (PA8271, PA8276), as seen in figure 32.
36
Figure 30. Power spectral density for the internal upper rigid door at sensor PA8027 at the nominal scientific observation flight condition.
Figure 31. Power spectral density for the internal upper rigid door at sensor PA8029 at an altitude of 15,000 ft and Mach 0.59.

37
Figure 32. Power spectral density for lower flexible door sensor PA8276 at the nominal scientific observation flight condition.
Within the cavity, no tones that excited a structural response were discovered during open-door envelope expansion and flight testing. The frequency content observed within the cavity was generally broadband in nature for the majority of the flight conditions and cavity configurations. However, the 23° AA elevation occasional produced a low amplitude frequency peak at 42 Hz, pronouncedly located at the cavity hot spot. The peak was most prominent at a URD opening of 40-percent throughout the test envelope, and was even noticeable at a URD opening of 10-percent, at 42,000 ft and Mach 0.85. Figure 33 shows a comparison between broadband frequencies experienced at science observation conditions and the aforementioned peak at 42 Hz.

38
(a) Power spectral density for the nominal scientific condition.
(b) Power spectral density showing the 42 Hz peak at 23 deg aperture assembly elevation, 40-percent upper rigid door opening (unless otherwise noted).
Figure 33. Power spectral density analysis for the cavity hot spot.

39
Open-Door LandingsPrior to the planned open-door landing test points, the CDS system failed in an open
position on several occasions. Five open-door landings were executed due to URD malfunctions. Four occurred with an AA elevation of 23°. Of those four, two landings took place with the URD at 40 percent, while the other two were at 70 percent and 100 percent. Another open-door landing occurred with an AA elevation of 40° and the URD at nearly 100 percent.During each of the landings the cavity experienced a flow-induced resonance. Rossiter resonance occurred, beginning as the plane slowed to 140 knots calibrated airspeed (KCAS).The amplitudes were lower at the approach speed and had frequencies that were approximately 15-20 Hz. This corresponds to the second Rossiter mode. As the plane landed and rolled out, the speed was reduced further to approximately 70 KCAS and the frequencies dropped to approximately 7-8 Hz. This is the first Rossiter mode. Between 140 and 70 KCAS strong resonance and a transition in Rossiter modes were observed, with the SPL reaching a maximum value of 143 dB. PSD analysis is shown in figure 34 (ref. 2).
Figure 34. Power spectral density analysis of open-door landings for the cavity hot spot.
A maximum SPL of 143 dB was measured on the aft bulkhead. Figure 35 shows the variation in SPL as the airplane landed and decelerated (shown from right to left). Also shown is the theoretical maximum SPL that could be generated based on the acoustic energy available from dynamic pressure. The theoretical maximum SPL was calculated from equation (5).
���
���
�
refpqSPL
221log20 10max (5)

40
Figure 35. Sound pressure level versus Mach number during open-door landings for the cavity hot spot.
No structural response was noted during any of the open-door landings and the pilots reported no effects on the handling qualities of the airplane. With these five datasets it was determined that no planned open-door landings were necessary because the pressure variations during resonance are not able to increase significantly over what had already been observed due to the limited amount of flow energy available at low speeds and the phenomenon did not pose a danger to the aircraft structure or the observatory systems.
Additional Observations of InterestThe AA was designed as a shear layer control to reduce adverse acoustic effects within the
cavity. To quantify the effectiveness of the AA, the RMS of the pressure values within the cavity was normalized by the free stream dynamic pressure, as shown in equation (6):
qpesseffectivenaperture RMS� (6)
where RMSp is the unsteady pressure and q is the free stream dynamic pressure.
Figure 36 shows a comparison between the 7-percent-scale wind-tunnel tests for the final configuration and actual flight data. The moving average, shown in the figure as a blue line, illustrates very good agreement with the wind tunnel data.
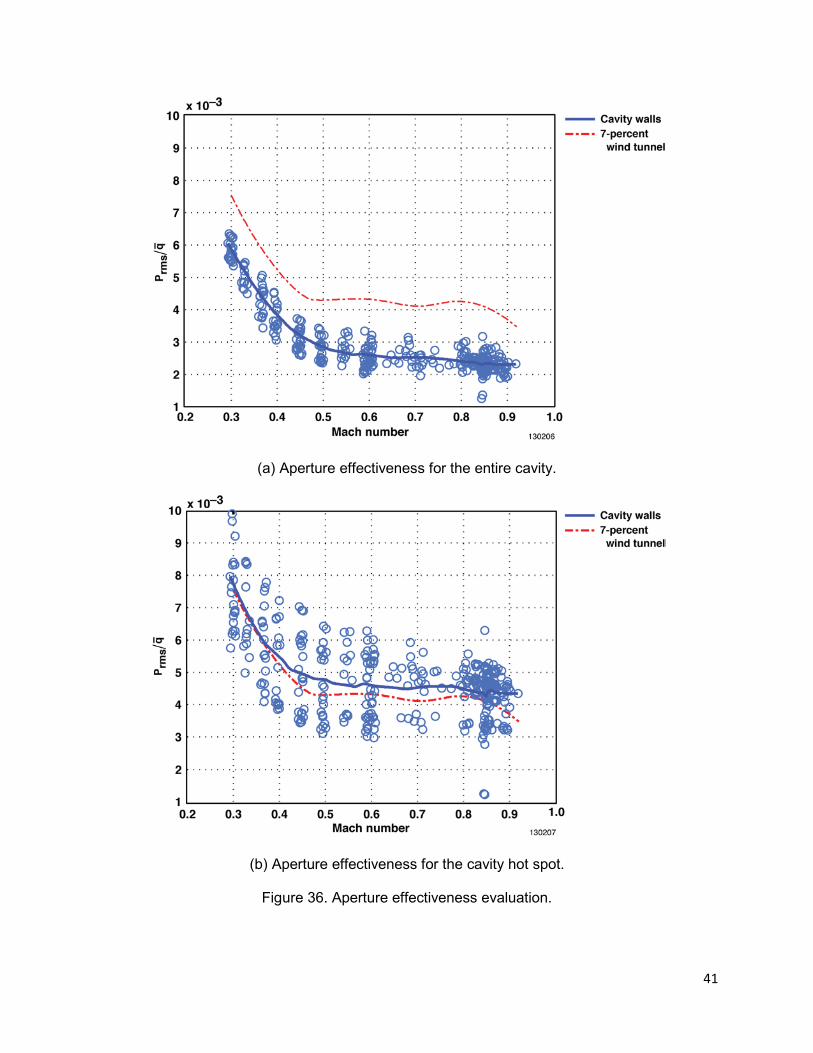
41
(a) Aperture effectiveness for the entire cavity.
(b) Aperture effectiveness for the cavity hot spot.
Figure 36. Aperture effectiveness evaluation.

42
Stability and Control
As mentioned above, stability and control parameter estimation was performed in order to determine whether the modifications to the SOFIA airplane affected its aerodynamic characteristics. Parameter estimation maneuvers were performed throughout the flight envelope and at a wide range of AA/TA elevations and URD positions. In general, the SOFIA modifications were found to not have a substantial effect on the stability and control characteristics of the airplane. A few parameters showed changes between different flight segments and airplane configurations. Scatter in the parameter estimates made it difficult to discern if trends were present.
Some problems were encountered during the analysis due to correlation between the ailerons and spoilers. Since it was expected that neither of those controls would be affected bythe SOFIA modifications, errors in their derivative estimates due to correlation were not of concern. It was found, however, that including or omitting the spoiler derivatives from the analysis actually influenced the other parameters. Results were better when side force and yawing moment derivatives due to spoilers were not estimated. At high speeds, results were better with a rolling moment due to spoilers term in the set of estimated parameters than without; at low speeds, the results varied. After much consideration, a method of selecting the best results on a case-by-case basis for low speeds was developed, using the Cramér-Rao bounds and the scatter in the results as guides.
One concern raised prior to flight-testing was the possibility of nonlinear or asymmetric aerodynamic effects during open-door flight. During the parameter estimation analysis, nonlinear stability derivatives, such as �3 terms, were found to not have any significance to the aerodynamic model. Estimates of nonlinear terms had no trends or consistency, so there was no confidence in them. It is possible that the doublet maneuvers were of small enough magnitude to not encounter any nonlinearity due to the SOFIA modifications.
The starting direction of the maneuvers did not have a noticeable effect on the estimated stability and control derivatives, with the exception of
�lC . It was not clear whether the results
were an indication of an actual dependence on direction, or merely coincidental. The effect was slight and the derivative itself was not of much concern for this project. The effect was seen with the door closed and with the door open.
Some of the parameter estimation results are highlighted below. When plotted, the results from each maneuver set have been combined using a weighted average based on their Cramér-Rao bounds. Each point is accompanied by asymmetric error bounds that indicate the scatter in the set for that maneuver set, corresponding roughly to a 95-percent confidence interval in each direction. The confidence intervals are derived from the scatter in the results and the Cramér-Rao bounds of each original parameter estimate. Comparison data in the plots are shown as trend lines and 95-percent confidence regions that come from the same blending process as the symbols.
The reference area, span and chord of the airplane are 5500 ft2, 195.68 ft, and 27.31 ft, respectively. The moment reference point of the airplane was fuselage station 1339.92 and water line 199.8.

43
Differences Between Flight SegmentsWhile Segment 2 was focused on open-door testing, some closed-door test points were also
performed. Most of the closed-door test points were at Mach 0.5 and below, with one point at Mach 0.6. Some of the closed-door parameter estimation results from Segment 2 disagreed with the results of Segment 1.
Some slight differences were seen in the estimates of �n
C and�m
C from each segment.
The Segment 2�m
C results at Mach 0.6 fit the trend from Segment 1 fairly well, but the results
at lower Mach numbers have a larger magnitude than those from Segment 1. For �n
C , thedifferences were seen in the range of approximately Mach 0.45 to Mach 0.5, where the Segment 2 results were of a smaller magnitude than Segment 1. The Segment 2 results continue the trend of both segments at Mach numbers below 0.45, however.
The biggest differences between Segment 1 and Segment 2 results were in the estimates of
rnC . Figure 37 shows the estimates of
rnC for Segments 1 and 2, in comparison to a
confidence region based on the estimates for the baseline aircraft (i.e. the estimates from the flight tests performed by KSR on the unmodified 747SP airplane). As the figure shows, the Segment 2 results were of a much higher magnitude than the ones from Segment 1. At low Mach numbers, the results for the baseline aircraft were in between the two segments.
Figure 37. Estimates of ��� for closed-door configuration.
The differences in the results could not be attributed to any internal change made to the airplane between flight segments, and no major external changes were made to the airplane between segments. It is speculated that differences in maneuver style may be responsible for the different results. In an effort to get more data content, Segment 2 maneuver inputs were generally larger in amplitude than those of Segment 1. They were also shorter in duration,

44
however, leading to a different input frequency. It is possible that rn
C , in particular, could have a dependence on frequency. Another potential problem is that the shorter maneuvers were at a frequency much higher than the airplane’s natural frequency, which resulted in less response from the vehicle and, consequently, less information for parameter estimation. As such, the Segment 2 results could have been of lower quality than those of Segment 1 – a conclusion that is supported by the larger error bounds on the Segment 2 results.
Closed-Door Results
Figure 38 shows estimates of demC for the closed-door configuration, compared to the trend
and confidence region for the baseline airplane. For the most part, the closed-door results fit within the baseline confidence region. Below Mach 0.75, the closed-door estimates were slightly lower in magnitude than the baseline trend. In the region of Mach 0.75 to Mach 0.9, the closed-door results showed considerably more scatter than at low speeds. Many of the high-speed results fell below the baseline confidence region, corresponding to a more effective elevator. All together, the closed-door
demC estimates suggest that the elevator effectiveness was not significantly reduced by the external modifications to the airplane.
Figure 38. Estimates of ����for closed-door configuration.
Estimates of �n
C are shown in figure 39, with different symbols corresponding to different flap deflections. Baseline data trends are separated by flap deflection, as well. The closed-door
�nC estimates had significant scatter, particularly at low speeds, as indicated by the large error bars. Below Mach 0.7, the estimates fell predominantly within the baseline confidence region, though the flap trends did not match. The Segment 2 closed-door points between Mach 0.4 andMach 0.5 were considerably lower than the baseline data. At high speeds, the closed-door

45
results were fairly consistent with each other and trended lower than the baseline data, suggesting a potential reduction in
�nC due to the modifications to the airplane.
Figure 39. Estimates of ��� for closed-door configuration.
Figure 40 shows estimates of the rudder effectiveness derivative,drn
C . At low and high speeds, the closed-door results agreed well with the baseline data. In the middle of the speed range, the baseline data showed a reduction in the magnitude of
drnC that the closed-door
results did not show. The closed-door data had a relatively well-behaved Mach number trend. It was concluded that the external modifications to the vehicle did not reduce the effectiveness of the rudder.
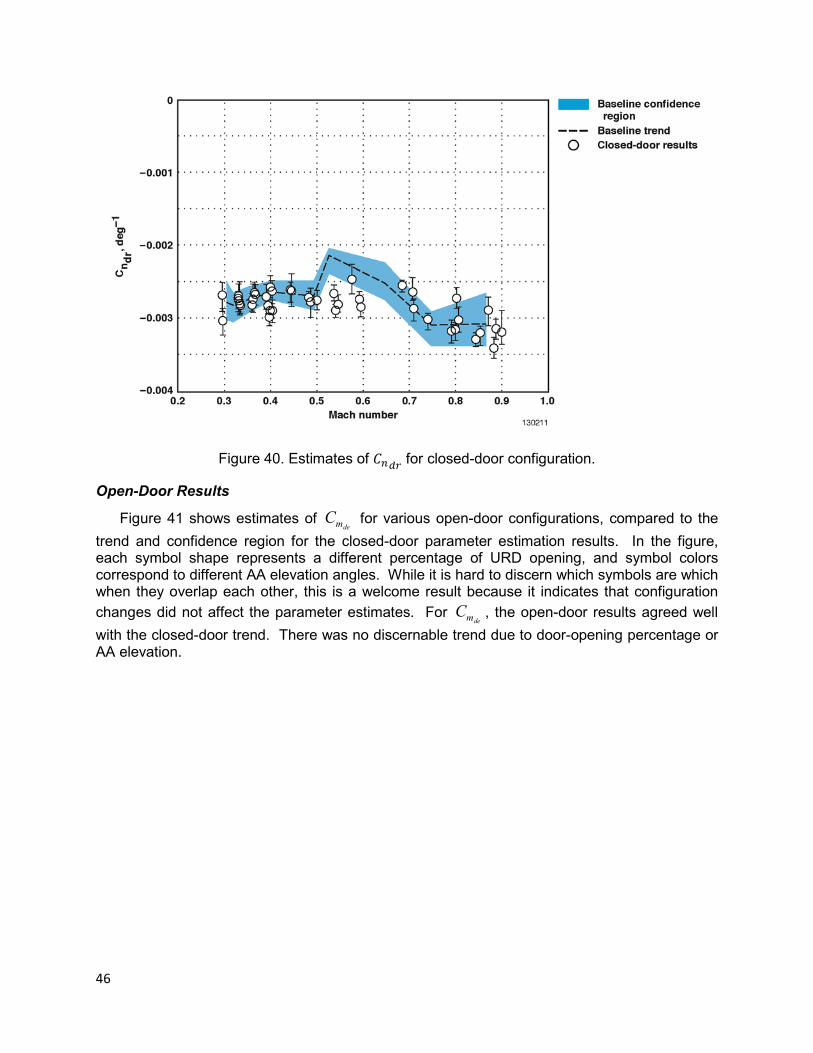
46
Figure 40. Estimates of ���� for closed-door configuration.
Open-Door Results
Figure 41 shows estimates of demC for various open-door configurations, compared to the
trend and confidence region for the closed-door parameter estimation results. In the figure, each symbol shape represents a different percentage of URD opening, and symbol colors correspond to different AA elevation angles. While it is hard to discern which symbols are which when they overlap each other, this is a welcome result because it indicates that configuration changes did not affect the parameter estimates. For
demC , the open-door results agreed well with the closed-door trend. There was no discernable trend due to door-opening percentage orAA elevation.

47
Figure 41. Estimates of ����for open-door configurations.
Open-door estimates of �n
C are shown in figure 42. In general, the open-door results agree with the closed-door confidence region, but the scatter associated with the open-door points ishigher. Scatter was particularly high at higher Mach numbers, not only for different vehicle configurations, but also among the set of maneuvers at each test point, as shown by the error bars. It is difficult to conclude whether this is due to open-door aerodynamic changes, or related to the maneuver differences speculated to have caused the discrepancy between the Segment 1 and Segment 2 results. The scatter also makes it hard to tell if there are any patterns in the results with respect to URD position and AA elevation; there do not appear to be any consistent patterns. The open-door
�nC estimates tended to be lower than the closed-door estimates,
indicating a slight reduction in directional static stability, in addition to the reduction seen when going from the baseline airplane to the closed-door SOFIA configuration.

48
Figure 42. Estimates of ��� for open-door configurations.
Figure 43 shows the drn
C estimates for the open-door configurations. Again, there was more scatter in the open-door results than for the closed-door. The open-door estimates, however,generally agreed well with the closed-door estimates. Some of the scatter at high speeds moved the estimates to an area of lower effectiveness than the closed-door data. Overall, there did not seem to be a significant loss of rudder effectiveness due to having the cavity door open.
Figure 43. Estimates of ���� for open-door configurations.

49
Figure 44 shows the open door estimates of rn
C . Due to the differences in the results between the two flight segments, the closed-door trends have been broken up by flight segment. It can be seen that the open-door results agree more with the Segment 2 closed-door results than those of Segment 1. The scatter in the open-door results is large, however, particularly at high-speeds. Again, it is hard to determine if the behavior of the results is due to flow disturbances caused by the open door, or if it is due to the maneuvers that were used. Fortunately, with a few exceptions, the open-door
rnC estimates are higher in magnitude than
the closed-door results of Segment 1. While the data quality is not optimal, the results indicate that yaw damping was not reduced when the URD was opened.
Figure 44. Estimates of ��� for open-door configurations.
Throughout the open-door flight tests, the pilots were generally unable to discern a change in handling qualities between flight with the cavity door open and flight with the cavity door closed. This reinforced the conclusion that, while there were some changes as a result of the modification, they are not significant.
Air Data
Air data systems for the SOFIA airplane were calibrated during Segment 1 and Segment 2 flights. Once calibrations for the closed-door configuration were created, possible effects on the systems due to the open-door configuration were investigated.
Pitot-Static SystemPitot-static calibration maneuvers were flown in open- and closed-door configurations, with
various AA/TA elevations flown during the open-door flights. After an analysis of all of the data from these maneuvers, it was found that the airplane’s pitot-static system was not affected by the various open-door configurations. Figure 45 summarizes the findings from this analysis.

50
This figure shows the closed-door calibration with a two standard deviation uncertainty bound for the closed-door along with curves (and single points from steady-state data) for open-door configurations. The calibration curves were created by plotting Mach correction as a function of indicated Mach. While a more accurate calibration could be created by including indicated static pressure into the calibration, the terms used in this calibration are consistent with the calibrations curves used by Boeing for 747 airplanes. As figure 45 illustrates, all of the open-door configurations fall within the uncertainties for the closed-door configuration. The data from these calibrations was also used in verifying that the airplane complied with RVSM requirements in both closed- and open-door configurations.
Figure 45. Comparison of the calibration curves for closed- and open-door configurations.
FADS SystemCalibration of the FADS system was performed for the SOFIA airplane at different AA/TA
elevations and different URD positions. Configuration changes were found to not have a noticeable effect on the FADS system. The calibration was somewhat dependent on Mach number, though acceptable models for angle of attack and sideslip measurements could be created using constant bias and scale terms. Flap position was found to influence the angle of attack bias.
It was found that the FADS-calculated flow angles appeared to lag the truth data. The lags were too large to be pneumatic in nature; for example, most were between 0.2 and 0.3 seconds for angle of attack. For sideslip angle, the lags were typically around 0.4 seconds. It was speculated that the apparent lags could be due to the time it takes the flow around the airplane to adapt to the vehicle’s motion, or the result of additional flow angle components due to the motion of the airplane’s nose. A cause for the behavior could not be conclusively determined. It was found, however, that the apparent lags could be nearly removed by using pitch and yaw rate terms in the calibration models.

51
CONCLUSIONThe Stratospheric Observatory for Infrared Astronomy (SOFIA) is an airborne astronomical
observatory developed through a partnership between NASA and Germany’s Deutsches Zentrum fur Luft- und Raumfahrt (DLR) (Cologne, Germany). The SOFIA airplane is a modified 747SP airplane (The Boeing Company, Chicago, Illinois) carrying an optical/infrared/sub-millimeter reflecting telescope with an effective diameter of 2.5 m. The observatory was designed to perform observations between the altitudes of 35,000 ft and 45,000 ft, where it is above 99 percent of the water vapor in the atmosphere.
The airplane was modified for use as an observatory by installing the telescope and associated equipment in the aft section of the airplane. To provide maximum optical performance, an open-air cavity was created, and a door system was installed. To clear the airplane, and the observatory as a whole for its mission, a substantial flight envelope expansion process was necessary. The structural integrity of the modified airplane had to be verified. The acoustic environment inside the cavity had to be characterized to ensure that acoustic levels remained below design limits, both to prevent structural fatigue and to allow the observatory to meet image quality requirements. The stability and controllability of the modified airplane also had to be evaluated, both in closed-door and open-door configurations. The production pitot-static system’s calibrations had to be verified, and the research air data system had to be calibrated. In addition, all of the new systems installed to support the telescope and the observatory had to be tested and their functionality verified.
Three flight test segments were performed. Segment 0 consisted of envelope clearance for a ferry flight to NASA Dryden Flight Research Center (Edwards, California). Segment 1 was performed to clear the closed-door envelope. Segment 2 consisted of open-door envelope clearance and checkout of various observatory systems. Major concerns during these flight segments included acoustic resonance during open-door operations, possible effects on stability and control of the airplane and possible effects on air data systems.
To address acoustic concerns, the cavity was thoroughly instrumented with pressuresensors. Analysis performed on the data from these sensors identified overall acoustic levels in the cavity as well as frequencies of interest. Standard flight-test methods were used to investigate the areas of pitot-statics, and stability and control.
In the area of acoustics, there were no significant cavity tones at scientific observation flight conditions; the only substantial cavity tone was found during open-door landings. This tone,however, does not excite the cavity structure or TA components. During sideslip maneuvers at certain flight conditions, the SPL rose above set limits, but the frequency content was broadband in nature, and posed no danger to any airplane structures. The cavity behavior compared favorably with the 7-percent-scale wind-tunnel results. In fact, the actual measured cavity acoustics were even more benign than the 7-percent-scale wind-tunnel results suggested.
The stability and control characteristics of the 747SP airplane were not significantly affected by the SOFIA modifications, regardless of configuration. There was, however, a general increase in data scatter for results from the open-door configuration flights. It is thought that at least some of the increased scatter is due to maneuver technique. There was a possible reduction in
�nC in the closed-door configuration, when compared to baseline results, and in the
open-door configuration, when compared with the closed-door results.

52
The air data systems of the SOFIA airplane were not affected by the SOFIA modifications. No effects were seen in the airplane’s pitot-static system. The airplane was cleared for RVSM operations. The FADS system was also unaffected by the open-door configuration. The FADS system did have a persistent lag associated with estimates for angle of attack and angle of sideslip. The specific cause of this lag has not been identified.
In conclusion, from an aerodynamics and acoustics standpoint, the performance of the SOFIA airplane was better than predicted. There are no outstanding aerodynamics or acoustics problems, and the airplane is cleared, from an aerodynamics and acoustics perspective, for full-envelope science operations.

53
REFERENCES1. Thronson, Harley A., Jr. and Erickson, Edwin F., Airborne Astronomy Symposium,
NASA/CP-2353, 1984.
2. Rose, William C., SOFIA TA Cavity Aerodynamics: Wind Tunnel to Flight, NASA CR, TBD, TBD.
3. Knuz, Nans, “The SOFIA Aircraft and its Modification,” Proceedings of SPIE Vol. 4857, 2003.
4. Kehoe, Michael W. etc., Stratospheric Observatory for Infrared Astronomy (SOFIA) Acoustical Resonance Technical Assessment Report, NASA/TM-2009-215730, 2009.
5. Srinivasan, G. R., “Flowfield and Acoustic Characteristics of Telescope Cavity in SOFIA Platform,” AIAA-95-1862, 1995.
6. Klotz, Stephen P. “Numerical Simulation of the SOFIA Flow Field,” NASA/CR-197757, 1995.
7. Welch, P.D., “The Use of Fast Fourier Transform for the Estimation of Power Spectra: A Method Based on Time Averaging Over Short, Modified Periodograms,” IEEE Transactions on Audio Electroacoustics, AU-15, 70–73, 1967.
8. Maine, R. E. and Iliff, K. W., “Application of Parameter Estimation to Aircraft Stability and Control, The Output Error Approach,” NASA/RP-1168, 1986.
9. Morelli, E. A., “Practical Aspects of the Equation-Error Method for Parameter Estimation,”AIAA-2006-6144, 2006.
10. Murray, James E., and Richard E. Maine, pEst Version 2.1 User’s Manual,NASA/TM-88280, 1987.
11. Haering, Edward A., Jr., “Airdata Calibration of a High-Performance Aircraft for Measuring Atmospheric Wind Profiles,” NASA/TM-101714, 1990.
12. Whitmore, S. A., Cobleigh, B. R., and Haering, E. A., “Design and Calibration of the X-33 Flush Airdata Sensing (FADS) System,” NASA/TM-1998-206540, 1998.
13. Rossiter, J. E., “Wind Tunnel Experiments on the Flow over Rectangular Cavities at Subsonic and Transonic Speeds,” Aeronautical Research Council Reports and Memo No. 3438, 1964.