Aerodynamic Analysis of the Truss-Braced Wing … · Using Vortex-Lattice Superposition Approach...
16
Aerodynamic Analysis of the Truss-Braced Wing Aircraft Using Vortex-Lattice Superposition Approach Eric Ting ∗ Stinger Ghaffarian Technologies Inc., Moffett Field, CA 94035 Kevin Reynolds † NASA Ames Research Center, Moffett Field, CA 94035 Nhan Nguyen ‡ NASA Ames Research Center, Moffett Field, CA 94035 Joseph Totah § NASA Ames Research Center, Moffett Field, CA 94035 The SUGAR Truss-Braced Wing (TBW) aircraft concept is a Boeing-developed N+3 aircraft configuration funded by NASA ARMD Fixed Wing Project. This future generation transport aircraft concept is designed to be aerodynamically efficient by employing a high aspect ratio wing design. The aspect ratio of the TBW is on the order of 14 which is significantly greater than those of current generation transport aircraft. This paper presents a recent aerodynamic analysis of the TBW aircraft using a conceptual vortex-lattice aerodynamic tool VORLAX and an aerodynamic superposition approach. Based on the underlying linear potential flow theory, the principle of aerodynamic superposition is leveraged to deal with the complex aerodynamic configuration of the TBW. By decomposing the full configuration of the TBW into individual aerodynamic lifting components, the total aerodynamic characteristics of the full configuration can be estimated from the contributions of the individual components. The aerodynamic superposition approach shows excellent agreement with CFD results computed by FUN3D, USM3D, and STAR-CCM+. I. Introduction Demand for green aviation is expected to increase with the need for reduced environmental impact. Most large transports today operate within the best cruise L/D range of 18-20 using the conventional tube-and-wing design. This configuration has led to marginal improvements in aerodynamic efficiency over this past century, as aerodynamic im- provements tend to be incremental. A big opportunity has been shown in recent years to significantly reduce structural weight or trim drag, hence improved energy efficiency, with the use of lightweight materials such as composites. The Boeing 787 transport is an example of a modern airframe design that employs lightweight structures. High aspect ratio wing design can provide another opportunity for further improvements in energy efficiency. Historically, the study of high aspect ratio wings has been intimately tied to the study of aeroelasticity and flutter. These studies have sought to develop tools and methods to analyze aeroelastic effects by laying the foundation for more modern high aspect ratio wing aircraft such as the Truss-Braced Wing (TBW). 1–3 Originally suggested by Northrop Grumman for the development of a long-range bomber, the idea of using truss structures to alleviate the bending moments of an ultra-high aspect ratio wing has culminated in more than a decade of work focused on understanding the aeroelastic properties and structural weight penalties due to the more aerodynamically efficient wing. The Subsonic Ultra Green Aircraft Research (SUGAR) Truss-Braced Wing (TBW) aircraft concept is a Boeing- developed N+3 aircraft configuration funded by NASA ARMD Fixed Wing Project. 4, 5 The TBW aircraft concept is designed to be aerodynamically efficient by employing an aspect ratio on the order of 14, which is significantly greater than those of conventional aircraft wings. As a result, intermediate structural supports are required. The main wings ∗ Stinger Ghaffarian Technologies Inc., NASA Ames Research Center, Research Engineer, [email protected] † NASA Ames Research Center, Aerospace Engineer, [email protected] ‡ NASA Ames Research Center, Research Scientist, AIAA Associate Fellow, [email protected] § NASA Ames Research Center, Research Scientist, AIAA Associate Fellow, [email protected] 1 of 16 American Institute of Aeronautics and Astronautics https://ntrs.nasa.gov/search.jsp?R=20140011160 2018-09-02T21:43:29+00:00Z
Transcript of Aerodynamic Analysis of the Truss-Braced Wing … · Using Vortex-Lattice Superposition Approach...

Aerodynamic Analysis of the Truss-Braced Wing AircraftUsing Vortex-Lattice Superposition Approach
Eric Ting ∗
Stinger Ghaffarian Technologies Inc., Moffett Field, CA 94035Kevin Reynolds †
NASA Ames Research Center, Moffett Field, CA 94035Nhan Nguyen ‡
NASA Ames Research Center, Moffett Field, CA 94035Joseph Totah §
NASA Ames Research Center, Moffett Field, CA 94035
The SUGAR Truss-Braced Wing (TBW) aircraft concept is a Boeing-developed N+3 aircraft configurationfunded by NASA ARMD Fixed Wing Project. This future generation transport aircraft concept is designed tobe aerodynamically efficient by employing a high aspect ratio wing design. The aspect ratio of the TBW is onthe order of 14 which is significantly greater than those of current generation transport aircraft. This paperpresents a recent aerodynamic analysis of the TBW aircraft using a conceptual vortex-lattice aerodynamic toolVORLAX and an aerodynamic superposition approach. Based on the underlying linear potential flow theory,the principle of aerodynamic superposition is leveraged to deal with the complex aerodynamic configuration ofthe TBW. By decomposing the full configuration of the TBW into individual aerodynamic lifting components,the total aerodynamic characteristics of the full configuration can be estimated from the contributions of theindividual components. The aerodynamic superposition approach shows excellent agreement with CFD resultscomputed by FUN3D, USM3D, and STAR-CCM+.
I. Introduction
Demand for green aviation is expected to increase with the need for reduced environmental impact. Most large
transports today operate within the best cruise L/D range of 18-20 using the conventional tube-and-wing design. This
configuration has led to marginal improvements in aerodynamic efficiency over this past century, as aerodynamic im-
provements tend to be incremental. A big opportunity has been shown in recent years to significantly reduce structural
weight or trim drag, hence improved energy efficiency, with the use of lightweight materials such as composites. The
Boeing 787 transport is an example of a modern airframe design that employs lightweight structures. High aspect ratio
wing design can provide another opportunity for further improvements in energy efficiency.
Historically, the study of high aspect ratio wings has been intimately tied to the study of aeroelasticity and flutter.
These studies have sought to develop tools and methods to analyze aeroelastic effects by laying the foundation for more
modern high aspect ratio wing aircraft such as the Truss-Braced Wing (TBW).1–3 Originally suggested by Northrop
Grumman for the development of a long-range bomber, the idea of using truss structures to alleviate the bending
moments of an ultra-high aspect ratio wing has culminated in more than a decade of work focused on understanding
the aeroelastic properties and structural weight penalties due to the more aerodynamically efficient wing.
The Subsonic Ultra Green Aircraft Research (SUGAR) Truss-Braced Wing (TBW) aircraft concept is a Boeing-
developed N+3 aircraft configuration funded by NASA ARMD Fixed Wing Project.4, 5 The TBW aircraft concept is
designed to be aerodynamically efficient by employing an aspect ratio on the order of 14, which is significantly greater
than those of conventional aircraft wings. As a result, intermediate structural supports are required. The main wings
∗Stinger Ghaffarian Technologies Inc., NASA Ames Research Center, Research Engineer, [email protected]†NASA Ames Research Center, Aerospace Engineer, [email protected]‡NASA Ames Research Center, Research Scientist, AIAA Associate Fellow, [email protected]§NASA Ames Research Center, Research Scientist, AIAA Associate Fellow, [email protected]
1 of 16
American Institute of Aeronautics and Astronautics
https://ntrs.nasa.gov/search.jsp?R=20140011160 2018-09-02T21:43:29+00:00Z
are braced at approximated mid-span by two main trusses. In addition, two jury struts, one on each wing, provide
additional reinforcement. Figure 1 is an illustration of the TBW aircraft.
Figure 1. Boeing SUGAR Truss-Braced Wing (TBW) Aircraft Concept
The development of the TBW aircraft is supported through a collaboration between the NASA Fixed Wing Project,
Boeing Research and Technology, and a number of other organizations. Multidisciplinary design analysis and opti-
mization (MDAO) studies have been conducted at each stage to improve the wing aerodynamics, structural efficiency,
and flight performance using advanced N+4 turbofan engines. These MDAO studies have refined the geometry of the
wing and configuration layout and have involved trade studies involving minimizing induced drag with wing span,
minimizing profile drag at lower Reynolds numbers, and minimizing wave drag due to the addition of the strut and
brace. The chart in Fig. 2 summarizes progression of the past revisions of the TBW aircraft design at various devel-
opmental stages.4, 5
Figure 2. Summary of TBW Aircraft Development under NASA Phase I and II Contracts
2 of 16
American Institute of Aeronautics and Astronautics

In the present, current research into the TBW as a future generation aircraft is being conducted. Owing to its
high aspect ratio and highly flexible, modern material technology based wings, significant aeroelastic interactions are
expected for the aircraft. Aeroelastic interactions can result in adverse aerodynamics on the aircraft and lead to drag
increases. The TBW also represents a N+3 testbed for the evaluation of adaptive aeroelastic shape control (AASC)
technologies such as the Variable Camber Continuous Trailing Edge Flap (VCCTEF) system6, 7 currently investigated
under the AASC element of the Fixed Wing project by NASA, Boeing, and partners. A MDAO framework is currently
being developed for analyzing future generation aircraft configurations such as the TBW and the application of AASC
technologies including the VCCTEF. This framework is intended to include a suite of aerodynamic tools of varying
fidelity, as well as finite-element models of these configurations.
Figure 3. Notional Diagram of TBW with VCCTEF System
This paper presents an initial aerodynamic analysis of the TBW aircraft using a conceptual vortex-lattice aerody-
namic tool VORLAX coupled with the aerodynamic superposition method. Based on the underlying linear potential
flow theory, the complex configuration of the TBW is modeled using superposition of individual aerodynamic compo-
nents to estimate the total aircraft characteristics. This is an approximate method for conceptual preliminary analysis,
which does not fully address aerodynamic interference effects occurring at the interfaces of these components. This
conceptual aerodynamic method is being developed as an initial analysis capability for the MDAO framework of the
TBW.
II. Initial Preliminary Aerodynamic Analysis
Preliminary aerodynamic analysis was conducted in a vortex-lattice environment using the vortex-lattice code
VORLAX, an aerodynamic performance prediction code developed by Miranda et al.8 Based on aerodynamic lifting
line and vortex-lattice method (VLM), VORLAX provides a rapid method for estimating force and moment coeffi-
cients as well as stability and control derivatives of an aerodynamic configuration. An aerodynamic configuration is
constructed within VORLAX by a series of lifting panels that are formed by spanwise and chordwise locations of
horseshoe vortices based on a lattice discretization specified by the user. VORLAX then computes the vehicle aerody-
namics in both the longitudinal and lateral directions independently. The longitudinal and lateral computational results
are combined to produce overall aerodynamic characteristics of an aerodynamic configuration at any arbitrary angles
of attack and sideslip. Graphical user interfaces (GUIs) have been developed for VORLAX such as VORVIEW and
Vehicle Sketch Pad (VSP),9 which are front end programs that allow users to create a model and execute VORLAX
interactively or in a batch mode.
Because VLM is based on potential flow theory, it is an inviscid code that can only compute inviscid drag due
to lift and cannot predict viscous or wave drag. The compressibility effect on the aerodynamic coefficients is ac-
counted for by a compressibility correction, such as the Prandtl-Glauert correction. For lift prediction at low angle of
attacks, VORLAX can provide reasonably accurate prediction. Figure 4 shows a comparison between the lift coeffi-
cient predicted by VORLAX and the measured lift coefficient of a sub-scale 5.5% wind tunnel model of the NASA
Generic Transport Model (GTM)10 tested in NASA Langley Research Center’s 14-Foot-By-22-Foot Wind Tunnel.
The agreement between the VORLAX lift prediction and test data is excellent.
3 of 16
American Institute of Aeronautics and Astronautics

−10 −5 0 5 10 15−0.5
0
0.5
1Lift Coefficient of GTM
α (deg)
CL
VORLAX β = 0o
VORLAX β = 20o
14−Ft x 22−Ft β = 0o
14−Ft x 22−Ft β = 20o
Figure 4. GTM Lift Coefficient Comparison between VORLAX and Wind Tunnel Test Data
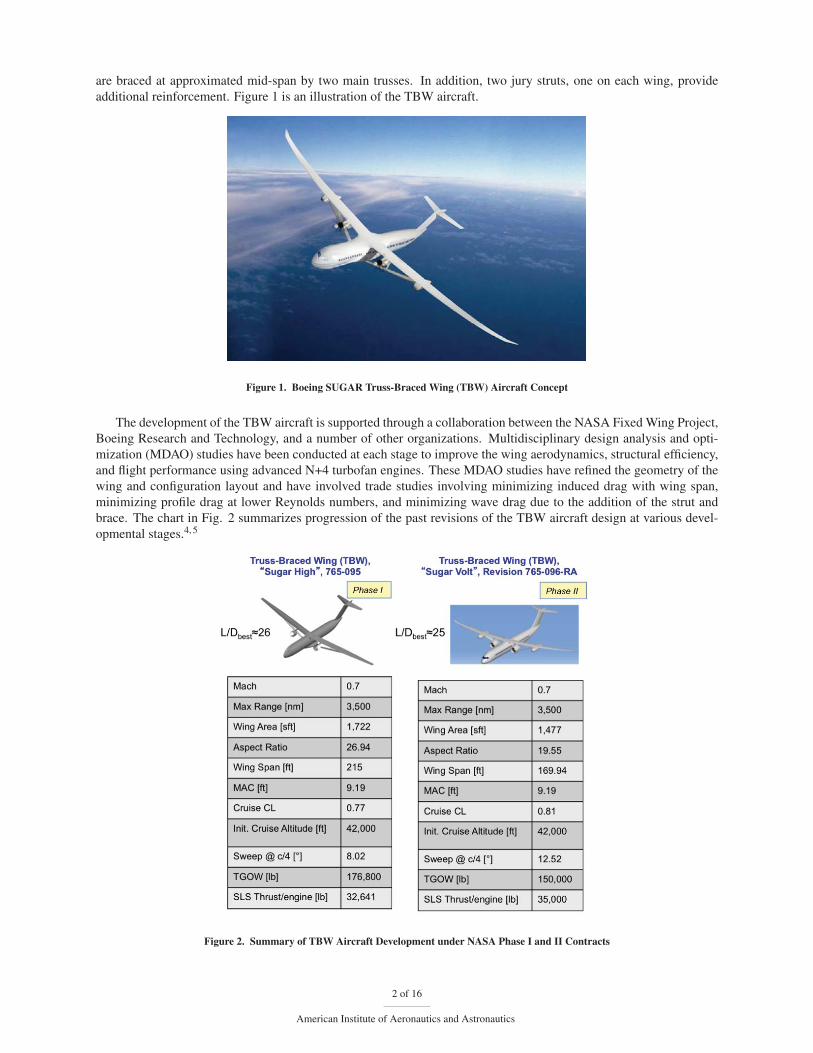
Aerodynamic models of the TBW with varying degree of fidelity already exist, including a FUN3D model by
Robert Bartels at NASA Langley Research Center and a USM3D model by Richard Campbell at NASA Langley
Research Center. During an initial analysis, a full configuration of the TBW was created in VORLAX, and the mesh
and an example panel/vortex-lattice discretization for the TBW is shown in Fig. 5. The aerodynamic characteristics
of the TBW were computed in VORLAX and then compared against FUN3D and USM3D results as shown in Fig. 6.
It can be seen that the VORLAX results do not agree well with CFD results.
Figure 5. TBW Mesh (Left) and Vortex-Lattice Panel/Polygon Discretization (Right) in VORVIEW
Subsequently, a high-fidelity commercial CFD code STAR-CCM+ was used by John Melton at NASA Ames
Research Center to analyze the TBW configuration. The STAR-CCM+ model has 23 million volume cells and 572,000
surface triangles over the left half of the TBW, as shown in Fig. 7. The solver computed steady-state solutions using
the SST (k−ω) turbulence model. Figure 8 shows the lift curve predicted by STAR-CCM+, which has a lift curve
slope CLα = 10.142 at Mach 0.7 and 2o angle of attack. The results agree well with the FUN3D and USM3D results.
4 of 16
American Institute of Aeronautics and Astronautics
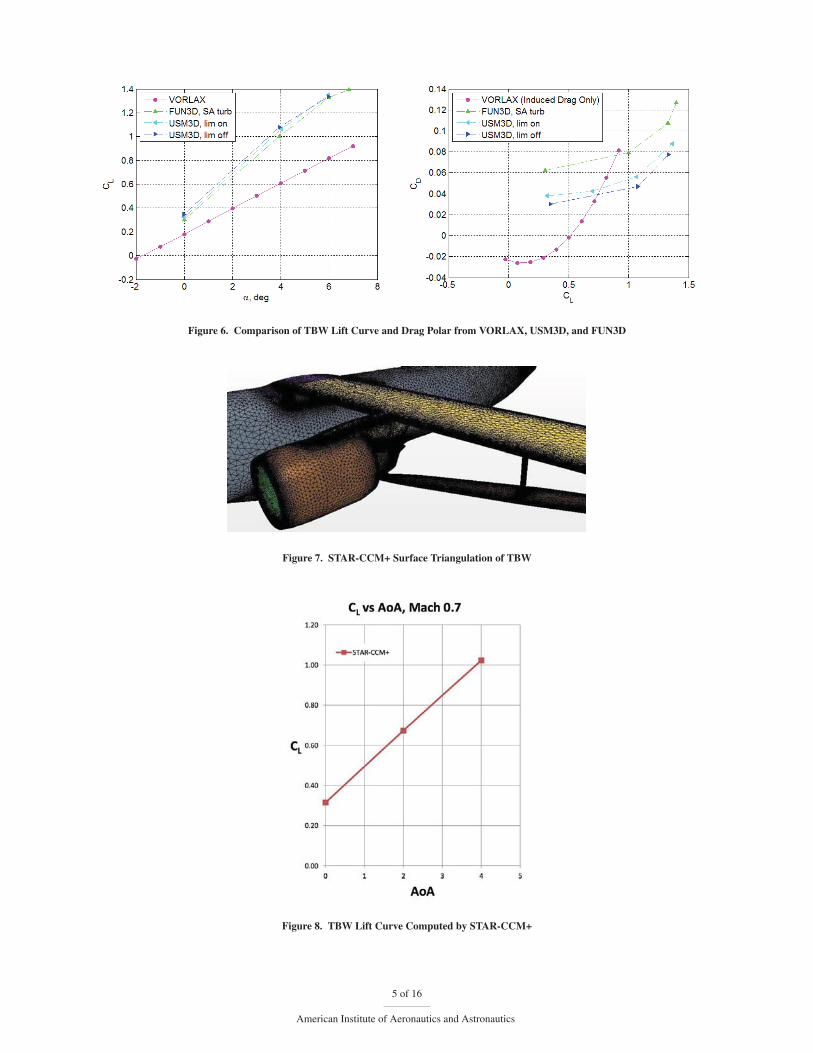
Figure 6. Comparison of TBW Lift Curve and Drag Polar from VORLAX, USM3D, and FUN3D
Figure 7. STAR-CCM+ Surface Triangulation of TBW
Figure 8. TBW Lift Curve Computed by STAR-CCM+
5 of 16
American Institute of Aeronautics and Astronautics

More interestingly, the lift curve slope obtained by integrating the surface pressure distribution over the wing
alone is CLα = 7.688, which is 20% less than the lift curve slope for the full configuration. The significant difference
between the full configuration and the wing-alone lift curve slopes suggested that the trusses may be generating a
significant amount of lift that was not correctly captured by VORLAX due to the nature of the mean camber vortex
sheet analysis. In fact, it is observed from Fig. 9 that the trusses, or braces, show a strong suction region near
the leading edge. This observation led to an alternate approach of vortex-lattice modeling based on the principle of
aerodynamic superposition.
Figure 9. TBW Pressure Coefficient Distribution Computed by STAR-CCM+
III. Aerodynamic Superposition Vortex-Lattice Approach
Vortex-lattice method models a lifting aerodynamic surface as a vortex sheet formed by the mean camber surface.
It generally provides reliable aerodynamic prediction for a simple lifting aerodynamic surface such as a cantilever
wing. However, for complex configurations such as the TBW where multiple lifting surfaces are present and located
in close proximity in the streamwise direction, the standard modeling approach in VLM can break down. This has
been demonstrated by the previous results of the full configuration VORLAX model of the TBW in Fig. 6.
Because of its basis in potential flow theory for inviscid, incompressible, irrotational flow, VLM uses velocity
potential functions to effectively compute harmonic solutions of the Laplace’s equation. Since the Laplace’s equation
is a linear second-order partial differential equation, the principle of superposition of aerodynamic solutions holds.
This aerodynamic superposition principle can be used as an alternative approach to analyzing complex aerodynamic
configurations, and is applied to the analysis of the TBW.
Using the aerodynamic superposition principle, the lifting surfaces of the TBW are analyzed individually and then
their contributions to the aerodynamic forces and moments are summed together to build up the aerodynamic character-
istics of the full configuration of the TBW. This approach splits up the full configuration of the TBW into components.
Because they are not considered a lifting surfaces, the engines and pylons are removed from the vortex-lattice models
as a simplification.11 The jury struts are also omitted from consideration. Two aerodynamic superposition methods
are considered:
• Method 1 - The TBW full configuration is broken up into three components: 1) fuselage-wing-tail empennage
component, 2) fuselage-brace-tail empennage component, and 3) fuselage-tail empennage component. The full
configuration is the sum of the fuselage-wing-tail component and fuselage-brace-tail empennage component
minus the fuselage-tail empennage component. This is illustrated in Fig. 10. This approach was proposed as
a way to capture the lifting contribution from the braces without completely eliminating any of the lifting line
interference effects that is captured by VORLAX.
6 of 16
American Institute of Aeronautics and Astronautics

Figure 10. Aerodynamic Superposition Method 1 for TBW Model
• Method 2 - The TBW full configuration is broken up into four components: 1) fuselage component, 2) wing
component, 3) brace component, and 4) horizontal tail component. The full configuration is the sum of all indi-
vidual components. The vertical tail is not included since it does not contribute to the aircraft lift in symmetric
flight. This is illustrated in Fig. 11. This approach reduces the TBW configuration into solely lifting sur-
faces, and each component is examined without interference from the others to minimize any adverse modeling
simplifications that VLM may be imposing.
Figure 11. Aerodynamic Superposition Method 2 for TBW Model
Since VLM can only compute induced drag, viscous skin friction drag is estimated and then added to the inviscid
drag to provide a rough estimate of the total drag without the wave drag contribution, which otherwise could be
computed using the Korn’s equation.
The following relationships form the basis for approximating viscous skin friction drag as described by Abbott and
Von Doenhoff:12
CD f ,wing = kc fSwwing
Sre f(1)
CD f , f uselage = Kc fSw f uselage
Sre f(2)
The key parameters in these expressions are the calculation of skin friction coefficient, c f , and the corresponding
form factors for airfoil, k, and fuselage, K, shapes. The airfoil form factor k is given by reference13 as a function of the
thickness-to-chord ratio t/c, Mach number M, and wing sweep angle Λ . The fuselage (body) form factor K is given
by reference14 as a function of the fineness ratio l/d and Mach number M .
The calculation of skin friction coefficient associated with the wing and fuselage is performed using flat plate
approximation. The resulting expression for c f that captures the effect of laminar-to-turbulent flow transition is as
follows:
c f =xc
c̄
(1.328Re−0.5
xc
)+(0.072Re−0.2
c̄)− xc
c̄
(0.072Re−0.2
xc
)(3)
where Rec̄ is the Reynolds number based on the mean aerodynamic chord.
To estimate the transition length, xc, which is the distance from the leading edge of the wing or nose of the fuselage
where the flow transitions from laminar to turbulent flow, the following expression is used:
xc =Rexc μ
ρV(4)
where the value of Rexc is the transition Reynolds number, μ is the kinematic (absolute) viscosity, ρ is the density, and
V is the airspeed.
For varying values of ReXc and airspeed at a given altitude, this expression yields the transition lengths depicted in
Fig. 12.
7 of 16
American Institute of Aeronautics and Astronautics

Figure 12. Transition Length Variation at 35,000 ft Altitude (Standard Day)
The viscous skin friction drag correlation method is applied to the DLRF6 reference aircraft for validation.15 As
can be seen in Fig. 13, VLM alone underestimates the drag for the DLRF6 reference aircraft. However, when viscous
effects are added to the vortex-lattice drag estimates, the results appear much more reasonable, especially within an
angle-of-attack range near the minimum drag point.
Figure 13. Preliminary Comparison of Drag Estimates with Previously Published Data for the DLRF6 Reference Aircraft
Using the viscous skin friction drag correlation method, the transition Reynolds number can be estimated if the
transition location is known or computed from a high-fidelity CFD code. CFD analysis has shown that the TBW
configuration can achieve significant natural laminar flow over the wings. The transition has been estimated by Richard
Campbell at NASA Langley Research Center using USM3D RANS solver and the transition analysis tool LASTRAC.
Laminar flow over the TBW wing is achieved up to 50% of the chord location at the design cruise condition of Mach 0.7
and 42,000 ft. The Reynolds number based on the mean aerodynamic chord (MAC) of the TBW is Re = 11.1× 10⁶
at the cruise condition. Thus, a critical transition Reynolds number of Rexc = 5.55× 10⁶ is used to calculate skin
friction drag for all components. The critical length is approximately xc = 4.57 ft at a cruise condition of Mach 0.7
and altitude of 42,000 ft corresponding to transition at 50% of the MAC. Table 1 summarizes the viscous skin friction
drag estimates for the TBW at various flight conditions.
8 of 16
American Institute of Aeronautics and Astronautics

CD0(count)
Mach 0.2 0.3 0.4 0.5 0.6 0.7 0.8
Altitude (ft) 0 8,400 16,800 25,200 33,600 42,000 50,400
Wing 33 34 34 33 32 30 25
Brace 3 4 4 3 3 3 3
Tail Empennage 12 12 12 12 11 10 7
Fuselage 53 52 52 53 54 55 57
Total 101 102 102 101 100 98 92
Table 1. Viscous Drag Estimates for TBW at Various Different Flight Conditions (1 count = 0.0001)
A. Aerodynamic Superposition Results
The results for running VORLAX with the full configuration of the TBW and the results for running the TBW using
the aerodynamic superposition methods are compared against the FUN3D and USM3D results, as shown in Fig. 12
and Table 2. The values of CL0and CLα for the different aerodynamic modeling results are also summarized in Table
2, where a linear fit is conducted using the linear regions in the CFD results (approximately α ≤ 5◦).
Figure 14. TBW Lift Curve and Drag Polar Comparison Between VORLAX Superposition Results Against CFD Results
CLα CLα % Difference CL0CL0
% Difference
FUN3D 9.8225 1.59 0.3096 6.55
USM3D (lim off) 9.9807 0 0.3313 0
USM3D (lim on) 9.6230 3.58 0.3650 −10.17
VORLAX (Full Configuration) 6.0526 39.36 0.1828 44.82
VORLAX (Aerodynamic Superposition 1) 9.4097 5.72 0.4504 −35.95
VORLAX (Aerodynamic Superposition 2) 9.3707 6.11 0.3629 −9.54
Table 2. TBW Lift Curve Comparisons
As can be observed, excellent agreement in the lift curve between the VORLAX aerodynamic superposition
method and the CFD results is demonstrated. The largest difference in the lift curve slope between the VORLAX
aerodynamic superposition and the CFD methods is about 6%, while superposition method #2 is able to more closely
estimate CL0in comparison to superposition method #1. The drag polar predicted by the VORLAX aerodynamic su-
perposition methods are compared against the USM3D results. For superposition method #2, agreement between the
9 of 16
American Institute of Aeronautics and Astronautics
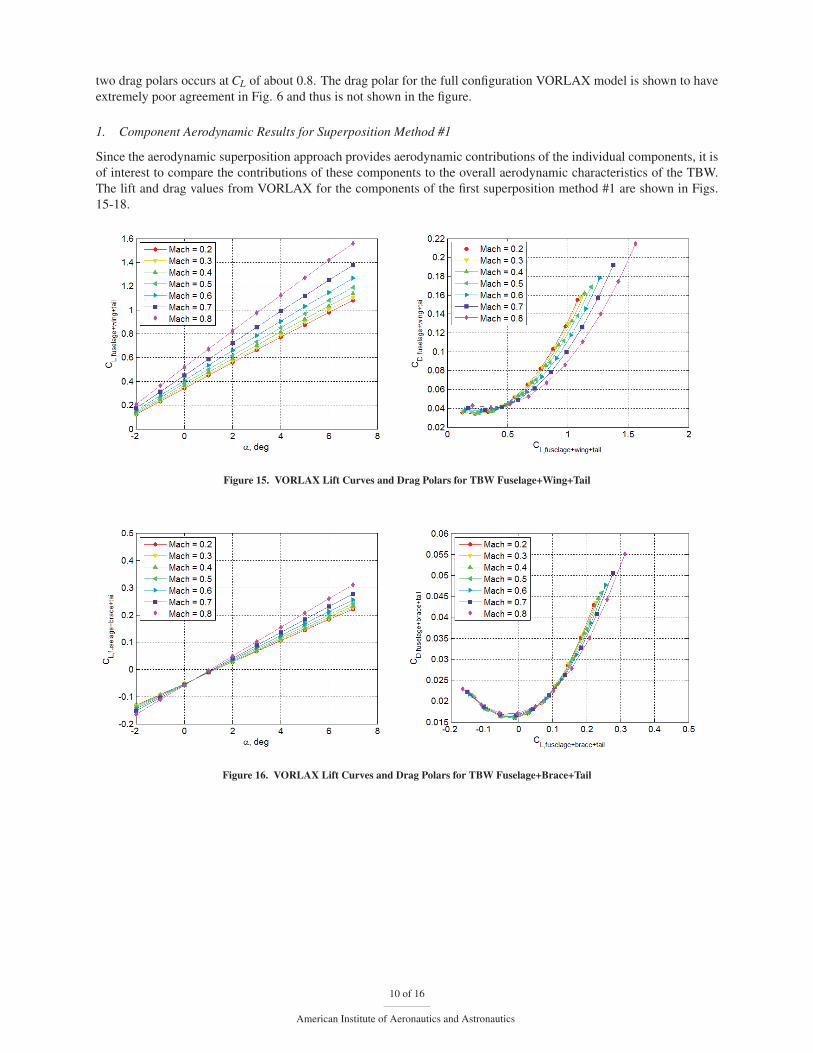
two drag polars occurs at CL of about 0.8. The drag polar for the full configuration VORLAX model is shown to have
extremely poor agreement in Fig. 6 and thus is not shown in the figure.
1. Component Aerodynamic Results for Superposition Method #1
Since the aerodynamic superposition approach provides aerodynamic contributions of the individual components, it is
of interest to compare the contributions of these components to the overall aerodynamic characteristics of the TBW.
The lift and drag values from VORLAX for the components of the first superposition method #1 are shown in Figs.
15-18.
Figure 15. VORLAX Lift Curves and Drag Polars for TBW Fuselage+Wing+Tail
Figure 16. VORLAX Lift Curves and Drag Polars for TBW Fuselage+Brace+Tail
10 of 16
American Institute of Aeronautics and Astronautics

Figure 17. VORLAX Lift Curves and Drag Polars for TBW Fuselage+Tail
Figure 18. VORLAX Lift Curves and Drag Polars for TBW Full Configuration, Superposition Method #1
Analysis of the VORLAX results using the superposition approach at the design cruise condition of CL = 0.810
produces a corresponding angle of attack of α = 2.153◦. The lift and drag contributions of the different components
of the TBW using superposition method #1 are computed and shown in Tables 3, 4, and 5.
Component CL % Contribution
Fuselage+Wing+Tail Empennage 0.7428 91.70
Fuselage+Brace+Tail Empennage 0.0480 5.93
-(Fuselage+Tail Empennage) 0.0192 2.37
Total 0.810 100
Table 3. VORLAX Lift Contribution at Cruise CL = 0.810, Superposition Method #1 (1 count = 0.0001)
11 of 16
American Institute of Aeronautics and Astronautics

Component Induced CD (count) % Contribution
Fuselage+Wing+Tail Empennage 543 96.45
Fuselage+Brace+Tail Empennage 119 21.14
-(Fuselage+Tail Empennage) −99 −17.58
Total 563 100
Table 4. VORLAX Induced Drag Contribution at Cruise CL = 0.810, Superposition Method #1 (1 count = 0.0001)
Component Total CD (count) % Contribution
Fuselage+Wing+Tail Empennage 638 96.52
Fuselage+Brace+Tail Empennage 187 28.29
-(Fuselage+Tail Empennage) −164 −24.81
Total 661 100
Table 5. Total Estimated Drag Contribution at Cruise CL = 0.810, Superposition Method #1 (1 count = 0.0001)
2. Component Aerodynamic Results for Superposition Method #2
The lift curves and drag polars for the fuselage, wings, braces, and tail empennage as well as the full configuration
over a range of Mach number from 0.2 to 0.8 for the second superposition method #2 are shown in Figs. 19 to 23.
Figure 19. VORLAX Lift Curves and Drag Polars for TBW Fuselage
12 of 16
American Institute of Aeronautics and Astronautics

Figure 20. VORLAX Lift Curves and Drag Polars for TBW Wing
Figure 21. VORLAX Lift Curves and Drag Polars for TBW Brace
Figure 22. VORLAX Lift Curves and Drag Polars for TBW Tail Empennage
13 of 16
American Institute of Aeronautics and Astronautics

Figure 23. VORLAX Lift Curves and Drag Polars for TBW Full Configuration, Superposition Method #2
At the design cruise condition of Mach 0.7 and altitude of 42,000 ft with CL = 0.810, the corresponding angle of
attack is α = 2.699◦. At this angle of attack, the lift and drag contributions of the individual components to the total
aerodynamics of the TBW are computed and shown in Tables 6, 7, and 8.
Component CL % Contribution
Wings 0.7451 91.97
Braces 0.0692 8.54
Tail Empennage −0.0020 −0.25
Fuselage −0.0021 −0.26
Total 0.810 100
Table 6. VORLAX Lift Contribution at Cruise CL = 0.810, Superposition Method #2 (1 count = 0.0001)
Component Induced CD (count) % Contribution
Wings 240 72.07
Braces 30 9.01
Tail Empennage 44 13.21
Fuselage 19 5.71
Total 333 100
Table 7. VORLAX Induced Drag Contribution at Cruise CL = 0.810, Superposition Method #2 (1 count = 0.0001)
Component Total CD (count) %Contribution
Wings 270 62.65
Braces 33 7.66
Tail Empennage 54 12.53
Fuselage 74 17.17
Total 431 100
Table 8. Total Estimated Drag Contribution at Cruise CL = 0.810, Superposition Method #2 (1 count = 0.0001)
The wings generate about 92% of the total lift, while the trusses generate about 9% of lift. The tail empennage and
fuselage generate down lift. Based on the model, the wings contribute almost 60% while the fuselage contributes about
14 of 16
American Institute of Aeronautics and Astronautics

17% to the total drag. The braces only contribute about 8% to the total drag, because its skin friction drag contribution
calculated earlier in Table 1 is minimal due to the high transition Reynolds number used in this analysis.
IV. Discussion
As an aerodynamic modeling tool, the computational efficiency of low-order aerodynamic methods such as vortex-
lattice and panel methods are suitable for conceptual aerodynamic analysis where medium fidelity is acceptable. In
comparison to higher-fidelity CFD codes, VLM is a tool that is less computationally intensive and can be utilized
readily in multidisciplinary analyses such as aeroelastic modeling. The development of the vortex-lattice aerodynamic
capability pursued in this study is with the ultimate goal of developing a rapid aerodynamic modeling approach that can
be coupled with structural finite-element models to model aeroelastic effects for future-generation aircraft concepts
from the static aeroelasticity and flutter perspectives. The results of this study show that while the vortex-lattice
approach is relatively fast, additional considerations must be taken in order to improve the modeling capability for
complex aerodynamic configurations. While the aerodynamic superposition approach does show how to improve the
aerodynamic prediction of VLM, the neglect of aerodynamic interference effects is a drawback and thus requires
corrections from high-fidelity CFD tools.
In light of the difficulty posed by the complex configuration of the TBW, a panel method based on the panel code
PANAIR is being considered for further expansion of the MDAO framework for the TBW. Considered as a conceptual
aerodynamic method that is of higher order than VLM but simpler and faster than CFD, panel codes offer an alternative
aerodynamic modeling approach that can still provide more rapid aerodynamic solutions in comparison to CFD. The
PANAIR code, initially developed by Boeing for NASA, is a high-order panel code that solves potential flow problems
for three-dimensional bodies.16 Panel codes discretize a full three-dimensional (3D) geometry into a series of panels,
a clear advantage over vortex-lattice codes which reduce the 3D geometry of lifting surfaces down to mean camber
surfaces. The deficiency of VLM in modeling blunt and non-lifting surfaces, such as a fuselage or nacelle, can
be addressed by panel codes such as PANAIR. The use of PANAIR will complement the aerodynamic modeling
capability of the MDAO framework to provide rapid aerodynamic and aeroelastic modeling of the TBW aircraft. Like
VORLAX, however, the PANAIR code is still an inviscid code. Therefore, viscous drag and wave drag will need to
be accounted for using other complementary techniques such as the integral boundary layer method. Both coupling of
VORLAX and PANAIR with finite-element method to enable static aeroelasticity and dynamic aeroelasticity analyses
are being developed for the MDAO framework.
V. Conclusions
This paper presents a recent aerodynamic analysis of the TBW aircraft using a conceptual vortex-lattice aero-
dynamic tool VORLAX. The deficiency of VLM in modeling the complex 3D geometry of the TBW using the full
configuration geometry is observed in this study. Thus, an alternative approach based on the aerodynamic superpo-
sition method is investigated. The full configuration of the TBW is modeled by the superposition of aerodynamic
solutions of individual components to estimate the total aerodynamic characteristics. This is an approximate method
utilized for conceptual preliminary analysis, and aerodynamic interference effects occurring at the interfaces of com-
ponents are not modeled in the superposition method. Excellent agreement in the lift curves between the VORLAX
aerodynamic superposition method and the CFD results are demonstrated. The largest difference in the lift curve slope
between the VORLAX aerodynamic superposition and the CFD methods is about 6%, whereas the full configuration
VORLAX model results in an error of almost 40%. The drag polar predicted by the VORLAX aerodynamic super-
position method is compared against the USM3D result, and agreement occurs between the two drag polars at a CLof about 0.8. The aerodynamic contributions of individual components can be readily computed by the aerodynamic
superposition method.
Acknowledgments
The authors would like to thank the Fixed Wing Project under the Fundamental Aeronautics Program of NASA
Aeronautics Research Mission Directorate (ARMD) for funding support of this work. The authors also would like
to acknowledge Robert Bartels and Richard Campbell at NASA Langley Research Center and John Melton at NASA
Ames Research Center for providing CFD results of the Truss-Braced Wing configuration.
15 of 16
American Institute of Aeronautics and Astronautics
References1Bhatia, M., et. al.. “Structural and Aeroelastic Characteristics of Truss-Braced Wing: A Parametric Study,” Journal of Aircraft, Vol 49, No.
1, 20122Gundlach, J. F., Tetrault, P. A., Gern, F. H., Nagshineh-Pour, A. H., Ko, A., Schetz, J. A., et. al., “Conceptual Design Studies of a Strut-Braced
Wing Transonic Transport,” Journal of Aircraft, Vol. 37, No. 6, 20003Gur, O., Bhatia, M., Schetz, J.A., Mason, W. H., Kapania, R. K., and Mavris, D. N., “Design Optimization of a Truss-Braced Wing Transonic
Transport Aircraft,” Journal of Aircraft, Vol. 47, No. 6, 2010.4Bradley, M. K. and Droney, C. K., “Subsonic Ultra Green Aircraft Research: Phase I Final Report,” NASA Contractor Report NASA/CR-
2011-216847, Boeing Research and Technology, April 20115Bradley, M. K., Droney, C. K., and Allen, T. J., “Subsonic Ultra Green Aircraft Research Phase II: N+4 Advanced Concept Development,”
NASA Contractor Report NASA/CR-2012-217556, Boeing Research and Technology, May 20126Nguyen, N., “NASA Innovation Fund 2010 Project: Elastically Shaped Future Air Vehicle Concept,” NASA Internal Report Submitted to
NASA Innovative Partnerships Program Office, October 8, 2010.7Urnes, Sr., J., Nguyen, N., Ippolito, C., Totah, J., Trinh, K., Ting, E., “A Mission-Adaptive Variable Camber Flap Control System to Optimize
High Lift and Cruise Lift-to-Drag Ratios of Future N+3 Transport Aircraft,” 51st AIAA Aerospace Sciences Meeting, AIAA-2013-0214, January
2013.8Miranda, L. R., Elliott, R. D., Baker, W. M., “A Generalized Vortex Lattice Method for Subsonic and Supersonic Flow Applications,” NASA
Contractor Report 2865, 19779Hahn, Andrew. S., “Vehicle Sketch Pad: A Parametric Geometry Modeler for Conceptual Aircraft Design,” AIAA Aerospace Sciences
Meeting, AIAA-2010-657, January 2010.10Jordan, T. L., Langford, W. M., Belcastro, C. M., Foster, J. M., Shah, G. H., Howland, G., and Kidd, R., “Development of a Dynamically
Scaled Generic Transport Model Testbest for Flight Research Experiments,” AUVSI Unmanned Unlimited, Arlington, VA, 2004.11Martin, G. L., “Paneling Techniques for Use with the Vorlax Computer Program,” NASA Contractor Report NASA CR-145364, 197812Abbott, I. H. and Von Doenhoff, A. E., Theory of Wing Sections, Dover Publications, Inc., New York, pp. 97-103.13Stanford University, AA241, http://adg.stanford.edu/aa241/drag/lsformfactor.html14Stanford University, AA241, http://adg.stanford.edu/aa241/drag/BODYFORMFACTOR.HTML15Hill, G., “Aerodynamic and Acoustic Investigations of an Advanced Over-the-Wing Nacelle Transport Aircraft Configuration,” M.S. Thesis,
Old Dominion University, May, 2007 (p. 35, Fig. 6).16Derbyshire,T., Sidwell, K. W., “PAN AIR Summary Document (Version 1.0),” NASA Contrator Report 3250, Boeing Military Airplane
Company, April 1982.
16 of 16
American Institute of Aeronautics and Astronautics