
AERODROME METEOROLOGICAL OBSERVATION AND FORECAST STUDY ... · AERODROME METEOROLOGICAL OBSERVATION...
18
AERODROME METEOROLOGICAL OBSERVATION AND FORECAST STUDY GROUP (AMOFSG) EIGHTH MEETING Melbourne, Australia, 15 to 18 February 2010 Agenda Item 5: Observing and forecasting at the aerodrome and in the terminal area THE METEOROLOGICAL OBSERVATION INFRASTRUCTURE AT AMSTERDAM AIRPORT SCHIPHOL (Presented by Jan Sondij) SUMMARY The meteorological observation infrastructure at Amsterdam Airport Schiphol (AAS) provides Air Traffic Control (ATC) with meteorological observations and reports. In close cooperation with Air Traffic Control The Netherlands (LVNL) the overall system has been reviewed. The outcome has led to the abolishment of single point of failures and the introduction of an additional back-up system for critical wind and RVR information. This Study Note presents an overview of the meteorological observation infrastructure at Amsterdam Airport Schiphol. It is recommended to share the meteorological solutions of other States within the AMOFSG in order to enlarge the opportunities in business decision making processes. 1. INTRODUCTION 1.1 The objective of meteorological service for international air navigation shall be to contribute towards the safety, regularity and efficiency of international air navigation (Annex 3, 2.1.1). 1.2 This objective shall be achieved by supplying the following users: operators, flight crew members, air traffic services units, search and rescue services units, airport managements and others concerned with the conduct or development of international air navigation, with the meteorological information necessary for the performance of their respective functions (Annex 3, 2.1.2). AMOFSG/8-SN No. 20 14/12/09
Transcript of AERODROME METEOROLOGICAL OBSERVATION AND FORECAST STUDY ... · AERODROME METEOROLOGICAL OBSERVATION...
AERODROME METEOROLOGICAL OBSERVATION AND FORECAST STUDY GROUP (AMOFSG)
EIGHTH MEETING
Melbourne, Australia, 15 to 18 February 2010
Agenda Item 5: Observing and forecasting at the aerodrome and in the terminal area
THE METEOROLOGICAL OBSERVATION INFRASTRUCTURE AT AMSTERDAM AIRPORT SCHIPHOL
(Presented by Jan Sondij)
SUMMARY
The meteorological observation infrastructure at Amsterdam Airport Schiphol (AAS) provides Air Traffic Control (ATC) with meteorological observations and reports. In close cooperation with Air Traffic Control The Netherlands (LVNL) the overall system has been reviewed. The outcome has led to the abolishment of single point of failures and the introduction of an additional back-up system for critical wind and RVR information. This Study Note presents an overview of the meteorological observation infrastructure at Amsterdam Airport Schiphol. It is recommended to share the meteorological solutions of other States within the AMOFSG in order to enlarge the opportunities in business decision making processes.
1. INTRODUCTION
1.1 The objective of meteorological service for international air navigation shall be to contribute towards the safety, regularity and efficiency of international air navigation (Annex 3, 2.1.1).
1.2 This objective shall be achieved by supplying the following users: operators, flight crew members, air traffic services units, search and rescue services units, airport managements and others concerned with the conduct or development of international air navigation, with the meteorological information necessary for the performance of their respective functions (Annex 3, 2.1.2).
AMOFSG/8-SN No. 20 14/12/09
idasilva
Text Box
(18 pages)

AMOFSG/8-SN No. 20
-2-
2. DISCUSSION
2.1 At aerodromes with runways intended for Category II and III instrument approach and landing operations, automated equipment for measuring or assessing, as appropriate, and for monitoring and remote indicating of surface wind, visibility, runway visual range, height of cloud base, air and dew-point temperatures and atmospheric pressure shall be installed to support approach and landing and take-off operations. These devices shall be integrated automatic systems for acquisition, processing, dissemination and display in real time of the meteorological parameters affecting landing and take-off operations. The design of integrated automatic systems shall observe Human Factors principles and include back-up procedures (Annex 3, 4.1.5).
2.2 It is recommended that an agreement between the meteorological authority and the appropriate ATS authority should be established to cover, among other things (Annex 3, 4.2):
a) the provision in air traffic services units of displays related to integrated automatic system;
b) ……….
2.3 In 2004 the Air Traffic Control The Netherlands (LVNL) carried out a study which showed that there was a small possibility that RVR data was not available for ATC in a situation with RVR conditions. Even given the fact that large parts of the overall information chain contain redundancy.
2.4 The main driver behind this ATC initiative was to guarantee the sustainability of the Schiphol operations. In this specific case being the sustainability during RVR conditions.
2.5 The study of LVNL resulted in a collaborative project with KNMI to review the entire system of meteorological observations at Schiphol Airport. This resulted in various changes to the system.
2.5.1 Single points of failure have been identified and have been removed, for example:
a) the central server was a redundant system but housed at a single location. Currently one server is housed at Schiphol Centre and one at Schiphol East.
b) the sensor information now enters the fibre optic infrastructure in duplicate and is extracted at two physically locations at Schiphol Centre and Schiphol East.
c) at Schiphol Centre and at Schiphol East a KNMI LAN is available to which server and client systems are connected. The LANs are connected directly, but both LANs are also connected via 2 physically separate WAN connections to the main KNMI facilities in De Bilt.
d) the meteorological server systems at Schiphol are redundant and have all kind of safety features build in. However, the system still uses the same application software and operating system that might cause problems.
2.6 Hence an additional back-up system has been implemented called MISPOES (Dutch saying). By specification the MISPOES system:

-3-
AMOFSG/8-SN No. 20
a) was built from scratch by another manufacturer;
b) was implemented in a different computer language, and
c) uses another operating system.
2.7 The functionality of this system is kept to the strict minimum and only provides the most essential meteorological data to ATC.
2.8 Appendix A describes the functionality of MISPOES and the entire meteorological observation infrastructure at Amsterdam Airport Schiphol in more detail. The appendix provides:
a) an overview of the runways at Amsterdam Airport Schiphol together with an indication of the runway usage for landing and take off;
b) a list of the meteorological sensors used by KNMI;
c) an overview of the location of the meteorological sensors at Amsterdam Airport Schiphol;
d) the wind and visibility sensor usage including the back-up scheme in use;
e) an overview of the data communication lines at Amsterdam Airport Schiphol;
f) a description of the central systems and network connections;
g) the system redundancy and specific details of MISPOES;
h) some screenshots of the graphical display and MISPOES, and
i) several other aspects to take into consideration.
3. RECOMMENDATION
3.1 This paper describes the meteorological solutions that have been realized in the Netherlands in order to address the needs of Air Traffic Control at Amsterdam Airport Schiphol.
3.2 It is recommended to share the meteorological solutions of other States within the AMOFSG in order to enlarge the opportunities in business decision making processes.

AMOFSG/8-SN No. 20
-4-
4. ACTION BY THE AMOFSG
4.1 The AMOFSG is invited to:
a) note the information in this paper; and
b) decide whether an “action agreed” needs to be formulated.
— — — — — — —
Appendix A
The Meteorological Observation Infrastructure at Amsterdam Airport Schiphol
Page 1 of 14
KNMI
Visiting address Wilhelminalaan 10 3732 GK De Bilt The Netherlands PO Box 201 3730 AE De Bilt The Netherlands T +31 302206911 telefax +31 302210407 www.knmi.nl
RaboBank International Utrecht, Account No 19.23.23.822 IBAN NL31RABO0192323822 BIC/SWIFT RABONL2U
Contact Jan Sondij T +31302206528 T +31653312390
Wiel Wauben R&D Information and Observation Technology Email: [email protected] Jan Sondij Senior Advisor Aviation Meteorology Stakeholder and Contract Management Email: [email protected]
Page 1 of 13 The Meteorological Observation Infrastructure at Amsterdam Airport Schiphol 6 December 2009
The Meteorological Observation Infrastructure at Amsterdam Airport Schiphol
Introduction Amsterdam Airport Schiphol (AAS, AMS in IATA and EHAM in ICAO designation) is an international airport with 436,000 aircraft movements in 2007 (Kolkman and Korteweg, 2009). During the inbound and outgoing daily peaks the airport operates at maximum capacity where at most 2 runways are in simultaneous use for take-off and 2 runways are used for landing. The peak hour capacity of EHAM is currently 112 aircraft. The maximum peak hour capacity cannot always be achieved in practice, mostly due to weather conditions. Poor visibility due to fog or low clouds is the reason of this reduction in about half of these cases. In 2004, the average peak hour capacity at Schiphol for inbound flights under less than ideal weather conditions was about 35 percent lower than under optimum weather conditions. Hence, meteorology is a crucial factor that determines the maximum capacity of an airport. In this paper an overview is given of the meteorological observation infrastructure of the Royal Netherlands Meteorological Institute (KNMI) at Schiphol. The location and usage of the meteorological sensors will be described as well as the data-acquisition, processing and dissemination systems involved. Particular attention is given to the redundancy built into the meteorological observation infrastructure at Schiphol.
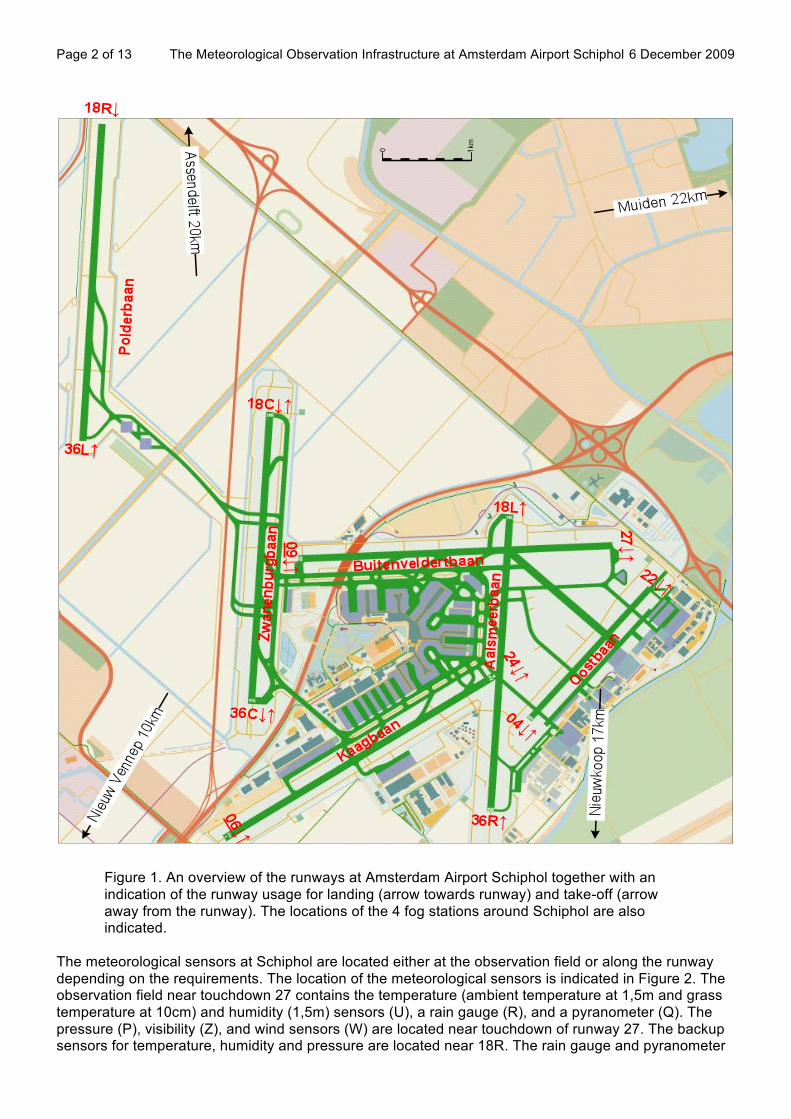
Runway and sensor layout Schiphol is an airport which consists of 6 CAT runways (5 CAT III and 1 CAT I). The layout of the runways, as well as an overview of the available runways for take-off and landing, is shown in Figure 1. Note that generally the runways can be used from both sides. This is indicated in Figure 1 by the red arrow(s) next to the runway indicators. An arrow pointing towards the runway indicates that the runway can be used for landing, an arrow pointing away from the runways indicates that the runway can be used for take-off. Naturally only specific runway combinations are available for simultaneous use. The usage of runways is determined by Air Traffic Control the Netherlands (LVNL) and is based on e.g. meteorological conditions, periodical runway maintenance, and noise limits. The actual runway usage is automatically sent to KNMI via the Runway Information System (RIS). Thus, KNMI can include runway specific information in the local meteorological reports. All meteorological sensors are operated by KNMI in combination with a so-called SIAM, a Sensor Intelligent Adaptation Module (Bijma, 2008). A SIAM communicates with the sensor and converts the sensor output into meteorological units and in a fixed format. The SIAM also performs quality checks. Each sensor type has a different SIAM. The SIAM can output several meteorological units. Every 12 seconds each SIAM reports a serial output string which for each unit consists of several fields containing respectively an instantaneous measurement value, a 1-minute and a 10-minute average value, the extremes of the sensor values of the past 10 minutes and the standard deviation. The SIAM also reports the status of the most recent measurement and field labelled “missed” that reports the percentage of sample values missed in the calculation of the 10-minute averages and extremes. The sensor interface gives a new output every 12 seconds. Note that if necessary the sensor interface samples the sensor with a higher frequency, e.g. the cup anemometer and wind vane are sampled with 4Hz and the sensor interface calculates the 3 seconds running average in order to calculate the wind gust and take account of marked discontinuities of the wind. Table 1 gives an overview of the sensors and associated SIAMs used by KNMI. Note that KNMI replaced all double base-line transmissometers by so-called forward scatter visibility sensors at Schiphol. Furthermore, note that LVNL provides the runway usage to KNMI in the SIAM format. Four fields of the unit BB indicate the runways that are used as Main and Secondary Landing and Take-off Runways (MLR, SLR, MTR, STR, respectively).
Page 2 of 13 The Meteorological Observation Infrastructure at Amsterdam Airport Schiphol 6 December 2009
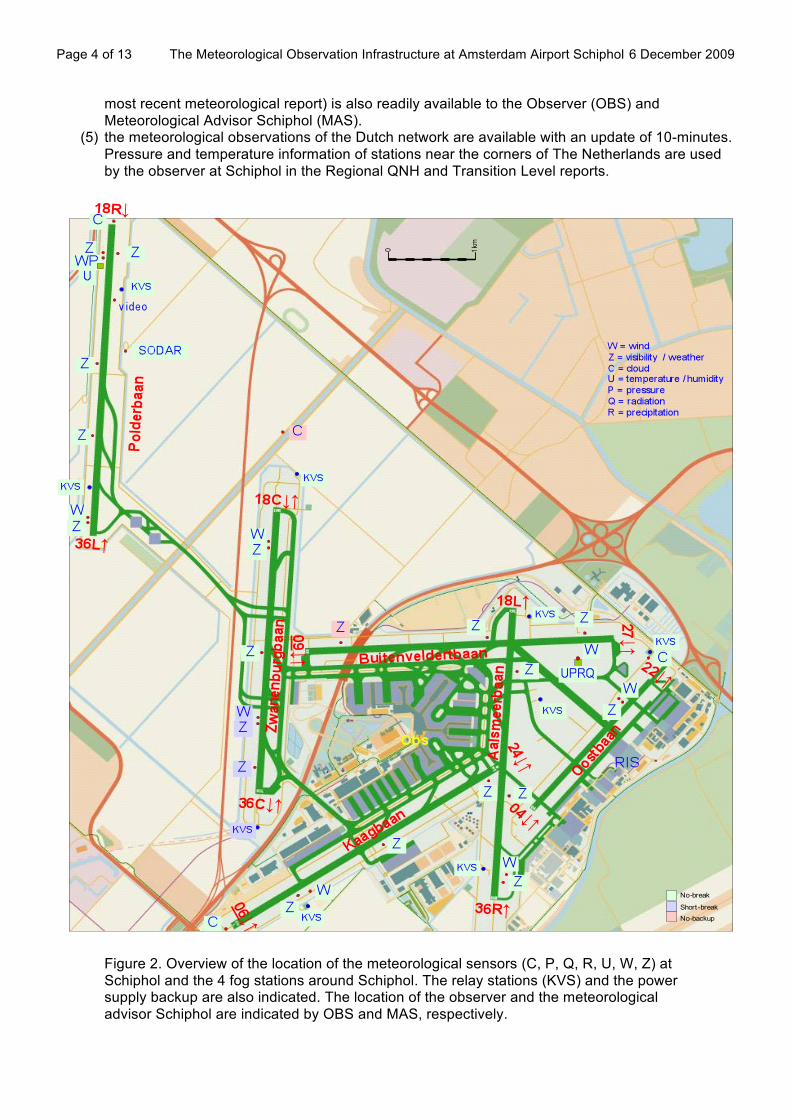
Figure 1. An overview of the runways at Amsterdam Airport Schiphol together with an indication of the runway usage for landing (arrow towards runway) and take-off (arrow away from the runway). The locations of the 4 fog stations around Schiphol are also indicated.
The meteorological sensors at Schiphol are located either at the observation field or along the runway depending on the requirements. The location of the meteorological sensors is indicated in Figure 2. The observation field near touchdown 27 contains the temperature (ambient temperature at 1,5m and grass temperature at 10cm) and humidity (1,5m) sensors (U), a rain gauge (R), and a pyranometer (Q). The pressure (P), visibility (Z), and wind sensors (W) are located near touchdown of runway 27. The backup sensors for temperature, humidity and pressure are located near 18R. The rain gauge and pyranometer
Page 3 of 13 The Meteorological Observation Infrastructure at Amsterdam Airport Schiphol 6 December 2009
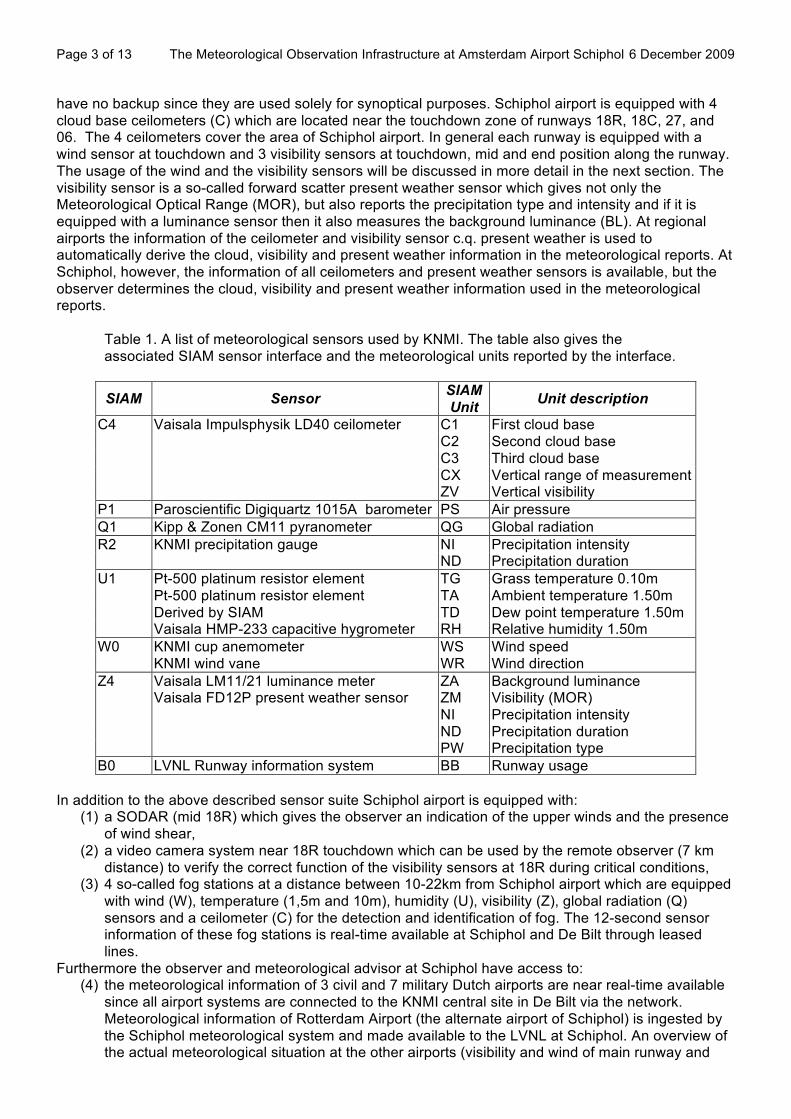
have no backup since they are used solely for synoptical purposes. Schiphol airport is equipped with 4 cloud base ceilometers (C) which are located near the touchdown zone of runways 18R, 18C, 27, and 06. The 4 ceilometers cover the area of Schiphol airport. In general each runway is equipped with a wind sensor at touchdown and 3 visibility sensors at touchdown, mid and end position along the runway. The usage of the wind and the visibility sensors will be discussed in more detail in the next section. The visibility sensor is a so-called forward scatter present weather sensor which gives not only the Meteorological Optical Range (MOR), but also reports the precipitation type and intensity and if it is equipped with a luminance sensor then it also measures the background luminance (BL). At regional airports the information of the ceilometer and visibility sensor c.q. present weather is used to automatically derive the cloud, visibility and present weather information in the meteorological reports. At Schiphol, however, the information of all ceilometers and present weather sensors is available, but the observer determines the cloud, visibility and present weather information used in the meteorological reports.
Table 1. A list of meteorological sensors used by KNMI. The table also gives the associated SIAM sensor interface and the meteorological units reported by the interface.
SIAM Sensor SIAM Unit Unit description
C4 Vaisala Impulsphysik LD40 ceilometer C1 First cloud base C2 Second cloud base C3 Third cloud base CX Vertical range of measurement ZV Vertical visibility P1 Paroscientific Digiquartz 1015A barometer PS Air pressure Q1 Kipp & Zonen CM11 pyranometer QG Global radiation R2 KNMI precipitation gauge NI Precipitation intensity ND Precipitation duration U1 Pt-500 platinum resistor element TG Grass temperature 0.10m Pt-500 platinum resistor element TA Ambient temperature 1.50m Derived by SIAM TD Dew point temperature 1.50m Vaisala HMP-233 capacitive hygrometer RH Relative humidity 1.50m W0 KNMI cup anemometer WS Wind speed KNMI wind vane WR Wind direction Z4 Vaisala LM11/21 luminance meter ZA Background luminance Vaisala FD12P present weather sensor ZM Visibility (MOR) NI Precipitation intensity ND Precipitation duration PW Precipitation type B0 LVNL Runway information system BB Runway usage
In addition to the above described sensor suite Schiphol airport is equipped with:
(1) a SODAR (mid 18R) which gives the observer an indication of the upper winds and the presence of wind shear,
(2) a video camera system near 18R touchdown which can be used by the remote observer (7 km distance) to verify the correct function of the visibility sensors at 18R during critical conditions,
(3) 4 so-called fog stations at a distance between 10-22km from Schiphol airport which are equipped with wind (W), temperature (1,5m and 10m), humidity (U), visibility (Z), global radiation (Q) sensors and a ceilometer (C) for the detection and identification of fog. The 12-second sensor information of these fog stations is real-time available at Schiphol and De Bilt through leased lines.
Furthermore the observer and meteorological advisor at Schiphol have access to: (4) the meteorological information of 3 civil and 7 military Dutch airports are near real-time available
since all airport systems are connected to the KNMI central site in De Bilt via the network. Meteorological information of Rotterdam Airport (the alternate airport of Schiphol) is ingested by the Schiphol meteorological system and made available to the LVNL at Schiphol. An overview of the actual meteorological situation at the other airports (visibility and wind of main runway and
Page 4 of 13 The Meteorological Observation Infrastructure at Amsterdam Airport Schiphol 6 December 2009
most recent meteorological report) is also readily available to the Observer (OBS) and Meteorological Advisor Schiphol (MAS).
(5) the meteorological observations of the Dutch network are available with an update of 10-minutes. Pressure and temperature information of stations near the corners of The Netherlands are used by the observer at Schiphol in the Regional QNH and Transition Level reports.
Figure 2. Overview of the location of the meteorological sensors (C, P, Q, R, U, W, Z) at Schiphol and the 4 fog stations around Schiphol. The relay stations (KVS) and the power supply backup are also indicated. The location of the observer and the meteorological advisor Schiphol are indicated by OBS and MAS, respectively.
Page 5 of 13 The Meteorological Observation Infrastructure at Amsterdam Airport Schiphol 6 December 2009
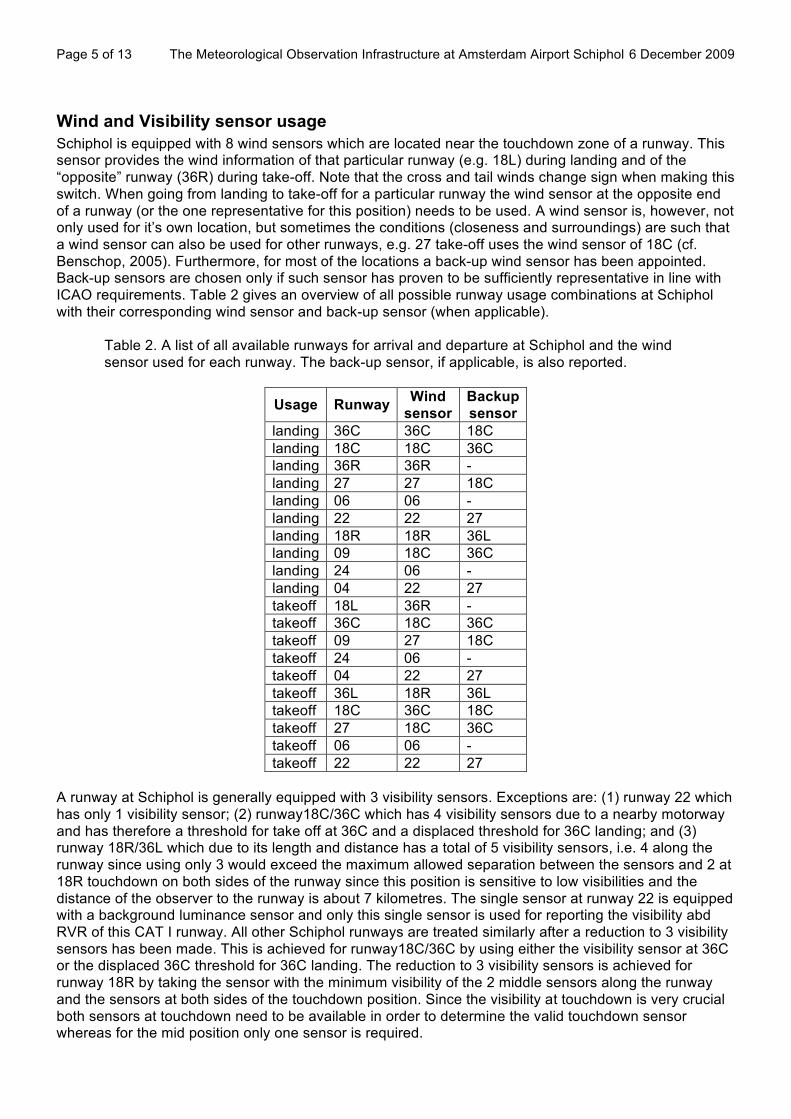
Wind and Visibility sensor usage Schiphol is equipped with 8 wind sensors which are located near the touchdown zone of a runway. This sensor provides the wind information of that particular runway (e.g. 18L) during landing and of the “opposite” runway (36R) during take-off. Note that the cross and tail winds change sign when making this switch. When going from landing to take-off for a particular runway the wind sensor at the opposite end of a runway (or the one representative for this position) needs to be used. A wind sensor is, however, not only used for it’s own location, but sometimes the conditions (closeness and surroundings) are such that a wind sensor can also be used for other runways, e.g. 27 take-off uses the wind sensor of 18C (cf. Benschop, 2005). Furthermore, for most of the locations a back-up wind sensor has been appointed. Back-up sensors are chosen only if such sensor has proven to be sufficiently representative in line with ICAO requirements. Table 2 gives an overview of all possible runway usage combinations at Schiphol with their corresponding wind sensor and back-up sensor (when applicable).
Table 2. A list of all available runways for arrival and departure at Schiphol and the wind sensor used for each runway. The back-up sensor, if applicable, is also reported.
Usage Runway Wind sensor
Backup sensor
landing 36C 36C 18C landing 18C 18C 36C landing 36R 36R - landing 27 27 18C landing 06 06 - landing 22 22 27 landing 18R 18R 36L landing 09 18C 36C landing 24 06 - landing 04 22 27 takeoff 18L 36R - takeoff 36C 18C 36C takeoff 09 27 18C takeoff 24 06 - takeoff 04 22 27 takeoff 36L 18R 36L takeoff 18C 36C 18C takeoff 27 18C 36C takeoff 06 06 - takeoff 22 22 27
A runway at Schiphol is generally equipped with 3 visibility sensors. Exceptions are: (1) runway 22 which has only 1 visibility sensor; (2) runway18C/36C which has 4 visibility sensors due to a nearby motorway and has therefore a threshold for take off at 36C and a displaced threshold for 36C landing; and (3) runway 18R/36L which due to its length and distance has a total of 5 visibility sensors, i.e. 4 along the runway since using only 3 would exceed the maximum allowed separation between the sensors and 2 at 18R touchdown on both sides of the runway since this position is sensitive to low visibilities and the distance of the observer to the runway is about 7 kilometres. The single sensor at runway 22 is equipped with a background luminance sensor and only this single sensor is used for reporting the visibility abd RVR of this CAT I runway. All other Schiphol runways are treated similarly after a reduction to 3 visibility sensors has been made. This is achieved for runway18C/36C by using either the visibility sensor at 36C or the displaced 36C threshold for 36C landing. The reduction to 3 visibility sensors is achieved for runway 18R by taking the sensor with the minimum visibility of the 2 middle sensors along the runway and the sensors at both sides of the touchdown position. Since the visibility at touchdown is very crucial both sensors at touchdown need to be available in order to determine the valid touchdown sensor whereas for the mid position only one sensor is required.
Page 6 of 13 The Meteorological Observation Infrastructure at Amsterdam Airport Schiphol 6 December 2009
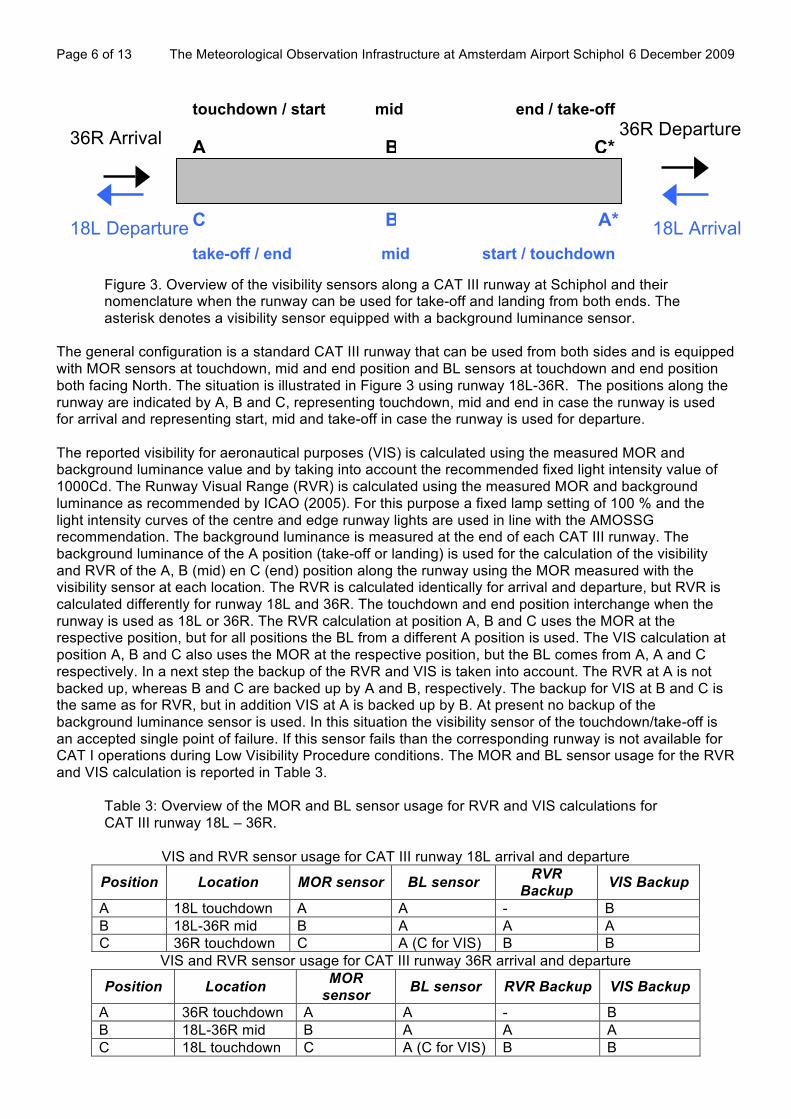
Figure 3. Overview of the visibility sensors along a CAT III runway at Schiphol and their nomenclature when the runway can be used for take-off and landing from both ends. The asterisk denotes a visibility sensor equipped with a background luminance sensor.
The general configuration is a standard CAT III runway that can be used from both sides and is equipped with MOR sensors at touchdown, mid and end position and BL sensors at touchdown and end position both facing North. The situation is illustrated in Figure 3 using runway 18L-36R. The positions along the runway are indicated by A, B and C, representing touchdown, mid and end in case the runway is used for arrival and representing start, mid and take-off in case the runway is used for departure. The reported visibility for aeronautical purposes (VIS) is calculated using the measured MOR and background luminance value and by taking into account the recommended fixed light intensity value of 1000Cd. The Runway Visual Range (RVR) is calculated using the measured MOR and background luminance as recommended by ICAO (2005). For this purpose a fixed lamp setting of 100 % and the light intensity curves of the centre and edge runway lights are used in line with the AMOSSG recommendation. The background luminance is measured at the end of each CAT III runway. The background luminance of the A position (take-off or landing) is used for the calculation of the visibility and RVR of the A, B (mid) en C (end) position along the runway using the MOR measured with the visibility sensor at each location. The RVR is calculated identically for arrival and departure, but RVR is calculated differently for runway 18L and 36R. The touchdown and end position interchange when the runway is used as 18L or 36R. The RVR calculation at position A, B and C uses the MOR at the respective position, but for all positions the BL from a different A position is used. The VIS calculation at position A, B and C also uses the MOR at the respective position, but the BL comes from A, A and C respectively. In a next step the backup of the RVR and VIS is taken into account. The RVR at A is not backed up, whereas B and C are backed up by A and B, respectively. The backup for VIS at B and C is the same as for RVR, but in addition VIS at A is backed up by B. At present no backup of the background luminance sensor is used. In this situation the visibility sensor of the touchdown/take-off is an accepted single point of failure. If this sensor fails than the corresponding runway is not available for CAT I operations during Low Visibility Procedure conditions. The MOR and BL sensor usage for the RVR and VIS calculation is reported in Table 3.
Table 3: Overview of the MOR and BL sensor usage for RVR and VIS calculations for CAT III runway 18L – 36R.
VIS and RVR sensor usage for CAT III runway 18L arrival and departure
Position Location MOR sensor BL sensor RVR Backup VIS Backup
A 18L touchdown A A - B B 18L-36R mid B A A A C 36R touchdown C A (C for VIS) B B
VIS and RVR sensor usage for CAT III runway 36R arrival and departure
Position Location MOR sensor BL sensor RVR Backup VIS Backup
A 36R touchdown A A - B B 18L-36R mid B A A A C 18L touchdown C A (C for VIS) B B
A*
C* 36R Arrival
C*
A*
B
B 18L Departure 18L Arrival
36R Departure mid touchdown / start end / take-off
start / touchdown mid take-off / end
Page 7 of 13 The Meteorological Observation Infrastructure at Amsterdam Airport Schiphol 6 December 2009
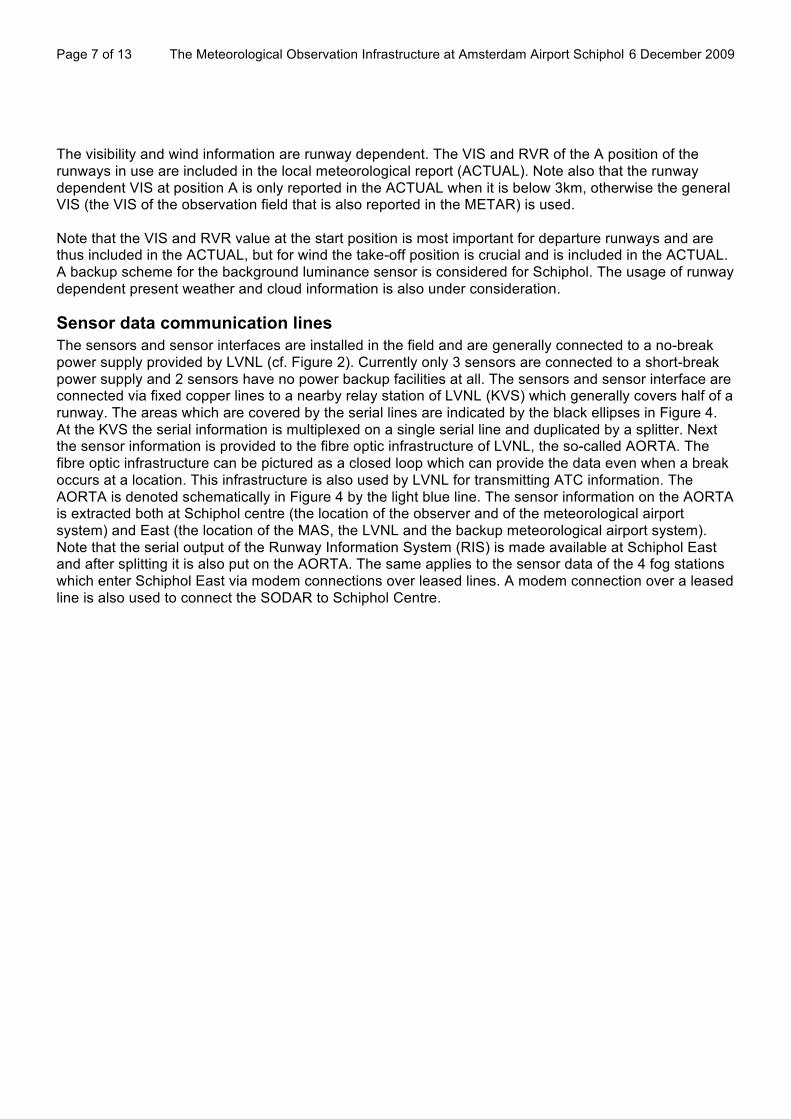
The visibility and wind information are runway dependent. The VIS and RVR of the A position of the runways in use are included in the local meteorological report (ACTUAL). Note also that the runway dependent VIS at position A is only reported in the ACTUAL when it is below 3km, otherwise the general VIS (the VIS of the observation field that is also reported in the METAR) is used. Note that the VIS and RVR value at the start position is most important for departure runways and are thus included in the ACTUAL, but for wind the take-off position is crucial and is included in the ACTUAL. A backup scheme for the background luminance sensor is considered for Schiphol. The usage of runway dependent present weather and cloud information is also under consideration.
Sensor data communication lines The sensors and sensor interfaces are installed in the field and are generally connected to a no-break power supply provided by LVNL (cf. Figure 2). Currently only 3 sensors are connected to a short-break power supply and 2 sensors have no power backup facilities at all. The sensors and sensor interface are connected via fixed copper lines to a nearby relay station of LVNL (KVS) which generally covers half of a runway. The areas which are covered by the serial lines are indicated by the black ellipses in Figure 4. At the KVS the serial information is multiplexed on a single serial line and duplicated by a splitter. Next the sensor information is provided to the fibre optic infrastructure of LVNL, the so-called AORTA. The fibre optic infrastructure can be pictured as a closed loop which can provide the data even when a break occurs at a location. This infrastructure is also used by LVNL for transmitting ATC information. The AORTA is denoted schematically in Figure 4 by the light blue line. The sensor information on the AORTA is extracted both at Schiphol centre (the location of the observer and of the meteorological airport system) and East (the location of the MAS, the LVNL and the backup meteorological airport system). Note that the serial output of the Runway Information System (RIS) is made available at Schiphol East and after splitting it is also put on the AORTA. The same applies to the sensor data of the 4 fog stations which enter Schiphol East via modem connections over leased lines. A modem connection over a leased line is also used to connect the SODAR to Schiphol Centre.
Page 8 of 13 The Meteorological Observation Infrastructure at Amsterdam Airport Schiphol 6 December 2009
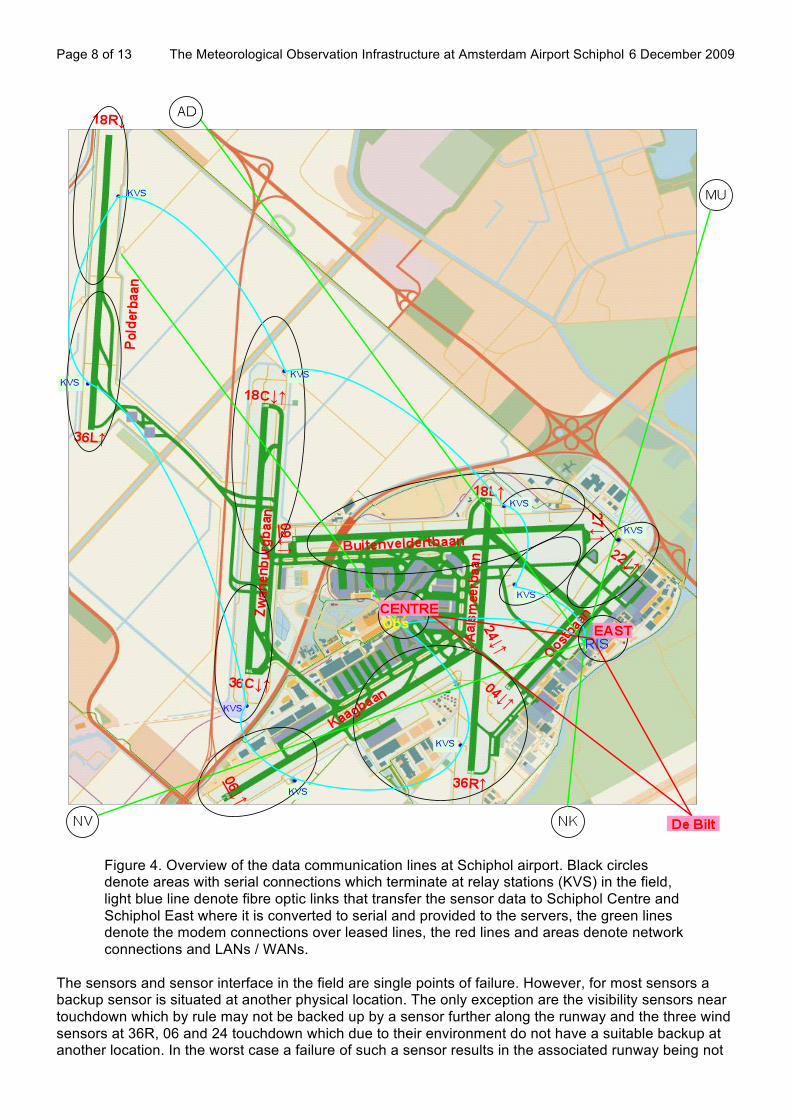
Figure 4. Overview of the data communication lines at Schiphol airport. Black circles denote areas with serial connections which terminate at relay stations (KVS) in the field, light blue line denote fibre optic links that transfer the sensor data to Schiphol Centre and Schiphol East where it is converted to serial and provided to the servers, the green lines denote the modem connections over leased lines, the red lines and areas denote network connections and LANs / WANs.
The sensors and sensor interface in the field are single points of failure. However, for most sensors a backup sensor is situated at another physical location. The only exception are the visibility sensors near touchdown which by rule may not be backed up by a sensor further along the runway and the three wind sensors at 36R, 06 and 24 touchdown which due to their environment do not have a suitable backup at another location. In the worst case a failure of such a sensor results in the associated runway being not

Page 9 of 13 The Meteorological Observation Infrastructure at Amsterdam Airport Schiphol 6 December 2009
available for CAT I operations during Low Visibility Procedure conditions. A failure of a multiplexer/splitter or connections to the fibre optic infrastructure at a KVS in the field would disable all sensors at that end of the runway and prevent the corresponding runway from being used. However, even in such a case all sensor information is available (when applicable by using an automated backup) to keep Schiphol and the other runways supplied with meteorological data. Note that there is no backup for the SODAR, but this system is not crucial for airport operations. The Runway Information System can be backed-up by the observer since the runways in use can also be selected manually, but these manual entered values are normally overruled by valid data obtained by RIS.
Central systems and network connections The sensor information which enter the fibre optic infrastructure in duplicate is extracted at 2 physically different locations, at Schiphol centre, i.e. the technical room in a building where the observer is located, and at Schiphol East, i.e. the computer room of LVNL in a building where also the Meteorological Advisor Schiphol (MAS) of KNMI is on duty in case the expected weather situation is critical. At both locations a central server is located that monitor each other. In normal operation one server is hot and ingests all sensor data, takes care of derivations (e.g. RVR and cross wind calculations and the handling of automated backup of sensors). The system also monitors the status of the sensors and prompts the observer to validate and complete meteorological reports. The sensor and derived data is generally updated every 12 seconds, about 1750 out of the total amount of 2700 variables available at Schiphol. A copy of all raw and derived data is forwarded to the cold server that stores it. The cold server continuously monitors whether the hot server is available. If communication is lost the cold becomes hot and starts processing the data. It is also possible to force a manual failover so that maintenance of the cold server can occur without interruption of the data flow. During a start-up the server checks whether a hot server is present in which case it will go into the cold mode. When 2 servers are hot, e.g. after a failure of the network communication between the 2 servers the secondary server will automatically switch to cold. At Schiphol Centre and at Schiphol East a KNMI LAN is available to which server and client systems are connected (cf. Figure 5). The LANs are connected directly, but both LANs are also connected via a WAN to the KNMI LAN of the main KNMI facilities in De Bilt. A client systems (GDIS) can be placed anywhere on the LAN/WAN and can be used to monitor the system and sensor status, view the observations, generate the reports and change the configuration. The functionality available on a GDIS depends on the user group and is password protected. Via De Bilt the observations of the Dutch meteorological network (MetNet) including the other airports are made available to other meteorological network systems of which the Schiphol system is also part. In addition the information of the precipitation radar, lightning detection system, satellite data and model forecast data is also made available from De Bilt through other applications. Hence in case of a failure of a network component or line the client and the server systems at Schiphol still obtains the local observations as well as the additional information from De Bilt. Also note that the server systems have 2 network cards and are connected to 2 separate network switches. The full sensor data set arriving at the server at Schiphol centre is duplicated and via a MOXA N-Port the data is made available on the network. At De Bilt this data can be fed into a test server system so that new software and/or configurations can be tested with live data.
Page 10 of 13 The Meteorological Observation Infrastructure at Amsterdam Airport Schiphol 6 December 2009
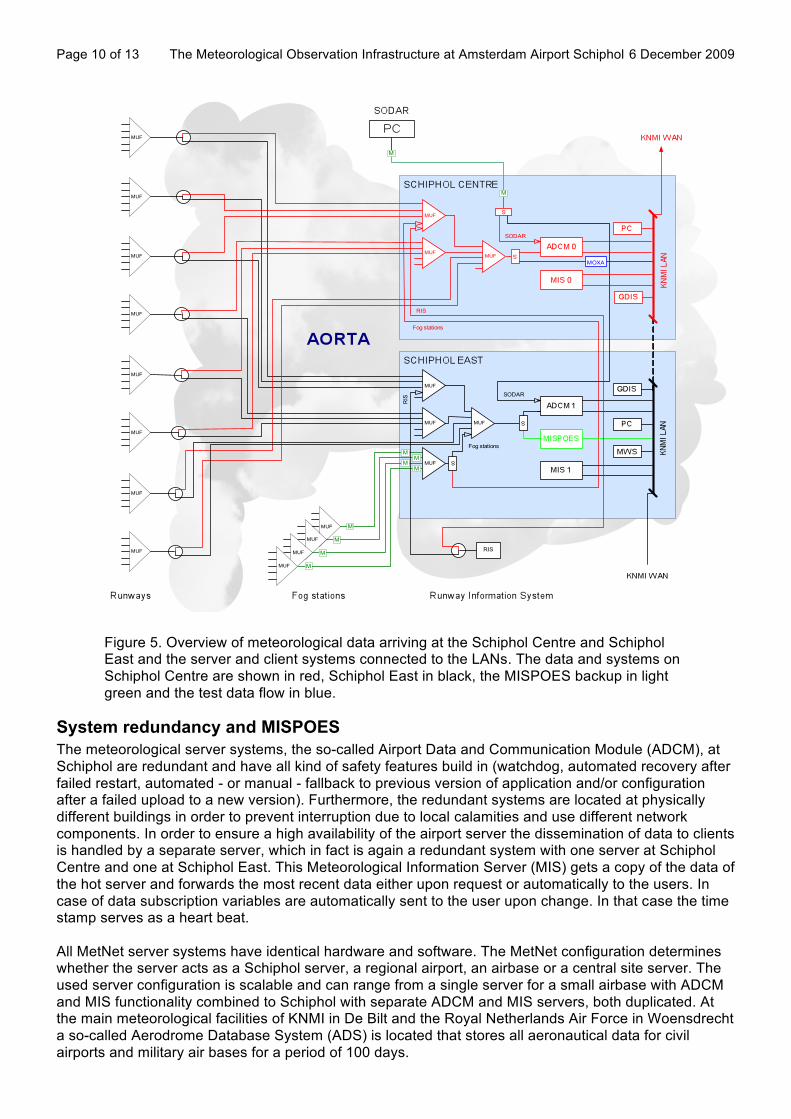
Figure 5. Overview of meteorological data arriving at the Schiphol Centre and Schiphol East and the server and client systems connected to the LANs. The data and systems on Schiphol Centre are shown in red, Schiphol East in black, the MISPOES backup in light green and the test data flow in blue.
System redundancy and MISPOES The meteorological server systems, the so-called Airport Data and Communication Module (ADCM), at Schiphol are redundant and have all kind of safety features build in (watchdog, automated recovery after failed restart, automated - or manual - fallback to previous version of application and/or configuration after a failed upload to a new version). Furthermore, the redundant systems are located at physically different buildings in order to prevent interruption due to local calamities and use different network components. In order to ensure a high availability of the airport server the dissemination of data to clients is handled by a separate server, which in fact is again a redundant system with one server at Schiphol Centre and one at Schiphol East. This Meteorological Information Server (MIS) gets a copy of the data of the hot server and forwards the most recent data either upon request or automatically to the users. In case of data subscription variables are automatically sent to the user upon change. In that case the time stamp serves as a heart beat. All MetNet server systems have identical hardware and software. The MetNet configuration determines whether the server acts as a Schiphol server, a regional airport, an airbase or a central site server. The used server configuration is scalable and can range from a single server for a small airbase with ADCM and MIS functionality combined to Schiphol with separate ADCM and MIS servers, both duplicated. At the main meteorological facilities of KNMI in De Bilt and the Royal Netherlands Air Force in Woensdrecht a so-called Aerodrome Database System (ADS) is located that stores all aeronautical data for civil airports and military air bases for a period of 100 days.
Page 11 of 13 The Meteorological Observation Infrastructure at Amsterdam Airport Schiphol 6 December 2009
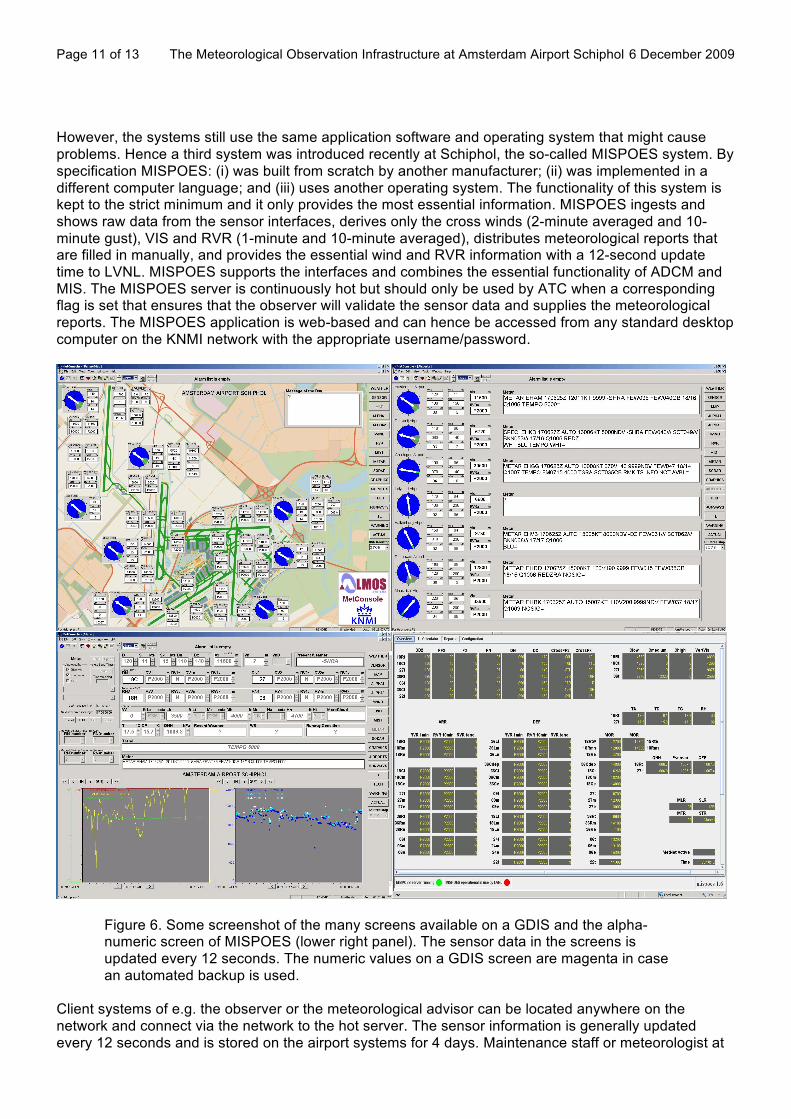
However, the systems still use the same application software and operating system that might cause problems. Hence a third system was introduced recently at Schiphol, the so-called MISPOES system. By specification MISPOES: (i) was built from scratch by another manufacturer; (ii) was implemented in a different computer language; and (iii) uses another operating system. The functionality of this system is kept to the strict minimum and it only provides the most essential information. MISPOES ingests and shows raw data from the sensor interfaces, derives only the cross winds (2-minute averaged and 10-minute gust), VIS and RVR (1-minute and 10-minute averaged), distributes meteorological reports that are filled in manually, and provides the essential wind and RVR information with a 12-second update time to LVNL. MISPOES supports the interfaces and combines the essential functionality of ADCM and MIS. The MISPOES server is continuously hot but should only be used by ATC when a corresponding flag is set that ensures that the observer will validate the sensor data and supplies the meteorological reports. The MISPOES application is web-based and can hence be accessed from any standard desktop computer on the KNMI network with the appropriate username/password.
Figure 6. Some screenshot of the many screens available on a GDIS and the alpha-numeric screen of MISPOES (lower right panel). The sensor data in the screens is updated every 12 seconds. The numeric values on a GDIS screen are magenta in case an automated backup is used.
Client systems of e.g. the observer or the meteorological advisor can be located anywhere on the network and connect via the network to the hot server. The sensor information is generally updated every 12 seconds and is stored on the airport systems for 4 days. Maintenance staff or meteorologist at
Page 12 of 13 The Meteorological Observation Infrastructure at Amsterdam Airport Schiphol 6 December 2009
the main offices of KNMI in De Bilt can also connect to the server at Schiphol in order to check the actual meteorological situation or verify the sensor and system status and change the system configuration. A copy of the airport data also goes to the central server in De Bilt which handles the synoptical and climatological data acquisition, processing, dissemination and storage. The central server in De Bilt is again a redundant system with separate servers for data acquisition, processing and report generation and a dual server pair that provides the data of the last 7 days to clients. The observer and meteorological advisor Schiphol also have access to meteorological data of the national meteorological network MetNet consisting of automated weather observing systems, but also other airports and platforms on the North Sea(cf. Wauben and Hart, 2005). MetNet also acquires precipitation radar and lightning data, satellite data and model forecasts (including TREND and TAFs) data in order to generate the automated meteorological reports for synoptic meteorology, climatology and aviation. The dual central system in De Bilt of the meteorological network is essential and here too a third backup system is located at the Royal Netherlands Air Force central meteorological facilities at Woensdrecht which also has backup systems for precipitation radar, lightning detection, and a forecasting model suite.
Considerations In this paper an overview is given of the meteorological observation infrastructure at Schiphol from sensors and data communication lines up to the central server and client systems and networks connections. Over the entire chain redundancy is built into the system, but at sensor level single points of failure exist. The visibility sensor at touchdown and some wind sensors at a runway do not have a backup. Hence the failure of such a sensor or the associated data communication systems in the field makes the runway in question unavailable for CAT I operations during Low Visibility Procedure conditions. These single points of failure are known to the users. Should such a failure occur several hours are needed to replace the sensor during office hours and even longer outside office hours. However, other runways at Schiphol are not affected by such a failure. The meteorological sensors, sensor interfaces, data communication systems, and server systems all have been selected or built to be robust, modular, with high availability. KNMI has spares for all of these components and in case of failure they can easily be replaced on site. Repair is not performed on site, but at the central facilities of KNMI in De Bilt. The performance of these components in the fields is monitored and availability numbers (Mean Time Between Failure, MTBF) are calculated. Preventive maintenance intervals are based on these numbers so that corrective maintenance is within acceptable limits. The central servers are redundant. However, to ensure the correct functioning of the backup systems they are activated by controlled failovers on a regular basis. KNMI works continually on the optimisation of the meteorological observation infrastructure, particularly at airports were meteorological information is crucial for operations. This process is performed in close cooperation with the user community. The above mentioned single point of failure at a sensor level is a mutually accepted risk. It could be solved by placing closely located backup sensors in the field using independent data communication systems to get the data to the redundant central server systems. However the costs for this, which are directly charged to the aviation community, did not outweigh the benefits. Another important issue when dealing with redundancy is that the overall system should be taken into account including the data-receiving systems of the users. It makes no sense to design a meteorological infrastructure that is out of proportion with respect to the user systems or does not adequately address the crucial single points of failure of the overall production chain. Examples of such tuning are e.g. the power facilities in the field and the usage of the AORTA where KNMI uses LVNL infrastructure. In case of a failure ATC and meteorological information will both be unavailable. Furthermore, the triple redundant meteorological server systems at Schiphol are coupled in multiple ways to a redundant system of LVNL. Open communication and insight in each others processes and systems inclusive performance and redundancy is essential for that purpose. Another way to ensure an optimal functioning of the meteorological observation infrastructure is achieved by using procedures. The Infrastructure and Weather sectors of KNMI are ISO 9001:2008 certified and work according to written instructions. The availability and timeliness (and order) of repair or replacement in case of a failure are specified in a Service Level Agreement (SLA). In case of a reported
Page 13 of 13 The Meteorological Observation Infrastructure at Amsterdam Airport Schiphol 6 December 2009
crucial failure the maintenance staff acts immediately. Afterwards an evaluation is performed in order to determine whether the failure was indeed crucial and whether the process and the problem handling worked efficiently. If necessary the procedures and instructions or even the infrastructure might be changed. The performance of the overall system and of system components is monitored continuously and reported at least on a monthly basis. The system performance and optimisation are discussed twice a year internally between the Infrastructure and Weather sectors of KNMI, between KNMI and LVNL and during a large user consultation. KNMI is careful when introducing changes to the meteorological observation infrastructure at Schiphol. All hardware components are used not solely on airports, but throughout the Dutch meteorological measurements network. Only after a sensor or another component has proven to be reliable it is implemented at Schiphol. Changes to the software or configuration are evaluated on a fully equipped test system that can also be supplied with real-time Schiphol sensor data. Test systems of LVNL can connect to the KNMI test system so that the entire chain can be verified.
References • AMOSSG • Benschop, H.: Representativiteit windmetingen, in het bijzonder op luchthavens, Technical Report
TR-277, KNMI De Bilt 2005. • Bijma, J.R.: X-SIAM Specificatie Extended Protocol, INSA Documentnummer ID-30-015, KNMI,
9 april 2008. • ICAO: Manual of Runway Visual Range Observing and Reporting Practices, Doc. 9328-AN/908, 3rd
edition 2005 • Kolkman, J., Korteweg, J.A.: Internationale benchmark capaciteit luchthavens, Kennisinstituut voor
Mobiliteitsbeleid, april 2009. • Wauben, W.M.F., Hart, D: The New Meteorological Observation Network in the Netherlands; Status
and Operational Experience, WMO-CIMO Technical Conference, TECO 2005, Bucharest, Rumania, 2005.