Aero-Thermo-Structural Trade -Off Studies for Hypersonic ... · Aero-Thermo-Structural Trade -Off...
19
American Institute of Aeronautics and Astronautics 1 Aero-Thermo-Structural Trade-Off Studies for Hypersonic Transport Gliders based on the DLR SpaceLiner Concept A. Kopp 1 German Aerospace Center DLR, Institute of Space Systems Space Launcher Systems Analysis Group, 28329 Bremen, Germany The Space Launcher Systems Analysis Group SART of the German Aerospace Center DLR has been working for several years on developing a novel hypersonic passenger transportation concept. The SpaceLiner, originally proposed in 2005, is a two staged, rocket propelled and vertical take-off transportation system designed for a 90 minutes Europe- Australia reference mission carrying 50 passengers. The SpaceLiner has gone through several design cycles, with the most recent configuration SpaceLiner7-3 currently under definition. Various papers on the vehicle design as well as design of individual subsystems have been published over the years. One important finding was the high level of interdependency of the different technical disciplines and subsystems within a large design space, which on the one hand complicates the identification of optimum design solutions, while on the other hand offering unexpected performance increase potentials. Therefore, the work presented in this paper will leave the baseline configuration of the SpaceLiner and perform parametric system studies on a broader level. The aim is to identify and quantify interactions and interdependencies within the design space in order to provide design improvements for a potential future SpaceLiner configuration, as well as for vehicles of this class in general. Thereby, this work will investigate the design task on a pure parametric way due to the high complexity of the problem. An automated system analysis loop is utilized, but no multi-disciplinary optimization procedures will be applied. The parametric studies are still in progress, with first results being presented in this paper. Nomenclature C D = Drag coefficient C L = Lift coefficient C M = Moment coefficient H = Altitude I sp = Specific impulse M = Mach number n x = axial acceleration n z = normal acceleration T/W = Thrust/weight ratio v = velocity α = Angle of attack γ = Flight path angle θ = Leading edge sweep angle AEDB = Aerodynamic data base AoA = Angle of attack CAC = Calculation of aerodynamic coefficients CEV = Crew Exploration Vehicle CFRP = Carbon fiber reinforced plastic/polymer c.o.g. = Center of gravity CoP = Center of pressure 1 Research Scientist, Space Launcher Systems Analysis (SART), DLR, Robert Hooke Strasse 7, 28359 Bremen, Member of AIAA.
Transcript of Aero-Thermo-Structural Trade -Off Studies for Hypersonic ... · Aero-Thermo-Structural Trade -Off...
American Institute of Aeronautics and Astronautics
1
Aero-Thermo-Structural Trade-Off Studies for Hypersonic Transport Gliders based on the DLR SpaceLiner Concept
A. Kopp1 German Aerospace Center DLR, Institute of Space Systems
Space Launcher Systems Analysis Group, 28329 Bremen, Germany
The Space Launcher Systems Analysis Group SART of the German Aerospace Center DLR has been working for several years on developing a novel hypersonic passenger transportation concept. The SpaceLiner, originally proposed in 2005, is a two staged, rocket propelled and vertical take-off transportation system designed for a 90 minutes Europe-Australia reference mission carrying 50 passengers. The SpaceLiner has gone through several design cycles, with the most recent configuration SpaceLiner7-3 currently under definition. Various papers on the vehicle design as well as design of individual subsystems have been published over the years. One important finding was the high level of interdependency of the different technical disciplines and subsystems within a large design space, which on the one hand complicates the identification of optimum design solutions, while on the other hand offering unexpected performance increase potentials. Therefore, the work presented in this paper will leave the baseline configuration of the SpaceLiner and perform parametric system studies on a broader level. The aim is to identify and quantify interactions and interdependencies within the design space in order to provide design improvements for a potential future SpaceLiner configuration, as well as for vehicles of this class in general. Thereby, this work will investigate the design task on a pure parametric way due to the high complexity of the problem. An automated system analysis loop is utilized, but no multi-disciplinary optimization procedures will be applied. The parametric studies are still in progress, with first results being presented in this paper.
Nomenclature CD = Drag coefficient CL = Lift coefficient CM = Moment coefficient H = Altitude Isp = Specific impulse M = Mach number nx = axial acceleration nz = normal acceleration T/W = Thrust/weight ratio v = velocity α = Angle of attack γ = Flight path angle θ = Leading edge sweep angle AEDB = Aerodynamic data base AoA = Angle of attack CAC = Calculation of aerodynamic coefficients CEV = Crew Exploration Vehicle CFRP = Carbon fiber reinforced plastic/polymer c.o.g. = Center of gravity CoP = Center of pressure 1Research Scientist, Space Launcher Systems Analysis (SART), DLR, Robert Hooke Strasse 7, 28359 Bremen, Member of AIAA.

American Institute of Aeronautics and Astronautics
2
CRS = Crew rescue stage FEA = Finite element analysis GNC = Guidance, navigation & control HySAP = Hypersonic vehicle structural analysis program L/D = Lift/drag ratio LH2 = Liquid hydrogen LOX = Liquid oxygen MDO = Multi disciplinary optimization MECO = Main engine cut-off NOM = Non optimum mass MPC = Multi point constraint SART = Systemanalyse Raumtransport (Space launcher systems analysis) SAT = Simplified ascent trajectory SGT = Simplified gliding trajectory STSM = Space transportation system mass TOP = Thermal protection system optimization program TPS = Thermal protection system
I. Introduction uborbital high speed transport is a technology that could significantly impact space transportation, since mass production of rocket propelled aircraft and their engines, as well as operating them on a routinely basis,
promises crucial reductions in the manufacturing and operation costs for space launchers. With this vision in mind, the SpaceLiner concept was developed in the Space Launcher Systems Analysis group (SART) of DLR in 2005. The original design has evolved through several successive cycles from the SpaceLiner1 to the SpaceLiner7. The latest closed configuration 7-2 is shown in Fig. 1, while its successor SpaceLiner7-3 is currently under definition. The current status of vehicle and mission design will be published in Ref. 1. The SpaceLiner is a two staged, rocket propelled and vertical lift off passenger transport aircraft. The reference mission is to carry 50 passengers from Europe to Australia or vice versa within just 90 minutes. The SpaceLiner system is composed of a winged, passenger carrying main stage also denominated orbiter, and a winged booster. Both stages are liquid oxygen (LOX) and liquid hydrogen (LH2) propelled, and fully reusable. After booster separation, the orbiter continues the ascent with its own rocket engines until main engine cut-off (MECO) at an altitude of around 75 km. Subsequently, the range flight is being performed in pure gliding mode, whereas Mach numbers of up to 24 are reached.
A special design issue for the SpaceLiner is the Crew Rescue Stage (CRS) and its integration. Rocket propelled vehicles have an inherent low reliability compared to for instance subsonic passenger aircraft. Therefore, passenger and crew are accommodated in a separate vehicle which is encapsulated in the glider stage. In case of an emergency, the CRS is able to separate from the main vehicle by igniting its solid propellant motors. To accommodate the CRS in the glider structure, a large cut-out is present in the glider roof. When integrated, the CRS upper section forms the outer moldline of the glider (Fig. 2). Previous investigations have shown, that the cutout significantly weakens the structure which in turn leads to an increase in structural mass and a reduction in natural frequencies2.
The current SpaceLiner7-3 (SL7-3) configuration is at an advanced preliminary design level. Its design involves a level of detail that greatly exceeds that of previous configurations. Thereby, the higher level of detail
S
Figure 1. SpaceLiner7-2.

American Institute of Aeronautics and Astronautics
3
investigations revealed that comparatively small design issues may significantly impact the total vehicle design and may create major design problems that are not obvious on conceptual design level. This clearly supports a famous statement of the X-15 program, that “…minor or unimportant features of a subsonic or supersonic aircraft must be dealt with as prime design problems in a hypersonic airplane.”3.
During the development of the SL7 and previous configurations, it was further found that the high level of interdependencies between the different involved disciplines and subsystems within a large an widely unexplored design space handicaps the identification of optimum design solutions, while on the other hand offering the potential for unexpected performance increases. It is therefore the subject of this paper to leave the SpaceLiner baseline configuration and perform vehicle system analysis on a broader level. Different configurations and boundary conditions will be compared. The ultimate aim is to identify and quantify interactions and interdependencies between the different disciplines on a more comprehensive level, and to formulate design improvements for a potential future SpaceLiner8 configuration, as well as for vehicles of this class in general.
The high complexity of the problem has led to a pure parametric analysis approach. No multi-disciplinary optimization (MDO) procedures will be applied. However, the vehicle system analysis is performed with the help of an automated analysis loop, which integrates all involved disciplines and their particular analysis codes.
This paper presents the first results of the analysis loop operation. This is to be complemented by more comprehensive and detailed studies in the near future.
A. Boost-Glide Vehicles The idea of rocket boosted hypersonic gliders it not new. Perhaps the first serious design within this class was
the “Silbervogel”, designed already during World War II as an antipodal bomber with potential transport applications4,5. Although never coming close to any realization and significantly underestimating problems such as aerothermal heating, the Silbervogel introduced several novel design concepts for future hypersonic vehicles and greatly influenced hypersonic research in the early stage of the Cold War.
In the 50s interest grew in military suborbital and orbital reconnaissance and strike vehicles. Typical vehicle designs of this era included the BoMi (Bomber Missile) or the RoBo (Rocket Bomber) concepts6. Civil high speed transport applications were investigated as well. For instance, in the late 50s a two-stage passenger transport aircraft was proposed with a gliding flight initial Mach number of 154,6. The target range was however limited with 3000 miles and 75 minutes flight time6. The research on boost-glide vehicles finally culminated in the development of the X-20 Dyna-Soar in the late-50s/early-60s. Within a three step approach, successive experimental vehicles should stepwise increase range and altitude capability up to global reach or even orbital capacity6. Potential missions included global reconnaissance and strike, as well as air defense and space defense scenarios6. However, the development of Dyna-Soar was cancelled in late 1963 at an already advanced design level, with more than $400M already having been spent4,6.
The interest in boost-glide vehicles never disappeared. In 90s and also in the recent years a series of investigations focused on rocket boosted gliders utilizing so called “skipping” trajectories5,7-11. During an orbital or sub-orbital reentry aerodynamic forces will quickly increase when altitude decreases. Depending on vehicle configuration and trajectory profile, the resulting aerodynamic lift forces can become so large that the vehicle virtually “bounces off” the atmosphere and gains altitude again – similar to a flat stone skipping over water. The altitude gain is limited, and shortly afterwards the vehicle descends again into the denser atmosphere layers, until lift becomes large enough for the next rebound. Several successive skips then form an osciallting trajectory, whereas these oscillations are damped and with each successive skip the amplitude as well as mean altitude and velocity decrease until the flight profiles turns into a pure gliding flight. Also powered skipping trajectories were
Figure 2. Crew Rescue Stage (CRS) design (left), CRS/glider integration (right).

American Institute of Aeronautics and Astronautics
4
investigated, where an appropriate propulsion system is utilized to eliminate the damping and to maintain mean altitude and velocity. The propulsion system may either operate along the whole trajectory, or it may be limited to short thrust impulses at the bottom of the skips in case of an air-breathing propulsion system with corresponding dynamic pressure requirements.
Skipping trajectories may in theory increase range performance compared to pure gliding trajectories. In fact, already the Silbervogel concept envisaged the utilization of a skipping trajectory. Basic analyses in the 50s indicated that the vehicle lift over drag ratio (L/D) decides whether a range advantage can be achieved12. For vehicles with low L/D ratios, below 1 according to Ref. 12, ballistic trajectories achieve similar range performance as skipping trajectories, and for L/D ratios above 4 pure gliding trajectories are competitive in terms of range. Between L/D of 1 and 4 however, skipping trajectories may offer significant range performance increases.
Unfortunately, the range increase has to be paid with major disadvantages. In particular aerodynamic heating is critical. During the bottom phase of the skip, when aerodynamic forces are large, also aerodynamic heating greatly increases. Although these phases of intensive heating are short, peak heat fluxes and surface temperatures greatly exceed those of conventional gliding trajectories, thus requiring a heavier thermal protection system (TPS) and typically also active cooling strategies. Depending on vehicle and trajectory, also the mechanical forces can become large, potentially requiring a heavier vehicle structure. Vehicle guidance, navigation and control (GNC) may be more complicated as well for skipping trajectories. When balancing range performance on the one hand, and the drawbacks in particular concerning the heavier TPS on the other hand, it is questionable wheter skipping trajectories are eventually beneficial6,12.
Earlier designs of the SpaceLiner utilized a skipping trajectory as well in order to improve range capability. The periodic normal accelerations were kept below 1.5 g and therefore remained uncritical from a structural point of view. However, the impact on passenger comfort was identified as potential disadvantage. During the SpaceLiner4 configuration development, an integrated trajectory/TPS analysis was conducted. It was found that the flight range increase of the skipping trajectory was more than outbalanced by the heavier TPS13. Consequently, the skipping trajectory was abandoned in favor of a conventional gliding trajectory, which became the baseline for all further SpaceLiner evolutions including the current SpaceLiner7.
II. Vehicle and Mission Modelling The study vehicle of this work is based on the latest SpaceLiner7 configuration, but to some extent simplified in
order to allow for rapid parametric investigations. Vehicle analysis is performed within an automated loop, although no MDO is involved as outlined in the introduction. A corresponding operation routine successively executes all software tools and assures file transfer between the different tools. The overall loop architecture is shown in Fig. 3. As shown, two iteration loops are performed. The first loop starts with the definition of the vehicle geometry. Subsequently, mass model and aerodynamics are set up. Afterwards, ascent and descent trajectory are simulated on an iterative basis, where the booster mass is varied until the targeted flight range has been achieved. Finally, TPS and structural analysis will be conducted. Within a second loop, the mass model will be updated with the computed TPS and structural masses and center of gravity (c.o.g.) positions, with successive re-computations of aerodynamics and trajectory. The loop structure allows for directly evaluating the impact of design changes on the overall vehicle performance and mass. Thereby, the focus is on the passenger carrying glider stage. The booster will only be considered on a simplified way during the ascent simulation.
A. Mission Assumptions Similar to the SpaceLiner, the payload includes 50 passengers and their luggage. The mass of the original CRS
including its payload is taken from the SpaceLiner and left unchanged. The flight mission however is simplified. The original SpaceLiner mission assumes a flight from middle Europe to eastern Australia or vice versa. The
GeometryDefinition
MassModel
Aerodynamics AscentTrajectory
DescentTrajectory
TPSSizing
StructuralAnalysis
Loop-1
Loop-2
Figure 3. Analysis loop architecture.
American Institute of Aeronautics and Astronautics
5
trajectory simulation involves a 3D tool including rotational earth and detailed gravity models. Also adaptions of trajectories are included in the simulation in order to limit sonic boom impact.
The parametric investigation presented in this paper instead relies on a simplified non-rotating earth model, with gravity and atmospheric properties only being a function of altitude, not of longitude or latitude. Also, no specific launch and landing site is specified. Therefore, it is possible to formulate a generic target flight range of 20000 km.
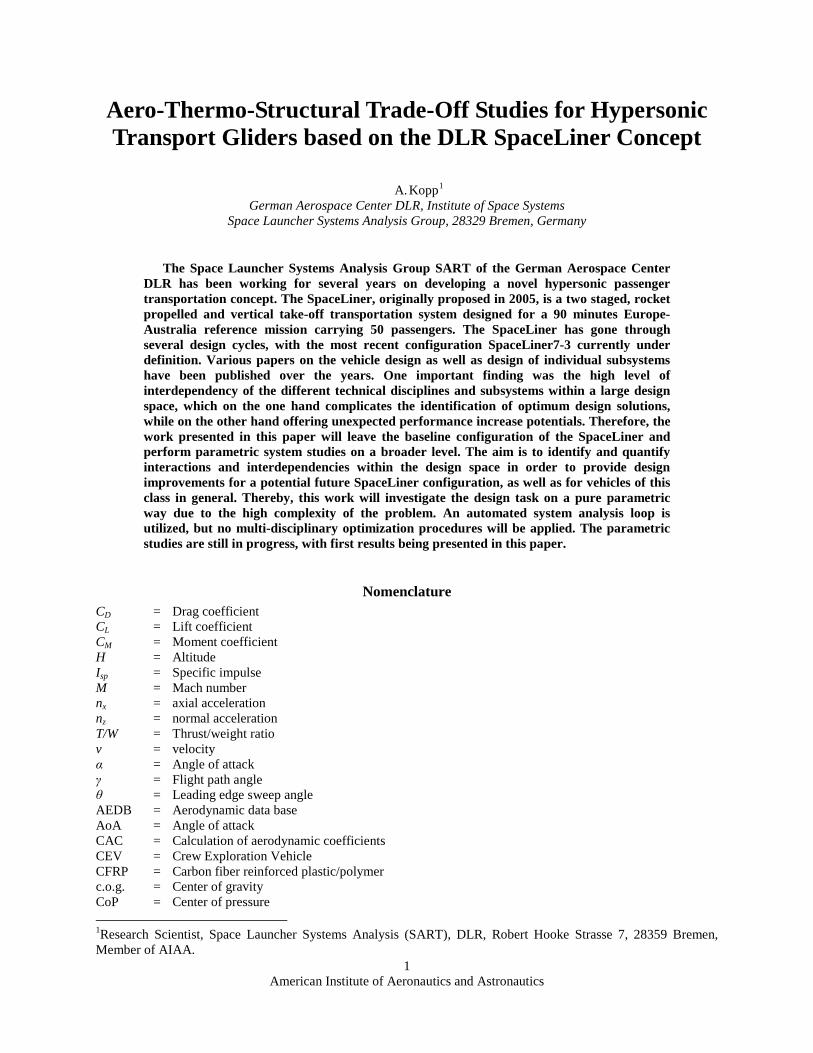
B. Vehicle Geometry The glider consists of a fuselage with cylindrical cross-section and a single delta wing attached to it. The fin and
an aft mounted body-flap are modelled as well. Fuselage and wing are automatically blended such that a flat lower surface is generated and the wing leading edge meets the fuselage nose. For longitudinal trim analysis, the aft section of the wing is equipped with wing flaps that are separately modelled. The body flap is not used for trimming in this analysis. Instead, it serves mainly for rocket nozzle protection during reentry/descent. A generic vehicle geometry is shown in Fig. 4.
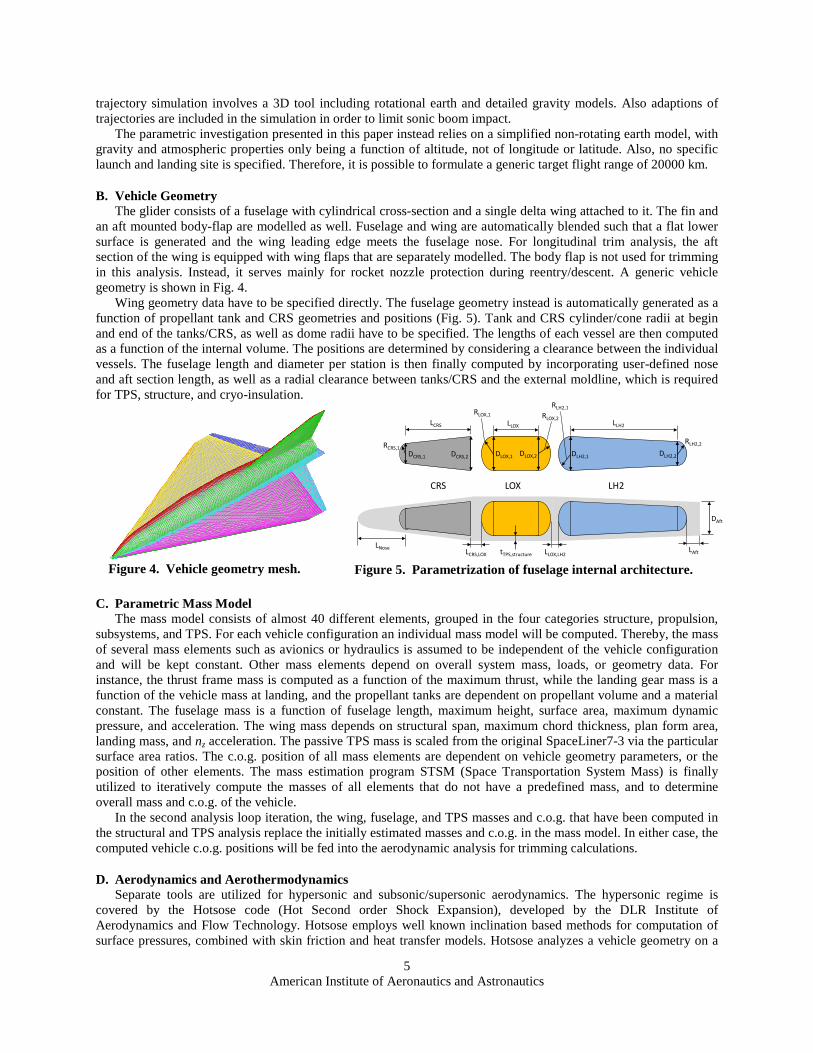
Wing geometry data have to be specified directly. The fuselage geometry instead is automatically generated as a function of propellant tank and CRS geometries and positions (Fig. 5). Tank and CRS cylinder/cone radii at begin and end of the tanks/CRS, as well as dome radii have to be specified. The lengths of each vessel are then computed as a function of the internal volume. The positions are determined by considering a clearance between the individual vessels. The fuselage length and diameter per station is then finally computed by incorporating user-defined nose and aft section length, as well as a radial clearance between tanks/CRS and the external moldline, which is required for TPS, structure, and cryo-insulation.
C. Parametric Mass Model The mass model consists of almost 40 different elements, grouped in the four categories structure, propulsion,
subsystems, and TPS. For each vehicle configuration an individual mass model will be computed. Thereby, the mass of several mass elements such as avionics or hydraulics is assumed to be independent of the vehicle configuration and will be kept constant. Other mass elements depend on overall system mass, loads, or geometry data. For instance, the thrust frame mass is computed as a function of the maximum thrust, while the landing gear mass is a function of the vehicle mass at landing, and the propellant tanks are dependent on propellant volume and a material constant. The fuselage mass is a function of fuselage length, maximum height, surface area, maximum dynamic pressure, and acceleration. The wing mass depends on structural span, maximum chord thickness, plan form area, landing mass, and nz acceleration. The passive TPS mass is scaled from the original SpaceLiner7-3 via the particular surface area ratios. The c.o.g. position of all mass elements are dependent on vehicle geometry parameters, or the position of other elements. The mass estimation program STSM (Space Transportation System Mass) is finally utilized to iteratively compute the masses of all elements that do not have a predefined mass, and to determine overall mass and c.o.g. of the vehicle.
In the second analysis loop iteration, the wing, fuselage, and TPS masses and c.o.g. that have been computed in the structural and TPS analysis replace the initially estimated masses and c.o.g. in the mass model. In either case, the computed vehicle c.o.g. positions will be fed into the aerodynamic analysis for trimming calculations.
D. Aerodynamics and Aerothermodynamics Separate tools are utilized for hypersonic and subsonic/supersonic aerodynamics. The hypersonic regime is
covered by the Hotsose code (Hot Second order Shock Expansion), developed by the DLR Institute of Aerodynamics and Flow Technology. Hotsose employs well known inclination based methods for computation of surface pressures, combined with skin friction and heat transfer models. Hotsose analyzes a vehicle geometry on a
Figure 4. Vehicle geometry mesh.
LH2LOXCRS
DLOX,1 DLOX,2 DLH2,1 DLH2,2DCRS,1 DCRS,2
LCRS LLOX LLH2
RLOX,1 RLOX,2
RLH2,1
RLH2,2RCRS,1
LCRS,LOX LLOX,LH2LAft
LNose
DAft
tTPS,structure Figure 5. Parametrization of fuselage internal architecture.

American Institute of Aeronautics and Astronautics
6
streamwise panel basis, where the flow properties on a panel depend on the properties of the adjacent upstream panel and the local panel inclination. For the vehicle model as described above, each component (fuselage, wing, fin, flaps) forms an individual entity and will be investigated by Hotsose independently. The overall aerodynamic coefficients are simply the sum of the coefficients of the individual entities. Together with aerodynamic coefficients, also pressure, temperature, and heat flux distributions over the vehicle surface can be provided.
The accuracy of Hotsose strongly depends on the vehicle geometry, as it is the case with most tools of this class. In particular, 3D effects and interactions between the individual entities cannot be covered. However, for most vehicle geometries the aerodynamic force calculations are in good agreement with CFD data or experiments. The heat flux and surface temperature calculations as well as the moment coefficient calculations are typically of lower accuracy, but usually satisfactory for preliminary system analysis and standard vehicle configurations. Great care has to be taken if trimming is performed with large flap angles. In this case, the vehicle moment coefficients may be of very limited accuracy.
Within this work, complete aerodynamic databases (AEDB) for a wide Mach/angle of attack (AoA) range will be computed with Hotsose, including CL, CD, and CM. Thereby, 5 AEDB’s will be computed for five different wing flap angles (-25°, -10°, 0°, 10°, 25°). Furthermore, Hotsose will be utilized to compute the aerodynamic pressure distributions for the structural analysis. Finally, heat flux and surface temperature histories will be computed as well for the TPS sizing.
Subsonic and supersonic (“low speed”) aerodynamics are covered by the comparatively simple tool CAC, which employs well known analytical and semi-empirical methods, in parts taken from DATCOM, for computing aerodynamic coefficients for lifting surfaces and rotational bodies. The accuracy is necessarily limited, and no pressure distributions can be computed. Moment coefficients can in principle be calculated. However, trimming in the low speed regime is neglected here due to the minor importance of the subsonic/supersonic leg with respect to the overall range performance.
The 5 hypersonic aerodynamics AEDB’s and the low speed aerodynamic AEDB will be integrated into a single AEDB for trajectory analysis.
E. Trajectory Simulation and Booster Mass Computation Two different trajectories are being simulated with two different tools. The ascent trajectory of the booster/gilder
launch package is simulated with the SAT tool (Simplified Ascent Trajectory), and the glider descent/range-flight trajectory with SGT (Simplified Gliding Trajectory). Both tools utilize the same flight mechanics and environmental modelling modules, but individual flight control routines. A spherical non-rotating earth model is assumed with 2D trajectory modelling for both programs. A very powerful 3D trajectory analysis program named TOSCA is available at DLR-SART as well, which is suited for almost arbitrary and highly accurate trajectory simulations and also includes sophisticated optimization procedures. However, TOSCA is very complex and requires “man in the loop” working to some extent, and is therefore not very well suited for automated analysis loops. For this reason the SAT/SGT tool combination has been developed for this work.
In both tools, flight control is achieved only with the help of an AoA control. Thereby, all AoA changes are allowed only with a finite pace of 2°/s during ascent, and 0.5°/s during descent. During powered ascent, a change in AoA also results in corresponding thrust vector rotations
1. Ascent Trajectory Simulation
The ascent is split into four phases. Initially, a vertical launch phase of a few second with a flight path angle of γ = 90° is considered until launch tower clearance has been reached. Subsequently, a pitch phase of a few seconds follows, where the flight path angle is slightly rotated in order to bring the launch package on the correct fligh path.
Phase three forms the longest part of the ascent trajectory and models the powered ascent of both stages until booster main engine cut-off (MECO) and subsequent booster separation is reached. Both stages are burning in phase three, and an acceleration constraint of 2.5 g is considered which induces a reduction of engine mass flow in case of too high accelerations. The aim of phase three is to achieve a predefined flight path angle at booster MECO. In this analysis, γ = 1° is selected as target flight path angle. Thereby, the phase three ascent is completely performed with an AoA of 0° to reduce aerodynamic losses. Thus, the flight path angle at booster MECO is only a function of the pitch phase shortly after lift-off. With the correct pitch rate in this phase, gravity turn alone will assure that the launch package achieves the targeted fligh path angle at booster MECO. Consequently, the task is to find the correct pitch rate in phase two. This problem is simply solved on a iterative basis. Several successive trajectories are being simulated with varying pitch rate. Via bisection, the correct pitch rate can quickly be found.
After booster MECO, the glider continues its acceleration until glider MECO. A propellant cross-feed system is assumed during the phase three joint ascent similar to that of SpaceLiner7, which feds the glider engines with
American Institute of Aeronautics and Astronautics
7
propellants from the booster tanks. Thus, after booster MECO the glider tanks are still completely full. During the glider acceleration the vehicle aims on achieving and then maintaining a flight path angle of 0°. This is enabled with the help of a simple AoA control law that stepwise increases or decreases AoA if the flight parh angle is ≠ 0. The 2.5 g acceleration limit of phase three is maintained as well which may lead to a mass flow reduction around the end of the glider acceleration. Finally, a stagnation point heat flux limit is considered. If violated, the glider stepwise increases AoA to increase altitude and reduce heat loads. In most cases however this criterion is relevant.
The sea level and vacuum specific impulses (Isp) for both stages, as well as the mass flow for the glider will be taken from the SpaceLiner7. The mass flow of the booster instead will be varied in order to match a constant thrust to weight (T/W) ratio for changing booster designs (see sub-section 3).
2. Descent/Gliding Trajectory Simulation
After glider MECO, the task of SAT is completed, and the final flight conditions are transferred to the SGT gliding flight simulations and form here the simulation start conditions. The gliding flight phase targets the maximization of the range. In theory, cruising with AoA for maximum lift/drag ratio (L/D)max would be appropriate. However, this would lead to significant skipping behavior. For the reasons discussed in the introduction, in particular thermal considerations, skipping is to be suppressed and a smooth gliding flight is preferred. The suppression of skipping is once again achieved on an iterative basis. Thereby, an initial trajectory is simulated with AoA for (L/D)max. From this initial trajectory, an average sink speed vz is determined. For successive trajectory simulations, the average sink speed of the initial trajectory shall be transformed into a continuous sink speed with the help of an AoA control. This control law increases the AoA if the sink speed is higher than the target sink speed, and decreases AoA if the sink speed is too low. To avoid excessive AoA control, a tolerance around the target sink speed is defined, which eventually forms a sink speed corridor. If the vehicle is within the sink speed corridor the AoA will be changed to AoA for (L/D)max.
The flight control is complemented by trimability and heat flux constraints. For a given Mach number, the vehicle is only allowed to operate at angles of attack that enable trimmed flight. The required flap angle and the corresponding aerodynamic coefficients for a given Mach/AoA combination will be interpolated from the data in the joint AEDB. As outlined, no trimming is considered in the supersonic and subsonic leg. The stagnation heat flux limitation constraint stepwise increases the AoA if violated, similar to the procedure in the ascent simulation. Dynamic pressure and acceleration constraints are considered as well but in most cases not relevant due to the comparatively low loads. The simple heat flux and mechanical load constraining AoA control works very well for smooth trajectories with small gradients as it is the case here. For other cases with higher gradients more sophisticated control laws need to be considered.
The average sink speed matching control law applies not for the complete trajectory. Instead, a final Mach number is defined, here 3.0, after which the control law changes and the vehicle simply adapts AoA in such a way that (L/D)max is reached and maintained during the remainder of the flight.
3. Booster Mass Calculation
The target flight range is fixed. Therefore, the task is to find the minimum vehicle mass that is able to achieve the target flight range. Since the launch package consists of two stages, adaption of propellant mass in both stages would be an option. However, to simplify the problem, only the booster propellant mass is adapted, while the glider propellant mass is kept constant. Together with a change of booster propellant mass, also the dry mass of the booster will obviously change. Thereby, a constant dry mass ratio for the booster is assumed. Under this assumption, the booster dry mass scales with the booster propellant mass. Strictly, this is not correct since the dry mass fraction of a launch vehicle is typically a function of the total system mass. However, if the booster mass variation remains within a limited range, the assumption is valid without large errors.
No detailed design of the booster stage is done. Instead, the original booster dry mass ratio of the SpaceLiner7 is utilized. The thrust to weight ratio at ground is kept constant as well. With the Isp data from the SpaceLiner7 booster, the thrust can be computed, whereas the mass flow is adapted in order to meet the targeted T/W ratio. As a further simplification, the ascent AEDB as computed for the SpaceLiner7 booster will be taken and left unchanged, even if the booster mass changes. Due to the limited booster size variation as well as the limited impact of aerodynamics for vertical ascent vehicles, this simplification is considered to be acceptable.
4. Range Optimization
The ascent and descent trajectory simulations are repeated within an iterative loop. The achieved flight range is compared with the target flight range of 20000 km. Subsequently, the booster mass is adapted for the next iteration.

American Institute of Aeronautics and Astronautics
8
If the correct booster mass has been reached that yields the target flight range, the trajectory simulation is finished. A convergence tolerance of 0.5 % (= 100 km) is considered to improve convergence behavior.
This iterative approach has been employed since the required booster mass is not accurately predictable a priori. This is because the actual flight range strongly depends on the actual flown trajectory profile of the glider. For instance, changes in the initial conditions of the gliding trajectory (v, H, γ) will not necessarily directly scale into corresponding flight range changes. For instance, a slight increase in initial velocity could enforce more AoA controlling of the glider in order to remain within heat flux limitations. As a result, the average flown L/D may decrease.
F. Thermal Protection The TPS consists of a passive and an active TPS. For the major part of the vehicle surface, a passive protection is
sufficient, while for nose and leading edge regions an active protection is required due to excessive local heating. 1. Passive TPS The passive TPS is sized by a 1D heat conduction
analysis as performed with the tool TOP2 (TPS Optimization Program). Thereby, the vehicle surface is segmented into several equilibrium surface temperature regions (12 or 13 in this work). For each temperature region an individual TPS with individual thickness is computed, whereas five different TPS materials are used (Table 1). Each material consists of several layers including for instance cover sheets, insulations, or adhesives. The insulation layer thickness is optimized, while the other layer thicknesses are held constant. The vehicle primary structure forms the last layer of the analysis. The insulation thickness sizing considers the integral heat load of the whole trajectory and optimizes the thickness such that a predefined structural temperature is never exceeded during the mission. Applications of the tool for the SpaceLiner7 have for instance published in Ref. 2 and Ref. 14.
2. Active TPS During this work, maximum operation temperatures of 1850 K are assumed for the passive TPS with reusability
considerations in mind. In the leading edge and nose regions however, equilibrium temperatures are much higher. Water based transpiration cooling is utilized here. Thereby, a target temperature is defined to which the surface in the region of active TPS has to be cooled down. In this work, 1500 K is assumed. Subsequently, the heat flux is computed that would yield the desired 1500 K. This is compared with the actual heat flux at each point of the TPS. The difference is the heat flux that has to be covered by the water. Integration over the complete trajectory yields the total heat load to be absorbed. The required cooling water mass is computed by considering the vaporization enthalpy of the water. More details of the active cooling approach have been published in ref. 15.
G. Structural Analysi Structural analysis is performed using the ANSYS based
HySAP program (Hypersonic vehicle Structural Analyis Program). HySAP combines Fortran based preprocessor and sizing routines with the ANSYS Mechanical APDL environment. The overall program architecture is shown in Fig. 6. The pre-processor HySAP prepares vehicle external and internal geometry, load cases and pressure distributions, subsystem masses and positions and all other process data for ANSYS and generates a corresponding APDL input file. The input file includes all information hat ANSYS needs for fully automated modelling and structural analysis. After finishing the finite element (FE) solution, ANSYS transfers the computed stress and moment resultants to the sizing program
Table 1. Surface temperature ranges and associated TPS materials.
Temperature range [K] Material 400-600 FRSI 600-700 AFRSI 700-800 AFRSI 800-900 AFRSI 900-1000 TABI
1000-1100 TABI 1100-1200 TABI 1200-1300 TABI 1300-1400 TABI 1400-1500 AETB-TUFI 1500-1600 AETB-TUFI 1600-1700 CMC 1700-1850 CMC
Figure 6. HySAP general architecture.

American Institute of Aeronautics and Astronautics
9
SIZER, which adapts the structural wall thicknesses and stiffener dimensions according to strength and stability design criteria. The adapted structural thicknesses will be sent back to ANSYS, which restarts the analysis. This procedure is repeated for an arbitrary number of successive load cases until convergence has been reached.
1. Geometry Modelling The whole vehicle model consists of shell elements only. Spar and frame caps are assumed to be smeared with
the adjacent skin panels. The wing structure consists of spar, rib and skin panels. The fuselage is composed of frames and skins. Load carrying tanks may be modelled as well as done in earlier publications2,16,17. However, in this analysis the tanks are assumed to be non-integral and non-load-carrying. Thus, they are not modelled discretely and instead considered as mass elements.
The internal architecture consists of fixed and free members. The fixed members are those members that are required for supporting discrete local load introductions. This includes for instance frames at the cylinder beginning and end positions of tanks and CRS or main gear support spars and ribs. Thereby, the required main gear length and the corresponding position of gear supporting members is computed for a predefined landing speed of M = 0.3. The position of all fixed members is computed and assigned automatically. The remaining space between the fixed members may be filled with additional members, which is done in an automated procedure as well by processing user defined rib, spar, and frame spacing. The combination of fixed and free members usually leads to a non-homogenous spacing.
TPS integration may be considered as well, whereas the outer moldline is assumed to remain unchanged. TPS integration is done by processing the TPS thickness distribution as provided by TOP2, and reducing the structural height by shifting the geometry definition key point in the ANSYS model. The resulting decrease in structural height will lead to increased bending stresses and an increase in structural mass, as shown in Ref. 2 and ref. 16.
2. Load Cases and Loads Modelling
A total of five load cases are considered: 1) Maximum nx during ascent, glider attached to booster 2) nz = 2.5 g hypersonic maneuver with flaps down 3) nz = 2.5 g hypersonic maneuver with flaps up 4) nz = -1.0 g hypersonic maneuver with flaps down 5) Main gear touch down with nz = 1.5 g
All load cases are symmetric. For the three flight load cases the inertia relief capability of ANSYS is exploited.
The required pressure distributions are computed by Hotsose for an assumed total vehicle mass as computed by the STSM mass estimation. Since the structural mass will change during the structural analysis, the desired acceleration levels are only met approximately.
The pressure distributions are computed on an iterative way, where the AoA is varied via bisection until the AoA is achieved whose aerodynamic forces yield the desired acceleration level. The flap forces are included in the nz calculation, which leads to different AoA for load case 2 and 3. Thereby, the flap forces are simply computed with Newtonian theory by assuming the maximum allowed flap angle. This approach is employed since deflected flaps are modelled on the aerodynamic side, but not in the ANSYS geometry model. Instead, the computed flap forces will be introduced as an array of discrete normal forces in the flap area of the wing. Depending on the AoA and flap deflection direction, shading effects need to be considered, which indeed often leads to zero flap forces for load case 3. For all three free flight load cases the flight point of maximum dynamic pressure during the descent is used for generating the pressure distribution. A scaling approach is utilized to harmonize total aerodynamic forces as computed by Hotsose, and the total aerodynamic force as modelled in ANSYS. This is required since the ANSYS geometry model is much coarser than the aerodynamic model and the interpolation is therefore not exact. Furthermore, this approach allows consideration of friction forces that are not included in the pressure distribution, but may increase axial deceleration when considered. Note that in the flight load cases the vehicle is not necessarily in static equilibrium.
In load case 1 and 5 no aerodynamic forces are considered. In load cases 1 the vehicle is clamped at the booster at two axial stations. The maximum x-acceleration during the ascent is imposed, as well as a lateral acceleration of 0.5 g. In load case 5 the vehicle is modelled as clamped at the main landing gear positions with an imposed normal acceleration of 1.5 g.
Subsystem masses are modelled as point masses. Wing subsystems are directly attached to the closest rib/spar intersection. Fuselage subsystems instead will be modelled as an array of mass points that is distributed at the bottom or the top of the closest frame station. An alternative subsystem modelling procedure via multi-point-

American Institute of Aeronautics and Astronautics
10
constraints (MPC) is available as well and has been used in earlier analyses for the SpaceLiner2,16,17. However, their stiffness may lead to unrealistic effects in the structural analysis when not carefully selected, in particular when considering thermal expansion effects. Also, too many MPC’s in the model may lead to issues in the FE solutions.
The mass of the thermal protection system is distributed over the vehicle surface as an array of mass points as well. Propellant masses are only relevant for load case 1, since for all other load cases the tanks are empty. The propellant mass forces of both tanks are modelled as a number of mass elements that are distributed around the circumference of the frame station where they are mounted.
Thermal loads are considered as well. A complete heat distribution analysis within the vehicle interior is not possible within this parametric investigation. Instead, a simplified approach is utilized. The allowed structural temperature, which is equal to the temperature of the last layer in the TPS sizing analysis, is imposed to the wing and fuselage skins. The internal rib, spar, and frame members instead are assumed to be at room temperature. This reflects the strong transient character of the heating history in the first part of the trajectory. The resulting temperature gradient between hot skin and cold internal members represent a worst case scenario in terms of thermal stresses. These temperature loads are considered in load cases 2-5, while during ascent load case 1 the complete structure is considered to operate still at room temperature. 3. Panel Modelling
Structural panels include wing and fuselage skin panels, wing rib and spar panels, and fuselage frames. Different stiffening concepts are available, whereas in the work presented in this paper only honeycomb sandwich panels are considered due to the dominance of biaxial stress systems in the model. The panel stiffnesses are directly computed by the SIZER tool and fed into ANSYS. This differs to earlier HySAP versions where layered shell elements were used, and the engineering constants of each layer transferred to ANSYS. The stiffness computations are based on a smeared approach and include thermal effects. CFRP (Carbon Fiber Reinforced Plastic/Polymer) skins can be modelled as well, whereas a panel is assumed to consist of 0°, 90° and+/-45° plies.
4. Structural Sizing
The panel stiffness data as sent to ANSYS do not include information about panel height or neutral plane positions. Therefore, ANSYS is not able to compute stresses and only provides stress and moment resultants (forces and moments per meter). Thus, the stress computation is done externally by the SIZER program. An individual coordinate system is assigned to each panel, and the stresses are always computed in the local panel coordinate system. For CFRP materials, the stress in each layer is computed separately.
The structural optimization procedure sizes each structural panel individually according to its local stress environment. The honeycomb core heights are generally sized such that global buckling of the panel is avoided (except for frames/bulkheads). The sandwich skins are sized by von Mises stress for metallic materials and Tsai-Hill for CFRP composites, as well as by wrinkling, shear crimping, and intracellular buckling. While for metallic skins simply the thickness of the facesheets is increased or decreased, the CFRP analysis procedures also consider the number of plies in each of the four directions (0°/90°/+/-45°). A simple sizing law is employed which increases the number of plies of that ply orientation that fails when stress is critical, while in buckling cases the adaption procedure stepwise equalizes the number of the plies in the four directions. In any case, the laminate is always symmetric and balanced and requires at least 10 % of plies in each orientation. Consequently, at least 8 plies are required for each facesheet, whereas a thickness of 0.1 mm per ply is assumed. A stacking sequence is not set up. Instead, the properties of the different plies are smeared over the panel thickness with respect to their particular percentage.
In this work, a minimum gauge thickness of 0.5 mm is assumed for metallic facesheets. For composites the minimum thickness is 0.8 mm due to the 0.1 mm ply thickness and the minimum required 8 plies.
A yield safety factor of 1.5 is considered for metallic materials. For CFRP composites however this is increased by 10 % to 1.65 to account for simplifications and uncertainties in the CFRP sizing procedure.
Convergence is assumed when the total structural mass of the vehicle within four successive iterations does not change by more than 1.5 % anymore. In some cases slightly higher tolerances were used to improve convergence behavior.
The computed structural masses are increased by non-optimum-mass (NOM) factors that cover various items that are not modelled in the FEA, such as fasteners, joints, cut-outs, secondary structural elements and similar items. NOM form a significant part of the overall structural weight. For instance, Ref. 18 estimates that the (optimum) structural weight modelled in FE corresponds to only 40-80 % of the actual structural weight for conventional structures, and even only 30-60 % in case of sandwich or CFRP composites. Unfortunately, limited experience exists with NOM for hypersonic vehicles. Therefore, a simplified procedure has been developed and implemented,

American Institute of Aeronautics and Astronautics
11
based on data for passenger aircraft, rocket launch vehicles, and theoretical hypersonic vehicle concepts. A summary of the proposed approach may be found in Ref. 2.
5. Materials
The materials considered in this analysis are listed in Table 2. Temperature dependent material data have been compiled from various sources. In some cases, extrapolations were necessary, or certain material properties had to be scaled from or directly taken from similar alloys. For instance, Al-2014 coefficients of thermal expansion have been taken from Al-2024 alloy.
III. Results and Discussion
A. Preliminary Structural Material Considerations In the coming sub-sections it will be shown that the complete loop analysis in some case leads to unexpected
results due to the strong interaction between the disciplines and different effects that are working in opposite directions. Thus, it is useful to discuss some initial considerations on isolated discipline level in order to define some benchmarks for comparison.
Prior to the analysis shown in this paper, structural material trade-offs have been performed for the SpaceLiner7 baseline configuration. The model was simplified with neither a CRS cutout included, nor TPS-integration considered. Figure 7 displays external and internal structural configuration.
Figure 8 shows the resulting structural masses (wing plus fuselage) as a function of allowed structural skin temperature for 293 K, 400 K, 480 K, and 530 K. The internal structural members are left on room temperature (293 K). The results are not directly comparable with the results to be discussed in the coming section due to differences in structural configuration and load assumptions. Nevertheless, the orders of magnitude and trends are valid and are interesting for comparison with the later discussed complete loop results.
The horizontal red line marks the result of the empirical/statistical mass estimation. A large range of different structural masses can be obtained, whereas the two CFRP composites and aluminum-lithium yield a mass below the mass estimation, while the other materials produce higher structural masses. Results for temperature levels above 400 K could only be obtained for titanium and PETI based
Table 2. Materials used in the structural analysis. Material Considered
temperature range [K] Material
properties source
Comments
Al-2014 350-400/450 Ref. 19, Ref. 20 Standard aluminum alloy Al-2195 350-450 Ref. 21 Aluminum-lithium alloy Ti-6Al-4V Heat-treated 350-575 Ref. 19, Ref. 20 Titanium alloy IM7/977-2 350-400 Ref. 22 CFRP composite IM7/PETI-5 350-500 Ref. 22 CFRP composite
Figure 7. ANSYS model of the simplified SL7 external and internal structural configuration without CRS cutout and TPS integration.
25000
30000
35000
40000
45000
50000
250 300 350 400 450 500 550
Stru
ctur
al m
ass [
kg]
Structural skin temperature [K]
Ti-6Al-4V HT
AL-2014
AL-2195
LockAlloy
IM7/977-2
AL-2024
STSM
IM7/PETI-5
Figure 8. Structural mass (wing plus fuselage) for different materials; simplified vehicle model without CRS cutout and TPS integration.

American Institute of Aeronautics and Astronautics
12
CFRP, whereas the maximum use temperature of the latter is stated to be around 500 K. All other metals suffered from severe thermal stresses and material degradations at higher temperatures, while for IM7/977-2 CFRP no material data were available above 400 K.
The weight advantage of CFRP composites is obvious. However, it has to be mentioned that the analysis procedure to some extent penalties metals compared to composites. This is because a constant temperature difference is assumed between the outer skin and the interior for all materials which generates corresponding thermal stresses. In reality however, the temperature differences, and consequently also thermal stresses, may be lower for metals since their higher heat conductivity allows for a quicker smoothing out of thermal gradients.
Furthermore, also minimum gauge thickness considerations are important for material comparisons. Large parts of the vehicle are sized down to minimum gauge thickness, which is here assumed to 0.5 mm per facesheet. For components at minimum gauge thickness, low density materials obviously have a weight advantage compared to heavier materials, even when having similar specific strengths and stiffness. This behavior in particular penalties titanium compared to other materials.
The weight comparison also reveals large differences between the two aluminum alloys 2014 and 2024. The latter alloy is extensively used in passenger aircraft structures due to its good fatique performance. However, 2024 alloy yields an around 14 % heavier structure. This is mainly a result of the superior specific strength of 2014.
The performance of beryllium based LockAlloy is surprisingly disappointing when considering that its specific stiffness is around 3 times as high as that of other materials, and its density is very low as well. However, its specific strength is not as good as that of other materials and major parts of the airframe are sized by strength criteria rather than stiffness/stability.
B. Complete Loop Iteration Results The configuration that is investigated in the loop iterations includes CRS cut-out, as well as TPS-integration. The
external and internal structural configuration is shown in Fig. 9.
1. Material Trade-Offs Initially, complete analysis loops were conducted for different structural materials. The results are shown in
Fig. 10. The passive TPS mass is shown as well. Some interesting effects are present that are not intuitively expected, in particular when compared with the preliminary structural considerations discussed previously in section A. One result is that the increase in structural mass with increasing temperatures is much lower, or even not existing. The most surprising result is that the titanium vehicle exhibits a clear trend of decreasing weight with increasing skin temperature, whereas a minimum is present in the 500-550 K region. This appears to be unrealistic at the first glance and contradictory to the intuitively convincing results shown previously in Fig. 8. However, closer inspection of the calculation results in fact reveals a physical reasonable behavior, which is caused by the TPS integration. For a given outer moldline and given internal tank/CRS diameters, the integration of TPS yields to a reduction of available wall thickness for the primary structure. This is in particular critical for fuselage frames. The depth of the latter decreases significantly with increasing TPS thickness, yielding to extreme stress levels at local portions of the frame. Since each frame is sized according to the maximum stress level that is present within the frame, the frames may become very heavy for a thick TPS. Also, the geometrical moments of inertia decrease for wing and fuselage when the TPS becomes thicker, leading to higher bending stresses. Finally, also the distribution of the TPS in form of mass elements over the vehicle surface has an effect on the wing structure. A heavier TPS weight on the wing is not very critical for the flight load cases, but significantly increases stresses in the wing structure for the landing load case.
Note that the discussed effect of structural mass increase due to TPS integration is a result of the constant outer moldline assumption. In vehicle pre-design often the structural surface is kept constant and the TPS thickness is added to the latter. Accordingly, the outer moldline changes when the TPS thickness changes. This does not penalty
Figure 9. ANSYS model of the external and internal structural configuration.

American Institute of Aeronautics and Astronautics
13
the primary structure members since their dimensions and moments of inertia are left unaltered. However, in this case vehicle drag increases due to higher surface area and frontal cross-section.
Figure 10 also reveals that CFRP composites perform extremely well compared to the metals. A major weight decrease is to be expected of course. For instance, Ref. 23 states that the composite airframe designed for the X-34 experimental vehicle enabled a weight decrease of 30 % compared to a metal design, whereas the structure was designed to operate at 450 K (350°F). The weight savings computed here are even higher. For instance, at 350 K the IM7/PETI-5 structure is more than 40 % lighter than the Al-2014 airframe despite the slightly higher safety factor used in this work for composites. Therefore, in future works it needs to be checked whether the simplified modelling of CFRP in the structural analysis needs to be improved, or if the estimated weight savings can actually be reached. Indeed, a preliminary structural sizing analysis for the Crew Exploration Vehicle (CEV) conducted in Ref. 24 comes to similar results with weight savings in the order of 40 % for an IM7/977-2 based sandwich compared to an aluminum 2219 design. When comparing the CFRP composite with Titanium, the weigh savings presented in Ref. 24 are even higher than found in the analysis here.
The passive TPS mass as shown in Fig. 10 is computed only once in the first iteration of the analysis loop described in Fig. 3. Therefore, it is identical for vehicles with identical allowed structural surface temperatures. A recomputation of the TPS with the iteration-2 trajectory would change TPS masses, but was omitted here for time reasons.
In Fig. 11 the TPS mass is added to wing and fuselage structure mass. The mass minimum for a titanium structure in the 500-550 K area becomes even more obvious.
Figure 12 shows the required booster mass for the target range of 20000 km. An increase in glider mass translates into a booster mass increase, whereas a large growth factor is present. However, note that the booster mass is not only a function of the glider mass to be carried, but also depends on the gliding flight trajectory, which differs significantly for gliders with different masses.
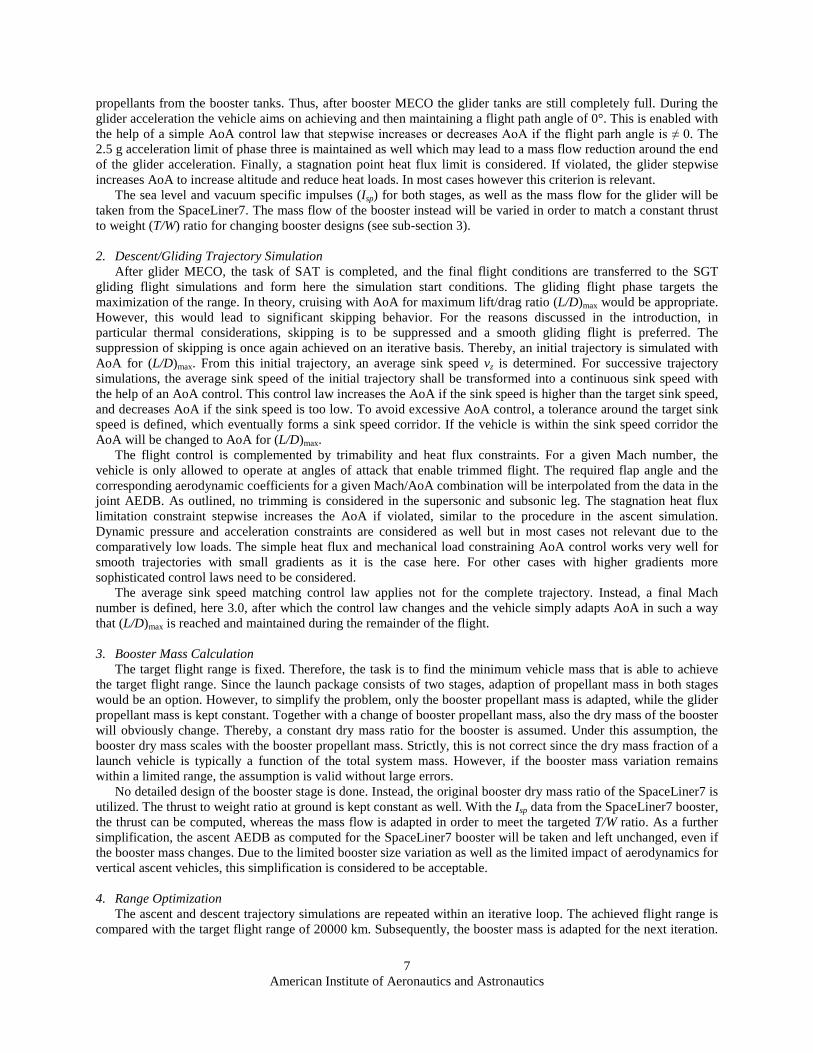
Different flight trajectories also lead to different cooling water consumptions. In contrast to the passive TPS, the active TPS cooling water mass was recomputed for the second trajectory iteration. This is shown in Fig. 13. The trajectory of heavier vehicles increases cooling water requirements. A sudden jump in cooling water mass for the titanium vehicle is present at 550 K, which initially appears to be an error/miscalculation. However, when displaying the cooling water mass as a function of structure + TPS mass (which is proportional to overall vehicle dry mass), the jump seems to be part of a trend (Fig. 14). With increasing structure+TPS mass (= proportional to increasing vehicle
0
10000
20000
30000
40000
50000
60000
70000
300 350 400 450 500 550 600
Stru
ctur
al m
ass,
TPS
mas
s [kg
]
Structural skin temperature [K]
Al2014
Al2195
Ti6Al4V-HT
IM7/977-2
IM7/PETI-5
Passive TPS
Figure 10. Structural mass (wing plus fuselage) for different materials, and passive TPS mass.
40000
50000
60000
70000
80000
90000
100000
300 350 400 450 500 550 600
Stru
ctur
e +
pass
ive
TPS
mas
s [kg
]
Structural skin temperature [K]
Al2014
Al2195
Ti6Al4V-HT
IM7/977-2
IM7/PETI-5
Figure 11. Added structure (wing plus fuselage) and passive TPS mass for different materials.
0
500000
1000000
1500000
2000000
2500000
300 350 400 450 500 550 600
Requ
ired
boos
ter m
ass [
kg]
Structural skin temperature [K]
AL-2014
AL-2195
Ti6Al4V-HT
IM7/977-2
IM7/PETI-5
Figure 12. Required booster mass for different materials.
American Institute of Aeronautics and Astronautics
14
dry mass), the cooling water mass slowly increases, until at a certain point a jump in cooling water mass up to a higher level occurs. It is not yet clear whether this observation correctly represents a real physical behavior. But it is not completely implausible when considering the impact of vehicle mass on flight trajectory, as discussed below. Nevertheless, some more detailed investigations of the calculation results will be done.
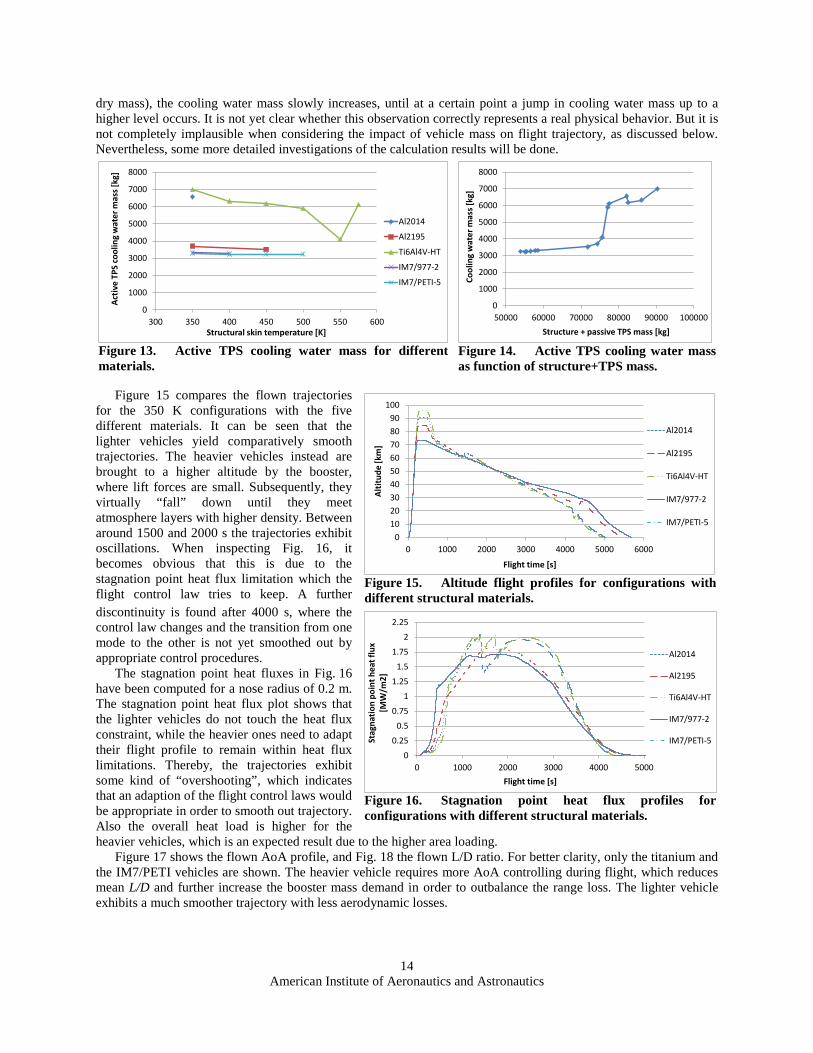
Figure 15 compares the flown trajectories
for the 350 K configurations with the five different materials. It can be seen that the lighter vehicles yield comparatively smooth trajectories. The heavier vehicles instead are brought to a higher altitude by the booster, where lift forces are small. Subsequently, they virtually “fall” down until they meet atmosphere layers with higher density. Between around 1500 and 2000 s the trajectories exhibit oscillations. When inspecting Fig. 16, it becomes obvious that this is due to the stagnation point heat flux limitation which the flight control law tries to keep. A further discontinuity is found after 4000 s, where the control law changes and the transition from one mode to the other is not yet smoothed out by appropriate control procedures.
The stagnation point heat fluxes in Fig. 16 have been computed for a nose radius of 0.2 m. The stagnation point heat flux plot shows that the lighter vehicles do not touch the heat flux constraint, while the heavier ones need to adapt their flight profile to remain within heat flux limitations. Thereby, the trajectories exhibit some kind of “overshooting”, which indicates that an adaption of the flight control laws would be appropriate in order to smooth out trajectory. Also the overall heat load is higher for the heavier vehicles, which is an expected result due to the higher area loading.
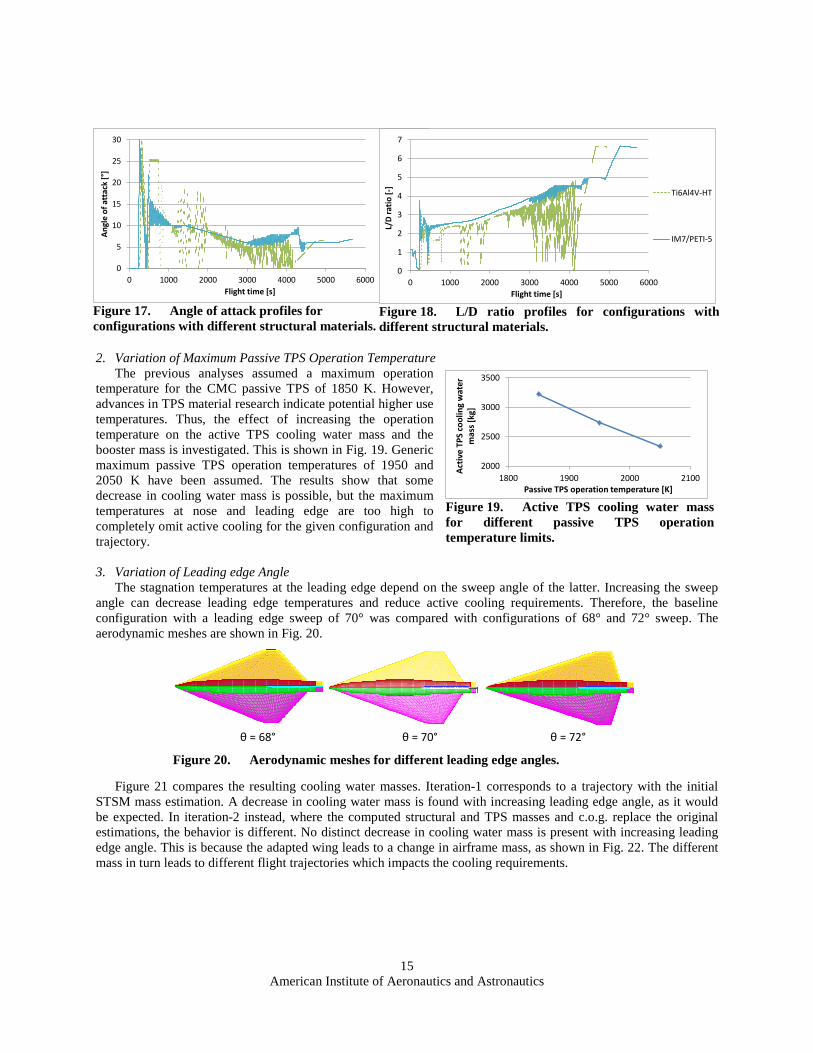
Figure 17 shows the flown AoA profile, and Fig. 18 the flown L/D ratio. For better clarity, only the titanium and the IM7/PETI vehicles are shown. The heavier vehicle requires more AoA controlling during flight, which reduces mean L/D and further increase the booster mass demand in order to outbalance the range loss. The lighter vehicle exhibits a much smoother trajectory with less aerodynamic losses.
0
1000
2000
3000
4000
5000
6000
7000
8000
300 350 400 450 500 550 600
Activ
e TP
S co
olin
g w
ater
mas
s [kg
]
Structural skin temperature [K]
Al2014
Al2195
Ti6Al4V-HT
IM7/977-2
IM7/PETI-5
Figure 13. Active TPS cooling water mass for different materials.
0
1000
2000
3000
4000
5000
6000
7000
8000
50000 60000 70000 80000 90000 100000
Cool
ing
wat
er m
ass [
kg]
Structure + passive TPS mass [kg] Figure 14. Active TPS cooling water mass as function of structure+TPS mass.
0102030405060708090
100
0 1000 2000 3000 4000 5000 6000
Altit
ude
[km
]
Flight time [s]
Al2014
Al2195
Ti6Al4V-HT
IM7/977-2
IM7/PETI-5
Figure 15. Altitude flight profiles for configurations with different structural materials.
0
0.25
0.5
0.75
1
1.25
1.5
1.75
2
2.25
0 1000 2000 3000 4000 5000
Stag
natio
n po
int h
eat f
lux
[MW
/m2]
Flight time [s]
Al2014
Al2195
Ti6Al4V-HT
IM7/977-2
IM7/PETI-5
Figure 16. Stagnation point heat flux profiles for configurations with different structural materials.
American Institute of Aeronautics and Astronautics
15
2. Variation of Maximum Passive TPS Operation Temperature
The previous analyses assumed a maximum operation temperature for the CMC passive TPS of 1850 K. However, advances in TPS material research indicate potential higher use temperatures. Thus, the effect of increasing the operation temperature on the active TPS cooling water mass and the booster mass is investigated. This is shown in Fig. 19. Generic maximum passive TPS operation temperatures of 1950 and 2050 K have been assumed. The results show that some decrease in cooling water mass is possible, but the maximum temperatures at nose and leading edge are too high to completely omit active cooling for the given configuration and trajectory.
3. Variation of Leading edge Angle
The stagnation temperatures at the leading edge depend on the sweep angle of the latter. Increasing the sweep angle can decrease leading edge temperatures and reduce active cooling requirements. Therefore, the baseline configuration with a leading edge sweep of 70° was compared with configurations of 68° and 72° sweep. The aerodynamic meshes are shown in Fig. 20.
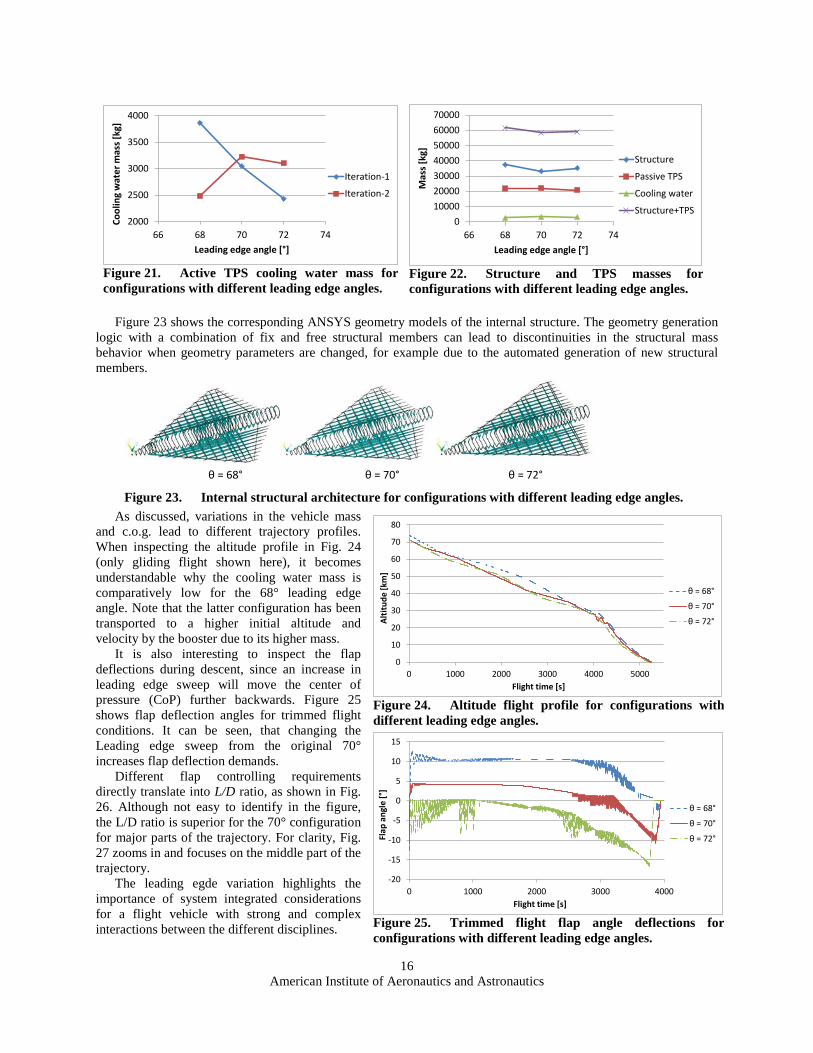
Figure 21 compares the resulting cooling water masses. Iteration-1 corresponds to a trajectory with the initial
STSM mass estimation. A decrease in cooling water mass is found with increasing leading edge angle, as it would be expected. In iteration-2 instead, where the computed structural and TPS masses and c.o.g. replace the original estimations, the behavior is different. No distinct decrease in cooling water mass is present with increasing leading edge angle. This is because the adapted wing leads to a change in airframe mass, as shown in Fig. 22. The different mass in turn leads to different flight trajectories which impacts the cooling requirements.
0
5
10
15
20
25
30
0 1000 2000 3000 4000 5000 6000
Angl
e of
att
ack
[°]
Flight time [s] Figure 17. Angle of attack profiles for configurations with different structural materials.
0
1
2
3
4
5
6
7
0 1000 2000 3000 4000 5000 6000
L/D
ratio
[ -]
Flight time [s]
Ti6Al4V-HT
IM7/PETI-5
Figure 18. L/D ratio profiles for configurations with different structural materials.
2000
2500
3000
3500
1800 1900 2000 2100
Activ
e TP
S co
olin
g w
ater
m
ass [
kg]
Passive TPS operation temperature [K] Figure 19. Active TPS cooling water mass for different passive TPS operation temperature limits.
θ = 68° θ = 70° θ = 72°
Figure 20. Aerodynamic meshes for different leading edge angles.
American Institute of Aeronautics and Astronautics
16
Figure 23 shows the corresponding ANSYS geometry models of the internal structure. The geometry generation
logic with a combination of fix and free structural members can lead to discontinuities in the structural mass behavior when geometry parameters are changed, for example due to the automated generation of new structural members.
As discussed, variations in the vehicle mass and c.o.g. lead to different trajectory profiles. When inspecting the altitude profile in Fig. 24 (only gliding flight shown here), it becomes understandable why the cooling water mass is comparatively low for the 68° leading edge angle. Note that the latter configuration has been transported to a higher initial altitude and velocity by the booster due to its higher mass.
It is also interesting to inspect the flap deflections during descent, since an increase in leading edge sweep will move the center of pressure (CoP) further backwards. Figure 25 shows flap deflection angles for trimmed flight conditions. It can be seen, that changing the Leading edge sweep from the original 70° increases flap deflection demands.
Different flap controlling requirements directly translate into L/D ratio, as shown in Fig. 26. Although not easy to identify in the figure, the L/D ratio is superior for the 70° configuration for major parts of the trajectory. For clarity, Fig. 27 zooms in and focuses on the middle part of the trajectory.
The leading egde variation highlights the importance of system integrated considerations for a flight vehicle with strong and complex interactions between the different disciplines.
010000200003000040000500006000070000
66 68 70 72 74
Mas
s [kg
]
Leading edge angle [°]
Structure
Passive TPS
Cooling water
Structure+TPS
Figure 22. Structure and TPS masses for configurations with different leading edge angles.
2000
2500
3000
3500
4000
66 68 70 72 74
Cool
ing
wat
er m
ass [
kg]
Leading edge angle [°]
Iteration-1
Iteration-2
Figure 21. Active TPS cooling water mass for configurations with different leading edge angles.
θ = 68° θ = 70° θ = 72°
Figure 23. Internal structural architecture for configurations with different leading edge angles.
0
10
20
30
40
50
60
70
80
0 1000 2000 3000 4000 5000
Altit
ude
[km
]
Flight time [s]
θ = 68°
θ = 70°
θ = 72°
Figure 24. Altitude flight profile for configurations with different leading edge angles.
-20
-15
-10
-5
0
5
10
15
0 1000 2000 3000 4000
Flap
ang
le [°
]
Flight time [s]
θ = 68°
θ = 70°
θ = 72°
Figure 25. Trimmed flight flap angle deflections for configurations with different leading edge angles.

American Institute of Aeronautics and Astronautics
17
4. Variation of Wing Span
A variation of wing span has been conducted in order to evaluate the impact on vehicle performance. The half span of the baseline configuration is 16.5 m. This has been varied now in 1 m steps from 14.5 m to 18.5 m. The configurations are shown in Fig. 28.
Figure 29 shows the resulting structure and TPS masses. The decrease in structural mass with lower wing spans is an obvious result. TPS masses decrease as well, both on the active as well as on the passive side.
The decrease in mass for lower aspect ratios translates into booster mass, which is shown in Fig. 30. However, a typical problem for very low aspect ratio wings is the take-off and landing performance, where only the latter is relevant for the study vehicle of this work. A simple first order estimation of required AoA at landing and main landing gear length has been done and included in Fig. 30. As described, the landing speed is assumed to be M = 0.3, which is already a very high value. Lower landing speeds will increase AoA at landing, and consequently also the required main gear lengths.
IV. Summary and Conclusion This paper presented a selection of preliminary results of a comprehensive system analysis for a two-stage rocket
propelled passenger transport glider. The integrated system analysis in some cases led to unexpected results that are not obvious when operating on a discipline level only. Further investigations will be performed in the near future in order to confirm the validity of identified trends and to work out in more detail the interdependencies between the individual disciplines and their impact on overall vehicle performance.
0
1
2
3
4
5
6
7
0 1000 2000 3000 4000 5000
Flap
ang
le [°
]
Flight time [s] Figure 26. Flown L/D ratio for configurations with different leading edge angles.
2
3
4
5
1000 1500 2000 2500 3000 3500 4000
Flap
ang
le [°
]
Flight time [s]
θ = 68°
θ = 70°
θ = 72°
Figure 27. Flown L/D ratio for configurations with different leading edge angles (middle part of trajectory).
0
10000
20000
30000
40000
50000
60000
14 16 18
Mas
s [kg
]
Half span [m]
Structure
Passive TPS
Cooling water
Structure+TPS
Figure 29. Structure and TPS mass results for different wing spans.
0
2
4
6
8
10
12
14
1100000
1150000
1200000
1250000
1300000
1350000
1400000
1450000
1500000
14 15 16 17 18 19
AoA
at la
ndin
g [°
],
Mai
n ge
ar le
ngth
[m]
Requ
ired
boos
ter m
ass [
kg]
Half span [m]
Booster mass AoA at landing Main gear length
Figure 30. Required booster mass, angle of attack at landing, and required main gear lengths as function of wing half span.
Figure 28. Structure and TPS mass results for different wing spans.

American Institute of Aeronautics and Astronautics
18
The performance in terms of required booster mass for a given flight range also depends on the applied flight control laws. It is to be checked whether other flight control laws will potentially change the trends. Also, the impact of modelling uncertainties on the global results needs to be assessed.
Further works will in particular aim on finding configurations and trajectories that are able to eliminate the need for a complex and very sensible active cooling system, while simultaneously maintaining sufficient range performance.
Acknowledgments This paper presents some early results of the soon to be submitted PhD thesis of the author. However, this work
would not have been possible with the support of many members of the DLR-SART group and other DLR colleagues. The author in particular wants to thank Mr. Tobias Schwanekamp, Ms. Nicole Garbers, and Mr. Martin Sippel for their very valuable support and for providing some of the analysis tools that have been used in this work.
References 1Sippel, M., Schwanekamp, T., Trivailo, O., Kopp, A., Bauer, C., Garbers, N., “SpaceLiner Technical Progress and Mission
Definition”, 20th AIAA International Space Planes and Hypersonic Systems and Technologies Conference, Glasgow, July 2015 (submitted for publication).
2Kopp, A., “Investigation of Structure, Thermal Protection System, and Passenger Stage Integration for the Hypersonic Transport System SpaceLiner”, AIAA-2014-2531, 19th AIAA International Space Planes and Hypersonic Systems and Technologies Conference, Atlanta, Georgia, June 2014.
3Jenkins., D. R., “Hypersonics Before the Shuttle – A Concise History of the X-15 Research Airplane”, Monographs in Aerospace History, Number 18, NASA SP-2000-4518, June 2000.
4Hallion, R. P., “The History of Hypersonics: or, „Back to the Future – Again and Again“”, AIAA-2005-0329, 43rd Aerospace Sciences Meeting and Exhibit, Reno, Nevada, January 2005.
5Moster, G. E., Martin, J. G., “Oscillatory Trajectories applied to NASA’s DF-7 Configuration”, AIAA-99-4931, 9th International Space Planes and Hypersonic Systems and Technologies Conference, Norfolk, Virginia, November 1999.
6Jenkins, D. R., “Space Shuttle – The History of the National Space Transportation System – The First 100 Missions”, Sixth Printing, Crecy Publishing Ltd, Manchester, UK, June 2010.
7Froning, H. D. Jr., McKinney, L. E., Chase, R. L., “Aerospace Plane Trajectory Optimization for Sub-Orbital Boost Glide Flight”, AIAA-96-4519-CP, 7th AIAA International Space Planes and Hypersonic Systems and Technologies Conference, Norfolk, Virginia, November 1996.
8Chuang, C. H., Morimoto, H., “Periodic Optimal Cruise for a Hypersonic Vehicle with Constraints”, Journal of Spacecraft and Rockets, Vol. 34, No. 2, March-April 1997.
9Carter, P. H., Pines, D. J., vonEggers Rudd, L., “Apprximate Performance of Periodic Hypersonic Cruise trajectories for Global Reach”, AIAA-98-1644, AIAA 8th International Space Planes and Hypersonics and Technologies Conference, Norfolk, Virginia, April 1998.
10Froning, H. D., “Single-Stage HTHL Spaceplane Requirements for Orbital and Sub-Orbital Hypersonic Space Tourism Flight”, AIAA-2006-8014, 14th AIAA/AHI Space Planes and Hypersonic Systems and Technologies Conference, 14th AIAA/AHI Space Planes and Hypersonic Systems and Technologies Conference, Canberra, Australia, November 2006.
11Kan Xie, Yu Liu, Yunfei Liao, “Study on Solid Rocket Based Wave-Rider Concept with Skipping Trajectory”, AIAA-2009-5508, 45th AIAA/ASME/SAE/ASEE Joint Propulsion Conference & Exhibit, Denver, Colorado, August 2009.
12Eggers, A. J. Jr., Allen, H. J., Neice, S. E.: A Comparative Analysis of the Performance of Long-Range Hypervelocity Vehicles, NACA Report 1382, 1958.
13Sippel, M., van Foreest, A., Bauer, C., Cremachi, F., “System Investigations of the SpaceLiner Concept in FAST20XX”, AIAA-2011-2294, 17th AIAA International Space Planes and Hypersonic Systems and Technologies Conference, San Francisco, California, April 2011.
14Garbers, N., “Overall Preliminary Design of the Thermal Protection System for a Long Range Hypersonic Rocket-Powered Passenger Vehicle (SpaceLiner)”, 7th European Workshop on Thermal Protection Systems and Hot Structures, Noordwihk, The Netherlands, April 2013.
15Schwanekamp, T., Meyer, F., Reimer, T., Petkov, I., Tröltzsch, A., Siggel, M., “System Studies on Active Thermal Protection of a Hypersonic Suborbital Passenger Transport Vehicle”, AIAA-2014-2372, 19th AIAA International Space Planes and Hypersonic Systems and Technologies Conference, Atlanta, Georgia, June 2014.
16Kopp, A., Garbers, N., “Structural and TPS Trade-Off Studies for the Hypersonic Transport System SpaceLiner”, 13th European Conference on Spacecraft Structures, Materials, and Environmental Testing, Braunschweig, Germany, April 2014.
17Kopp, A., Grabers, N., Jarlas, R., Rabia, H., “Parametric Structural Analysis for the SpaceLiner”, AIAA-2012-5944, 18th AIAA International Space Planes and Hypersonic Systems and Technologies Conference, Tours, France, September 2012.
18Pincha, P. J., “Algorithmic Mass-Factoring of Finite Element Model Analyses – An Update: Grid – Density Sensitivity”, 42nd Annual Conference of the Society of Allied Weight Engineers (SAWE), Anaheim, California, May 1983.
19Bruhn, E.F., “Analysis and Design of Flight Vehicle Structures”, Tri-State Offset Company, USA, 1973.

American Institute of Aeronautics and Astronautics
19
20N. N., “Military Handbook Metallic Materials and Elements for Aerospace Vehicle Structures”, MIL-HDBK-5, U. S. Department of Defense, March 1998.
21ALCAN Aerospace, “2195-T8R78 Al-Li Plates” datasheet, http://www.alcanaerospace.com/. 22Johnson, T. F., Gates, T. S., “High temperature polyimide materials in extreme temperature environments”, AIAA-2001-
1214, 42nd AIAA/ASME/ASCE/AHS/ASC Structures, Structural Dynamics, and Materials Conference and Exhibit, Seattle, Washington, April 2001.
23Dragone, T., “Structural Innovations in Design, Manufacturing, and Testing on the X-34 Reusable Launch Vehicle”, AIAA-2000-5309, AIAA Space 2000 Conference & Exposition, Long Beach, California, September 2000.
24Bednarcyk, B. A., Arnold, S. M., Collier, C. S., Yarrington, P. W., “Preliminary Structural Sizing and Alternative Material Trade Study for CEV Crew Module”, AIAA-2007-2175, 48th AIAA/ASME/ASCE/AHS/ASC Structures, Structural Dynamics, and Materials Conference, Honolulu, Hawaii, April 2007.