AERIAL MONITORING SURVEYS€¦ · Anti-Submarine Warfare Integration Training Initiative (SEASWITI)...
18
Jacksonville (JAX) Southeast Anti-Submarine Warfare Integration Training Initiative (SEASWITI) Marine Species Monitoring AERIAL MONITORING SURVEYS TRIP REPORT 3–5 December 2010 I-1
Transcript of AERIAL MONITORING SURVEYS€¦ · Anti-Submarine Warfare Integration Training Initiative (SEASWITI)...

Jacksonville (JAX) Southeast Anti-Submarine Warfare Integration Training Initiative (SEASWITI) Marine Species Monitoring
AERIAL MONITORING SURVEYS
TRIP REPORT
3–5 December 2010
I-1

ACRONYMS AND ABBREVIATIONS
ASW Anti-Submarine Warfare
ESA Endangered Species Act
HDR EOC HDR Environmental Operations and Construction, Inc
ICMP Integrated Comprehensive Monitoring Program
JAX Jacksonville Range Complex
km kilometer(s)
km2 square kilometers
m meter(s)
MFAS Mid-Frequency Active Sonar
MMPA Marine Mammal Protection Act
NM nautical mile(s)
OPAREA operating area
SEASWITI Southeast Anti-Submarine Warfare Integration Training Initiative
SPUE Sightings Per Unit Effort
SOCAL Southern California Range Complex
USWTR Undersea Warfare Training Range
I-2

Table of Contents
ACRONYMS AND ABBREVIATIONS ......................................................... INSIDE FRONT COVER
SECTION 1 INTRODUCTION ................................................................................................................. 1
SECTION 2 METHODS ............................................................................................................................ 1
SECTION 3 RESULTS .............................................................................................................................. 8
SECTION 4 ACKNOWLEDGEMENTS ................................................................................................ 11
SECTION 5 REFERENCES .................................................................................................................... 11
Appendix
A. Focal Follow Data ............................................................................................................................. 13
Figures
1. Predetermined Tracklines for the Survey Effort for JAX SEASWITI 2010. ...................................... 2
2. Location of All Cetacean and Sea Turtle Sightings Seen During Survey Period (December 3–5). .................................................................................................................................................... 4
3. Location of Cetacean and Sea Turtle Sightings Seen Pre-ASW (December 3). ................................. 5
4. Location of Cetacean and Sea Turtle Sightings Seen During ASW (December 4). ........................... 6
5. Location of Cetacean and Sea Turtle Sightings Seen Post-ASW (December 5). ............................... 7
Tables
1. Summary of JAX SEASWITI ASW Monitoring Effort ..................................................................... 3
2. Observers and Roles ............................................................................................................................ 3
3. Summary of Sightings ......................................................................................................................... 9
I-3

THIS PAGE INTENTIONALLY LEFT BLANK
I-4

Section 1 Introduction
On 4 December 2010, an Anti-Submarine Training Exercise (ASW) event occurred in the Jacksonville Range Complex (JAX) off the eastern coast of Florida within the U.S. Navy’s proposed boundaries of the Undersea Warfare Training Range (USWTR). A US Navy Fast Frigate (FFG) was involved with the ASW event that included a Mid-Frequency Active Sonar (MFAS) component operating over a one-day period. ASW events occur periodically throughout the year and allow the Navy to fulfill essential training requirements.
As part of the compliance requirements of the Marine Mammal Protection Act (MMPA) of 1972 and the Endangered Species Act (ESA) of 1973, the Navy developed the Integrated Comprehensive Monitoring Program (ICMP). The ICMP applies by regulation to those activities on Navy training ranges and operating areas (OPAREAs) for which the Navy sought and received incidental take authorizations. In order to support the Navy in meeting regulatory requirements for monitoring established under the Final Rules and to provide a mechanism to assist with coordination of program objectives under the ICMP, monitoring of marine mammals and sea turtles during this exercise included visual surveys from a fixed-wing aircraft.
The results of marine mammal monitoring reported here are part of a long-term monitoring effort under the U.S. Navy’s Marine Species Monitoring Program (Contract # N62470-10-D-3011) issued to HDR Environmental Operations and Construction, Inc. (HDR EOC).
Section 2 Methods
Study Area
The Navy’s Jacksonville OPAREA lies off the eastern coast of the Georgia/Florida border. Protected marine species monitoring conducted during the JAX Southeast Anti-Submarine Warfare Integration Training Initiative (SEASWITI) ASW training event was focused on the lower southeastern quadrant of the proposed boundaries of the USWTR box within the JAX OPAREA (see Figure 1). The area surveyed was approximately 105 to 133 kilometers (km) (56 to 72 nautical miles [NM]) offshore, covers an area approximately 928 square kilometers (km2) in size, and ranges in bottom depth from 40 to 500 meters (m).
Aerial-Based Monitoring
Aerial-based monitoring effort was performed over a 3-day period from 3 to 5 December 2010 (see Table 1). Survey methods were consistent with currently accepted Distance Sampling theory (Buckland et al. 2001) and followed a well-established protocol used for surveys in the Southern California (SOCAL) Range Complex (Smultea et al. 2009). A survey altitude of approximately 1,000 feet and 100 knots was attempted while on-effort, but might have varied slightly based on weather conditions in the area. Once a marine mammal sighting was made, a focal follow circling session was attempted at 1,000 feet or higher. A lower altitude of approximately 700 to 800 feet was established after focal follows for photography purposes to provide sharper images required for species identification.
I-5

Figu
re 1
. Pr
edet
erm
ined
Tra
cklin
es fo
r th
e Su
rvey
Eff
ort f
or J
AX
SEA
SWIT
I 201
0.
I-6

Table 1. Summary of JAX SEASWITI ASW Monitoring Effort
Date Descr iption Star t T ime
Stop T ime
T otal Sur vey M inutes*
T otal On-E ffor t
M inutes
T r ackline On-E ffor t
Distance (km)
December 3 Transect survey (Pre-Event) 1240 1628 228 189 616
December 4 (ASW)
Transect survey (During-Event) 0841 1148 187 168 560
December 4 (ASW)
Transect survey (During-Event) 1425 1636 131 116 392
December 5 Transect survey (Post-Event) 0853 1201 188 168 588
Total 734 (≈12 hrs) 641 (≈11 hrs) 2,156 km Note: * Total Survey Minutes reflect minutes occupied in the range/area of interest and include both on-effort (systematic) and
off-effort (random) totals minutes.
The observation platform was a Cessna T337H Turbo Skymaster aircraft operating out of Fernandina Beach Municipal Airport in Fernandina Beach, Florida. A total of four surveys were conducted following pre-determined transect lines covering the southeast quadrant of the proposed boundaries of the USWTR box (approximately 928 km2) and consisted of waypoints designed to extend beyond the entire range during each survey day during each 4-hour maximum survey flight time window (see Table 1, Figure 1).
Both aerial observers (see Table 2) were experienced with line-transect survey methodology, had experience in identification of Atlantic marine mammal and sea turtle species, were knowledgeable of marine mammal biology and behavior, and had previous experience conducting marine mammal and sea turtle observations from aircraft.
Table 2. Observers and Roles
Obser ver R ole(s)
Mari Smultea Chief Scientist/Observer Lenisa Blair Observer
Twenty-one parallel tracklines running from west to east, measuring 28 km, and spaced approximately 1.5 km apart were observed during “systematic” efforts throughout the surveys and provided a total survey coverage area of approximately 928 km2 (see Figure 1). Original lines were followed when possible, but exact transects followed were subject to modifications as a result of unfavorable weather conditions on the range (see Table 1, Figures 2 through 5).
I-7

Figu
re 2
. Lo
catio
n of
All
Cet
acea
n an
d Se
a Tu
rtle
Sig
htin
gs S
een
Dur
ing
Surv
ey P
erio
d (D
ecem
ber
3–5)
.
I-8

Figu
re 3
. Lo
catio
n of
Cet
acea
n an
d Se
a Tu
rtle
Sig
htin
gs S
een
Pre-
ASW
(Dec
embe
r 3)
.
I-9

Figu
re 4
. Lo
catio
n of
Cet
acea
n an
d Se
a Tu
rtle
Sig
htin
gs S
een
Dur
ing
ASW
(Dec
embe
r 4)
.
I-10

Figu
re 5
. Lo
catio
n of
Cet
acea
n an
d Se
a Tu
rtle
Sig
htin
gs S
een
Post
-ASW
(Dec
embe
r 5)
.
I-11

The general survey approach was as follows:
1. Follow pre-determined transect lines and waypoints using methods described by Smultea et al. (2009) until a sighting is made. Variables such as sea state, glare, and visibility are recorded.
2. Upon sighting a marine mammal/sea turtle group, record basic sighting information per established protocol (see Smultea et al. 2009). As outlined in the JAX Range Complex Monitoring Plan February 2009, information is to include (1) species identification and group size; (2) location and relative distance from the ASW site if available; (3) the behavior of marine mammals and sea turtles including standard environmental and oceanographic parameters; (4) date, time, and visual conditions associated with each observation; (5) direction of travel relative to true north; and (6) duration of the observation.
3. If the species appears suitable for a focal follow, the aircraft increases altitude to approximately 365 to 455 m and radial distance increases approximately 0.5 to 1.0 km and the aircraft circles the sighting to obtain detailed behavior information as long as possible and logical, for a minimum of 5 minutes, including a combination of both video and digital photographs if possible.
4. If the species is not selected for a focal follow, and species and group size are unknown, the aircraft circles the sighting to obtain digital photographs for species identification confirmation and estimate group size/composition.
Section 3 Results
Survey Effort
Observers visually surveyed approximately 2,156 km of systematic (on-effort) trackline and 2,267 km of combined systematic and random (lines covered in transit to the next trackline) tracklines during 3 days for approximately 11 hours of on-effort status (see Table 1). Beaufort sea state ranged from 2 to 6 and all sightings were made in Beaufort sea states between 2 and 6 (see Table 3). A detailed description of environmental, oceanographic, and sighting conditions was recorded and is available if requested. Sightings per unit effort (SPUE) was calculated as the total survey effort (hours/km/NM) divided by the total number of marine mammal sightings (n=1) or sea turtles (n=9). For this monitoring exercise, the SPUE for marine mammals was equal to 1 sighting per 12 hours, 2,267 km, and 1,224 NM and the SPUE for sea turtles was equal to 1 sighting per 1.3 hours, 252 km, and 136 NM.
Sightings
Due to extremely poor sighting conditions dominated by high Beaufort sea state that averaged ‘5’ on the Beaufort scale, marine mammal and turtle sightings in the area were lower than expected. One sighting of cetaceans and nine sightings of sea turtles were recorded during 12 hours of total survey flight time with the survey area (see Figure 2, Table 3). One sighting of unidentified cetaceans and five sightings of sea turtles were made on the pre-ASW survey day of December 3 (see Figure 3, Table 3). An additional group of bottlenose dolphins was located approximately 6 km from shore on December 3 during the transit back to the Fernandina Beach,
I-12

Table 3. Summary of Sightings
Sighting No. Date Species G r oup Size
B est/H igh/L ow C alves Star t T ime
Stop T ime
B eaufor t Sea State L atitude L ongitude V er t.
A ngle
Distance off
T r ack (km)
H eading B ottom Depth
(m) B ehavior al Summar y
1 12/3/10 CC 1 1 1 - 12:58 - 5 30.285 -80.125 45 0.4 Unk. 200 Loggerhead turtle at the surface. No disturbance detected.
2 12/3/10 CC 1 1 1 - 13:48 - 4 30.212 -80.104 47 0.4 Unk. 300 Loggerhead turtle at the surface. No disturbance detected.
3 12/3/10 CC 1 1 1 - 14:05 - 5 30.183 -80.302 37 0.4 90 40 Large loggerhead turtle at the surface. No disturbance detected.
4 12/3/10 CC 1 1 1 - 15:05 - 4 30.097 -80.106 47 0.4 Unk. 300 Medium loggerhead turtle at the surface. No disturbance detected.
5 12/3/10 Unid 10 15 5 1 15:28 15:41 4 30.052 -80.051 40 0.4 220 400
Sporadic looks due to poor visual conditions. Slow travel bearing 240. Min dispersal = 1, Max dispersal = 3. No reaction to plane circling at 1,200 feet.
6 12/3/10 DC 1 1 1 - 15:33 - 4 30.047 -80.050 45 0.4 140 400 Seen during sighting 5 dolphins circling. No reaction to plane.
7 12/3/10 TT 12 14 12 1 16:55 17:03 2 30.553 -81.351 55 0.2 310 10
Sporadic looks due to low light conditions. 12 animals in two sub-groups spaced 20 m apart. Travel bearing 310. Min dispersal = 1, Max dispersal = 1. Surface active travel with a few individuals occasionally leaping/breaching. Began surface active travel heading 45. No reaction to plane circling 0.5 km away.
8 12/4/10 CC 1 1 1 - 08:57 - 5 30.285 -80.252 65 0.1 310 50 Loggerhead turtle at the surface. Travel bearing 310. No disturbance detected.
9 12/4/10 CC 1 1 1 - 14:59 - 5 30.556 -81.200 57 0.2 Unk. 10 Loggerhead turtle resting at the surface. No disturbance detected.
I-13
Sighting No. Date Species G r oup Size
B est/H igh/L ow C alves Star t T ime
Stop T ime
B eaufor t Sea State L atitude L ongitude V er t.
A ngle
Distance off
T r ack (km)
H eading B ottom Depth
(m) B ehavior al Summar y
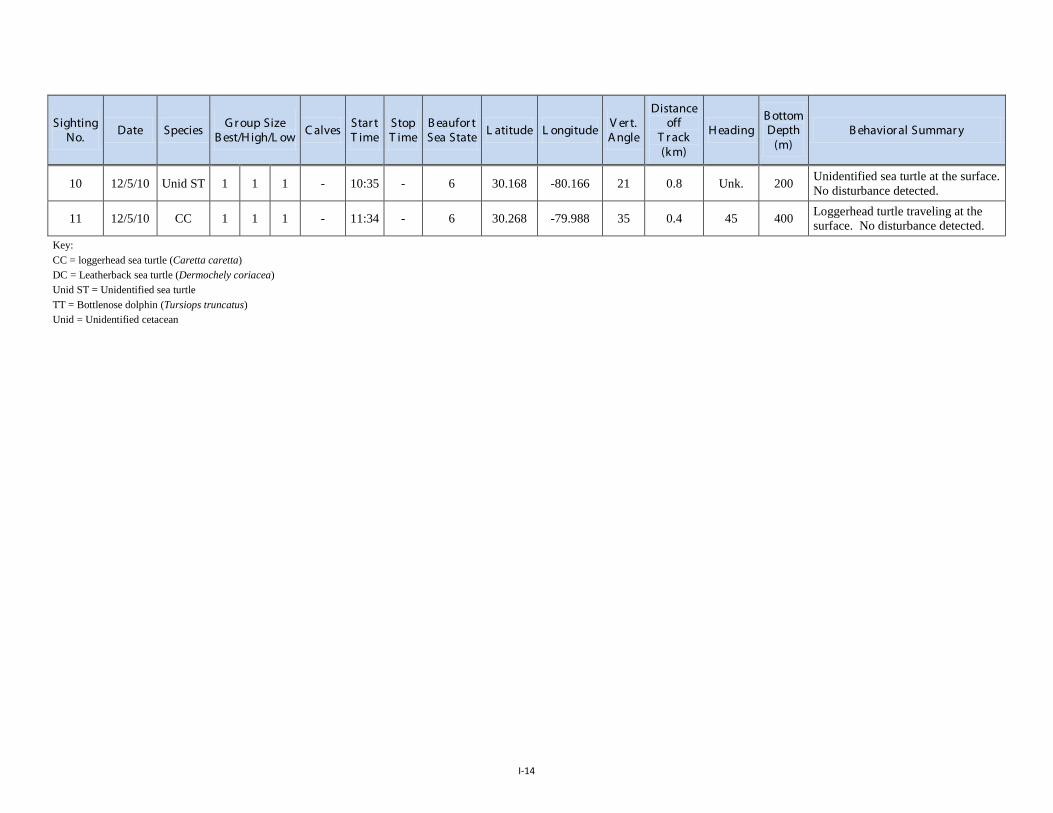
10 12/5/10 Unid ST 1 1 1 - 10:35 - 6 30.168 -80.166 21 0.8 Unk. 200 Unidentified sea turtle at the surface. No disturbance detected.
11 12/5/10 CC 1 1 1 - 11:34 - 6 30.268 -79.988 35 0.4 45 400 Loggerhead turtle traveling at the surface. No disturbance detected.
Key: CC = loggerhead sea turtle (Caretta caretta) DC = Leatherback sea turtle (Dermochely coriacea) Unid ST = Unidentified sea turtle TT = Bottlenose dolphin (Tursiops truncatus) Unid = Unidentified cetacean
I-14
but was not included in the SPUE calculations due to its distance (108 km) from the ASW survey area. No sightings of marine mammals and two sightings of sea turtles were made on the ASW event day of December 4 (see Figure 4, Table 3). One of the two sightings of sea turtles seen on the ASW event day was located near shore and outside of the survey area. No sightings of marine mammals and two sightings of sea turtles were made on the post-ASW survey day of December 5 (see Figure 5, Table 3). All sightings except sighting #7 (bottlenose dolphins), sighting #9 (loggerhead sea turtle), and sighting #6 (leatherback sea turtle) were located on the track lines during on-effort status. Due to difficulties associated with relocating animals in a high Beaufort sea state and heavy glare, digital photographs to determine or confirm species identification were only collected during the off-effort encounter with bottlenose dolphins located away from the range and close to shore. Sightings included one group of unidentified cetaceans in water depths between 400 and 500 m, seven sightings of loggerhead sea turtles (Caretta caretta) in water depths between 10 and 500 m, one leatherback sea turtle in water depths between 400 and 500 m, and one unidentified sea turtle in water depths between 200 and 300 m (see Figure 2, Table 3).
Behavior
No visible evidence of distress or unusual behavior was observed for the pre-ASW surveys, during ASW surveys, and post-ASW surveys (see Table 3). The team was able to attempt two brief focal follows, both on 3 December. The first focal follow was a period of 4 minutes spent with a group of 10 unidentified dolphins, while the other follow lasted 4 minutes with 12 bottlenose dolphins located during off-effort transit near the coast and a minimum distance of 108 km from the ASW area of operation. Detailed behavioral observations made during the focal follows are presented in Appendix A. Photographs of suitable quality for photo-identification purposes were collected during the bottlenose dolphin focal follow only due to poor sighting conditions.
Section 4 Acknowledgements We would like to thank Orion Aviation’s Director Ed Coffman and pilots Ron Schreck and Bob Sticle. These data were obtained under National Marine Fisheries Service permit no. 14451 issued to Joseph R. Mobley, Jr.
Section 5 References Buckland et al. 2001
Buckland, S.T., D.R. Anderson, K.P. Burnham, J.L. Laake, D.L. Borchers, and L. Thomas. 2001. Introduction to distance sampling: Estimating abundance of biological populations. Oxford University Press.
Smultea et al. 2009
Smultea, M.A., J.R. Mobley, Jr., and K. Lomac-MacNair. 2009. Aerial Survey Monitoring for Marine Mammals and Sea Turtles in Conjunction with US Navy Major Training Events off San Diego, California, 15-21 October and 15-18 November 2008, Final Report. Prepared by Marine Mammal Research Consultants, Honolulu, HI, and Smultea Environmental Sciences, LLC., Issaquah, WA, under Contract No. N62742-08-P-1936 and N62742-08-P-1938 for Naval Facilities Engineering Command Pacific, EV2 Environmental Planning, Pearl Harbor, HI.
I-15

THIS PAGE INTENTIONALLY LEFT BLANK
I-16

APPENDIX A Focal Follow Data
Table A-1 shows the focal follow behavioral data from the JAX SEASWITI ASW 2010 monitoring efforts. The two focal follow events were conducted on 3 December 2010; one was from a group of unidentified dolphins within the survey area and the other was from a group of bottlenose dolphins (Tursiops truncatus) located near the shore and well outside of the specified survey area.
I-17

Table A-1. Focal Follow Behavior Data
R ecor d Number T ime Date L atitude L ongitude R ecor ded B ehavior
Sighting Number 5 Species: Unidentified dolphins
1 15:28 12/3/10 30.097 -80.106 Only seen for brief sporadic looks due to poor visual conditions. Slow travel heading 240. Min Dispersal = 1, Max Dispersal = 3.
2 15:29 12/3/10 30.053 -80.047 Slow travel heading 240. Min Dispersal = 1, Max Dispersal = 3.
3 15:30 12/3/10 30.049 -80.051 Slow travel heading 240. Min Dispersal = 1, Max Dispersal = 3.
4 15:31 12/3/10 30.052 -80.048 Slow travel heading 240. Min Dispersal = 1, Max Dispersal = 3.
5 15:32 12/3/10 30.051 -80.047
Slow travel heading 240. Min Dispersal = 1, Max Dispersal = 3. Smaller than bottlenose, appear to have saddle shading of light gray and darker gray, no white spots seen on end of snout, but visual conditions are poor. Likely Atlantic spotted dolphins.
6 15:32 12/3/10 30.049 -80.044 Lost in choppy seas Sighting Number 7
Species: Tursiops truncatus
1 16:56 12/3/10 30.578 -81.376 Travel heading 310. Min Dispersal = 1, Max Dispersal = 1.
2 16:57 12/3/10 30.571 -81.386 Travel heading 310. Min Dispersal = 1, Max Dispersal = 1. 12 animals in 2 subgroups spaced 20 meters apart.
3 16:58 12/3/10 30.562 -81.375 Surface active travel heading 310. Min Dispersal = 1, Max Dispersal = 1. A few individuals occasionally leaping/breaching.
4 16:59 12/3/10 30.564 -81.376
Surface active travel, changed heading 45. Min Dispersal = 1, Max Dispersal = 1. Does not appear to be due to aircraft which is > 0.5 km away.
5 17:00 12/3/10 30.571 -81.374 Travel heading 45. Min Dispersal = 1, Max Dispersal = 1.
I-18