AERATION AND GAS TRANSFER - IRC · 2.U2 The Efficiency Coefficient 38 2.U3 The Oxygenation Capacity...
188
2 5 1 7 4 A E DELFT UNIVERSITY OF TECHNOLOGY Department of civil engineering Division of sanitary engineering AERATION AND GAS TRANSFER I' ^Div^lng. H.J. LIBRARY International Reference Centra for Community Water Supply herdruk maart 1976
Transcript of AERATION AND GAS TRANSFER - IRC · 2.U2 The Efficiency Coefficient 38 2.U3 The Oxygenation Capacity...

2 5 1
7 4 A E
DELFT UNIVERSITY OF TECHNOLOGY
Department of civil engineering
Division of sanitary engineering
AERATION AND GAS TRANSFER
I'
^Div^lng. H.J.
LIBRARY International Reference Centra for Community Water Supply
herdruk maart 1976

2 5-1
DELFT UNIVERSITY OF TECHNOLOGY
Department of civil engineering
Division of sanitary engineering
£ \ l r*
AERATION AND GAS TRANSFER
n . 'v
__-,._•. I • - ' . ! " ; . ;
wo-- oupf-iy
Prof. Dr.-lng.H.J.P6pel
Ltgave 197^
2 e herdruk j a n . 1979 753070 / * • , - -

L.S .
Bij de samens te l l ing van elk diktaat word t e r u i t e r a a r d n a a r ge s t r ee fd om fouten te voorkomen en de inhoud zo o v e r -z ichte l i jk mogel i jk aan te bieden. Nie t t egens taande dat kunnen toch onduideli jkheden voorkomen en kunnen fouten zijn ingeslopen. Indien U dan ook bij de bes tuder ing van dit d iktaat : - onjuis theden ontdekt - op onduideli jkheden stui t - of gedee l ten ontmoet , die naa r Uw mening n a d e r e u i twerking
behoeven , ve rzoeken de s a m e n s t e l l e r s U d r i n g e n d h e n d a a r v a n medede l ing te doen.
Bij de volgende drukken kunnen dan op- en aanmerk ingen worden v e r w e r k t ten ge r i eve van toekomst ige g e b r u i k e r s . Zonodig kan ook nog in de lopende c u r s u s voor verduidel i jk ing w o r d e n gezorgd .
^

I
Table_of_Contents Page
List of Abbreviations and Symbols TV
References XI
Text and Figures 1
Tables 162'
1. Introduction < 1
1.1 Definition and Terms 1
1.2 Elements of Aeration and Gas Transfer Operations . 3
1.3 Aeration and Gas Transfer within Processes of
Water Purification and Sewage Treatment . . . . . . 8
2. Theoretical Aspects of Aeration and Gas Transfer . 9
2.1 Solubility of Gases 9
2.11 Influence of the Gas Concentration
on Solubility 9
2.12 Influence of Temperature on Solubility 1^
2.13 Influence of Impurities on Solubility 16
2.2 Diffusion 17
2.3 Gas Transfer Coefficients 22
2.31 The Concept of Gas Transfer Coefficients 22
2.32 Theories on the Mechnism of Gas Transfer 2U
2.321 Film Theory 2k
2.322 Penetration Theory >. 25
2.323 Surface Renewal Theory 28
2.32U Film-Surface-Renewal Theory 28
2.325 Comparison of the Discussed Theories 29
2.33 Some Applications of the Penetration Theory . . . . 31
2.3U Factors Affecting the Gas Transfer Coefficient . . 32
2.1+ Practical Approach to Gas Transfer Rate
Formulations 36
2.1+1 The Overall Gas Transfer Coefficient 36

II
Page
2.U2 The Efficiency Coefficient 38
2.U3 The Oxygenation Capacity kl
2.5 Change of the Gas Phase by Gas Transfer
Operations kf
3. Practical Aspects of Aeration and
Gas Transfer 61
3.1 Gravity Aerators 61
3.11 Weir Aeration and Cascades 61
3.111 Single Free Fall in Weir Aeration . 62
3.112 Step Weirs or Conventional Cascades 6U
3.12 Stacks of Perforated Pans or Tower Cascades . . . 68
3.121 Tower Cascades for Removal of Carton Dioxide . . . 70
3.122 Packed Towers for Ammonia Stripping 75
3.2 Spray Aeration 80
3.21 The Dresden Nozzle 83
3.22 The Amsterdam Nozzle 86
3.3 Bubble Aeration or Air Diffusion 89
3.31 General Considerations 89
3-32 Fine Bubble Aeration 97
3.321 Types of Diffusers and Their Arrangement 97
3.322 Factors Influencing the Rate and Efficiency
of Oxygen Transfer 103
3.323 Practical Aspects 106
3.33 Medium Bubble Aeration (High Pressure) 109
3.331 Types of Diffusers and Their Arrangement 109
3.332 Factors Influencing the Rate and Efficiency
of Oxygen Transfer > 110
3.333 Practical Aspects 112
3.33^ Medium Bubbles Aeration (Low Pressure) 112
3.33U1 The Inka Aeration System 112
3.33^2 The Inka Intensive Aeration 115
3.3^ Coarse Bubble Aeration 117
3.3*+1 Types Diffusers and Their Arrangement 117
I l l
Page
3.31+2 Factors Influencing the Rate and Efficiency
of Oxygen Transfer 118
3.3*0 Practical Aspects 119
3.35 Air Diffusion by Means of Entrained Air 119
3.351 The Venturi Aerator 120
3.352 The Deep Well Aerator (U-Tube Aerator) 121
3.1* Mechanical or Surface Aeration 123
3.1+1 General Considerations 123
3.1+2 Rotor Aerators . 127
3.1+21 Types of Rotor Aerators and Their Arrangement . . 127
3.1*22 Factors Influencing the Rate and Efficiency
of Oxygen Transfer 132
3.1+23 Practical Aspects 137
3.1+3 Cone Aeration 138
3.1+31 Types of Cones and Their Arrangement 138
3.1+311 Plate Aerators 1l+0
3.1+312 Updraft Aerators 11+1
3.1*313 Downdraft Aerators 11+8
3.1+32 Factors Influencing the Rate and Efficiency
of Oxygen Transfer 11+9
3.H33 Practical Aspects 156
3.5 Combined Aerator Types 159

IV
Abbreviations and Symbols
The dimensions of the following abbreviations and symbols are chosen
in accordance with the International System and are hence based on
the following basic dimensions:
length (m), mass (kg), time (s), temperature (K, °C is also being
used here).
Deducted units are
force (Newton) : 1 N = 0,101972 kgf
1 kgf = 9,80665 N
work, energy (Joule)
power (Watt)
pressure (Pascal)
(bar)
1 J = 1 N.m
1 W = 1 J/s
1 Pa = 1 N/m2
1 bar = 105 Pa
The various units used in the literature for pressure require some
further explanation, whereas the conversion of other applied units is
straight forward.
Basically, pressure has been defined in terms of "atmosphere" by the
following ways: o
a) 1 technical atmosphere = 1 kgf/cm
b) 1 physical atmosphere = 760 mm Hg (Torr)
c) 1 absolute atmosphere = 1 bar 3 From the above definitions and the density of mercury of 13595,1 kg/m
the following conversion table is obtained.
Convenient units for the pressure of gases within the International
System would be
- mbar, the normal atmospheric pressure being 1013 mbar
- kPa , the normal atmospheric pressure being 101,3 kPa
In the following "kPa" is used as the standard unit for pressure.
Roughly is 1 kPa = 30/U mm Hg
1 mm Hg = U/30 kPa
Further it is seen from the conversion table that there is not too
great a difference between the "atmospheres", the smallest (technical
atmosphere) being but 3,2 % less than the greatest (physical atmosphe
re) .

co - P • H
a 3
<u
ssu
r
0) *H
P.
U o
t H
cu H £> a)
- P
C O
rsi
CD
!> C O o
M w g
OJ CM
.=ba
r
a • p
ai • •
CO £> cd
, a - p aJ
• co >> x: ft
• a • p
ctf •
c £1 O CU
• p
0 \ LA LA
LA oo t—
L A «s
NO VO
o CO ON
LA V D V D O CO CT\
* o
1 —
_3-co t— NO ON
•* o
1 —
n.
atm
. =
x; o 0)
• p
o MD t—
LA CO 0 0 r—
o
LA OJ 0 0 T —
o #N
*-
1 —
0 0 0J 0 0 0 0 o
A
II
a •P nJ
CO
.G ft
OJ NO
o o LA t—
o o o o o
1 —
0 0 OJ O N
MD CO O N
•»
o
OJ
c— ON t —
o **
^
atm
. =
1 b
ar
=
co £> 0)
00 1 o
OJ
\o o o LA
«* c—
1 —
i
LA 1
o 1 —
LA 1
o
• 0 0 OJ ON
NO CO O N
#» O
LA 1 o r—
• OJ t— O N
*— O
#* "
II
ctj Pn
""
OJ OJ 0 0
#* 0 0 0 0
00 1 o
• OJ OJ oo 0 0 0 0
«> "-
oo 1
o T —
• o\ t— LA
*— 0 0 f t
*-
oo 1 o T -
• r -
LA ON L A 0 0
*
II
bO K
g

VI
Qreek_Svmbols
factor to account for the influence of surface active agents on the rate of gas transfer
W/m gross power input per unit volume
-, % efficiency-
activity coefficient
Pa.s absolute viscosity
N/m surface tension
s theoretical detention time (V/Q)
temperature coefficient
Dimension(s) Description
2 3 m /m specific interfacial area 2 m area, surface 2
m /s interfacial area produced per unit time
g/m gas concentration in water
g/m gas concentration in the effluent of an aerator
g/m concentration of a gas in the gaseous phase
3 g/m gas concentration in the gaseous phase at the interface
,3 . . . v g/m initial concentration of a gas in
the gas phase 3 g/m gas concentration in a liquid
3 g/m gas concentration in the liquid
phase at the interface
g/m saturation concentration of a gas in water
o g/m like c , but under conditions de-
g
fined under t

VII
3 g/m initial saturation concentration of a gas in water
3 kg/m concentration of activated sludge
suspended solids 3 g/m gas concentration in a liquid in
dependence of x and t as a consequence of molecular diffusion
2 m /s coefficient of molecular diffusion
in a liquid 2
m /s coefficient of eddy diffusion
2 m /s coefficient of molecular diffusion
m /m .s
in a gas
tots D+D,
p m /s total coefficient of diffusion:
2 E
m /s coefficient of diffusion of a gas in water at a temperature of T
2 m /s coefficient of molecular diffusion
of a gas in water at 10°C
m depth (of tank, of packing, etc.)
m diameter of gas bubbles in a liquid
m thickness of gas film
m depth of immersion (or submergence) of an aeration device below the water level
m thickness of liquid film
mm diameter of the opening of a spray nozzle
•2
rate of air flow Qg (m°/s) per unit volume of water V (m^)
m height, head
m total head
kmole/m ionic strength

VIII
efficiency coefficient
Bunsen absorption coefficient
constant, relating bubble diameter to rate of gas flow
distribution coefficient
partial coefficient of gas transfer in the gaseous phase
Henry's constant
partial coefficient of gas transfer in the liquid phase
(total) coefficient of gas transfer
overall coefficient of gas transfer
Prandtl mixing length at turbulent flow
average rate of mass (gas) transfer
mass
molecular weight
gross power
percent oxygen absorption (amount of oxygen absorbed divided by amount of oxygen contained in the injected air)
oxygenation capacity (with reference to t'he liquid volume)
oxygenation capacity (with reference to the aerator)
oxygen demand
oxygenation efficiency
oxygen utilization (g 0 absorbed per m? air applied)

(total) pressure
partial pressure
standard pressure (101 325 Pa)
water vapor pressure
partial pressure of a gas in water vapor saturated air
liquid flow rate
gas flow rate reduced to standard conditions of pressure (101,3 kPa) and temperature (0°C)
removal efficiency in desorption of gases (R= (c - c )/c
o e o
constant of renewal of the gas-liquid interface
ratio of gas flow rate over liquid flow rate (Q /Q)
g
frequency of renewal of the licfuid interface
temperature
time
(constant) time of exposure of a fluid element to the gas phase
standard temperature (0 C, 273,16 K)
turbulent mixing velocity
volume
rising velocity of gas bubbles in a liquid
distance from gas-liquid interface
depth of penetration

X
t these terms are defined under the following conditions:
water vapor saturated air
water temperature 10 C
oxygen concentration of the water c = 0 g 0 /m
total pressure 101,3 kPa

References
A. Cited References
1. Black, W. M., Phelps, E. B.: Report to the Board of Estimate and
Apportionment, New York, 1911
2. Lewis, W. K. & Whitman, W. G.: Principles of Gas Absorption,
Ind. Eng. Chem. (192U), p. 1215
3. Higbie, R.: The Rate of Absorption of a pure Gas into a still
Liquid during short Periods of Exposure, American Institute of
Chemical Engineers May 13-15 (1935), P< 365
k. Danckwerts, P. V.: Significance of Liquid-Film Coefficients in
Gas Absorption, Industrial and Engineering Chemistry Vol. U3, No.
(1951), p. 1U60
5. Dobbins, W. E.: Mechanism of Gas Absorption by Turbulent Liquids,
Proceeding of 1. International Conference on Water Pollution
Research, paper 2/20 Pergamon Press Ltd., Oxford (1962)
6. Eckenfelder, Jr. W. W., Asce, M.: Absorption of Oxygen from Air .
Bubbles in Water, Journal of the Sanitary Engineering Division
July (1959), P- 89
7. Popel, H. J.: Ein einfaches Verfahren zur Auswertung von 0C-
Versuchen, GWF 109 (1968), p. 307
8. Wilderer, P., Hartmann, L.: Der Einfluss der Temperatur auf die
Losungsgeschwindigkeit von Sauerstoff in Wasser, GWF 110 (1969)»
•p. 707
9. Barrett, M. J., Gameson, A. L. H., and Ogden, C. G.: Aeration
studies at four weir systems, Water and Water Engng. 6h (i960),
p. ^07
10. Kroon, G. T. M. van der, Schram, A. H.: Weir Aeration - part I,
H20 (1969), P-' 528
11. Bewtra, J. K., Nicholas, W. R.: Oxygenation from Diffused Air in
Aeration Tanks, JWPCF 36 (196U), p. 1195

XII
12. Suschka, J.: Oxygenation in Aeration Tanks, JWPCF k3 (1971),
p. 81
13. Horvath, I.: Die Modelldarstellung der Sauerstoffaufnahme in
Beliif tungsbecken, GWF 107 (1966), p. 9U6
^h. Downing, A. L. , Boon, A. G. , Bayley, R. W.: Aeration and biological
oxidation in activated sludge process, Journ. and Proc. Inst. Sew.
Purif. (1962)
15. Kroon, G. T. M. van der, Corstjens, G. H.: Zuurstofoverdracht aan
water en kunstmatige actief slib-watermengsel, Water 50 (1966),
p. 266
B. Selected Literature
1. Books, Proceedings etc.
16. Baars, J. K., Muskat, J.: Zuurstoftoevoer aan water met behulp van
roterende lichamen, Instituut voor Gezondheidstechniek TNO, rapport
no. 28,1959
17. Culp, R. L., Culp, G. L.: Advanced Wastewater Treatment, Van
Nostrand Reinhold Company, New York-Cincinnati-Toronto-London-Mel
bourne 1971
18. Eckenfelder Jr., W. W., O'Connor, D. J.: Biological Waste Treatment,
Pergamon Press, Oxford 1961
19. Fair, G. M. , Geyer, J. C , Okun, D. A.: Water Purification and
Wastewater Treatment and Disposal, Vol. 2, John Wiley & Sons, Inc.,
New York-London-Sydney 1968, Chapter 23 and 2k
20. Knop, E., Bischofsberger, W., Stalmann, V.: Versuche mit verschiede-
nen Beluftungssystemen im technischen Massstab, Vulkan - Verlag
Dr. W. Classen, Essen, Vol. I I96U/65
21. Knop, E., Bischofsberger, W., Stalmann, V.: Versuche mit ver-
schiedenen Beluftungssystemen im technischen Massstab, Vulkan -
Verlag Dr. W. Classen, Essen, Vol. 2 I96U/65
22. Pallasch, 0., Triebel, W. (editors): Lehr- und Handbuch der Ab-
wassertechnik Vol 2., Verlag von Wilhelm Ernst & Sohn, Berlin -
Munchen 1969

XIII
23. Rich, L. G.: Unit Operations of Sanitary Engineering, John Wiley
& Sons, Inc., New York - London 1961
2k. Sontheimer, H.: Vortragsreihe mit Erfahrungsaustausch iiber speziel-
le Fragen der Wassertechnologie Vol. I: Entsauerung, Enteisenung
und Entmanganung, Veroffentlichungen der Ahteilung und des Lehrstuhls
fur Wasserchemie des Instituts fur Gastechnik, Feuerungstechnik und
Wasserchemie der Technischen Hochschule Karlsruhe, Karlsruhe 1966
25. Derde vakantiecursus in behandeling van afvalwater: De technologie
van het beluchtingsproces, Technische Hogeschool, Afdeling der
Weg- en Waterbouwkunde, Delft 1968
26. Zesde vakantiecursus in behandeling van afvalwater: De Oxydatie-
sloot, Technische Hogeschool, Afdeling der Weg- en Waterbouwkunde,
Delft 1971
27. Twintigste vakantiecursus in drinkwatervoorziening: Physische
technologie van de waterzuivering, Technische Hogeschool, Afdeling
der Weg- en Waterbouwkunde, Delft 1968
2. Articles
28. Albrecht, D.: Schatzung der Sauerstoffzufuhr durch Wehre und kas—
kaden, Die Wasserwirtschaft 11 (1969), P- 321
29. Bewtra, J. K., Nicholas, W. R.: Oxygenation from diffused air in
aeration tanks, JWPCF 36 (196U), p. 1195
30. Boelens, A. H. M. , Sybrandi, J. C : Ontzuring door middel van
cascades, Water 50 (1966), p. 21h
31. Bruijn, J., Tuinzaad, H.: The Relationship between Depth of
U-Tubes and the Aeration Process, JAWWA 50 (1958), p. 879
32. Carriere, J. E.: Voorlopige uitkomsten van de door het KIWA ver-
richte sproeiproeven, N.V. Keuringsinstituut voor Waterleidingar-
tikelen KIWA, Mededeling no. 9, Den Haag 1950
33. Carver, C. E., Asce, F.: Oxygen Transfer from falling water droplets,
Journal of the Sanitary Engineering Division (1969)9 P- 239
3 1. Eckenfelder Jr., W. W. : Engineering Aspect of Surface Aeration
Design, Proceedings of the 22 nd. Industrial Waste Conf. (1967),

p. 279
35. Eckenfelder Jr., W. W., Ford, D. L.: New concepts in oxygen trans
fer and aeration, in: Gloyna, E. F., Eckenfelder, W. W.: Advances
in.Water Quality Improvement, Vol. I, University of Texas Press,
Austin - London 1968, p. 215
36. Emde, W. von der: Aeration developments in Europe, in:Gloyna, E. F.,
Eckenfelder, W. W.: Advances in Water Quality Improvement, Vol. I,
University of Texas Press, Austin - London 1968, p. 237
37. Emde, W. von der: Beluftungssysteme und Beckenformen, in: Munchen
Beitrage zur Abwasser-, Fischerei- und Flussbiologie Band 5, 2. Auf-
lage, (1968), p. 223
38. Franz, B.: Satz von Saugkreiselbeliiftern bei der biologischen
Reinigung Gaswassern, WWT 18 (1968), p. 165
39- Haberer, K., Baier, R.: Zur Trinkwasserentsauerung durch Intensiv-
beliiftung im Kreuzstrom, GWF 111 (1970), p. 150
kO. Haney, P. D.: Theoretical Principles of Aeration, JAWWA (195*0,
p. 353
U1. Heeb, A., Rau, E.: Die neue Schlammbelebungsanlgae im Hauptklarwerk
Stuttgart - Miihlhausen, GWF 101 (i960), p. 1*37
k2. Heeb, A., Rau, E.: Betriebsergebnisse mit der neuen Schlammbelebungs-
anlage im Hauptklarwerk Stuttgart - Miihlhausen, GWF 101 (i960),
p. 758
1+3. Horvath, I.: Die Modelldarstellung der Sauerstoffaufnahme in Beluf-
tungsbecken, GWF 107 (1966), p. 9 6
hk. Kaelin, J. R., Tofaute, K. : Leistungsfahigkeit von BSK-Turbinen in
grossen Belebungsbecken, Wasser Luft und Betrieb 13 (1969), p. 13
U5. Kalbskopf, K. H.: Stromungsverhaltnisse und Sauerstoffeintragung
bei Einsatz von Oberflachenbeluftern, in: Husman, W. (Editor):
Vom Wasser XXXIII (1966)
h6. Kalinske, A. A.: Turbulence Diffusivity in activated sludge aera
tion basins, Water Poll. Res. Conf. San Francisco, July (1970),
p. H-7/1

XV
hT. Kittner, H.: Die mechanische Entsauerung und Beluftung in der Wasser-
aufbereitung, WWT 13 (1963), p. 12U
U8. Kittner, H.: Die mechanische Entsauerung und Beluftung in der Wasser-
aufbereitung, WWT 13 (1963), p. 160
H9> Kroon, T. M. van der, Schram, A. H.: Weir Aeration - Part II: Step
weirs or cascades, H O 2 (1969)> p. 538
50. Leary, R. D., Ernest, L. A., Katz, W. J.: Full scale oxygen transfer
studies of seven diffuser systems, JWPCF (1969), p. 59
51. Louwe Kooymans, L. H.: Aeration and deferrisation, IWSA Congress,
London (1955), p. 283
52. Pasveer, A.: Research on activated sludge, VI Oxygenation of Water
with Air Bubbles, Sewage and Industrial Wastes, Vol. 27 (1955)»
p. 1130
53. Pasveer, A.: Untersuchungen uber das Belebtschlammverfahren fur die
Reinigung von Abwasser, G. I. 76 (1955), P- 332
5I+. Rub, F. : Oberflachenbeliifter fur die biologische Abwasseraufberei-
tung, Wasser, Luft und Betrieb 15 (1971 ), p. 397
55- Selm, J. van: Beluchting bij stuwen, Water 51 (1967)> p. 355
56. Suschka, J.: Oxygenation in aeration tanks, JWPCF (1971), P- 81
57. Sybrandi, J. C : Ontzuring door middel van cascades, H O 3 (1970),
p. 32
58. Westberg, N. K. G.: Intensive Aeration of Water, JAWWA U1 (19U9),
p. U17
59. Wingrich, H.: Die Verfahren der offenen Beluftung von Rohwasser und
ihre Wirtschaftlichkeit, WWT 18 (1968), p. 267
60. Technical Practice Committee - Subcommittee on Aeration in Wastewater
Treatment, Aeration in Wastewater Treatment - manual of practice
no. 5,
part 1: JWPCF 1*1 (1969), P- 1863 - 1878
part 2: JWPCF U1 (1969), p. 2026 - 2061
part 3: JWPCF 1*2 (1970), p. 51 - 76


1
Aeratign_and_Gjisjrransfer
1. Introduction
1.1 Definition and terms
Gas transfer is a physical phenomenon, by which gas molecules are
exchanged between a liquid and a gas at a gas-liquid interface. This
exchange results in an increase of the concentration of the gas(es)
in the liquid phase as long as this phase is not saturated with the
gas under the given conditions of e.g. pressure, temperature (absorp-
tion of gas) and in a decrease when the liquid phase is oversatura-
ted (desorption, precipitation or stripping of gas). In most of the
gas transfer operations in sanitary engineering the gaseous phase is
represented by "air",the liquid in all cases by water (and its con
stituents). This gas transfer is brought about by bringing air and
water into intimate contact, i.e. by aeration. The goals of aeration
and gas transfer cover a wide range and so do the applied operations.
Important natural phenomena of gas transfer are the reaeration of
surface water, i.e. mainly the transfer of oxygen into surface water,
the concentration of which is generally below the saturation value
due to the oxygen consumption through bacterial degradation of or
ganic pollutants. On the other hand also desorption of gases from
surface water is quite a natural phenomenon:
- release of oxygen produced by algal activities up to a concentra
tion above the saturation concentration;
- release of taste- and odor-producing substances which are volatile
and the concentration of which in air is too low to yield a signi
ficant saturation concentration in water;
- release of methane, hydrogen sulfide under anaerobic conditions of
surface water or of the bottom deposits.
Whereas the mentioned processes of aeration and gas transfer under
natural conditions play an important part within the natural stabi
lization of water pollutants, a wide range of such operations is
applied of sanitary engineering for different purposes. This arti-
ficialy induced gas trans-fer by aeration aimes for instance at
- addition of oxygen to groundwaters to oxidize dissolved iron and

2
manganese to facilitate their removal
- addition of oxygen to sewage within the process of biological treat
ment, especially activated sludge treatment, in order to supply the
oxygen required for aerobic degradation of organic pollutants and in
order to maintain the oxygen tension necessary for mentioned aerobic
treatment.
Whereas the forementioned processes transfer oxygen into water by
aeration, the technique of aeration is also applied for the release of
gases from water which may impair the water quality with respect to
corrosion problems of storage and distribution facilities or with
regard to taste and odor problems. The transfer of oxygen simul-
taineously brought about during such desorjition operations is in this
case of minor importance. Specific operations of this kind are
- removal of carbon dioxide to adjust or to approach the carbonate
equilibrium with respect to calcium;
- removal of hydrogen sulfide to eliminate taste and odors and to de
crease corrosion of metals and disintegration of concrete;
- removal of methane to prevent fire and explosions;
- removal of volatile oils and similar odor- and taste-producing
substances;
- removal of ammonia from sewage as a means of reducing eutrophic con
ditions of receiving waters, especially of lakes.
Finally gas transfer operations have to be mentioned where water is
not exposed to air but rather to a specific pure gas, to air enriched
with a particular gas or to air or air-gas-mixtures at pressures and
temperatures other than those of the normal atmosphere.
The reasons that may lead to the application of the foregoing concepts
are, that gases have to be transferred to water that are not present
in air or not in sufficiently high concentration to allow for a ra
pid transfer of the gas in question. Examples are:
- addition of carbon dioxide from flue gas or carbon dioxide genera
tors to water that has been softened by the lime-soda process. Such
water is generally supersaturated with CaCO_ and Mg(OH) and is
stabilized by'addition of C0p;
- the addition of carbon dioxide from flue gas to lime-treated sewage
for removal of phosphates. The application is required for economi
cal neutralization of the effluent prior to discharge to a receiving
water of low buffer capacity;

3
- the addition of ozone or chlorine for disinfection of water or for
destruction of taste- and odor-producing substances as well as for
chemical oxidation of pollutants (e.g. of water in swimming pools).
1.2 Elements of Aeration and Gas Transfer Operations
Since gas transfer occurs only trough the gas-liquid interface, this
operation has to be carried out as to maximize the opportunity of
interfacial contact between the two phases. In order to have the bulk
of the solution also to take part in the transfer, continuous renewal
of these interfaces is essential. The engineering goal then is to
accomplish this with a minimum expenditure of initial and operational
cost (energy).
In principal, four different types of aerators are common for gas
transfer operations within the objectives of sanitary engineering:
1. Gravity aerators
1.1 Cascades, by which the available difference of head is subdivided
into several steps (fig. 1.1);
1.2 Inclined planes, often equipped with riffle plates to break up
the sheet of water for surface renewal (fig. 1.2);
1.3 Vertical stacks through which droplets fall and updrafts
of air ascend in countercurrent flow (fig.1.3). The stacks may be
subdivided by perforated pans or troughs (fig. 1.U), possibly fil
led with contact media to create large gas-liquid interfaces
(fig. 1.5).
Cokes, stones, plastic tubings ect. are used as contact media.
The stacks are either naturally ventilated or the draft is arti
ficially induced.
Gravity aerators are primarily used in water purification plants for
desorption of gases. The oxygenation of sewage within trickling fil
ters and ammonia stripping from effluents (fig. 1.6) are examples of
application of the gravity principle for gas transfer in the realm of
sewage treatment.
2. Spray aerators
By spray aerators the water is sprayed in the form of fine drop
lets into the air, thus creating a large gas-liquid interface for
gas transfer. The fine distribution of the water into the air is

4
- Inlet conduit
Outlet conduit
Perforated pipe ~.H fk 4, ft^-discharging
water downward >k.
1.3
Perforated pipe - discharging air
or gas upward
h=r Collecting pan
and outlet
Perforated Q"*"""* inlet pipe
Stack of perforated
trays
Collecting pan —
1 i I 1 I i V V I
Q Q Q J
-i *• Outlet
Vert ica l stack f i l l e d
with p l a s t i c tubes
F i g . 1.1 - 1.5 GRAVITY AERATORS
, AIR fOUTLET
™>^l WATER INLET
wmmm>X™™*™x* \nnnntd
AIR INLET
. DISTRIBUTION SYSTEM
AIR INLET
WATER INLET
AIR INLET
WATER WATER COLLECTING BASIN D U T L E T
WATER INLET
AIR ' INLET
COUNTERCURRENT TOWER
-COLLECTION BASIN
CROSS-FLOW TOWER
F i g . 1.6 STRIPPING TOWER FOR REMOVAL OF AMMONIA

5
2.70
accomplished by pumping the water through orifices or nozzles
mounted upon stationary pipes.
Layout and types of nozzles used for desorption of carton dioxide
in the course of water treatment are sketched in fig. 1.7. In se
wage treatment spray aeration is made use of in connection with
the distribution of sewage over trickling filters only.
a H- i
Vanes
u Central cone
Sacramento Nozzle
Berlin Nozzle
(a) Layout (b) Nozzle types
Fig. 1.7 SPRAY AERATORS
Air diffusers (bubble aeration)
By air diffusers compressed air is injected into water through
orifices or nozzles in the air piping system (fig. 1.8), through
spargers (fig. 1.9)> porous tubes, plates, boxes or domes (fig.
1.10) to produce bubbles of various size and hence with different
interfacial areas per m of air.
3.00
Fig. 1.8 AERATION THROUGH ORIFICES IN THE
PIPING SYSTEM (INKA)
Fig. 1.9 SPARGER-AERATOR
6
sewage feed
D = detail
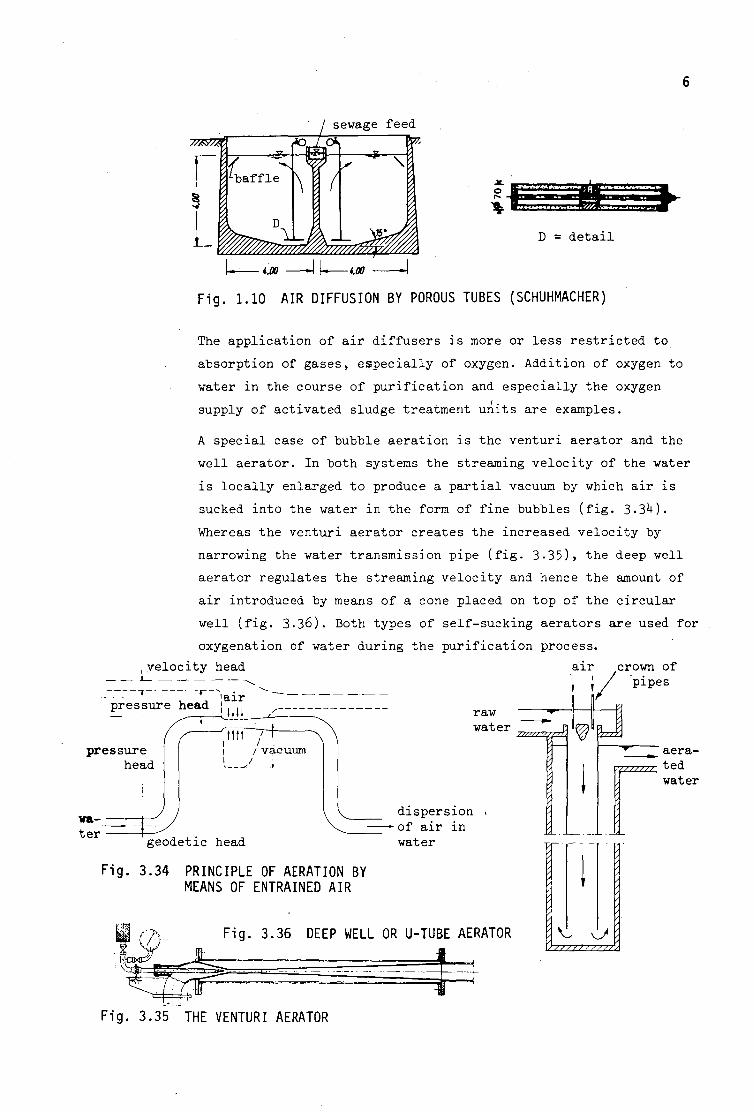
Fig. 1.10 AIR DIFFUSION BY POROUS TUBES (SCHUHMACHER)
The application of air diffusers is more or less restricted to
absorption of gases, especially of oxygen. Addition of oxygen to
water in the course of purification and especially the oxygen
supply of activated sludge treatment units are examples.
velocity head
A special case of bubble aeration is the venturi aerator and the
well aerator. In both systems the streaming velocity of the water
is locally enlarged to produce a partial vacuum by which air is
sucked into the water in the form of fine bubbles (fig. 3.3^).
Whereas the venturi aerator creates the increased velocity by
narrowing the water transmission pipe (fig. 3-35), the deep well
aerator regulates the streaming velocity and hence the amount of
air introduced by means of a cone placed on top of the circular
well (fig. 3-36). Both types of self-sucking aerators are used for
oxygenation of water during the purification process.
air crown of
1 » pipes lair pressure head j ...
pressure head
t t t t
raw water
/ . / vacuum
////////S£
wat e r geodetic head
Fig. 3.34 PRINCIPLE OF AERATION BY MEANS OF ENTRAINED AIR
dispersion of air in water
J Z_ _ aera-
v//?/// t e d water
F i g . 3 .36 DEEP WELL OR U-TUBE AERATOR
F i g . 3 .35 THE VENTURI AERATOR

7
h. Mechanical Aerators
Mechanical aerators create new gas-liquid interfaces by different
means and constructions. Creating of droplets or water aprons abo
ve the water level of the tank, entrainement of air due to the
pressure falling below normal at great water velocities near the
aeration device, renewal of the air-water-interface at the top of
the tank and a high degree of turbulence within the tank are me
chanisms, that promote the transfer of oxygen. Basically, there
are two types of construction:
k.1 Various construction of brushes, consisting of a horizontal revol
ving shaft with combs, blades or angles attached to it dipping
slightly into the water (fig. 3-Ul and '3.!*2);
k.2 Turbine or cone aerators with vertical shaft primarily of the
^.21 Updraft type (surface aerators), by which the rotor pumps large
quantities of water at the water surface at low head (fig. 1.11).
The aeration by the creation of large water-air interfaces above
the water level is enhanced by the entrainement of air bubbles
trough the action of the spread water falling upon the water sur
face of the tank.
r » • » > » » » » • > » » » » »
\
/
H i-
/
Fig. 1.11 TURBINE AERATOR
U.22 The downdraft type makes use of the negative head produced by the
rotating element for aspirating of air.

8
U.3 Besides these types, rotating impellors are also made use of to
disperse coarse air bubbles, induced under pressure, into small
ones in order to increase the air-water interface (fig. 3-63)
The purpose of this brief introductory description of the elements of
aeration and gas transfer was to give an illustration of the techniques
used, that may be of help in understanding the theoretical aspects and
engineering applications in the following sections. Although renewal
of gas-liquid interfaces has been stressed in the foregoing as the
prime factor, other parameters play also an important role in gas
transfer operations and will be discussed later.
1.3 Aeration and Gas Transfer within Processes qf Water Purification and
Sewage Treatment
As mentioned before, aeration and gas transfer serves various purposes
in water purification and sewage treatment. In principle, the goal of
any of the processes is to either establish a certain concentration of
the gas in water or to propagate reactions the gas is involved in.
Examples of the first purpose are aeration of water to increase the
oxygen content, desorption of carbon dioxide from water to establish
or approach the carbonate equilibrium, desorption of taste- and odor-
producing gases or volatile substances in order to meet specific quali
ty standards. Examples of the second kind are aeration for oxidation of
iron and manganese in water, aeration of activated sludge tanks to sup
ply the oxygen required for aerobic degradation of organic pollutants.
The requirements with respect to the gas concentrations to be esta
blished or the quantities of gas to be transferred for the propagation
of reactions will not be discussed here. The reader is referred to the
pertinent literature and textbooks. Nor will alternative processes be
covered, that in dependence on the conditions might give a more fea
sible and more economic engineering solution to the problem than just
gas transfer operations. Examples of such alternatives are the appli
cation of lime, burned dolomite, soda ash or sodium hydroxide instead
of desorption of carbon dioxide; adsorption of taste and odor produ
cing substances on charcoal instead of release by aeration; biological
nitrification of ammonia and subsequent denitrification for nitrogen
removal from sewage instead of ammonia stripping; ect.

9
2• Theoretical_As2§cts_of_Aeration_and_Gas_Transfer
2.1 Solubility of Gases
The solubility of gases in water (and also in other liquids) depends
upon
- the nature of the gas generally expressed by a gas specific coeffi
cient: the distribution coefficient 1L • 3
- the concentration of the respective gas in the gaseous phase (g/m )
which is related to the partial pressure p of the respective gas in
the gas phase <
- the temperature of the water T
- impurities contained in the water
2.11 Influence of the Gas Concentration on Solubility
If water is exposed to a gas or gas mixture a continuous exchange of
gas molecules takes place from the liquid phase into the gaseous and
vice versa. As soon as the solubility concentration in the liquid
phase is reached both gas streams will be of equal magnitude such that
no overall change of the gas concentrations in both phases will occur.
This dynamic equilibrium is generally referred to as the solubility
or the saturation concentration of the gas in the liquid. The higher
the gas concentration in the gaseous phase is the greater will be the
saturation concentration in the liquid phase, obviously. In fact, the
relation between the saturation concentration c (g/m ) and the gas 3 . ?
concentration in the gas phase c (g/m ) is a linear one: S
C s = k D - C g (2-1>
with k^ as proportionality constant. Its magnitude depends on the na
ture of the gas (and of course of the liquid), and - as will be shown
later - on the temperature of the water. 1L is generally referred to
as distribution coefficient. Values of It for various gases are given
in table 2.1.
Equation 2.1 can be used for any units for the respective concentra-3 3
tions (g/m , moles/m , moles/mole etc.). Preferably, mass concentra-

10
tions are applied (g/m ). Hence the gas concentration in the gas phase
c (g/m ) has to be known for estimating the solubility c . c may be g s g
obtained by application of the universal gas law
p . V = n . R . T (2.2)
where
p = partial pressure of the respective gas in the gas phase (Pa)
V = volume occupied by the total gas phase - including all other gases
of a gas mixture (m )
n = number of moles of the respective gas contained in volume V
R = universal gas constant (8,31^3 J/K.mole)
T = absolute temperature (K)
From equation 2.2 it follows, that the molar gas concentration in the
gas phase is equal to
(moles/m3) (2.3a) V R . T
Hence the corresponding mass concentration c is obtained by multipli-S
cation with the molecular weight (MW) of the gas in question:
- - * - ^ (g/m3) (2.3b). g R • T
Combination of eq. 2.1 and 2.3b yields
M „ , , 3 c s = *D ' RT ' P (g/m ' ( 2 , U a )
and shows the dependence of the solubility c on the partial pressure
of the gas in the gas phase. Eq. 2.k is known as Henry's law, former
ly widely applied for estimating solubilities. Henry's law is general
ly written as
cs = kR • P (2.Ub)
o w i t h kH ^ m 'Pa = g/J 'being Henry's constant. The relation between
the distribution coefficient k and Henry's constant follows from
eq. 2.Ha and b:
11
= kp . MW/R.T (g/J) k„ =
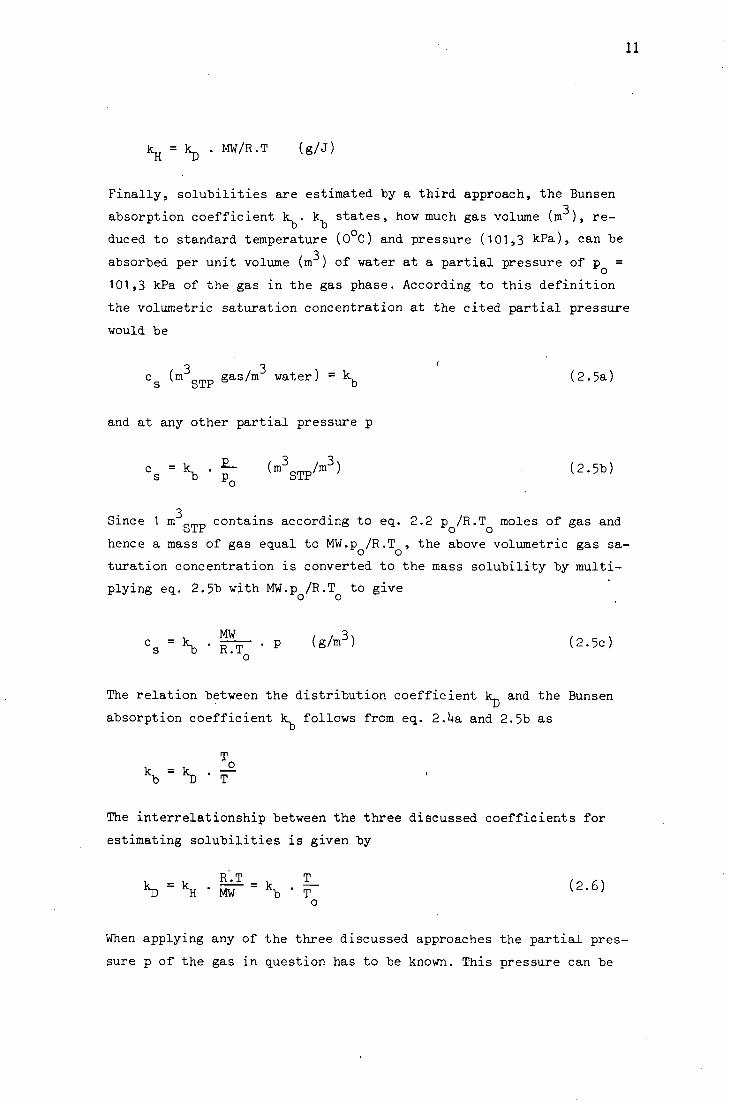
Finally, solubilities are estimated by a third approach, the Bunsen
absorption coefficient k_ . k states, how much gas volume (m ), re
duced to standard temperature (0 C) and pressure (101,3 kPa), can be
absorbed per unit volume (m ) of water at a partial pressure of p =
101,3 kPa of the gas in the gas phase. According to this definition
the volumetric saturation concentration at the cited partial pressure
would be
Cs ^m STP gas/,m w a t e r ) = \ (2.5a)
and at any other partial pressure p
Cs = kb • J" ( m 3STP / m 3 ) (2-5b)
o 3
Since 1 m contains according to eq. 2.2 p /R.T moles of gas and ol± O O
hence a mass of gas equal to MW.p /R.T , the above volumetric gas sa-o o
turation concentration is converted to the mass solubility by multi
plying eq. 2.5b with MW.p /R.T to give
cs = k b ' 0 - - e (*/m3) <2^> o
The relation between the distribution coefficient k_ and the Bunsen
absorption coefficient le follows from eq. 2.Ua and 2.5b as
kb = kD
T o
The interrelationship between the three discussed coefficients for
estimating solubilities is given by
o
When applying any of the three discussed approaches the partial pres
sure p of the gas in question has to be known. This pressure can be

12
obtained from the air composition in terms of the percentage volume
tric composition (see table 2.1) and the total pressure P on the basis
of Dalton's law of partial pressures. According to this law the par
tial pressure of a gas within a gas mixture is equal to the product
of the total pressure P and its volumetric fraction of the gas phase.
Dry air, for instance, contains 20,9^8 % of oxygen (see table 2.1).
At standard pressure P = 101325 Pa, therefore, dry air has an oxygen o
partial pressure of p = 101325 • 0,209^8 = 21 226 Pa.
In the practice of aeration the gas phase will always be saturated
with water vapor exerting a certain partial'pressure p the magnitude w
of which depends on the temperature (see table 2.2). Thereby the par
tial pressures p of the other gases are reduced, such that their sum
is P-p instead of P. Hence the partial pressures, corrected for water
vapor saturation of the gas phase p1 amount to
P-p p' = P • T 2 (2.7)
At 20 C the oxygen partial pressure of water vapor saturated air is
hence not p = 21 226 Pa but rather p' = 21 226.(101 325 - 2 330)/
101 325 = 20 738 Pa, i.e. 97,7 % of the "dry" value. The solibility
is reduced by the same ratio, obviously. Oxygen saturation values of
water exposed to air under conditions of water vapor saturation are
given in table 2.3.
Example
Compute the solubility of oxygen in pure water of 20 C exposed to air
at a pressure of 10U kPa (780 mm Hg). Compute Henry's constant and the
Bunsen absorption coefficient for the above conditions.
According to eq. 2.1 the solubility is
c = kp . c with kp = 0,0337 (table 2.1)
c is estimated by means of eq. 2.3b after computing the oxygen parti-S al pressure under conditions of water vapor saturation (eq. 2.7)

13
p ' = 0,209^8 . 101* . 1 Q l | ^ ? 3 3
= 21,30 kPa
21 300 • 32 0 „ n , , 3 Cg = 8,31U3 • 293,16 = 2 T 9 > 6 g / m
c s = 0,0337 • 279,6 = 9,h2 g/m3
According t o eq . 2 .6 Henry ' s c o n s t a n t a t a t e m p e r a t u r e of 20 C i s
MW 32 ' kH = \ * R7T~ = ° ' 0 3 3 T * 8 ,31^3 .293 ,16 =
= U,U2 . 10 - U ( g / J )
and the Bunsen absorption coefficient amounts to
T \ = \ . ^ = 0 , 0 3 3 7 . |I|*lf - 0.031U
Some of the gases listed in table 2.1 react with water. Equation 2.1
applies but to that part of the absorbate that is present as gas and
not to that which is ionized. This holds, for example, for the follo
wing gases.
Carbon dioxide:
reactions in water: CO + H O -»• H CO
H CO •+ HC0" + H+
HCO" -*• CO ~2 +>H+
The equilibrium of eq. 2.8a lies far on the left hand side: but 1 % of
the sum of CO and H CO is present as carbonic acid, 99 % as carbon
dioxide, approximately. In dependence of the pH of the water the re
actions 2.8 take'place, distributing the total amount of C into bi
carbonate and carbonate. Equation 2.1 does apply only to CO .
( 2 . 8 a )
( 2 .8b )
( 2 . 8 c )
Ammonia:
reaction in water NH + H -+ NH, (2.9)

14
The protolysis constant for reaction 2.9 at 25 C is given by
(NH+) ^ - 109'25
(H+) . (NH3)
Thus, the ratio of not ionized ammonia (to which the distribution law
is applicable) to that of the ionized form is
(NH_) 10~9'25 0 o q . „
3_ = = 10 ~9'25 + PH (2.10)
(NHJ) (H+)
indicating that the gaseous form is predominantly present at pH-values
well above 9»25 only.
Hydrogen Sulfide:
reactions in water (constants at 25°C between brackets):
H2S - HS" + H+ ( 1 0 " 7 ' 2 0 ) ( 2 .11a )
H S - + S - 2+ H + ( 1 0 " 1 1 ' 8 9 ) (2 .11b)
From the cited reactions and the constants it is evident, that the major
fraction of sulfide is present ir
pH- values well below neutrality.
fraction of sulfide is present in the gaseous form (H S) only at
2.12 Influence of Temperature on Solubility
When gases dissolve in water, this process is generally accompanied by
liberation of heat AH. According to the Le Chatelier principle, in
crease of temperature results in a decrease of solubility, therefore.
Since the distribution coefficient k^ represents an equilibrium con
stant, van 't Hoff's equation may be applied to generalize the tempe
rature dependence:
d (In k j AH ? (2.12)
dT , RT
Where R = "universal gas constant
T = absolute temperature K
AH = change of heat content accompanying the absorption of
1 mole of gas (J/mole)

15
By integration of eq. 2.12 between the limits T and T , assuming AH
to be constant over this range, the following expression is obtained
( y 2 _ A H T 2 - T I
lniyT-R--^T^ (2-13)
Eq. 2.13 may be simplified due to the fact, that the product T . T
does not change significantly within the temperature range encoutered
in sanitary engineering gas transfer operations. Thus, by assuming
AH/R.T .T = const, the following approximation is obtained:
const (T -T )
(k D) 2 - (k,), • e (2.1M
Eq. 2.13 and 2.1U are but applicable over a narrow range of temperatu
res since AH is a function of temperature and concentration. They are
useful for purposes of interpolation to obtain k -values for tempera
tures other than stated in table 2.1. Since at constant partial pres
sure (or at constant c ) of the gas in the gas phase c is proportional 6 s
to k , eq. 2.13 and 2.1U may also be applied to approximate the tempe
rature dependence of c .
More precise estimates of the solubility may be obtained experimental
ly only. For oxygen, the saturation concentration of water exposed to
water vapor saturated air is given in table 2.3. In this case, applica
tion of eq. 2.1U does not result in a good fit of the data of table
2.3, probably because a significant change of AH occurs within the
temperature range of interest. Better fits are obtained by empirical
formulae:
c • U 6 8 n (g/m3) • (2.15)
S 31,6 + T°C
for k = T = 30°C
and c = 1U.652 - U,1022 . 10-1 . T
+ 7,9910 . 10-3 . T2
- 7,777** • 10-5 . T3 (g/m3) (2.16)
16
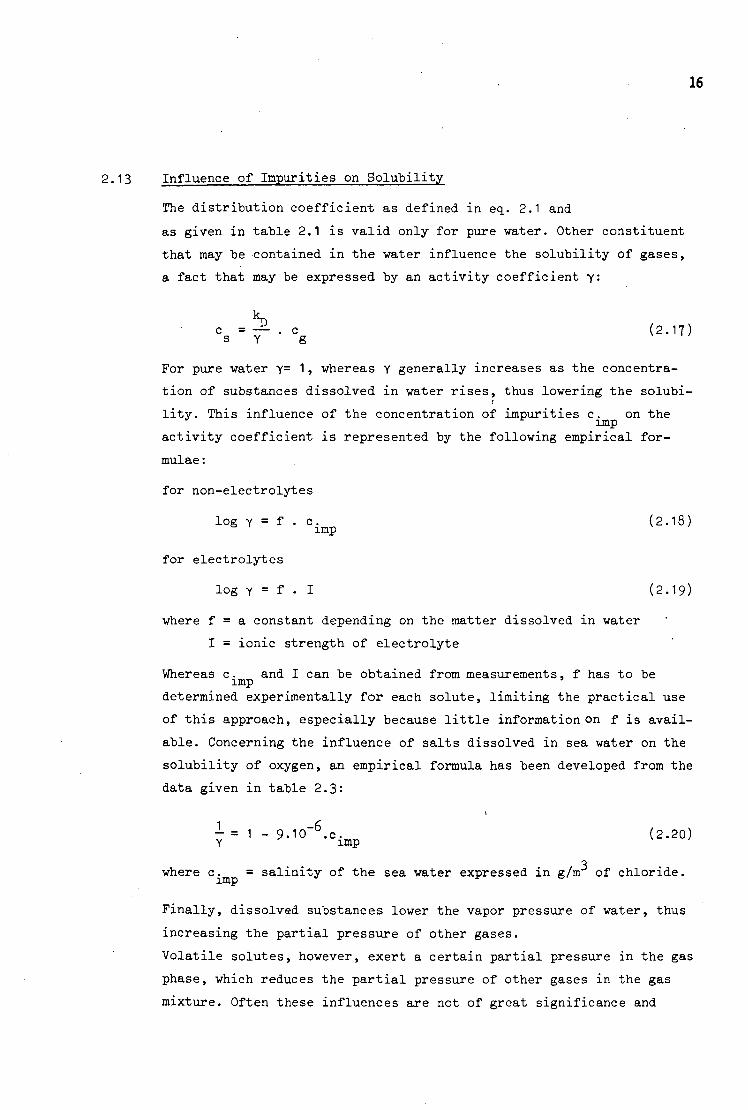
2.13 Influence of Impurities on Solubility
The distribution coefficient as defined in eq. 2.1 and
as given in table 2.1 is valid only for pure water. Other constituent
that may be contained in the water influence the solubility of gases,
a fact that may be expressed by an activity coefficient Y:
c = — . c (2.17) s Y g
For pure water y= 1, whereas Y generally increases as the concentra
tion of substances dissolved in water rises, thus lowering the solubi-
lity. This influence of the concentration of impurities c. on the imp
activity coefficient is represented by the following empirical for
mulae : for non-electrolytes
log y = f • c. (2.18) imp
for electrolytes
log Y = f • I (2.19)
where f = a constant depending on the matter dissolved in water
I = ionic strength of electrolyte
Whereas c. and I can be obtained from measurements, f has to be imp '
determined experimentally for each solute, limiting the practical use
of this approach, especially because little information on f is avail
able. Concerning the influence of salts dissolved in sea water on the
solubility of oxygen, an empirical formula has been developed from the
data given in table 2.3:
- = 1 - 9.10~6.c. (2.20) Y imp
3 where c. = salinity of the sea water expressed in g/m of chloride.
Finally, dissolved substances lower the vapor pressure of water, thus
increasing the partial pressure of other gases.
Volatile solutes, however, exert a certain partial pressure in the gas
phase, which reduces the partial pressure of other gases in the gas
mixture. Often these influences are not of great significance and

hence neglected.
From the many influences on the solubility of gases and their uncer
tainties (especially impurities) it is evident, that saturation con
centrations as obtained from table 2.1 and/or table 2.3 for pure water
may not be directly applied to water or especially to sewage with
great accuracy. Experimental determination of the solubility is rather
required in such cases.
Diffusion
The phenomenon of diffusion may be described as the tendency of any
substance to spread uniformly throughout the space available to it.
Obviously, this holds in gas transfer operations for the gaseous phase
as well as for the liquid. However, since the diffusion of gases in
the gaseous phase is much faster than in the liquid (about 10 times)
more attention is generally paid to diffusion phenomena in the liquid
phase in gas transfer operations in sanitary engineering.
For a quiescent body of water of unlimited depth contacting the gas
by an area of A the rate of mass transfer dM/dt as a consequence of
diffusion of the gas molecules in the liquid phase defined by Fick's
Law
f - - D . A . |f (8/B) (2.21)
where D = coefficient of molecular diffusion (m2/s)
x = the distance from the interfacial area A
9c/3x = concentration gradient
Fick's Law is written as partial differential equation because the
concentration gradient varies during diffusion. It is important to
recognize that solely the concentration gradient determines the rate
of diffusion per unit area for a certain gas. The minus sign refers to
the fact, that the direction of diffusion is opposite to that of the
positive concentration gradient.
Values for the coefficient of molecular diffusion of gases in water
are given in table 2.it. In dependence of the gas and the temperature -Q ?
they range from 1 to 7.10 m Is.

18
As a consequence of the process of molecular diffusion the gas con
centration in liquid phase is increasing. The concentrations c(t, x)
in the body of water are dependent on the distance x from the inter-
facial area A and on the time t elapsed. This can quantitatively be
described by partial integration of eq. 2.21 assuming an initial
gas content of c of the bulk of the liquid and immediate saturation
(c ) at the interface A, by
:(t, x) = exp(-x A.Dt) . dx (2.22)
The practical use of eq. 2.22 is very limited, because the integral
cannot be solved directly. Qualitatively, eq. 2.22 is depicted in fig.
2.1 to show the dependency of c on t and x, c(t, x) being expressed
in terms of the saturation "percentage c(t, x)/c .
-*- distance from surface x
2.1 THEORETICAL EFFECT OF TIME ON CONCENTRATION DISTRIBUTION OF DISSOLVED GAS IN A LIQUID DURING ABSORPTION BY MOLECULAR DIFFUSIONS = TIME SINCE EXPOSURE.ALL VALUES ARE RELATIVE.
The total amount of gas M (g), that has been absorbed through the
surface area A during the time t, is independent of x, obviously, and
amounts to
M = 2 . A . (c - c ) s o (g) (2.23)

19
under conditions of unlimited depth of the water body.
Nevertheless, eq. 2.23 can be applied for estimating the absorbed
amount of gas M also for limited depth with fair accuracy, if the
depth is not too small and the time of diffusion not too long, since
diffusion is a very slow process and only very little gas is brought
into the deeper layers of the water body (compare fig. 2.1). The rate
of gas absorption through A is obtained by differentiation of eq. 2.23
with respect to time t:
H = A . (cs - cQ) 7 (g/s) (2.2U)
It is infinite at t = o and drops down very quickly to extremely low
values.
Example: A quiescent body of oxygen-free water of a depth of 2,0 m
and a temperature of 20 C is exposed to air at a pressure of 10^,0
kPa. How much oxygen is absorbed during one day? Find the absorption
rate after 1 second, 1 minute, 1 hour, and 2k hours.
a) The mass of oxygen absorbed during one day is estimated by means
of eq. 2.23 as
A = 2 • (cs " co> J f <«/»*>
with
c = 0 o 3
c = 9»^2 g/m (see foregoing example)
D = 1,8 . 10~9 m2/s
t = 86 1*00 s Hence
M/A = 2 . (9.U2 - 0) . y/1,8 . 10~9 . 86 UOO/TT
2 = 0,133 g/m during one day

20
b) The rate of oxygen absorption is computed with eq. 2.2U as
dM dt k « (cs-CQ) • DA • t'
= (9,^2 - 0) . \/l ,8 . 10~9/TT . t'
and amounts after
_(• p
1 second to 225 • 10 g/m . s
—£> ?
1 minute to 29,1 .10 g/m . s
1 hour to 3,76 . 10~ g/m2 . s
1 day to 0,767 .10 g/m . s
In the beginning of this section a quiescent body of water has been
assumed: no change of elements of the liquid-gas interface and no mix
ing within the gas and liquid volume have been presumed. Hence the
given equations hold also for laminar flow, where no renewal of the
interfacial area A and no eddies are present. With turbulent flow a
second mechanism of displacement of solutes within the solution has to
be considered, namely the eddy diffusion. Turbulent flow is characte
rized by the motion of fluid particles, which is irregular with res
pect to direction, magnitude and time. These properties are described
by the Prandtl theory. Eddies are assumed to move with an average
velocity u (m/s) perpendicular to the direction of the net flow over
an average length, the Prandtl mixing length 1. This interchange of
fluid particles contributes to equalize the concentration of a solute
within the solution and hence shows the same effect as molecular dif
fusion. In contrast to the phenomeon of the latter type it is called
eddy diffusion, the coefficient of eddy diffusion D being defined in E
its most simple form by the product of u and 1
DE = u . 1 (m2/s) (2.25)
21
Since u and 1 depend on the hydrodynamic conditions, so does the co
efficient of eddy diffusion. Obviously the turbulent hydrodynamic
conditions vary over the volume occupied by the liquid, reaching lar
ger values of u.l in the core which diminish at the interfaces, where
solely molecular diffusion is responsible for gas transfer.
Molecular and eddy diffusion are additive. Thus, a total diffusion co
efficient may be stated as
Dt = D + DE (m2/s) (2.26)
Molecular diffusion is accelerated by increasing the temperature.
The temperature dependence of D may be expressed by van 't Hoff's
Law analogous to eq. 2.1U as
D 2 = D l . eConst.^-T,) ( 2 > 2 ? )
From the data of table 2.U the "const." for eq. 2.27 is estimated to
cover a range from 0,0255 to 0,0300 for the cited gases.
Another dependence uses the Nernst-Einstein relationship:
^ - = const. (2.27a)
where y = absolute viscosity (g/m.s)
T = temperature (K)

22
2.3 Gas Transfer Coefficients
2.31 The Concept of Gas Transfer Coefficients
During the process of gas transfer from a gas phase into water a
distribution of the gas concentration in both phases may be imagined
as given by figure 2.2. The decrease of concentration in the gas phase
g(gas) L(liquid)
Fig. 2.2 DISTRIBUTION OF THE GAS CONCENTRATION AT A GAS-LIQUID INTERFACE
in direction to the interface from c to c . (concentration in the g gi
gas phase at the interface) is induced by absorption of gas in the'
liquid phase. According to eq. 2.1c . is in equilibrium with the
gas concentration in the liquid at the interface c .. The gas concen-Li
tration in the bulk of the solution is c . Since in accordance with L
Fick's Law (eq. 2.21 ) the mass transport per unit time (g/s) is pro
portional to the concentration difference, the following relationship
may be stated for the gas phase m = k . A . ( c - c . ) (g/s) 6 * g g gi
(2.28)
and for the liquid phase m = k . A . (c . - c ) (g/s) (2.29) L Ll L
where k = partial gas transfer coefficient for the gas phase (m/s) g
k = partial gas transfer coefficient for the liquid phase (m/s) L
c . and cT. are generally not known. They may, however, be eleminated gi Li from eq. 2.28 and 2.29 by applying eq. 2.1
cT • = k_ . c . Li L> gi

23
and equating "both equations to give
1 k -1 m = (— + r^) . A . (k .c - cT ) (2.30)
kL kg D g L
Thus it is seen, that the (total) gas transfer coefficient K is com-
posed of both the partial coefficients and the distribution coeffi
cient:
1 1 k
L L g
and eq. 2.30 may hence be rewritten as
m = A . 1^ . (Ijj-c - cL) (g/s)' (2.32)
For the ease of further discussion the result is anticipated, that
(in accordance with the penetration theory) the partial coefficients
of gas transfer are proportional to the square root of the coefficients
of molecular diffusion D of the respective phase. Since the diffusion
coefficients of gases in air and in water are in order of 10 and -9 2
10 m /s, respectively, the ratio of the transfer coefficients may
. / * , - / ^ be estimated to be of the order of k /k = / 10 = 100. Even with g.
fairly well soluble gases (e.g. ammonia, carbon dioxide, hydrogen
sulfide), the value of lv./k will therefore be very small with respect
to l/kL- Thus, the influence of the gas transfer coefficient of the
gaseous phase may be neglected, which is equivalent to choosing
KL = kL (2.33)
and consequently
m = kL . A . (kD.cg - cL) (g/s) (2.3*0
Whereas eq. 2.32 and 2.31* describe the overall rate of gas transfer by
a more or less arbitrarily chosen parameter - the gas transfer coeffi
cient - a relation between this parameter and the coefficient of dif
fusion is develdped by a theoretical approach of the mechanism of gas
transfer. Some of the theories advanced to describe this mechanism
will be discussed in the sections to follow.

24
2.32 Theories on the Mechanism of Gas Transfer
2.321 Film Theory (2)
The model underlying the film theory is the following (fig. 2.3):
hulk gas liquid bulk gas film film liquid phase | i phase
mixing and diffusion mixing
i L
Fig. 2.3 MODEL OF THE FILM-THEORY
by molecular and eddy diffusion and by mixing (convection) the gas to
be absorbed is transported into the "gas film" at the interface.
This gas film is thought to be stagnant and to have a thickness d g
depending on the degree of turbulence in the gas phase. The same holds
for the liquid film with a thickness of d . Since the rate controling
mechanism of gas transport through both film is only molecular diffu
sion, which is a very slow process compared with eddy diffusion and
convection, it are the films that offer the sole resistance to gas
transfer. Applying Fick's Law to the process of diffusion through the
films and assuming steady state conditions of turbulence (d and d g Li
are constant) and of gas concentration in the films (c . and cT. are g i Li
cons t an t ) , the following r e l a t i onsh ip s are obtained
for the gas films m = D g
-£i (2.35)
and for the liquid film m = D cT. - cT Li L
(2.36)
A comparison of eq. 2.35 and 2.36 with 2.28 and 2.29, respectively,
shows that according to the film theory the coefficients of transfer
are proportional to the coefficients of diffusion. Neglecting the in
fluence of k on the total coefficient of transfer K as proposed in
g 1 section 2.31, the rate of gas transfer according to the film theory is

25
m = ~- . A.(k„.c - cT) (2.37) dL '
x D g L
and hence
k =2- (2.38) L dL
This result is contradictory to experience, showing a much less pro
nounced dependency of kT of D. This fact and reasons to be discussed
in the following section have caused the film theory to be largely
discredited. f
2.322 Penetration Theory (3)
The model of the penetration theory does not proceed from stagnant
films but rather from fluid elements which are briefly exposed to the
gas phase at the interface of the liquid. During this time of exposure
the gas diffuses into the fluid element: it "penetrates" into the
liquid. In contrast to the film theory this process of penetration
is described by unsteady diffusion, the time of exposure being too
short for a steady state of diffusion to develop.
Thus Fick's Law (eq. 2.21), the solution of which has been qualitati
vely given in fig. 2.1, is applied to describe the mechanism of un
steady diffusion during the time of exposure t. Since this time is
generally very short in gas transfer operations (< 0,1 s) an approxi
mation of the solution (eq. 2.22) is used. This approximation is based
on replacing the slightly curved depth-concentration relationship by
a linear one as stated in figure 2.U. The depth-concentration lines are
then defined by the concentration l^.c = C at the surface (x = 0) ^ g xs
and by the concentration in the bulk of the liquid cT (= c = initial L o
concentration) at some distance x from the surface. The distance x , P p'
the penetration depth, increases with increasing time: x = f(t). This
function can be obtained by reading the concentration gradient from
fig. 2.1* as 8c/3x = -(CS-C
L)/XD» inserting it into eq. 2.21 and equating
with eq. 2.2U:

gas gas
concentration i
V c = c g s
liquid
depth of penetration
26
Fig. 2.4 PENETRATION OF A GAS INTO A LIQUID BY UNSTEADY DIFFUSION
dM 3c — = - D .A . — = D dt 3x
c -c s L = A . (cg-cL) . JD/ir..t" (2.39)
Solving for x we get
"/" • D (2.U0)
Example: In order to get an impression of the magnitude of the depth
of penetration in dependence of time, compute the x 's for
the different times of exposure of the example in section
2.2.
According to eq. 2.H0 the penetration depth is estimated as
I To • x = h . 1,8 . 10 . t and amounts after P V
1 second to 0,0752 . 10 m
1 minute to 0,582 . 10 m
1 hour to U,51 . 10 m
1 day to 22,1 . 10~3 m
During the time of exposure of the liquid interface to the gas, the
gases "penetrate" into the liquid at a diminishing rate, as describ
ed by eq. 2.39• The total mass of gas absorbed during this time is
given by eq. 2.23 as

27
M = 2 . A . ( V c - c L ) . ^
Hence the average absorption rate m (g/s) during the time t is de
fined by
| = in = 2 . A . (kD.cg - cL) J2-. (g/s) (2.M)
The only unknown parameter of eq. 2.1*1 is now the time of exposure t.
The penetration theory assumes it to be constant
t = t , (2.1+2) c
for a gas transfer process operated under steady state condition.
As will be shown later, t can be estimated in some cases. Inserting
the constant time of exposure t into eq. 2.1*1 we get the final form
of the rate expression for gas absorption as proposed by the pene
tration theory:
m = 2 '^^T • A ' ( V cg -
CL} ^ ^ (2-U3)
Thus it is seen (compare eq. 2.1*3 and 2.3*0 that according to the"
penetration theory
stating that the coefficient of gas transfer is proportional to the
root of the coefficient of diffusion.
Assumption of a constant time of exposure of fluid elements to the
tnere is aiso a constant rate r r c
renewal of the surface
gas phase implies that there is also a constant rate r (s ) of
r = 1/t (s~1) (2.1*5)
Taking r instead of t , the coefficient of gas transfer becomes c c
/D.r kL = 2 . J-^- (2.U6)

28
2.323 Surface Renewal Theory (*0
The model underlying the surface renewal theory is equal to that of
the penetration theory: unsteady diffusion (penetration) of the gas
into liquid elements exposed to the gas phase. Thus eq. 2.39 is "being
used to describe the time dependence of mass transfer during the ex
posure. However, this theory does not assume this time to be constant
but rather to follow a frequency distribution f(t) with ages of the
fluid elements ( = time of exposure) ranging from zero to infinity.
More specific, the theory is based on the assumption, that the •fraction
of the surface having ages between t and t + dt is given by f(t)dt = —s t
s.e ' dt. This is true if a surface element of any age always has
the chance of s.dt of being replaced; in other words, if each surface
element is being renewed with a frequency s, independent of its age.
Inserting the frequency distribution of ages into eq. 2.39, the
average rate of gas transfer is
m = ( V cg - c
L} • v5r • - s t ^
s.e dt
= / D.s '. A . (kjyC - c ) (2.U7)
Thus it is seen that the surface renewal theory forecasts
kT = / D.s' (2.U8)
2.32U Film-Surface-Renewal Theory (5)
This theory attempts a combination of the film theory and the surface
renewal theory in principle, i.e. a combination of steady and unsteady
diffusion. The reasoning, that led to this approach lies in the fact
that at conditions of very low turbulence (e.g. stagnant or very slow
streaming rivers) the exposure of surface elements to the gas phase
may be sufficiently long for a steady type of diffusion to develop.
Moreover, the theory argues that during unsteady diffusion under these
conditions the penetration depth may theoretically reach into the re
gion of constant gas concentration where molecular and eddy diffusion
and mixing processes govern the dispersion process and not solely mo
lecular diffusion. Applying the surface renewal concept the theory is
29
able to state the gas transfer coefficient as a function of the average
rate of surface renewal s and max x = dT
s.a: kT = • D.s' coth (2.U9)
The properties of this function are such, that at low turbulence
(s -*• o) the film theory applies (k = D/dT ), whereas at high turbu
lence the second term of eq. 2.U9 approaches 1 and k is governed by J-i
the rate of surface renewal s.
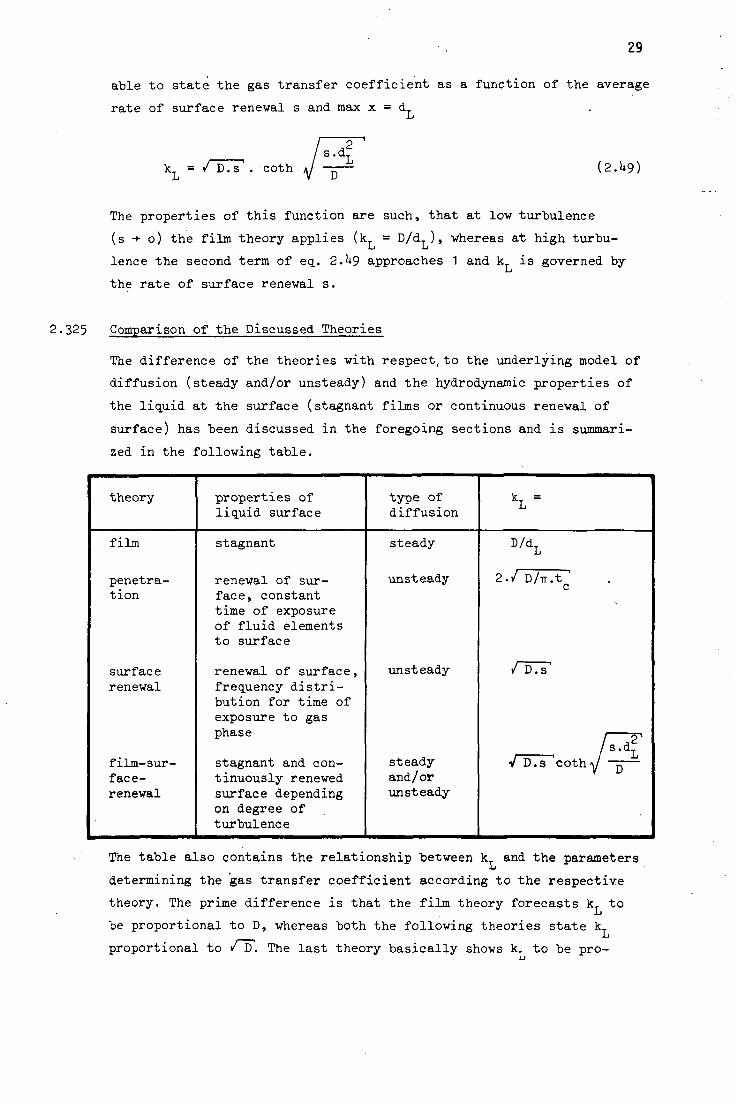
2.325 Comparison of the Discussed Theories
The difference of the theories with respect,to the underlying model of
diffusion (steady and/or unsteady) and the hydrodynamic properties of
the liquid at the surface (stagnant films or continuous renewal of
surface) has been discussed in the foregoing sections and is summari
zed in the following table.
theory
film
penetration
surface renewal
film-surface-renewal
properties of liquid surface
stagnant
renewal of surface, constant time of exposure of fluid elements to surface
renewal of surface, frequency distribution for time of exposure to gas phase
stagnant and continuously renewed surface depending on degree of turbulence
type of diffusion
steady
unsteady
unsteady
steady and/or unsteady
*L =
D/dL
2.-/ D/ir.t ' c
• D.s'
, /T? V D.s cothy D
The table also contains the relationship between k and the parameters
determining the gas transfer coefficient according to the respective
theory. The prime difference is that the film theory forecasts kT to l i
be proportional to D, whereas both the following theories state k Li
proportional to The last theory basically shows k to be pro-
30
portional to D , n varying from 1 (s = o) to 0,5 at high turbulence.
Deviations from n = 0,5 are less than 5 % for / s.d /D > 1,86, less
than 1 % for > 2,56, and less than 0,5 % for > 3,0.
With the exception of the combined film-surface-renewal theory each
theory contains one unknown parameter, which is basically dependent
on the hydrodynamic conditions of the fluid. (The experience, that
k increases slightly with increasing turbulence, is explained by the L
theories on the basis of changing this factor. Thus, increase of tur
bulence would
a) decrease the film thickness d
L
b) decrease the time of exposure of the fluid elements t
to the gas phase c) increase the average rate of surface renewal s
d) decrease d and increase s
Although the physical interpretation of k differs from theory to Li
theory, a relation between the unknown parameters may be obtained by
numerically equalizing the k 's. This yields for the first 3 theories Lt
the following relationship, which may be useful when interpreting
kT~data by some of the theories.
dT = / D.ir.t ' = / D/s' = x (2.50) Li C p
t = &f I D.TT = 1/S.1T (2.51) C li
s = D/dJ = 1/t .ir (2.52) L C
As already mentioned, the film theory has largely been discredited
due to its assumption of stagnant films and steady diffusion, a process
that cannot develop within the brief time _of exposure of fluid elements
to the gas phase, generally encountered in transfer operations in
sanitary engineering. Applying unsteady diffusion, the penetration
theory may be more useful than the surface renewal theory, because
the time of interfacial contact t may be estimated in some cases.
The average rate of surface renewal s, however, cannot be measured but
rather recomputed from k -values and the coefficient of diffusion (eq. Li
2.U8). Thus, the penetration theory would deserve predominant applica
tion in gas transfer operations in the realm of sanitary engineering.

31
2.33 Some Applications of the Penetration Theory
As already mentioned the coefficient of gas transfer k may be esti-
mated for transfer operations when the time of interfacial contact of
a fluid element with the gaseous phase can be assessed. In bubble
aeration t may be computed from the rising velocity with respect to
water v and the bubble diameter d„ as t = d /v • Then the coeffi-r B c B r cient of gas transfer becomes
k L = 2
D.v i
TT.d. (2.53)
In figure 2.5 the rising velocity of bubbles in stagnant water is gi
ven as a function of d^. The corresponding times of interfacial COn-
tact t = d /v range from 0,003 to 0,1 seconds as may be seen from
the figure. Application of eq. 2.53 then gives the k -values in de-
pendance of d . B
The solid lines apply to pure water, the dashed lines (for bubbles of -3 < < -3 \
approximately 0,5.10 = d = 10.10 m) to tap water. It is interest-
3.10
3.10
en
E
CD <H w c aj
•p
en aJ
.4 bO O
-P C (U
5 ^
0) o o
— + • diameter of air bubbles d (mm)
Fig. 2.5 RISING VELOCITY OF AIR BUBBLES IN WATER AND THE COEFFICIENT OF GAS
TRANSFER AND TIME OF EXPOSURE ACCORDING TO THE PENETRATION THEORY

32
ing to note that the coefficient of gas transfer (for oxygen in this -k < <
case) varies hut over a narrow range of approximately 10 = k = -h , -k
3.10 m/s, averaging 1,5-10 m/s. This includes that the gas trans
fer per unit area A (compare eq. 2.3*0 does not differ greatly hut
that the total gas transfer is mainly determined hy the total bubble
surface area present in the liquid phase. This area is proportional 2 . . . . . .
to d . Since, however, the size and size distribution of d in practi-B B
cal diffusion operations is difficult to estimate exactly, only empi
rical relationships can he applied to forecast the rate of gas
transfer.
Spray aeration is considered as a second example. Assume droplets to
be formed of 6 mm diameter falling with a velocity of 7 m/s over a
length of 3j5 m. The time of contact is 3,5/7 =0,5 s giving a value
for kT at 20°C for oxygen of kT = 2 / 1 ,8. 10~9/TT.O,5' = 0,68.10~ m/s
-9 2 and for carbon dioxide with D = 1,68.10 m/s of.
kT = / 1,68.10_9/TT.O,5 = 0,65.10" m/s.
Again, k lies in the .same order of magnitude as for bubble aeration,
being somewhat less, however. Both examples are realistic and show
that in gas transfer operation the time of exposure is very short (< 0,5 s). The corresponding penetration depths are less than 5-10 m (0,05 mm) when applying an average coefficient of diffusion for gases
-9 2
of 1,5.10 m /s in connection with eq. 2.40. This thin layer is hard
ly influenced by increasing the turbulence of the liquid phase, so that
k is primarily determined by molecular and not by eddy diffusion. Li
Increase of turbulence will, however, increase the interfacial area
(for instance by producing smaller bubbles or droplets) and decrease
the time of exposure t and thus thus promote the rate of gas transfer.
2.34 Factors Affecting the Gas Transfer Coefficient
The main factors affecting the gas transfer coefficient are the tempe
rature and the concentration and nature of hydrophobic substances.
Whereas temperature influences all gas transfer operations, the pre
sence of hydrophobic matter is of importance only in connection with
the oxygenation of sewage and sewage-sludge mixtures (activated slud
ge process), where significant concentrations of hydrophobic matter,
especially surface active agents, are to be expected.

33
The temperature dependence of the coefficient of gas transfer may be
seen from eq. 2.hh, stating k as a function of D and t , and from
eq. 2.27 and 2.27a giving the influence of temperature on the coeffi
cient of diffusion. Thus there are two temperature influences to be
conceived: first the coefficient of diffusion increases with in
creasing temperature and secondly, the viscosity is decreased with
increasing temperature, thus increasing the rising velocity of bubbles
and thereby decreasing the time of exposure t = d /v . Finally the
local hydrodynamics of the interface are altered (Brownian movement)
in such a fashion as to augment the coefficient of gas transfer.
Moreover the rate of gas transfer (eq. 2.3M is influenced by a chan
ge of temperature through alteration of the, total interfacial area A
and the driving force (k .c - c ). Although these factors do not re-D g L
fer to the temperature dependence of k , they are briefly discussed
here.
The increase of A is mainly caused by the temperature dependence of
the surface tension. In bubble aeration, for instance, the diameter of spherical bubbles is d = Uo/p, a being the surface tension and
. . B
p the local pressure at the bubble surface. Thus by decreasing the
surface tension by increasing the temperature, the average bubble dia
meter is decreased giving rize to a greater interfacial area A.
The temperature dependence of 1L results in a decrease of the satura
tion value of a gas with increasing temperature, thus lowering the
driving force and thereby the rate of gas transfer for absorption pro
cesses and increasing the driving force and rate for stripping.
Combining all mentioned effects of temperature on the rate of gas
transfer (effects on k and A), the following function may be princi-
pally applied for generalization
(kL-V}T = (kL-V}T * Q 2 1 ( 2' 5 U )
The temperature coefficient G for oxygenation of sewage, for instance,
has been found to be in the range of 1,016 to 1,01*7.
The influence of hydrophobic constituents and surface active agents
on the rate of gas transfer is manifold. Such matter has the tendency
to accumulate at interfacial surfaces, a process which is quantitave-
ly described by the "Gibbs adsorption equation":
S RT ' dc (2.55)
where in this case
c = concentration of hydrophobic substance in the bulk
of the solution (g/m )
S = excess concentration of hydrophobic substance at the p
surface (g/m ) as compared with that of the bulk
of the solution
R = universal gas constant
da/dc = rate of increase of surface tension with increasing the
concentration of the hydrophobic substance.
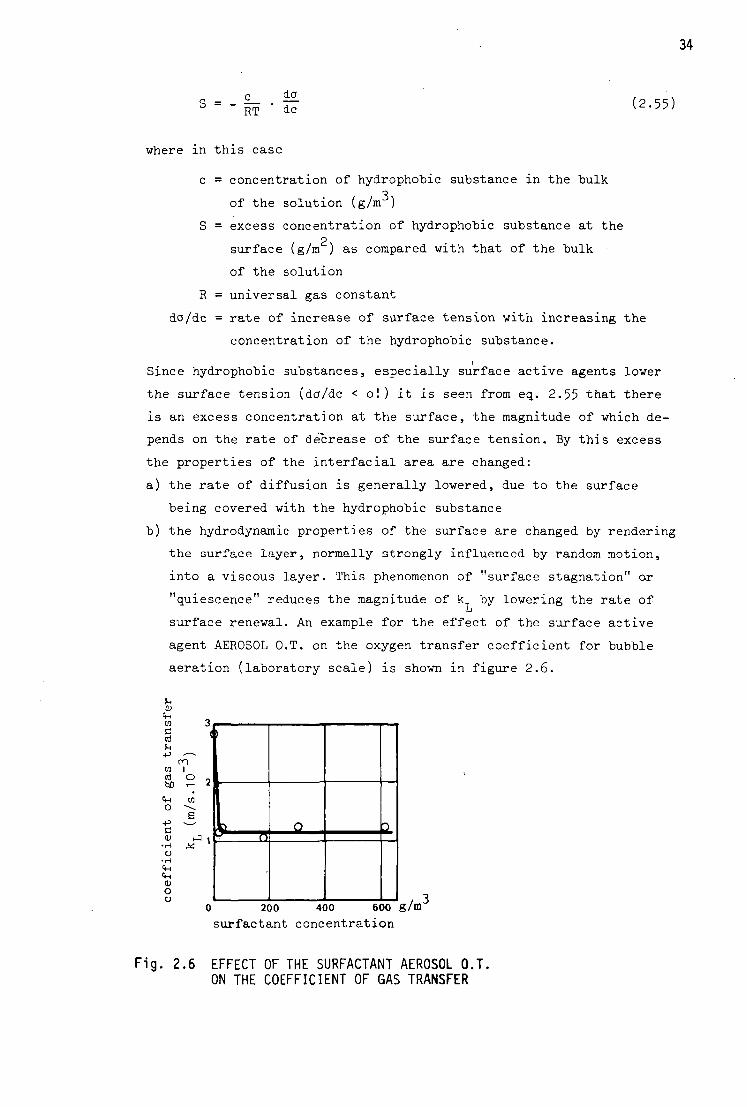
Since hydrophobic substances, especially surface active agents lower
the surface tension (dcr/dc < o!) it is seen from eq. 2.55 that there
is an excess concentration at the surface, the magnitude of which de
pends on the rate of decrease of the surface tension. By this excess
the properties of the interfacial area are changed:
a) the rate of diffusion is generally lowered, due to the surface
being covered with the hydrophobic substance
b) the hydrodynamic properties of the surface are changed by rendering
the surface layer, normally strongly influenced by random motion,
into a viscous layer. This phenomenon of "surface stagnation" or
"quiescence" reduces the magnitude of k by lowering the rate of
surface renewal. An example for the effect of the surface active
agent AEROSOL O.T. on the oxygen transfer coefficient for bubble
aeration (laboratory scale) is shown in figure 2.6.
u CD
<H en C ni U -P ^
m en I cd o faO <-
o -p c
"in
O
to
6
^ 1 s^? j
0 200 400 600 g/m"
surfactant concentration
ig. 2.6 EFFECT OF THE SURFACTANT AEROSOL O.T. ON THE COEFFICIENT OF GAS TRANSFER

35
The magnitude of the excess concentration at the gas-liquid interface
is of dynamic nature. When an interface is being formed it takes a
certain time t„ until the equilibrium between the bulk concentration
is established. If now the average time of exposure of the interface
t is smaller than t , the influence of the surface active agents on
k is much less than for the case where t > t . Figure 2.7 gives an ij C £j
example for this type of dynamic surface concentration. It is seen
that with a bulk concentration of 800 g/m of the SAA Dodecyltrimethyl-
ammonium chloride it takes about 0,01 seconds to establish the equili-
brium completely, whereas with a bulk concentration of U00 g/m it is
not reached within 0,05 seconds under the hydrodynamic conditions of
the experiment.
14
c o
• H • p
cd
- p
c <i>
o c o o 0) C)
(rt V i
£)
LTN 1 O
. *—* C\l
6 03 CO
r-\
o S
12
10
H
6
4
s /
/ t
/
DC
800 ppm
)DECYLTRIM
U00 ppm
ETHYLAMMOI HUM CHLOR IDE
0,01 0,02 0,03
—1»- exposure time t
0,04 0,05
Fig. 2.7 DYNAMIC NATURE OF SURFACE CONCENTRATION
Finally, also the total rate of gas transfer (eq. 2.3*0 is influenced
by the presence of surface active agents or hydrophobic matter by gi
ving rise to a larger interfacial area A due to the lowering of the
surface tension a. Summarizing the effects of hydrophobic matter on
the rate of gas transfer it may be stated that
a) a reduction o'f the rate via the coefficient of diffusion and the
alteration of the hydrodynamic properties of the interface is to
be expected, the magnitude of which depends on the time of ex
posure of these interfaces or on the rate of surface renewal
(influences on k ) Li
36
b) an increase of the rate is to be expected due to the increase of
the interfacial area as a consequence of the reduction of the
surface tension.
The magnitude of the influence (a) and/or (b) depends greatly on the
system of gas transfer operation and moreover on the physical and
chemical structure of the hydrophobic matter. Thus, no general rules
can be put foreward and the effect can be determined experimentally
only.
2.4 Practical Approach to Gas Transfer Rate Formulations
The disadvantage of the cited rate formulat ion is that the diffusion
coefficient D and the time of exposure of the interfacial area t
have to be known to for ecast the coefficient of gas transfer.
To finally determine the rate of gas transfer also the size of the
interfacial area A has to be estimated.
Methods to determine these parameters are available. In bubble aera
tion for instance, the bubble size and its velocity can be measured
to yield information on k and A. The same holds for spray aeration. Li
Such estimates are of limited accuracy since they do not account for
the rapid change of interfacial area during their information. It has
been found for instance, that during the formation of bubbles or
droplets a significant gas transfer take place which is not included
in formulations as eq. 2.^3. Although an evaluation of these effects
by stating a seperate k -value for the formation period could be con-
ceived of, this would give rise to intricate formulations of little
practical value. In some cases, mechanical aeration for instance, it
seems impossible to accurately determine the required parameters for
an estimate of k . Consequently, other more practical approaches to
the formulation of the rate of gas transfer have become quite common,
which will be discussed in the sections to1 follow.
2.U1 The Overall Gas Transfer Coefficient or Aeration Coefficient
Under steady state conditions of gas transfer operation the coeffi
cient of diffusion D and the time of exposure t may be assumed con
stant, also for the process of formation of interfacial area, yiel
ding a constant gas transfer coefficient k . Furthermore, the size of Li
the interfacial area A and the specific surface area a = A/V may be
taken constant. Thus under steady state conditions of operation a con
stant k may be defined as

37
k2 = 2 -|'vfe- = t - k L = a - k L ^^ (2'56)
where k or k .a is the overall gas transfer coefficient. In accor-2 L
dance vith eq. 2.U3 the rate of gas transfer, expressed as the rate
of concentration change, may then he written as
t = d T = - V ( c s - c ) (g/m3-s) (2-5T)
which integrates with c at t = o to o
c = cs - (cg - co).e~k2-t (2.58)
or
^ - = e - k 2 ' t (2.59) s o
From eq. 2.57 and 2.58 it is seen that the difference between the
saturation concentration and that at t = o (c ) decreases exponential
ly towards zero under steady state conditions of operation.
The overall gas transfer coefficient k can easily be determined ex
perimentally by measuring the change of concentration as a function
of time and by plotting log (c - c)/(c - c ) versus time according
to eq. 2.58:
Cs " C -k t log - — — — = log e 2' = -k .t.log e
s o
= - 0,U3*+3.k2.t (2.60)
In evaluating gas transfer experiments knowledge of the saturation
concentration c under the experimental steady state conditions is
required. Temperature, dissolved substances, pressure (partial pres
sure of the examined gas in air!) are factors which influence c and s
may cause deviations from tabulated values. If c is not estimated s
correctly there will be deviations from the expected straight-line
relationship. Numerical evaluation of k and c under experimental
conditions is facilitated by statistical methods (e.g. 7), being more
powerful than graphical try and error procedures.

38
Example: In an oxygenation experiment the oxygen concentration was
determined in intervals of 120 seconds as stated in the following
table. Determine the overall gas transfer coefficient k .
t(s) 0 120 2U0 360 U80 600 720. 81*0
c(g/m3) 3,8 5,2 6,3 7,2 7,9 8,U 8,8 9,2
e ' V * 1,000 0,791 0,627 0,1+93 0,388 0,313 0,25*+ 0,19!+
Assuming c = 10,5 g 0?/m the third line oT the table (e~ 2' ) is cal
culated by means of eg. 2.59 and plotted in figure 2.8 versus time.
The obtained straight line indicates a correct assumption of c . From
the slope of the line 0,0008^0 (1/s) it follows, that k^ = 0,00193
(1/s). From the data of c in figure 2.8 the influence of the driving
force (c - c) is readily seen: the higher the oxygen (gas) concen
tration the lower is the rate of absorption by transfer.
2.1+2 The Efficiency Coefficient
With some transfer operations, e.g. cascades, weir aeration, it is
difficult or impossible to determine the parameter time t contained
in eq. 2.57 to 2.60. If now a constant time t is assumed for the
aeration step under steady state conditions of operation, a generali
zation of the above formulations is arrived at by the following reaso
ning.
Let c be the gas constant at the inlet of the aerator and c that of o ° e
the effluent. Then, according to equation 2.58
c - c -ko-\ — = e = constant = 1 - K (2.61) c — c s o
From eq. 2.61 the rise (or decrease) in gas concentration (c - c )
may be deducted ,to be
c - c c - c _§ e = 1 +_o e = 1 _ K c- - c c - c s o s o

39
10
9
R
7
S 6 CM
O
3
t 4
O
2
1
n
"H _4^ ^ + 4J 1 i r i v i n g force
c - c 8
f
2 __ -*
1,0 09 0,8 0,7
0,6
0,5
^
IS "°0y4-i
0)
° op S: to o
02
0,1
1190 seconds
0,U3l*3 k2 = 1/1190 k2 = 1.93.10"3
—I 1 i ' ' ' ' ' — *. 320 480 640 800 960 160
time(seconds)
1120
Fig. 2.8 GRAPHICAL REPRESENTATION OF AN OXYGENATION EXPERIMENT
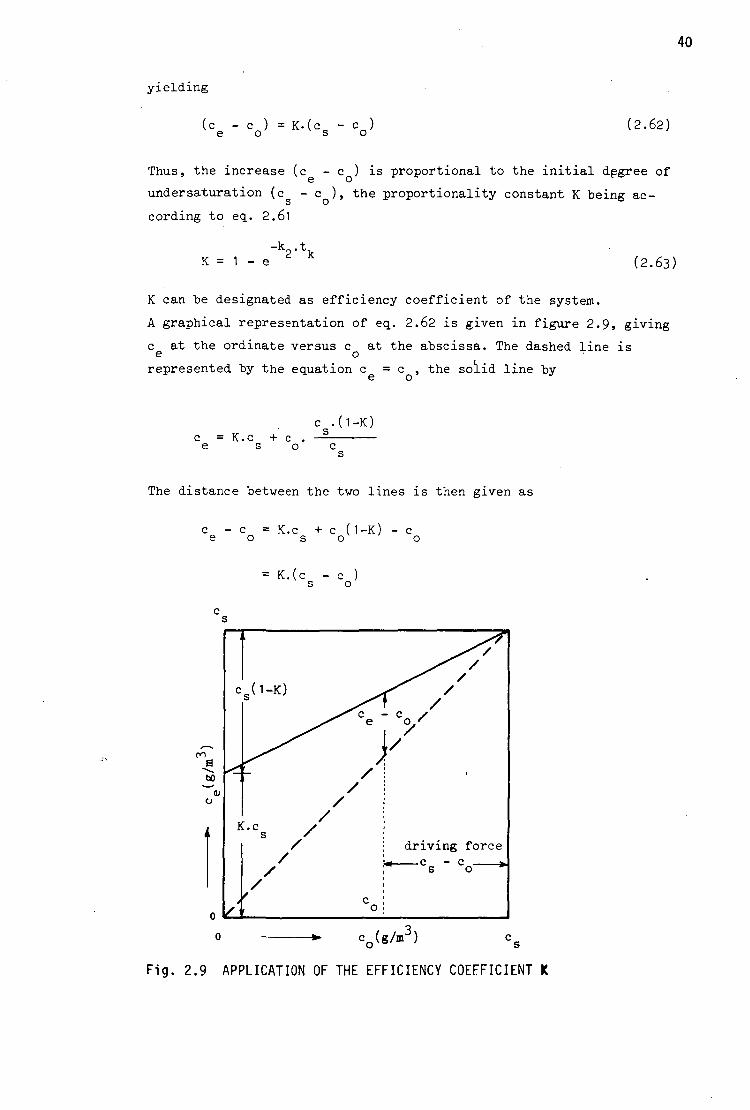
40
yielding
(ce - c o } = K ' ( c s - C o } (2.62)
Thus, the increase (c - c ) is proportional to the initial degree of
undersaturation (c - c ), the proportionality constant K being ac
cording to eq. 2.6l
K = 1 - e -*2-\ (2.63)
K can he designated as efficiency coefficient of the system.
A graphical representation of eq. 2.62 is given in figure 2.9, giving
c at the ordinate versus c at the abscissa. The dashed line is e o
represented by the equation c = c , the solid line by
c .(1-K) c = K.c + c . — e s o c
The distance between the two lines is then given as
c - c = K.c + c (1-K) - c e o s o o
= K.(c - c ) s o
C 8(1-K)
Fig. 2.9 APPLICATION OF THE EFFICIENCY COEFFICIENT K
41
Thus for a given c the increase in gas concentration can easily been
read from the figure. Again this figure clearly shows the great in
fluence of the driving force (c - c ) on the concentration increase. s o
For the case c = 0 the rise in gas concentration vill be c - c = s e o
K.c . Thus K states the fraction of the saturation concentration that s
will be gained when aerating gas-free water.
3 Example: A spray aerator was found to remove 10 g/m of CO at an
initial CO content of 26 g/m . Determine (a) the efficiency coeffi
cient K and (b) the effluent concentration of water containing 3 U1 g CO /m when sprayed under the same hydraulic conditions. Assume
a saturation concentration of c = 1 g CO /m .
a) According to eq. 2.62
K = (c - c )/(c - c ) = -10/(1-26) = 0,H e o s o
b) From eq. 2.62 it follows
c = c + K.(c - c ) = U1 + 0,U.(1-1*1) e o s o
= 1+1 - 16 = 25 g/m3
2.^3 The Oxygenation Capacity
A third common approach to describe the rate of gas transfer is used
in the field of oxygenation of water or of the mixed liquor of acti
vated sludge tanks. Due to the consumption of oxygen by microbial de
gradation of the organic substances present in sewage, aeration does
not lead to an increase of oxygen concentration but rather an equili
brium between the oxygen supply and consumption is established,
leading to a certain oxygen concentration. The oxygenation capacity
of an aeration system is then commonly defined as the rate of oxygen
transfer at
a) a temperature of 10°C; to take into account the influence of
temperature on c , D, t , and A/V;
b) a pressure of 101,3 kPa to take into account the influence
of p on c ; s
c) an oxygen concentration of c = 0, which leads to a driving
force of c . s
Thus the oxygenation capacity oc is defined according to equation
42
2.57 and the cited conditions, as the rate of increase of oxygen
concentration and is expressed by
oc = k . c' (g 0o/m3.s) (2.6U)
d S d
where c' = oxygen saturation concentration in pure water at s
T = 10°C and P = 101,3 kPa, amounting to 11,3 g/m3
Whereas the above definition refers to the possible increase of the
oxygen content of a volume of water of V(m ), the oxygenation capa
city OC (g/s) of an aeration system is gi,ven by the product
OC = V . oc = k . V . c's (g 02/s) (2.65)
The extensive use of this parameter in sewage treatment practice re
quires further detailed consideration.
The oc may be determined after estimating k or after observing the
increase in oxygen concentration from c to c within a time period
from t to t .
According to eq. 2.60 and 2.6U the oc-value is obtained by
oc = k2 . c; = 2,303 • c; . —i— . log ^ ^ (2.66) 2 1 s 2
The two last terms of the right hand side of eq. 2.66 are identical
to 0,U31+3-k and are commonly designated by tg a, tg a hence repre
senting the overall coefficient of gas transfer (k ) on the basis
of logOo) rather than on ln(e) and being defined by
c - c tg a = t _ • log S _ ' = 0,1*3)43 . k
Z2 ^^ Cs °2 2
Frequently, the oc is then defined on the bases of tg a as
oc = 2,303 . c' . tg a = 2,303 . 11,3 . tg a s
= 26,0 . tg a (2.67)

43
It has to be kept in mind, that the saturation value c' refers to
that in pure water at 10°C and 101,3 kPa of pressure, whereas cg in
eq. 2.66 refers to the saturation value under the experimental con
ditions.
The influence of temperature on the oc is commonly accounted for by
the following formule 2.68, which is based on actual experimental da
ta (including all possible influences on k as discussed in section
2.3*0 but which relates these results solely to the temperature in
fluence on the coefficient of diffusion, applying the penetration
theory. Thus the rate of oxygen transfer measured at a temperature
T - expressed by (k_) - can be converted to that at T = 10 C - ex
pressed by U 2 ) 1 0 - 'by
(k 2) 1 Q = (k2)T y ^ (2.68)
The correction factor has been deducted from experimental data as
D1n 0,5.(10°C - T) 5 ^ = 1,038 (2.69)
T = 1,0188 ( 1 0 ° C - T )
Thus the oc-value is finally
oc = 26,0 . tg a ../ ^ (2.T0)
The correction factor / D /D 'is given in table 2.5. A. more compre
hensive discussion of the temperature influence on the oxygenation
capacity is found in (8).
Example: Determine the oxygenation capacity of the example given in
section 2.1*1 under the assumption of an experimental temperature of
15°C
The foregoing example gave (k ) = 2,303 . tg a = 0,00193 (1/s) or
tg a = 0,00193/2,303 = 0,00081+. The correction factor for temperature
is taken from table 2.5 as 0,911. Thus
oc = 26,0 . 0,0008U . 0,911
= 0,0199 g 02/m3.s
=71,6 g 02/m3.h

44
Although the oxygenation capacity is a useful and convenient concept
in sewage treatment, a word of caution against careless application
is necessary. First of all, the definition (eq. 2.6h and 2.65) con
tains the saturation value of oxygen in pure water at 10 C. In sewage
this value is generally lower than 11,3 g/m due to the impurities
contained in the sewage. Furthermore the magnitude of k is decreased
in comparison to pure or tap water, especially by the presence of
hydrophobic substances and surface active agents as discussed in sec
tion 2.3*+. This is commonly taken account of by a factor a, relating
the oc determined in tap water to that in the mixed liquor under
operating conditions:
(oc) . , . . = a . (ocK . (2.71 ) mixed liquor tap water
The magnitude of a depends on the type and concentration of the sur
factant and the dynamics of surface renewal induced by the aerator
(see section 2.3*0 •
In redetermining the oxygenation capacity for temperatures other than
10°C two influences have to be considered: first, the saturation
values in eq. 2.6k decreases with increasing temperature: secondly,
the overall transfer coefficient k? increases. Although the second in
fluence is somewhat greater than the first, temperature has no signi
ficant influence on the oxygenation capacity, as may be seen from the
following example.
Example: Estimate the oxygenation capacity of the foregoing example
at 5°C and 25°C.
Since
0CT = Cs ' T a n d
(k g) T = (k 2) 1 Q / / D
1 0/D T' (compare eq. 268)
it follows that
c i
on = oc . -r . , /Ts , (2.72) T y [ ^

45
From the values given in table 2.3 and 2.5 it is seen that
oc o = 0,0199 • -Jf*! • - ^ ~ Q = 0,0199 • 1,032 = 0,0205 g/m3.s 5 C
oc 25°c
0,0199 • f * ^ • ~ j g = 0,0199 • 0,960 = 0,0191 g/m3.s
From the correction factors it is obvious that the oxygenation capa
city is likely to change by less than 10 % when increasing the tempe
rature from 5°C to 25°C. It has, however, to be taken in mind that
the oc refers to an oxygen content of zero. In practice, a certain
minimum oxygen concentration in the aeration tank has to be main-
tained (e.g. 2 g/m ) giving rise to a temperature dependence of the
driving force (cg - c) and thus of the oxygen transfer capacity.
Maintaining 2 g 02/m3 the transfer capacity at 5°C would be
.-2 12,8-2 oc oc .
B*J = 0,0205 • *z 8 = 0,0205 • 0.8UU = 0,0173 g 02/m3.s
whereas the influence of temperature at 25 C is more pronounced
c pc-2 8,2-2 oc0_o_ .
B > ° = 0,0191 . -K-5- = 0,0191 . 0,756 = 0,0lMt g 0 /m\s 25 0 c s > 2 5 0,d t
Finally, the pressure influences the oxygenation capacity by increa
sing the saturation value with increasing pressure; hence
oc = oc p 101,3 - P.
P - p W (2.73)
w
Again, this influence is of minor importance. A pressure drop of some
3 kPa (22,5 mm Hg) at 10°C (p = 1,23 kPa), for instance, will reduce w
the oc according to eq. 2.73 to (101,3 - 3 - 1,23)/(101,3 - 1,23) =
97 % of its original value.
The relation of the oxygenation capacity to the overall gas transfer
coefficient is obvious from eq. 2.6U. Its relation to the efficiency
coefficient K may be deducted from eq. 2.63 and 2.6U assuming t to
be equal to the detention time T of the water in the areation tank.
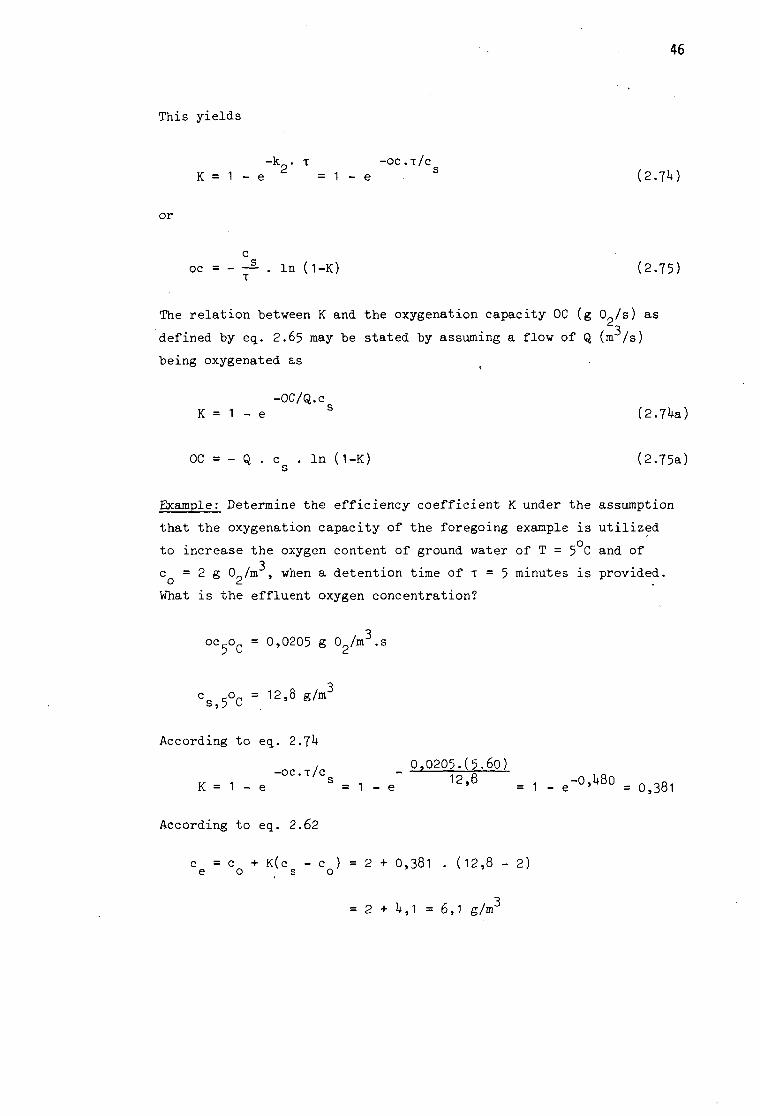
46
This yields
-k . T -OC.T/C
K = 1 - e ^ = 1 - e S (2.7*0
or
c oc = . In (1-K) (2.75)
T
The relation between K and the oxygenation capacity OC (g 0 /s) as '-•3
defined by eq. 2.65 may be stated by assuming a flow of Q (m /s)
being oxygenated as
-OC/Q.c K = 1 - e S (2.7Ua)
OC = - Q . c .In (1-K) (2.75a) s
Example: Determine the efficiency coefficient K under the assumption
that the oxygenation capacity of the foregoing example is utilized
to increase the oxygen content of ground water of T = 5 C and of
c = 2 g 0 /m , when a detention time of T = 5 minutes is provided.
What is the effluent oxygen concentration?
oc oc = 0,0205 g 02/m3.s
Cs,5°C = 12'8 g / m 3
According to eq. 2.7*+
/ 0,0205.(5-60)
K - 1 - e ° S - 1 - e" 12'6 = 1 - e-°» W 0 = 0,381
According to eq. 2.62
c = c +K(c - c ) = 2 + 0,381 . (12,8 - 2) e o s o
= 2 + U,1 =6,1 g/m3

47
2.5 Change of the Gas Phase in Gas Transfer Operations
In the foregoing sections it has tacitly been assumed, that the dri
ving force (c - c) during gas transfer operations is influenced only
by a change in the gas concentration in the liquid phase c. When ab
sorbing, however, a certain gas from air, its concentration in the
air is decreasing during the process of absorption and the saturation
value c = k^ . c is decreasing correspondingly. Hence the driving S D g
force (c - c) is steadily decreasing (a) by an increase of c and (b) by a decrease of c . In stripping operations, c is decreasing and c
g t g
increasing during desorption, giving rise to a decrease of the abso
lute magnitude of the driving force. The magnitude of the change of c and hence c depends on the amount of air supplied for gas transfer, g s To quantitatively describe these effects an input-output balance is
set up. Consider an aerator being fed with Q (m /s) of air with c
3 3 g g° (g/m ) of the gas in question and Q (m /s) of water containing c (g/m ) of the same gas. Assuming no significant change of Q during
g operation (which might be caused by desorption or absorption of gases), the balance is written with c and c as effluent concentrations as
ge e
g go o g ge ^ e
After defining the ratio of air to water flow as RQ = Q /Q, the above g
equation is rearranged as
c — c D n _ e o Ac R Q - - - — r v ~ = ~ ^ (2.76)
ge go g
Hence the negative ratio of the concentration change in the liquid
phase Ac over that in the gaseous phase Ac is equal to the air to g
liquid flow ratio RQ.
Ac and Ac influence the driving force during transfer operation and
hence the rate of gas transfer. These interrelationships depend on the
type of aerator: intermittent (e.g. cascades, plate towers); or com
plete mix conditions (bubble aeration) and moreover on the direction
of air and water flow with respect to each other (co-current, counter-

48
current, cross flow). To quantitatively illustrate these considera
tion, three examples are treated in the following
a) complete mix system of bubble aeration;
b) packed tower (continuous plug flow) with co-current flow of air
and water;
c) packed tower with counter-current flow of air and water.
The preconditions for eq. 2.76 are assumed to apply, which would be
true for dilute systems (low concentration in the liquid phase, low
to moderate solubility of the gas), conditions hence, which are gene
rally met in sanitary engineering gas transfer operations.
a) Complete Mix Bubble Areation:
Assume a reactor of volume V, being fed with Q and Q and providing g
a theoretical detention time for the water flow of T = V/Q. Due to
complete mix conditions the liquid in the reactor has a gas content
of c at any place and the air of c , the respective incoming con-e ge
centrations being c and c . The effluent gas concentration in the o go
air follows from eq. 2.76:
c - c e o
c = c ie go RQ
and the corresponding saturation value in the liquid amounts to c =
1L . c , such that the driving force df = c - c is given by v ge s g
df = k_.c - c .(1 + ) + c . ^ (2.77) D go e RQ o RQ
Under steady state conditions of operation the driving force is con
stant, therefore. The concentration change dc follows from combining
eq. 2.57 and 2.77:
dc = k2 . df . dt (2.78)
The left-hand side of eq. 2.78 is integrated between the limits of c
and c , the right-hand side between zero and t = T to give

49
c + c .(l/k0.T + k_/RQ) _ so o d v /„ 7Q\ ce 1 + (l/k2.T + k^/RQ)
V ,y;
or written in a form similar to eq. 2.62
c — c
sjrt= > • W T • v * = K' <2'80) The left-hand side of eq. 2.80 has previously been referred to as ef
ficiency coefficient K of the system (comp. eq. 2.62). The term k^/RQ
clearly shows the reduction of K by the change of the gas concentra
tion in the gas phase during operation. Also at conditions of
k^/RQ ->• 0 (very low solubility, very great RQ) K. is smaller than pre
dicted by eq. 2.62. This is caused by eq. 2.62 being based on plug
flow conditions, whereas complete mix conditions are assumed in the
derivation K , yielding a smaller average driving force.
b) Packed Tower, Co-Current Flow
Assume a packed tower being co-currently fed at its top with Q and Q, 8
having initial concentrations of c and c of the interesting gas, go o .
respectively. Eq. 2.76 can be applied for any section of the tower,
starting from the top and reaching until some tower depth (smaller
than the total tower obviously. Let c and c be the effluent concen-g
trations of the section under considerations. Assuming plug flow of Q and Q of the same velocity, the relation between c and c is given g g by eq. 2.76 as
cg " <<=go
+ 5t» - 55 , (2'81)
In a graph with c as ordinate and c as abscissa, eq. 2.81 plots as a
straight line, which is referred to as "operating line", indicating
the course of change of c and c through the tower (fig. 2.10). The g
diagram contains' also the "equilibrium line", given by eq. 2.1 as
c = c/k , indicating the saturation concentration c corresponding g u s to any c . c can be obtained by multiplication of eq. 2.81 with k
g s D as
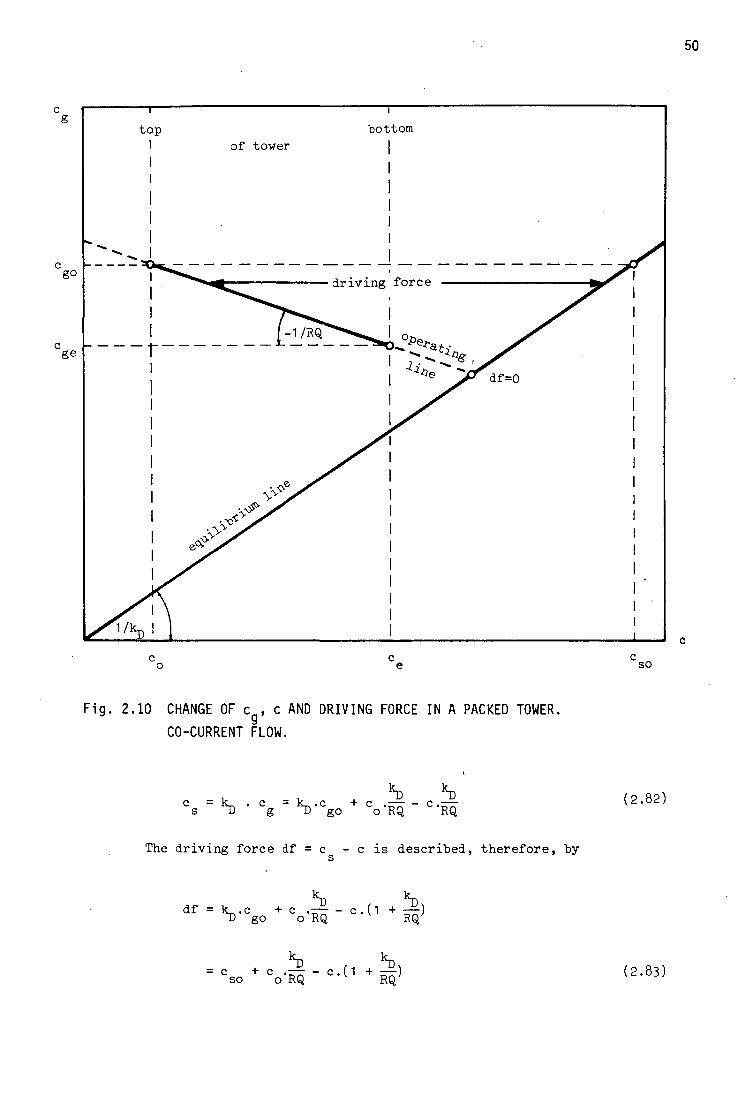
go
ge
top
'/*D
i
•bottom
of tower
• ^ V"
KOV o> ,x>v
df=0
Fig. 2.10 CHANGE OF c . c AND DRIVING FORCE IN A PACKED TOWER.
CO-CURRENT FLOW.
so
c = k_, . c go "o'RQ °"RQ
k^.c + c .^r - c (2.82)
The driving force df = c - c is described, therefore, hy s
df = k .c + c .—• - C.(1 + — ) T> go o RQ v RQ'
= C s o + C o - R Q " C - ( l + R Q } (2.83)

51
with c . being the saturation value under natural conditions (= on so
top of the tower). The rate of concentration change in the liquid
phase dc/dt is given by eq. 2.62 as
dc/dt = k . df
which integrates after inserting eq. 2.83 and solving for the bounda
ry condition t = 0 with c = c to o
1 - exp(- k_.t.(l + k^/RQ)) c = c + (c - c ) . . + \ /RQ (2.8M
o so o 1 + X-Q/RQ
The time t in eq. 2.8U can be related to tower height (starting at top)
by h = t . v, v being the velocity of water and gas flow through the
tower.
c) Packed Tower, Counter-Current Flow
In counter-current operation (water flowing from the tower top to its
bottom, air in the opposite direction) the operating line is defined
by the following two points (see figure 2.11):
at tower top : c = c c = c g ge o
at tower bottom: c = c c = c g go e
The slope of this line amounts to
c - c -2°- Sii = + —- (compare eq. 2.76) c - c RQ e o
Hence the operation line is given by
c . (c _!e} +°_ . (2.85) g v go RQ; RQ
and the corresponding driving force df = IL.C - c amounts to
df - c - c . ^ - C.(1 - % (2.86) so e RQ RQ

so
Fig. 2.11 CHANGE OF c , c AND DRIVING FORCE IN A PACKED TOWER.
COUNTER-CURRENT FLOW.
Integrating dc/dt = k .df under the boundary condition t = 0 with
c = c one gets o
c = co.exp + (cso - c^kp/RQ) 1 - exp
VRQ (2.87:
with ex,p = exp(-k .t.(l - kp/RQ))
Eq. 2.87 describes the relation between the c and time (or tower
height). At the tower bottom, i.e. at c = c , eq. 2.87 states for c e «
after rearranging
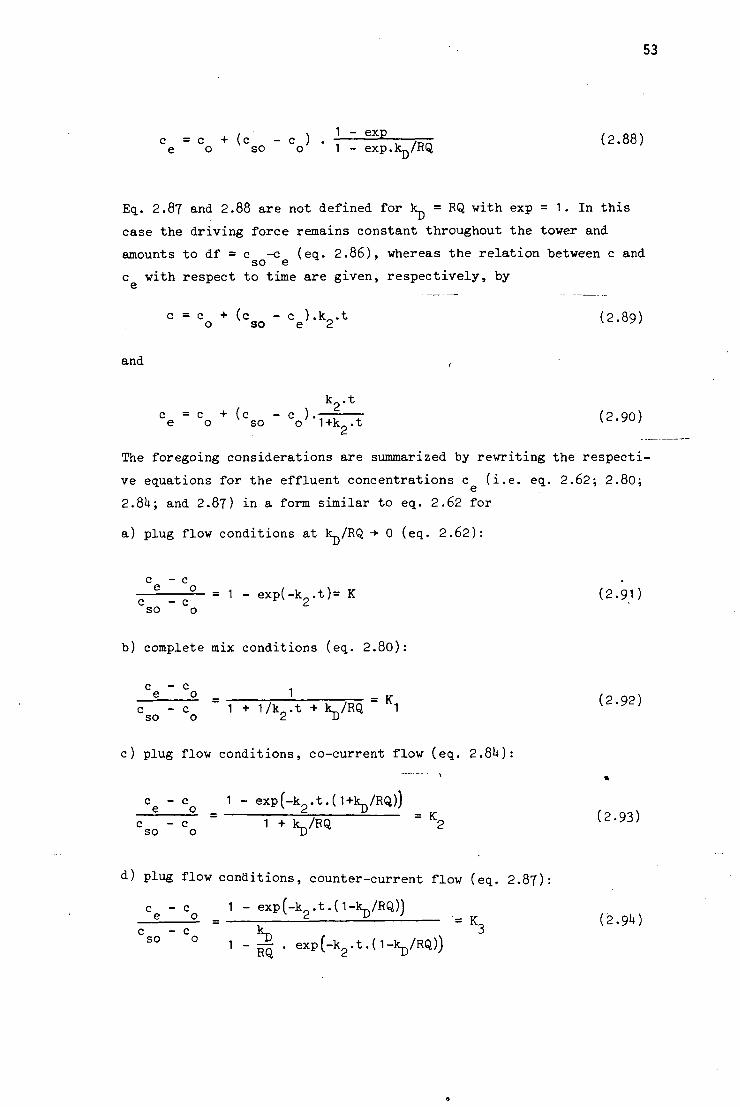
c = c + (c - c ) . ] " e x p . /Bn (2.88) e o so o 1 - exp.k_/RQ
Eq. 2.87 and 2.88 are not defined for l c = RQ with exp = 1. In this
case the driving force remains constant throughout the tower and
amounts to df = c -c (eq. 2.86), whereas the relation between c and so e
c with respect to time are given, respectively, by
C = C o + (cso - Ce)'K2't <2-89)
and
k2.t c = c + (c - c ) . — ; r (2.90) e o so o 1+k .t v^-^uy
The foregoing considerations are summarized by rewriting the respecti
ve equations for the effluent concentrations c (i.e. eq. 2.62; 2.80;
2.8U; and 2.87) in a form similar to eq. 2.62 for
a) plug flow conditions at k^/RQ -*• 0 (eq. 2.62):
c - c 6 ° = 1 - exp(-k0.t)= K (2.9D c - c • ~'r* "2 so
b) complete mix conditions (eq. 2.80):
c — c
c) plug flow conditions, co-current flow (eq. 2.8H):
c - c 1 - exp(-k_.t.(l+k_/RQ))
tt .*•>, ^ - ^ d) plug flow conditions, counter-current flow (eq. 2.87):
c - c 1 - exp(-k_.t.(l-k_/RQ)) — £ 2. = I—2. 2 1 = K (2.9U) c - c le, 3 SO O , L> ( , . / .
1 - RQ • exPl-k2-t.(l-

54
The left-hand sides of the above equations state the fraction of the
initial degree of over- or undersaturation that has been de- or ab
sorbed during the transfer operation. It has previously been designated
as efficiency coefficient K of the system (eq. 2.62). K , K_, and K
hence, state the efficiency coefficient of the respective systems (b)
through (c), i.e. under different conditions of flow taking the change
of the gas phase during transfer into consideration.
Two factors, obviously, determine the above efficiency coefficients
- the product k .t and
- the ratio k^/RQ, i.e. the solubility of the gas (lO and air to water
flow ratio (RQ).
The properties of the functions 2.92 through 2.9** are such that
- with increasing ratio k^/RQ - i.e. with increasing solubility of
the gas and/or with decreasing ratio RQ - the efficiency coefficients
decrease (and vice versa)
- the rate of these changes is comparetively high at great magnitude
of kp.t and correspondingly low at small k . t-values. Hence the
magnitude of k^/RQ is of particular significance at great k -values
and/or long aeration times .
These properties are illustrated by the following
Example: Estimate the efficiency coefficients (c - c )/(c - c ) for c e o so o
a complete mix aeration system (K ), for a co-currently
operated tower (K?), and for a counter currently operated
tower (K ), all providing a k -value of k = 2.10 (1/s)
with aeration times of (a) t = 80,5 s and (b) t = 25,5 s
(K amounts to 0,8 and 0,U, respectively) and being operated
at RQ-values of 10; 1; 0,1; 0,01; 0,001; and zero.
Express the computed efficiency coefficients also as a per
centage of K = 1-e 2* #
The efficiency coefficients K , K , and K are computed by
means of eq. 2.92, 2.93, and 2.9^, respectively. The results
are summarized in figure 2.12 and in the following table,
which also contains the required percentages. Fig. 2.12 clear
ly shows the previously discussed properties of the respec
tive functions.

0,8
0,7 •-
0,6
0,5
Q,h
0,3
0,2
0,1
0,001 0,003
kD/RQ
Fig. 2.12 INFLUENCE OF THE RATIO kp/RQ ON THE EFFICIENCY COEFFICIENT
AT DIFFERENT OPERATIONAL CONDITIONS.

56
RQ
10
1
0,1
0,01
0,001
0
K1
K=0,8 K=0,U
0,086 0,077
10,8 19,3
0,381 0,253
1+7,9 63 ,2
0,581 0,327
72 ,6 81 ,8
0 ,613 0,337
76 ,6 8U,2
0,616 0,338
77 .0 8U,5
0,617 0,338
77 .1 8l»,5
K2
K2/K(JK)
K=0,8 K=0,U
0,091 0,091
11,U 22 ,6
0,U80 0,320
60 ,0 80 ,0
0,75*+ 0,391
9*+,3 97,7
0,795 0,399
99,i* 99 ,8
0,7995 0,3999
99 ,9 99 ,98
0,800 o.Uoo
100 100
K3
K3/K(*)
K=0,8 K=0,l+
0,100 0,099
12,5 2U,8
0,617 0,338
77,1 8i+,5
0,783 0,393
97 ,9 9 8 , 3
0,798 0,399
99 ,8 99 ,8
0,7998 0,3999
99,98 99,98
0,800 0,1+00
100 100
57
From the foregoing considerations and example the following conclusi
ons may be drawn. For gases of different solubility having the same
coefficient of diffusion D, i.e. having under the same conditions of
A/V and t also the same overall transfer coefficient k^, the extent c d
of gas exchange will be the same when applying the equal ratios k^/RQ.
To prevent a significant change of the gas concentration in the gas
phase which would reduce the transfer rate and hence call for long
transfer times, the ratio 1 ,/RQ should be well below one and approach
zero. For carbon dioxide and oxygen, for instance, the coefficients
of diffusion are almost the same but the solubility differs signifi
cantly. The ratio of the respective k^-values varies within the tempe
rature range of 0°C < T < 30°C from 35 to 25. Hence the air to water
flow ratio RQ for removal of carbon dioxide should be 25 to 35 times
that for oxygenation, provided the same extent of transfer (c - c )/
(c - c ) is required, so o
The second conclusion concerns the most efficient means of increasing
the rate and extent of gas transfer: transfer time t (or k .t) or
RQ. Sparingly soluble gases (small k_) show at low RQ-values already
small ratios k_/RQ. An increase of RQ is very ineffective in increas
ing the rate and extent of gas transfer. Increase of k and/or aera
tion time t are the only means, therefore, to promote gas transfer
of slightly soluble gases and low air to water flow ratios RQ can be
applied economically. With more soluble gases, the air to water flow
ratio RQ becomes the most significant parameter determining the rate
and extent of gas transfer. As previously stated, this is especially
the case great at magnitude of k *t, i.e. at long aeration times.
Obviously, an economic optimum for a preset extent of gas exchange (c - c )/c - c ) can be found, when unit costs for providing aera-e o so o
tion time (size of reactor) and air flow are known.
3 Example: Groundwater with a carbon dioxide content of 61 g/m and an 3
oxygen content of 1 g/m is aerated by means of a co-current-
ly operated packed tower to achieve a CO -content of
13 g CO /m . Estimate different combinations of packing
height h and air to water flow ratio RQ to obtain this re
sult and the corresponding oxygen content of the effluent.

58
Assume a k -value of the packing independent of RQ of k = —2
2.10 (1/s) for both gases. The saturation concentration c _ so
and the distribution coefficient lr are for CO 1 g/m and
1,2 and for oxygen 11 g/m and 0,0U, respectively. The hy-3 2
draulic load of the tower amounts to v = 0,025 m /m .s. r
From the above information the required efficiency coeffi
cient K is computed for CO
K2 = (13-61 )/(l-6D = 0,{
For estimating h-RQ-combinations, eq. 2.93 is rearranged to
give
t = ln(l-K2(l + 1^/RQ))
k2 . (1 + kjj/RQ)
_2 and with k„ = 2.10 and h = t . v_
2 F
+ _ ln(0,2 - o,8.1,2/RQ) " 0,02(1 + 1,2/RQ)
h = 0,025 . t
The above equations are evaluated for various RQ-values,
starting from the lowest possible to obtain K = 0,8, fol
lowing from the condition
0,2 - 0,8.1 ,2/RQ >_ 0
RQ >_ 1*,8
The results are given in the following table

59
RQ
M 5 10
20
50
100
00
t
oo
19U.7
101,0
88,7
83,5
81,9
80,5
h
00
M7 2,53
2,22
2,09
2,05
2,01
g 02/m3
11,00
10,72
9,65
9,29
9,11
9,05
9', 00
The corresponding oxygen concentrations, also contained in
the above table, are estimated by means of eq. 2.8U
C = 1 + M 1 1 ) 1 " e x p f - 2 . 1 0 ' 2 . t ( l + 0,0h/Rq)) C 1 + l 1 1 " 1 ' ' 1 + 0.0U/RQ
Note the important parameter time for the extent of gas ex
change of the sparingly soluble gas oxygen: with decreasing
the aeration time (or the packing height) the effluent oxygen
concentration decreases, whereas the effluent CO -content is 3 . ^
13 g/m for all given combinations!
In the foregoing considerations and examples a constant value of k
has been assumed. At large air to water flow ratios, however, a
greater interfacial area per unit volume (A/V) is created, such that
an increase of k with increasing RQ has to be expected.
Obviously, highly soluble gases can optimally be exchanged only with
aerators providing large RQ-values at low energy input, i.e. basical
ly aerators which disperse water into air (e.g. spray aeration,
packed towers), whereas gases of low solubility are transfered most
expediently by dispersing air into water at low RQ-ratios (e.g. bubble
aeration). These facts may sometimes be applied when deciding upon the
aeration equipment. If, for instance a raw water is in the carbonate
equilibrium but is deficient in oxygen, some type of bubble aeration
(deep well, ventury aerator, air diffusors) are more appropriate than

60
spray aeration. The former types will increase the oxygen concentra
tion but not significantly change the CO content, thus preserving
the carbonate equilibrium.
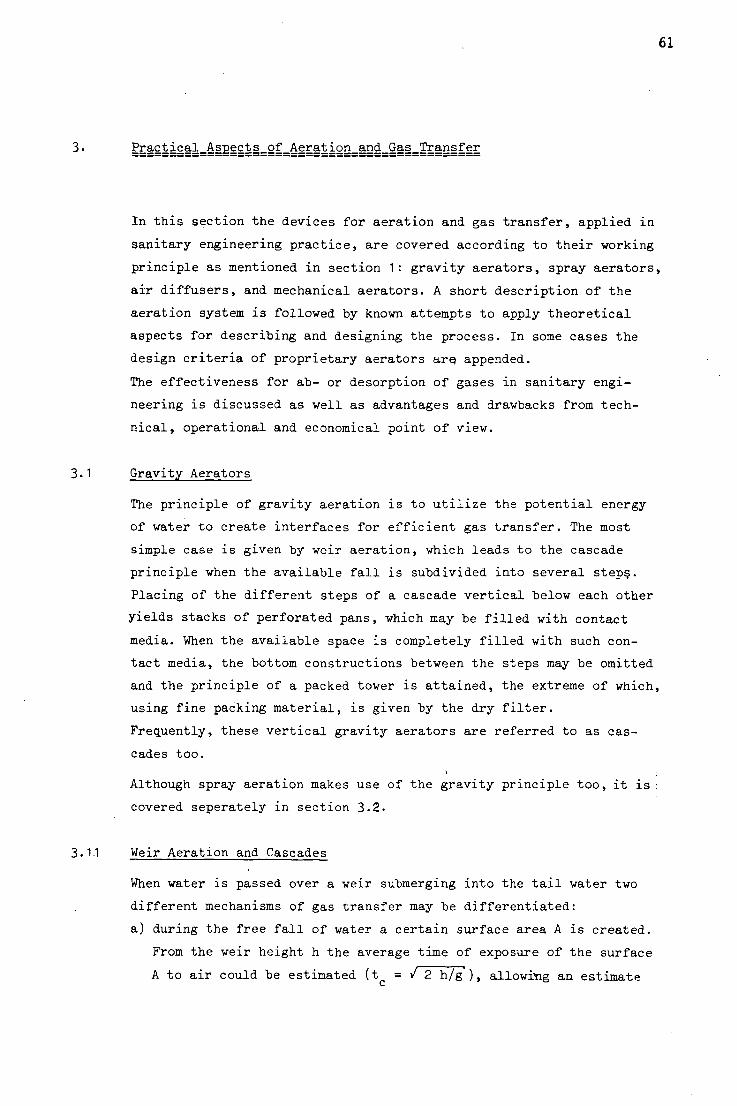
Practical_Aspects_of_Aeration_and_Gas_Transfer
In this section the devices for aeration and gas transfer, applied in
sanitary engineering practice, are covered according to their working
principle as mentioned in section 1: gravity aerators, spray aerators,
air diffusers, and mechanical aerators. A short description of the
aeration system is followed by known attempts to apply theoretical
aspects for describing and designing the process. In some cases the
design criteria of proprietary aerators arq appended.
The effectiveness for ab- or desorption of gases in sanitary engi
neering is discussed as well as advantages and drawbacks from tech
nical, operational and economical point of view.
Gravity Aerators
The principle of gravity aeration is to utilize the potential energy
of water to create interfaces for efficient gas transfer. The most
simple case is given by weir aeration, which leads to the cascade
principle when the available fall is subdivided into several step§.
Placing of the different steps of a cascade vertical below each other
yields stacks of perforated pans, which may be filled with contact
media. When the available space is completely filled with such con
tact media, the bottom constructions between the steps may be omitted
and the principle of a packed tower is attained, the extreme of which,
using fine packing material, is given by the dry filter.
Frequently, these vertical gravity aerators are referred to as cas
cades too.
Although spray aeration makes use of the gravity principle too, it is •
covered seperately in section 3.2.
Weir Aeration and Cascades
When water is passed over a weir submerging into the tail water two
different mechanisms of gas transfer may be differentiated:
a) during the free fall of water a certain surface area A is created.
From the weir height h the average time of exposure of the surface
A to air could be estimated (t = / 2 h/g'), allowing an estimate
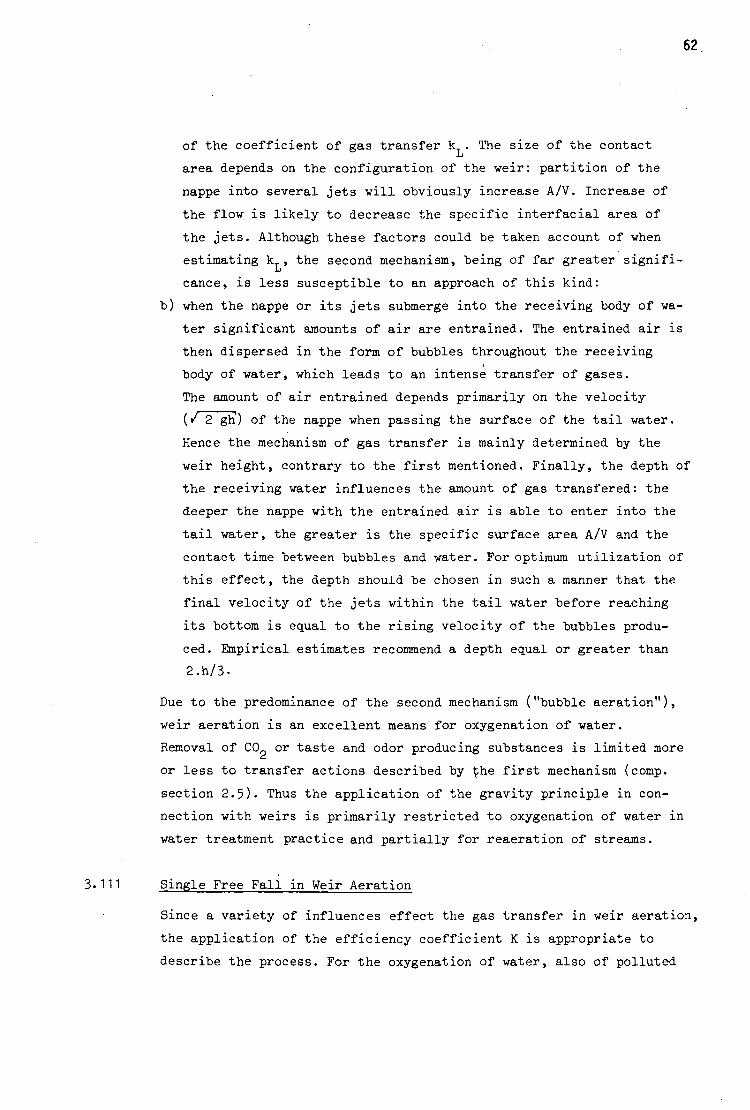
62
of the coefficient of gas transfer k . The size of the contact
area depends on the configuration of the weir: partition of the
nappe into several jets will obviously increase A/V. Increase of
the flow is likely to decrease the specific interfacial area of
the jets. Although these factors could be taken account of when
estimating k , the second mechanism, being of far greater signifi-L
cance, is less susceptible to an approach of this kind:
b) when the nappe or its jets submerge into the receiving body of wa
ter significant amounts of air are entrained. The entrained air is
then dispersed in the form of bubbles throughout the receiving
body of water, which leads to an intense transfer of gases.
The amount of air entrained depends primarily on the velocity
(/ 2 gti) of the nappe when passing the surface of the tail water.
Hence the mechanism of gas transfer is mainly determined by the
weir height, contrary to the first mentioned. Finally, the depth of
the receiving water influences the amount of gas transfered: the
deeper the nappe with the entrained air is able to enter into the
tail water, the greater is the specific surface area A/V and the
contact time between bubbles and water. For optimum utilization of
this effect, the depth should be chosen in such a manner that the
final velocity of the jets within the tail water before reaching
its bottom is equal to the rising velocity of the bubbles produ
ced. Empirical estimates recommend a depth equal or greater than
2.h/3.
Due to the predominance of the second mechanism ("bubble aeration"),
weir aeration is an excellent means for oxygenation of water.
Removal of CO or taste and odor producing substances is limited more
or less to transfer actions described by ^he first mechanism (comp.
section 2.5). Thus the application of the gravity principle in con
nection with weirs is primarily restricted to oxygenation of water in
water treatment practice and partially for reaeration of streams.
3.111 Single Free Fall in Weir Aeration
Since a variety of influences effect the gas transfer in weir aeration,
the application of the efficiency coefficient K is appropriate to
describe the process. For the oxygenation of water, also of polluted

63
water, the following formula has been advanced (9), relating K to the
parameters weir height (of a straight weir) and temperature ( C) for
unpolluted water K = 0,1+5 0 + 0.0U6.T) . h
polluted water K = 0,36 (1 + 0,0l+6.T) . h
sewage K = 0,29 (1 + 0,0*+6.T) . h
(3-D
Other investigations confirmed this linear relationship between K and
h (10), but gave a smaller proportionality constant of about 0,U,
being almost independent of temperature and of flow variations bet--3 ? -3 3
ween 6,5.10 m /m.s and 26,0.10 m /m.s. Partitioning of the nappe
by rectangular notches into at least h jets per meter weir length in
creased the proportionality constant up tof0,6H for heights below
0,70 m. Above this height the influence of h on K is less pronounced
(fig. 3.1).
0.5 1,0 1,5
*• height of weir (m)
Fig. 3.1 EFFICIENCY COEFFICIENT IN DEPENDENCE OF THE HEIGHT OF FALL OVER WEIRS
Example: Raw water with 2 g 0 /m and a temperature of 10 C is passed
over a straight weir of a height of 0,65 m. Estimate the down stream
oxygen content.
According to eg. 3.1
K = 0,U5.(1 + 0,0U6.10).0,65 = 0,U2T
3 Application of eq. 2.62 yields with c =11,3 g/m
c = c + K.(c - c ) = 2,0 + 0,1+27.(11,3-2,0) = 6 g/m3 e o s o

64
The oxygenation efficiency OE in terms of mg 0 absorbed per Joule at 3
zero oxygen content may be computed for a flow of Q (m /s) passing
over the weir from
a) the amount of oxygen transferred per unit time which is according to eq. 2.62 at c = 0 equal to Q.K.c and
* o s
b) the power Q.h.p.g exerted by the flow when passing over the weir
height h as
Q.K.c .103 mg 0 0E = Q.h.p!g ( — J (3.2a)
Hence, with p = 1000 kg/m3,
1 K.c mg 0 OE = 9 ^ o T - i r 1 ( - r ^ } ( 3-2»
Thus the oxygenation efficiency of a weir, applying K/h-values in the
range of 0,k to 0,7, is expected to be in the order of 0,U to 0,7
mg 02/J (1,5 to 2,5 kg 02/kWh).
3.112 Step Weirs or Conventional Cascades
Frequently the available head difference of a weir is subdivided in
to several steps, expecting an increase of the amount of gases trans
ferred.
For desorption of CO this increase is accomplished, because each
step of a cascade leads to the formation of new interfacial area,
promoting the desorption efficiency.
Since the rate of oxygenation is primarily determined by the velocity
of the nappe or its jets when submerging into the tail water, subdi
vision into several steps is likely to decrease the rate of oxygen
transfer. Inspection of fig. 3.1, however, shows, that due to the
modest increase of K for weir heights above 0,70 m, subdivision of
only a great head difference into several steps of 0,60 to 0,70 m
will have an positive effect on the rate of oxygenation.
A mathematical analysis of the oxygen transfer by cascades may be ba
sed on eq. 2.62, assuming the height of the weir being subdivided in
to n equal steps, each having an efficiency coefficient of K = K/n.
Then the effluent concentration of the first step c may be based on
that of the influent c : o

65
C = C . ( 1 - K ) + K . C 1 . o n n s
and for the following steps
c . = C . . ( 1 - K ) + K .c 2 1 n n s
= c . (1-K ) 2 + K .(1-K )c + K .c o n n n s n s
c . = C 0 . ( 1 - K ) + K .c 3 2 n n s
= c . (1-K ) 3 + K . (1-K ) 2 . c + K . (1-K ) . c + K .c o n n n s n n s n s
c = c . (1-K ) n + K .c . [ l + (1-K ) + (1-K ) 2 + . . . + (1-K ) ( n - l ) | n o n n s | _ n n " J
c = c . (1-K ) n + K .c . GS n o n n s
GS is a geometrical series the sum of which is
1 _ d_ K ) n 1 - (1-K ) n
ra n _ n b b " ! _ (1_K ) - K
n n
Hence, after inserting this expression into the above equation and-
rearranging
n C = C - ( C - C ) . ( 1 - - ) t? o) n s s o n \J-3)
K n Since the factor (1 - —) increases with increasing n, reaching —K e as n approaches infinity, it 'becomes evident that subdivision of
a weir is reducing the final oxygen content c ", as long as K is pro
portional to the weir height as has teen assumed "by setting K = K/n.
Example: Determine the number of steps of a cascade to achieve maxi
mum oxygenation, assuming an available head of 1,5 n, an efficiency
coefficient K depending on the weir height h as stated by figure 3.1, 3 3 c = 1 0 g/nr and c = 2 g/nr s o
a) one step:
h =1,50 K.cs = 7,0 K = 7,0/10 = 0,7
K/n =0,7
c. = c - (c - c ).0,3 = 0,7-c + 0,3.c = 7,6 g/m I S S O S O

66
b) two steps:
h = 0,75 per step K.c = 5,0 K = 5,0/10 = 0,5
K/n = 0,5
°2 = C s • " (cs " c 0)-(1-°>5) 2 = 0,T5.cs + 0,25.C Q = 8,0 g/m3
c) three steps:
h = 0,50 m per step K.c = 3,5 K = 3,5/10 = 0,35
K/n = 0,35
c = c - (c - c ).(l-0,35)3 = 0,726-c + 0,27U.c = 7,8 g/m3 3 s s o s o
d) further subdivision will further decrease c . For step heights n 3 below 0,6 m fig. 3.1 states K.c = 7,0.h or with c = 1 0 g/m and s s
n steps: K/n = 0,7.h/n = 0,7-1,50/n = 1,05/n. Thus further subdi-
vision would theoretically (n •+ °°) lead to
c = c - (c - c ) . e~1'05 = 0,65'C + 0,35-c = 7,2 g/m3 00 S S O S O
Although 2 steps show the greatest final oxygen concentration, the
influence of subdivision on c is of little significance and economic n
considerations would finally determine the choice in this case.
A special construction of the convential cascade is to arrange the
steps vertically below each other (fig. 3.2). The water then has to
\v///y//'/•//•'/ v'//////s<-/////s/' \
Fig. 3.2 CASCADE CONSISTING OF SLOTTED TROUGHS ARRANGED ONE BELOW' EACH OTHER
be drawn from the bottom of the slotted troughs instead of being
passed over a weir. The mechanisms of gas transfer, however, are the
same as mentioned for weir aeration. Fig. 3-3 shows results of oxygen

67
Fig. 3.3 C02 AND 0 2 TRANSFER OF A TROUGH CASCADE
absorption and CO -desorption, applying troughs of 0,10 m width and of
0,20 m height with slots 0,013 m wide at a hydraulic loading of 3, . . ,3
0,02 m /m.s. Assuming a saturation value for oxygen of 10 g/m and 3
for CO of 1 g/m the K-values of the first step may he computed from
*= 0,306
. 3.3 fo r
C02 :
°2 :
c - c 3 5 - 5 0 it - e °
c - c 1-50 s o
K • ithii - o-«6
This again shows the minor efficiency of cascades in removing CO as
compared to absorption of oxygen.
Summarizing it may be stated that weirs and conventional cascades are
an efficient means for oxygenating water in the course of water treat
ment, the efficiency coefficient K ranging from 0,^ to 0,7 per meter
weir height, the oxygenation efficiency from 0,U to 0,7 mg 0 /J (1,5 —3 —3 ^
to 2,5 kg 0 /kWh). Variation of flow between 5-10 and 25.10 nr/m.s is of neglegible influence on K.
Subdivision into steps of a height of less than 0,6 m will decrease
the oxygenation efficiency but promote desorption of CO and odor and
taste producing volatile substances. Nevertheless, step heights of
0,20 to 0,U0 m are quite common. Cascades require little space with-
in the process of water treatment (approximately 50 to 200 m per m /a
treatment capacity) and neglegible maintenance.

68
3.12 Stacks of Perforated Pans or Tower Cascades
The construction of tower cascades aims at renewing the interfacial
area between the liquid and the gaseous phase as frequently as possi
ble in order
a) to produce a large specific surface area A/V and a frequent rene
wal of it;
b) to allow an intense exchange of the gaseous phase, i.e. large ra
tios of air to water flow RQ. Thus tower cascades are primarily
intended to desorb gases from water of low to moderate solubility
as discussed in section 2.5 (e.g. CO , NH , H S, and many taste
and odor producing volatile substances).
The most simple construction are stacks of perforated pans, which may
be placed in open air or housed (fig. 3-*0. To create large A/V-ratios
ventilation^
E
open stack with perforated bottoms
Fig. 3.4 STACK OF PERFORATED PANS
also within the pans, they may be filled with contact media like coke,
stone, ceramic or plastic rings or balls. The distance between the
trays may vary from 0,30 to 0,1+5 m, the size of the contact media
from 0,025 to 0,15 m. Although contact media of smaller size would
increase the specific surface area A/V and the frequency of surface
renewal, they are to be avoided because they easily lead to clogging
(e.g. by precipitation of iron or impurities) and furthermore impair
the exchange of the gaseous phase by ventilation.
Finally the whole tower may be filled with contact media, omitting
seperate trays. This includes, in principle, designs as

69
- towers filled with crosswise arranged plastic tubes of a diameter
of 0,025 to 0,05 m (fig. 3-5), preferably applied for desorption
of carbon dioxide;
- towers filled with red wood, hemlock or plastic bars, used for
stripping of ammonia from treated sewage;
- closed tanks filled with ceramic or plastic tube pieces (Raschig
rings) of 0,001 to 0,05 m of size or coarse sand, used for desorb-
tion of CO or absorption of ozone for the oxidation of organic
impurities in the course of water treatment and of purification of
water in swimming pools;
- this design approaches the concept of dry filtration (fig. 3.6).
\ / ; / / 7 / / / / /f=z / / / / /\
Fig. 3.5 TOWER CASCADE FILLED WITH PLASTIC TUBES
withdrawal of air
—water
Fig. 3.6 SCHEMATIC REPRESENTATION OF A DRY FILTER
Mention should be made, that the selection of contact media is fre
quently done with regard to iron removal. Iron precipitants on the
surface of the filling is catalytically promoting the removal effi
ciency, the discussion of which is beyond the scope of aeration.
Gas transfer by means of tower cascades requires ventilation, which
may be accomplished by natural means, also with housed towers, or may
be artificially induced. The draft may be in the same direction as
the water flow, counter-current or vertical to the water flow (cross
flow).
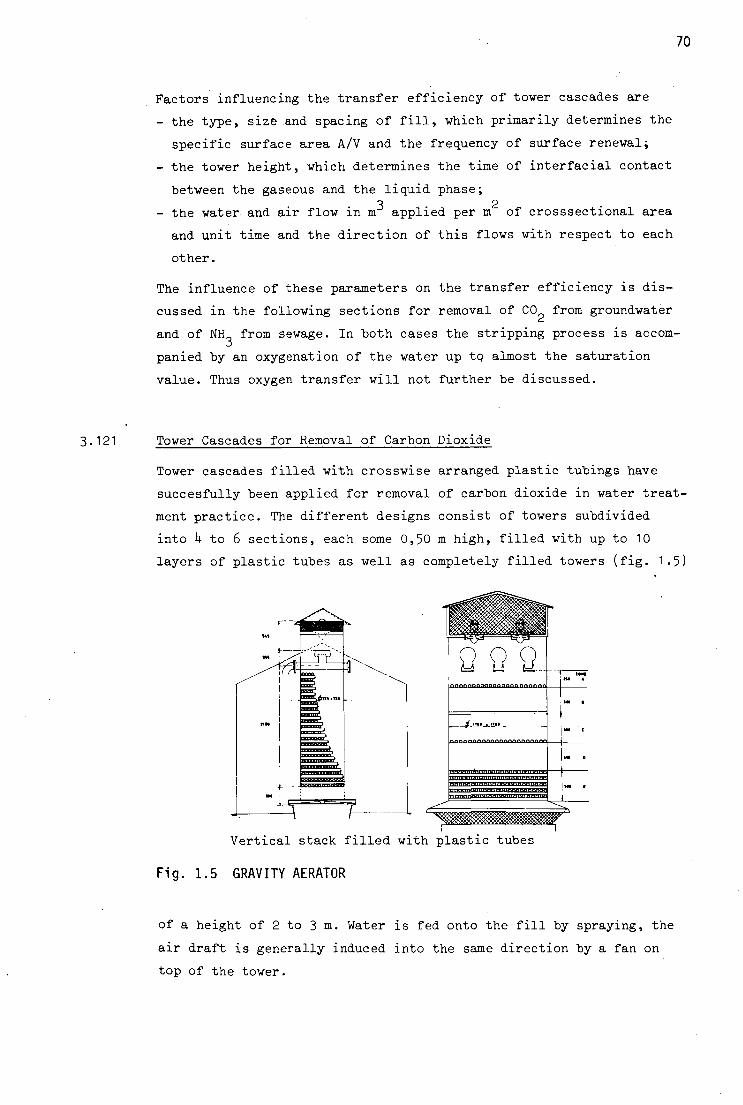
70
Factors influencing the transfer efficiency of tower cascades are
- the type, size and spacing of fill, which primarily determines the
specific surface area A/V and the frequency of surface renewal;
- the tower height, which determines the time of interfacial contact
between the gaseous and the liquid phase; 3 2
- the water and air flow in m applied per m of crosssectional area
and unit time and the direction of this flows with respect to each
other.
The influence of these parameters on the transfer efficiency is dis
cussed in the following sections for removal of CO from groundwater
and of NH_ from sewage. In both cases the stripping process is accom
panied by an oxygenation of the water up tq almost the saturation
value. Thus oxygen transfer will not further be discussed.
3.121 Tower Cascades for Removal of Carbon Dioxide
Tower cascades filled with crosswise arranged plastic tubings have
succesfully been applied for removal of carbon dioxide in water treat
ment practice. The different designs consist of towers subdivided
into k to 6 sections, each some 0,50 m high, filled with up to 10
layers of plastic tubes as well as completely filled towers (fig. 1.5)
Vertical stack filled with plastic tubes
Fig. 1.5 GRAVITY AERATOR
of a height of 2 to 3m. Water is fed onto the fill by spraying, the
air draft is generally induced into the same direction by a fan on
top of the tower.

71
The influence of some of the design and operational characterstics on
the percentage carton dioxide removal
c - c R = - 2 £ (3.10
c o
usually taken as parameter to describe the removal efficiency, is
discussed in the following.
Size and spacing of fill: variations of the tube diameter from
0,0125 to 0,025 m and of the horizontal clear distance between the
tubes from 0,003 to 0,025 m does not affect the removal efficiency
R significantly. Hence the most economical design are tubes of a
diameter of 0,025 with slot widths of the same magnitude of 0,025 m-
Subdivision of the tower into several sections of approximately
0,50 m, each section being filled with 10 layers of tubes (height of
packing 0,25 m, equal to half the height of the section), will gene
rally give excellent removal results.
3 Hydraulic load: the hydraulic load of tower cascades in m applied 2 . •
per m cross-sectional area per unit time ranges from about 0,01 to
0,07 m/s. The influence of the hydraulic load on the removal efficien
cy R is seen from fig. 3.8, giving the results of two Dutch water
works (Engelse Werk and Denekamp). Increase of the hydraulic load
above 0,01 m/s (36 m/h) decreases R signifiaantly from about 90 % to
lower values between 75 and 80 % at loadings above 0,0^ m/s (150 m/h).
Air to water flow ratio: the decrease of removal efficiency going
along with an increase of the hydraulic load, as mentioned above, is
0,1 1 1 1 1 1
to
~E 0 ,075 >-
at O
r-l
.2 o>05
iH 3 cd U
i? 0,025
90 85 80 75 70
•*• percentage removal
Fig. 3.8 EFFECT OF THE HYDRAULIC LOAD ON THE PERCENTAGE REMOVAL OF CARBON DIOXIDE

caused not only "by the decreasing A/V-ratio within the tower cascade.
Besides this effect, the increased load causes the resistance for the
induced air draft to increase, yielding less ventilation. Thus the air
to water flow ratio RQ generally decreases more than proportional to
the increase of the hydraulic load at a constant head of the fans
applied for ventilation. The accompanied increase of the CO content
of the gas phase reduces the driving force (c - c ) and thus the o s
efficiency.
Fig. 3-9 clearly shows this effect, stating the percentage removal
efficiency R at 3 different hydraulic loads and various air to water
flow ratios as measured at the tower cascade Denekamp.
At the highest hydraulic load (0,050 m/s) an air to water flow ratio
of RQ = 1+2 could be obtained, giving R = 80 %, whereas the same fan
led to RQ = 190 at a hydraulic load of 0,015 m/s, yielding 90 % remo
val efficiency.
Based on figure 3.9> the most economical air to water flow ratio de
creases from about 60 to 20 with increasing flow rates as commonly
applied (0,01 to 0,07 m/s). Within this ranges removal efficiencies
are to be expected increasing from about 75 to 90 % with decreasing
hydraulic load.
hydraulic load:
0,015 m/s
0,026 ra/s
0,050 m/s
100 90 80 70
*- percentage removal
Fig. 3.9 EFFECT OF HYDRAULIC LOAD ON AIR TO WATER FLOW RATIO AND PERCENTAGE REMOVAL OF CARBON DIOXIDE

73
These efficiencies could be increased by reversing the direction of
the air flow, i.e. by applying the counter-current principle. This,
however, would require more powerful and hence more expensive venti
lators, since counter-current air flow causes much higher a resis-
tance» Fans can be used counter-currently until uneconomical
hydraulic loads of some 0,015 m/s only. To nevertheless overcome a
significant increase of the carbon dioxide content in the gaseous
phase, ventilation may be applied in two stages, one stage serving
the upper half, the second stage the lower half of the tower cascade
(fig. 3.10). In this case, the spray action between the two stages
will considerably assist the carbon dioxide removal.
air
air
air
— water
Fig. 3.10 TWO-STAGED CASCADE
Although there is at present not sufficient information on the inter
action of the forementioned influences available to enable a rational
design of tower cascades, theoretical aspects may be useful in inter
preting experimental results and in comparing the efficiency of minor
variations of design. This is illustrated by the following example.

74
Example: Estimate the removal efficiency of a tower cascade with a
hydraulic load of 0,0H m/s and an air to water flow ratio of 15,
assuming an efficiency coefficient K of the sprayers feeding the
cascade of 0,3 and of 0,35 for each section of 0,50 m height (consis
ting of 10 layers of plastic tubes of 0,025 m and a clear distance
of 0,025 m) fed with groundwater with 60 g/m of carbon dioxide when
a) k section are built into a single stage
b) 2 stages are designed, each consisting of two sections, with
seperate ventilation.
Assume a saturation value under natural conditions of c = 1 g CO /m .
Determine the CO -content of the effluent air also.
For determining the effluent concentration eq. 2.8U is applied. The
basic parameters to be applied are ^/RQ = 1,2/15 = 0,08 and k .t,
which can be obtained from the given K-values by means of eq. 2.63".
for spraying k .t = -ln(1-0,3) = 0,357
for one tube section k .t = -ln(1-0,35) = 0,U31
Obviously, the k .t-values of several sections are additive. Hence
k .t for the total tower amounts to 0,357+U.0,U31 = 2,081 , which would -2 081
correspond to a K-value of K = 1-e ' = 0,875- For the two stages
k .t is 0,357+2.0,1+31 = 1,219 (K = 0,70*0.
Application of eq. 2.8U for the total tower then gives
ce = 60 + (1-60) . 1 - e xPf^08l(i + 0 ?08))
= 60 - 59-0,828 = 6o - 1+8,9
=11,1 g C02/m3
and a removal efficiency of
R = 6 0 -Q11'1 = 81,5 %
For the two staged tower the effluent concentration of the first stage
amounts to

75
% . 6 0 + (1.60) 1-»pf-l,219(U0,08))
= 60 - 59.0,678 = 60 - U0,0 = 20,0 g/m3
and for second stage
c = 20,0 + (1-20,0).0,678 = 20,0 - 12,9 e
=7,1 g C02/m3
giving a removal efficiency of
R = 6o
6- T> 1 =88,2 %
The effluent CO -content of the air is estimated "by means of eg. 2.81
with c = c / k = 1/1,2 = 0,8 g/m3. go so T> For the total tower we get
to which a saturation concentration of
c = K • c„o = 1 > 2 - U ' 1 = k>9 s/m3 s T) ge
would correspond. The first stage of the two staged tower has a c of ge
the second stage of
cge = 0>8 + 2° V ? 1 = LT g/m3
3.122 Packed Towers for Ammonia Stripping
Stripping of ammonia from sewage, generally from hiologically treated
sewage, requires a pH-adjustment to convert the NH,-ion to the vola
tile NH -molecule, as was pointed out in section 2.11. The protolysis
constant of this reaction depends strongly on temperature (figure
3.11). Hence pH and temperature determine the percentage fraction of

76
the sum of NH,-N and NH -N, that can "be removed from sewage by aera
tion. The total ammonia nitrogen content in sewage ranges from 25 to o 3
1+5 g/m . Effluent concentration of 1 to 2 g/m are aimed at in order
to prevent eutrophication of receiving waters as far as possible.
Hence percentage removal efficiencies in the order of magnitude of
90 to 98 % should possibly be accomplished, requiring almost complete
conversion of NH, to NH , i.e. pH-values in the range of 10,8 to 11,5
by means of lime addition. Nevertheless, the efficiency of ammonia
stripping will significantly decrease with decreasing temperature,
firstly because the conversion gets more and more incomplete (fig.
3.11), secondly because the rate of diffusion and of renewal of the
interfacial area between air and water decreases, thirdly, because
the saturation value increases giving rise of a reduction of the dri
ving force. This can partially be compensated by applying high air to
water flow ratios and low hydraulic surface loads as compared to
removal of carbon dioxide.
However, application of high RQ-values is likely to decrease the tem
perature of the sewage, thus decreasing the efficiency of the process
again.
100
80
60
n
40
20
0
1
1° /o r 1
T r
0
20
40
60
80
pw
Fig. 3.11 EFFECTS OF pH AND TEMPERATURE ON THE DISTRIBUTION OF AMMONIA AND AMMONIUM ION IN WATER
The influence of some significant design and operational criteria is
discussed in the following, based on completely filled towers (no
subdivision into sections), counter current or cross-flow ventilation
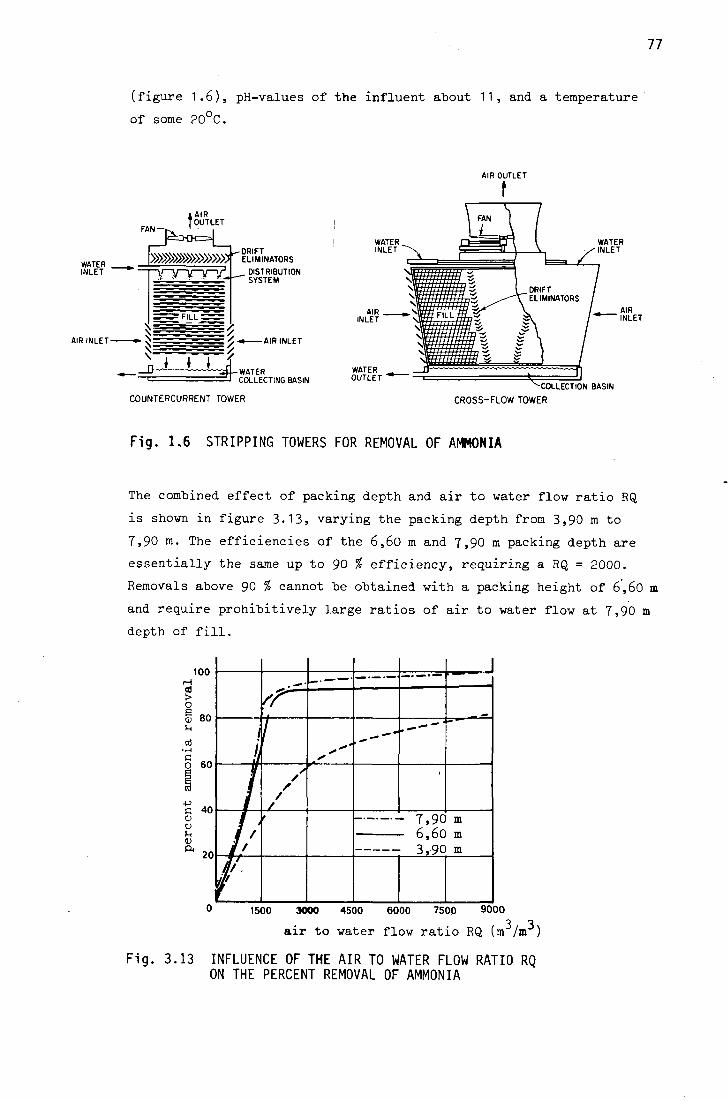
77
(figure 1.6), pH-values of the influent about 11, and a temperature
of some 20 C.
FAN
l A I R J OUTLET
AIR INLET »• \
DRIFT ELIMINATORS
DISTRIBUTION SYSTEM
-AIR INLET
_o-J—L±^iW A T E R — COLLECTING BASIN
COUNTERCURRENT TOWER
-COLLECTION BASIN
CROSS-FLOW TOWER
Fig. 1.6 STRIPPING TOWERS FOR REMOVAL OF AMMONIA
The combined effect of packing depth and air to water flow ratio RQ
is shown in figure 3.13, varying the packing depth from 3,90 m to
7,90 m. The efficiencies of the 6,60 m and 7,90 m packing depth are
essentially the same up to 90 % efficiency, requiring a RQ = 2000.
Removals above 90 % cannot be obtained with a packing height of 6,60 m
and require prohibitively large ratios of air to water flow at 7,90 m
depth of fill.
100 H a) > o <C 80 u
O 60
-P c O
0)
40
20
/
/ , i /
It a/
Jll
rr 1
/ /
/ /
'
.
^ m
_
" ***
- 7,90 m
3,90 m
1500 3000 4500 6000 7500 9000
3 3 air to water flow ratio RQ (m /m )
Fig. 3.13 INFLUENCE OF THE AIR TO WATER FLOW RATIO RQ ON THE PERCENT REMOVAL OF AMMONIA
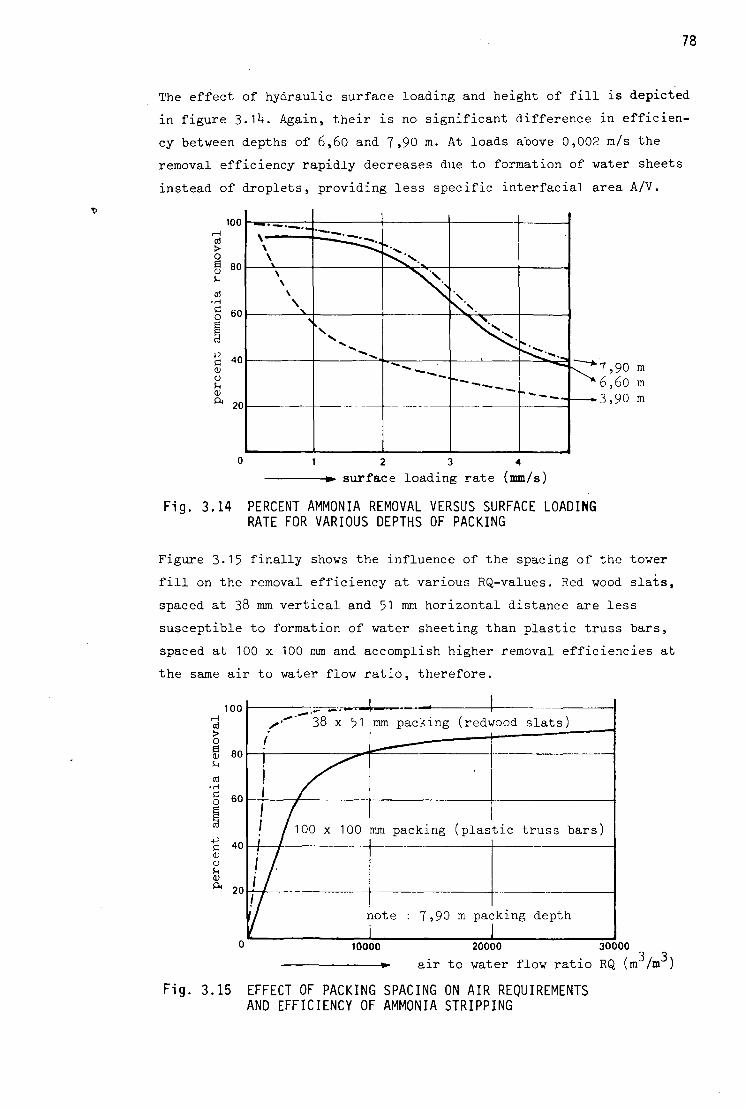
78
The effect of hydraulic surface loading and height of fill is depicted
in figure 3.1U. Again, their is no significant difference in efficien
cy between depths of 6,60 and 7,90 m. At loads above 0,002 m/s the
removal efficiency rapidly decreases due to formation of water sheets
instead of droplets, providing less specific interfacial area A/V.
100 m
a > o § 80 U
cd
G O 60
C 40 <L) O U <D ft 20
\ \
\ \ \ \
>
^ ^ ^ ^ •"
NX
' • « « ^ ^
s
"""- - - « .
7,90 m 6,60 m 3,90 m
2 3 4
surface loading rate (mm/s)
Fig. 3.14 PERCENT AMMONIA REMOVAL VERSUS SURFACE LOADING RATE FOR VARIOUS DEPTHS OF PACKING
Figure 3.15 finally shows the influence of the spacing of the tower
fill on the removal efficiency at various RQ-values. Red wood slats,
spaced at 38 mm vertical and 51 mm horizontal distance are less
susceptible to formation of water sheeting than plastic truss bars,
spaced at 100 x 100 mm and accomplish higher removal efficiencies at
the same air to water flow ratio, therefore.
10000 20000 30000 3 3
ir to water flow ratio RQ (m /m )
Fig. 3.15 EFFECT OF PACKING SPACING ON AIR REQUIREMENTS AND EFFICIENCY OF AMMONIA STRIPPING

79
Combining the discussed effects, the following operational criteria
must be met to achieve percentage removals between 80 and 98 percent
with a red wood slat fill spaced at 38 x 51 nun. The recommendations
hold for a pH-value about 11 and a temperature of 20 C.
Percent
ammonia-N
removal
80
85
90
95
98
6,60 m
hydraulic
load (mm/s)
2,5
2,2
1.7
-
-
packing
RQ
U3/m3)
1700
1800
2100
*
-
7,90 m
hydraulic
load (mm/s)
2,7
2,k
2,0
1,U
0,5
packing
RQ
(m3/m3)
1500
1600
1900
3000
6000
Decrease of temperature will substantially lower the given removal
efficiencies. At winter conditions the above range has to be expected
to decrease to 50 to 60 %. At temperatures below 0°C the removal effi
ciency is further reduced to some 30 %. Furthermore, freezing is
likely to occur, which requires termination of operation. By rever
sing the draft fan, a slight ice build up on the outside of the tower
may be removed by action of the escaping air, being warmed up by the
sewage.
A second operational problem reducing the removal efficiency is scale
formation on the packing due to precipitation of calcium carbonate.
The scale may be soft and washed out by normal operation, or some
what harder, such that hosing is required for removal, or extremely
hard, such that cleansing is accomplished only by application of
dilute acid in combination with organic dispersants. The chemical or
physical factors accounting for the hardness of the scale and for the
amount formed are not known at this time.

Spray Aeration
Spray aeration is applied in the course of water treatment for ab
sorption of oxygen and/or desorption of carbon dioxide.
Spray aeration achieves the transfer of these gases by distributing
water into air in the form of small droplets by means of orifices or
nozzles mounted on a stationary pipe system. The orifices and nozzles
may be constructed and arranged to discharge the water vertically or
at an angle in upward or downward direction. The water is collected
by an apron, collecting tank or a contact bed.
Nozzles have been depicted in fig. 1.7; some other types are given
in figure 3 -16:
a) the Amsterdam nozzle: two jets of water impinge at an angle
of 90 C and are dispersed;
b) the Marley and Binks nozzle: by means of a tangential inlet
in the head of the nozzle a revolving flow of the water is
obtained, resulting in a fine uniform spray distribution;
Amsterdam nozzle Marley nozzle Binks nozzle
Fig. 3.16 NOZZLE TYPES
c) Talford nozzle: by means of inclined channels a rotating
movement of the water is achieved, which leaves the nozzle
by an opening being controlled by an adjustable cone;
d) Patterson nozzle: the water is discharged through two slots
in the shape of a snail-shell, facing each other at 180 ;

81
y |
'*//
V
!
? .• ,< ,- A
; depth
a. spindle-holder b. plastic tube of 37 mm ID c. spindle d. plastic flow deflector
Talford nozzle Patterson nozzle Dresden nozzle
Fig. 3.16 NOZZLE TYPES
e) Dresden nozzle (only for downwards spraying): the water
flowing out of a plastic tube strikes a disc (plastic flow
deflector), and is spread to assume the shape of an umbrella,
eventually disintergrating into droplets.
Generally, the efficiency of gas transfer is increased by applying
small openings of the nozzles, producing fine droplets with a large
specific interfacial area A/V and by applying a high nozzle head,
giving rise to long contact times between water and air. Small nozzle
openings, however, are likely to clogg. Hence, depending on the
nozzle construction, openings (d ) between 5 and 37 mm are in use,
discharging at water heads h (m) between 5»0 and 0,5 m, respectively.
The discharge Q from n nozzles, each having an opening area of
A = ird A . 10 (m ), may be obtained from the initial spray velocity
v = C . /2.gh, C being the velocity coefficient, generally close
to 0,95:
Q = C\ . n . A./2.gh' (m3/s) d (3.5)
The coefficient of discharge C, is the product of C and the coeffi
cient of contraction C , thus C = C c' d v
C . The coefficient of dis-c
charge, of velocity and contraction vary with the shape and other
characteristics of the nozzle.

82
The time of exposure t of an upward spray at an angle of a between
the initial velocity vector and the horizontal may be estimated by
t = 2 . C c v sin a /2h/g' (3.6)
which ranges for initial heads between 1 and 3 m and angles between
1*5 and 90 from 0,6 to 2,6 seconds for C = 0,95- Application of eq. -9 2 ^
2.M with D = 1,8.10 m /s shows the gas transfer coefficient to -U , -k
vary but between the limits of 0,3.10 <K<0,6.10 m/s. L
The radius of the spray circle r , neglecting wind effects amounts to
r = 2 s
sin 2a (3.7)
and extends under the above assumptions uptto 5»^0 m- To prevent
interference of sprayers, which would lead to a decrease of the
efficiency by coalescence of droplets, the sprayers should be spaced
at a distance of approximately 2.r . Thus, nozzles spacing generally
varies from 0,50 to 5 m, requiring large areas to be allocated to 2 3
upward spray aeration, ranging from 350 to 700 m per m/s treatment
capacity. Furthermore, the energy consumption is quite high as in
dicated by the oxygenation efficiency OE, ranging from 0,11+ to 0,33
mg 02/J (0,5 to 1,2 kg 02/kWh).
In connection with the large space requirement spray aeration is most
ly performed in open air, providing good ventilation. Thus, the CO -
content of the gaseous phase is not significantly increased when
removing carbon dioxide. Hence the efficiency for desorption of CO
is expected to be almost equal to that for absorption of oxygen.
If spray aerators are housed (e.g. to prevent freezing or contamina
tion) proper Ventilation has to be provided by means of blinds
(fig. 3.17), possibly by an induced draft.
ventilation
spent air
Fig. 3.17 HOUSED SPRAY AERATION

83
Finally, oxygenation by means of spray aeration may be performed in
pressurized tanks, when the water is planned to remain under pressure
in the course of treatment (fig. 3.18). The saturation concentration
and hence the driving force and the rate of oxygen transfer is in
creased proportional to the pressure thereby, obviously.
In the following sections two types of sprayers are discussed some
what more quantitatively.
•*- • — ^ - raw water
ventilation valve,
air discharge T
'''it SM
' / / l i I \ *N
/ ; M M \ 55 ^ compressed air
treated water
Fig. 3.18 SPRAY AERATION IN PRESSURE VESSEL
3.21 The Dresden Nozzle
The flow rate discharged by a Dresden nozzle depends on the internal
diameter of the plastic tube (19 mm, 25 mm, or 37 mm), the applied
head and the distance between the flow deflector and the end of the
tube, being adjustable from about 0,02 to 0,03 m (see figure 3.16).
Depending on the rate of flow, the discharged film of water extends
to some 0,25 to 0,30 m below the deflector and then disintegrates
into droplets due to gravity. During this passage an intense gas
exchange takes place, the rate of which decreases with increasing depth
of fall due the, driving force declining as a result of gas exchange.
Thus, with increasing depths of fall diminishing increases are to be
expected. As an illustration of this effect, fig, 3.19 states the
efficiency coefficient K for desorption of CO by means of a 37 mm -3 3
Dresden nozzle, discharging 0,8.10 m /s at a head of h = 0,35 m,
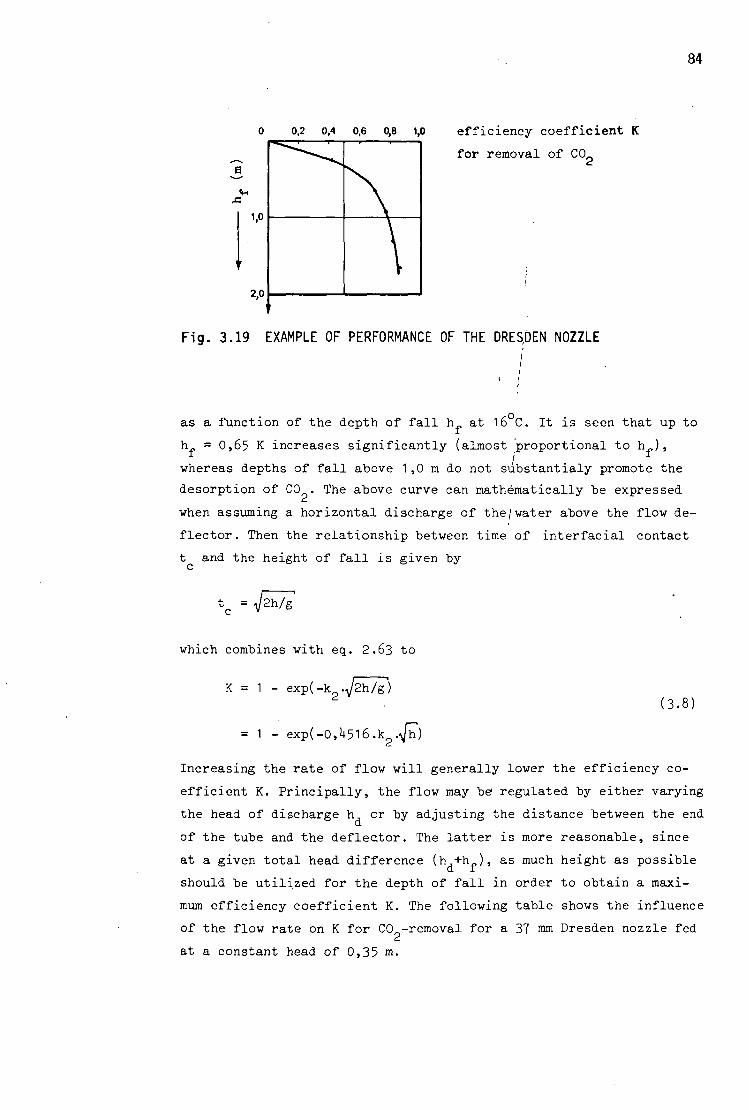
84
0,2 0,4 0,6 0,8 1,0 efficiency coefficient K
for removal of C0„
Fig. 3.19 EXAMPLE OF PERFORMANCE OF THE DRES.DEN NOZZLE
as a function of the depth of fall h at 16 C. It is seen that up to
h = 0,65 K increases significantly (almost proportional to h ),
whereas depths of fall above 1,0 m do not substantialy promote the
desorption of CO . The above curve can mathematically be expressed
when assuming a horizontal discharge of the/water above the flow de
flector. Then the relationship between time of interfacial contact
t and the height of fall is given by
= Jsh/g'
which combines with eq. 2.63 to
exp(-k2.^2h/g)
= 1 - exp(-0,H5l6.k ./h")
K = 1 (3.8)
Increasing the rate of flow will generally lower the efficiency co
efficient K. Principally, the flow may be" regulated by either varying
the head of discharge h or by adjusting the distance between the end
of the tube and the deflector. The latter is more reasonable, since
at a given total head difference (h +h ), as much height as possible
should be utilized for the depth of fall in order to obtain a maxi
mum efficiency coefficient K. The following table shows the influence
of the flow rate on K for CO -removal for a 37 mm Dresden nozzle fed
at a constant head of 0,35 m-

85
Influence of Flow Rate and Depth of Fall on the
Efficiency Coefficient K for Removal of CO at 16°C.
Flow rate
10"3 m3/s
0,80
1,03
1,33
1,61
Depth below flow deflector
0,65 m
0,70
0,65
0,61
0,62
0,95 m
0,77
0,76
0,65
0,70
1,30 m
0,82
0,80
0,75
0,73
1 ,65 m
0,86
0,83
0,76
0,7^
It is seen from these K-values, that increase of flow rate gradually
decreases the efficiency of removal for all depths of fall.
Finally the following table proves, that desorption of CO and absorp
tion of oxygen are almost equally efficient in spray aeration with
the Dresden nozzle. The data for K refer to a 37 mm nozzle at
0,8.10"3 m3/s.
Comparison of Efficiency for
CO -Removal and 0 -Uptake at 16°C.
Efficiency
coefficient
K (C02)
K (02)
K (02)/K (C02)
Depth below flow deflector
0,65 ro
0,70
0,75
1,07
0,95 m
0,77
0,78
1,01
1 ,30 m
0,82
0,83
1 ,01
The slightly greater coefficients for oxygen uptake as indicated by
the ratio K(02)/K(C0p) may be attributed to the difference of the
diffusion coefficients of both gases, the square root of the ratio of
the respective coefficient being /D(0) ?/D(C0 ) = 1,035-
The oxygenation•efficiency 0E may be obtained from eq. 3-3 and the
total loss of head h,+h ,. For small heads of discharge (< 0,50 m) and d f
depths of fall between 0,65 and 1,50 m 0E will range from 0,7 to 0,U
mg 0 /J (2,5 to 1,5 kg 0 /kWh), respectively.

86
3.22 The Amsterdam Nozzle
The performance of the Amsterdam nozzle (fig. 3.16) with respect to
C0o-removal in dependence of the applied head and the diameter of the
nozzle opening is illustrated in the following table, containing also
Amsterdam nozzle
the discharge capacity at the applied heads. The performance is expres
sed as percentage removal efficiency R (compare eq. 3.*0, which,
however, comes close to the efficiency coefficient, when c is very
small as compared to c (eq. 2.62):
K = c c s s
— R = c - c o e (3.9)
Efficiency Coefficient K for
CO^-Removal by the Amsterdam
Head
in m
1,75
2,75
3,75
nozzle diameter 6 mm
Q
10"3 m3/s
0,31
0,39
0,U6
R
76,5
81,5
82,0
Nozzle
nozzle diameter 7 mm
Q
10~3 m3/s
0,U2
0,53
0,61
R
{%)
7H,0
85,0
79,5
nozzle diameter 8 mm
Q
10~3 m3/s
0,55
0,69
0,80
R
75,5
76,0
79,0
It is seen that increase of the applied head and decrease of the
opening diameter slightly increases the removal efficiency.
A comparison of these results with those for the Dresden nozzle,
shows the latter to he more effective. This advantage holds also for
87
the oxygenation efficiency OE which may be approximated from the
above data to range under the cited hydraulic conditions to vary from
0,22 to 0,hk mg 0 /J (0,8 to 1,60 kg 0 /kWh). This result is obtained,
when assuming that the given R-values for COp-removal are close to
the K-values for oxygen absorption.
Example: Determine the effluent carbon dioxide and oxygen content of 3 3
a water with 60 g CO /m and 2 g 0 /m being aerated by
a) Dresden nozzles of 37 mm opening
b) Amsterdam nozzles of 8 mm opening
when a total head of 1,75 m is applied.
Assume <
- a water temperature of 16 C
- an increase of the CO -concentration in the air, applied for 3 ventilation, to give a saturation value of 3 g C0p/m
- the efficiency coefficients K to be equal for absorption of oxygen
and desorption of C0?.
a) Applying a head of discharge of 0,35 m, the depth of fall is
1,75 - 0,35 = 1,^0 m. From fig. 3.19 the efficiency coefficient is
obtained as K(C0 ) = 0,8U for a depth of fall of 1,U0, the dis--3 3 charge being 0,8 . 10 m /s per nozzle.
Hence for
C0_ c = c + K(C0.).(c - c ) 2 e o 2 s o
= 60 + 0,81+. (3-60) = 12 g C02/m3
0 c = c + K(0 ).(c - c ) d e o d s o
= 2 + 0.8U.(9,8-2) = 8,6 g 02/m3
b) The removal efficiency of the Amsterdam nozzle at h, = 1,75 m o
amounts to some R = 75»5 %• Thus with c = 60 g/m the effluent o
concentration is C02 cg = 60(1-0,755) = 1U,7 g C02/m
3
from which the efficiency coefficient is obtained as
K = (c - c )/(c - c ) = (lU,7-60)/(3-60) = 0,79 e o s o

88
Applying this value to the transfer of oxygen the effluent oxygen
concentration will be
°2 Ce = °o + K- ( cs "
C o ) = 2'° + 0'T9.(9,8-2) = 8,2 g 02/m3
Summarizing, it may be stated, that depending on the operational con
ditions (type of nozzle, head of discharge, flow per nozzle) the effi
ciency of spray aeration in terms of the efficiency coefficient ranges
from 0,50 to 0,85. Removal of CO and uptake of oxygen are equally
efficient. The percentage gas transfer efficiency R for CO -removal,
however, is much more influenced by temperature changes than that for
oxygen uptake (see section 2.5)
Since spray aeration requires much area, its sole application is
generally restricted to small treatment works.
^f4 1L° efficiency coefficient K
for removal of C0„
<*2 0,4
Fig. 3.19 EXAMPLE OF PERFORMANCE OF THE DRESDEN NOZZLE

89
3.3 Bubble Aeration or Air Diffusion
3.31 General Considerations
The transfer of gas by means of air diffusion is accomplished by
injecting compressed air through orifices of various size into the
water contained in an "aeration tank". Gas transfer occurs as the
bubble emerges from the orifice, as the bubble rises through the
liquid (section 2.33) and as it bursts at the surface, shedding an
oxygen saturated film into the surface layers. Additional aeration
occurs by velocity gradients at the surface induced by the turbulence
of the rising bubbles. To all three mechanisms of gas transfer dif
ferent coefficients of gas transfer may be assigned. Generally
however, the share of the surface effects is small and almost neglegi-
ble in comparison to the effects of bubble formation and rise.
Inspection of eq. 2.53 and 2.56 then shows, that the prime parameters
affecting the rate of gas transfer are the bubble size (d ) as
correlated with the rising velocity (v ) relativ to the liquid (see
also figure 2.5). Both factors determine the coefficient of gas
transfer k. (eq. 2.53) and the specific surface area A/V.
t . ( s )
3.10"
- 10"
3.»"
10"
J3
u <u
<w 10 d a) u
•p
to a) hO
U o -p d
i) o o
0,3 1 2 3 4 5 10 30 KM 3Q0
»- diameter of air bubbles d^ (nm)
Fig. 2.5 RISING VELOCITY OF AIR BUBBLES IN WATER AND THE COEFFICIENT OF GAS
TRANSFER AND TIME OF EXPOSURE ACCORDING TO THE PENETRATION THEORY

90
The bubble size is related to the orifice diameter and the rate of
air flow. At low air rates, the bubble volume is proportional to the
orifice diameter and the surface tension and inversely proportional
to the liquid density. The bubble size results from a balance of the
boyant forces separating the bubble from the orifice and the shearing
forces required to overcome the surface tension across the orifice.
In this case the bubble size is independent of the air rate and the
frequency of bubble release is proportional to the air rate..
At high air rates, the bubble diameter increases as a function of the
air rate, the frequency of release remaining constant.
Within the intermediate range, generally uncountered in practice,
bubble size and frequency of release depend on the air rate. The mean
bubble diameter then is a exponential function of the air rate Q :
dB = kB . <£ (3.10)
where k is related to the orifice diameter and the air discharge B
velocity through the orifice.
Bubble size d^ and velocity v , together with the immersion depth of
the diffuser d. and the air rate Q determine the total interfacial i g
area A. Assuming spherical bubbles, the total surface area produced
per unit time (A ) is obtained by dividing the air rate Q by the
bubble volume (d_ -5.ir/6) and multiplication with the bubble surface (A 2v . . ^ Udg ), giving
d .ir 6.Q
\'**'S (m/s) ^ 11\ X g. dB
3.rr/6 dB (3'11)
The detention time of the bubbles within the liquid t may be B
estimated as (
t„ = d./v (3.12a) B l r
for stagnant water and as
t' = d./(v '+ v ) (3.12b) B I r w
when the water has an upward velocity, induced by the rising bubbles
of v . w

91
Hence the total surface area A present at any time will be
A = A+ . t = — J i (3'13a)
t 3 &„ . v B r
6.Q . d. A' =A . t' = - — f — - K (3.13b)
or
* B " VVV and after combination with eq. 3.10
6.Q(l"n).d. A = v . k, X O.lUa)
r B or '
6.Q(l"n).d. A' = - H 5 1 T (3-lUb)
B r wy
Thus the rate of gas transfer will increase with decreasing bubble
size and increasing depth of immersion and air rate, primarily by
increasing the total surface area A by two mechanisms: firstly a
greater surface per unit air volume injected is produced (eq. 3-11)
and secondly, the detention time t is increased by smaller bubbles
having a smaller rising velocity (fig. 2.5).
Besides the discussed parameters bubble size, air rate and depth of
immersion the following factors will effect the rate of gas transfer
by air diffusion:
- size and shape of the aeration tank
- arrangement of diffusers within the aeration tank
- air rate per diffuser unit, or for a given rate of air flow Q the S
number of diffuser units applied.
The size and shape of the aeration tank a,nd the arrangement of dif
fuses -primarily determine the pattern of flow of the water within the tank and hence v . Examples are given in fig. 3-20. The figures indi-w
cate that depending on the above factors a circulatory motion of water
of diffirent extent and intensity is induced due to the air-water
mixture near the diffusers being of less specific density than the bulk
of the tank content.

92
Fig. 3.20 ARRANGEMENT OF DIFFUSERS WITHIN AN AERATION TANK AND THE CORRESPONDING PATTERN OF FLOW
Above the diffusers, the rising velocity of the liquid and of the
bubbles with respect to the liquid add, the vertical vectorial sum
of both determining the detention time of the bubble within the liquid.
This obviously decreases the total interfacial area A (compare eq.
3.13). On the other hand, some of the bubbles will be transported,
downwards on the tank side opposite to the diffusers, increasing
the air liquid interface again. Generally the decreasing effect of
the circulatory motion on A/V is more significant. Hence arrangements
of diffusers which induce small, locally confined rotations (fig.
3.20a) are more efficient for gas transfer than systems, affecting
a general circulation of the total tank content (spiral flow).
Principally, an arrangement of the diffusers is likely to be most
efficient which produces the smallest average streaming velocity of
the water vw. v
The last mentioned factor influencing the rate of gas transfer, the
air rate per diffuser unit, is seen from eq. 3-10. Since a diffuser
unit provides a certain total orifice area, the air rate per unit
should be as low as possible in order to produce small bubbles of
greater transfer efficiency. The lowest air rate that may practical
ly be applied is determined by the air pressure required for all
orifices of the diffuser units to release bubbles. Obviously, this
depends on the structure and hence on the commercial type of diffuser
applied.

93
Although numerous factors, partially not numerically expressible , influence
the rate of gas transfer by bubble aeration, the aeration coefficient (and oc)
can be related to the important process variables. Assuming a fairly constant^
coefficient of gas transfer k_ (comp. section 2.33) and inserting eq. 3.11* b
into the basic equation k = le -A'/V we get
,0-n) (3.15a)
and
k 2
w i t h
oc
6 ' k L
eq . 2 .
- 0/
V
r
6k
• c ' s •
V
+ '
«<
V
r
V
w
1-n
+
d. l
V
J
V
w
d. l
V (3.15b)
The first factor of eq. 3.15 may be interpreted as a ltconstant", whereas the
remaining two describe the influence of the important process variables.
Since sufficient information on the constants of eq. 3.15 is not
available, eq. 3-15 can only be used for interpreting oxygenation
experiments by air diffusion and is less suitable for designing pur
poses. Other models for oxygenation by bubble aeration have been
proposed by Bewtra and Nicholas (11), Suschka (12), and Horvath (13),
which do not overcome this drawback either. Hence, the rate and
efficiency of some of the air diffusers applied in practice are dis- '
cussed in the following sections. Depending on the size of the ori
fices of the diffusion devices, three basic types of bubble aeration
may be differentiated:
1. fine bubble aeration, achieved by small orifices of an order of
magnitude of 0,1 mm in porous filter media;
2. medium bubble aeration, through orifices of 2 to 5 mm diameter;
3. large bubble aeration through orifices of more than 5 mm diameter
or open tubes of some 25 mm diameter. In either case special
constructions for breaking up of the large bubbles into smaller
ones are often applied to increase the gas transfer efficiency.
Although bubble aeration is sometimes used for oxygenation and re
moval of taste and odor producing substances in the course of water
treatment, it is the domain of oxygen transfer in sewage treatment
by the activated sludge treatment. Hence the following sections are
primarily restricted to oxygen transfer. The system of medium bubble
aeration at low depths of immersion for removal of carbon dioxide
from water is covered seperately, therefore.

Finally, special attention is paid to systems of bubble aeration not
by means of compressed air but rather by air drawn into the water by
a partial vacuum induced by locally increased streaming velocities
(venturi aerator, deep well aerator). Both systems are used in the
course of water purification.
Before discussing the systems of air diffusion the customary para
meters for expressing the rate and efficiency of oxygen transfer in
bubble aeration are commentated. Most of them are directly related to
the overall transfer coefficient k , as will be shown.
3
- the oxygenation capacity oc (g 0?/m .s) is widely used as a rate
parameter. It has been discussed in section 2.U3- Generally, the
oc of bubble aeration is correlated to the air flow Q per unit g
tank volume V (= water volume V of the air-water mixture):
G = 77=- (m of air / m of water volume . s) . (3.16)
The air flow Q is to be stated at standard conditions of tempera
ture (0°C; in the U.S. often 16°C = 60°F) and pressure (101,3 kPa)
for dry air. The rational basis of this approach is seen from eq.
3.15, taking into account the definition of oc = k .c' (eq. 2.6k).
An example is given in figure 3.21.
- the oxygen utilization (0U) states, how much oxygen is absorbed per
standard m air applied, and is obtained by
oc k2 ' °' 0U = — = - — - (g o absorbed / m of air applied) (3.17)
and thus is an indication of the efficiency of the diffuser system.
- Frequently, this efficiency is expressed as "percent oxygen absorp-
tion" (0A). Since dry air contains 20,95 % of oxygen by volume, 1 m
of air at standard conditions contains c = 0,2095.32/0,022U = g
299 g 0 and the percent oxygen absorption may be obtained from the
oxygen utilization by
0A = 100 . — = 100 . §£-- = 0,33U 0U % (3.18) g y y
9 • c k_ • K-~ = 100 . — £§• = 100 . G (kjj at 10°C !)

95
-p •rH o trt P< trt o
a o •H
•p 01 c <D W) !>. X o
-—* to
CO S
<M O
hO .. * o o
0,100
0,075
0,050
0,025
_s r
.'
0,5 1,0 1,5
experimental conditions:
tap water
d£ = 3,50 m
double spiral flow pattern
Schumacher-Tubes
-*• air rate per unit volume G (10 m /m .s)
Fig. 3.21 INFLUENCE OF THE AIR RATE PER UNIT VOLUME (G) ON THE OXYGENATION CAPACITY (oc)
- To allow for the influence of the depth of immersion d., not con
tained in the above parameters, the oxygen utilization may be re
lated to d.. The appropriate parameter then is oxygen utilization 1 3
per m of d., which is equal to OU/d. (g 0 /m .m). - The oxygenation efficiency 0E (g 0 /J; kg 0 /kWh) may be computed
from the gross power N (W) used by the blower and the oxygenation G
capacity 0C (g 0 /s) of the system:
0E = 0C/N. (g O 2 / J ) (3.19)
= oc . V/N. G
o The gross power N is estimated from the air flow Q (m /s), the
G g air pressure P (Pa) and the efficiency n of motor and blower
N = P . Q /n (W) G g
(3.20a)
The pressure P is composed of the pressure drop AP in the air dis
tribution system and in the diffusers plus the pressure against the
water depth in the aeration tank amounting to d..p.g (Pa). Thus
N = Q .(AP + d..p. G g . i
;)/n (w) (3.20b)
Frequently, also AP is expressed as Ah (m water column). Then eq.
3.20b is rewritten with Ah = AP/p.g and Ah + d. = h, . as ° l tot
\ = \ tot
g/n (3.20c)

96
3 Ex«mpl PJ An aeration tank contains 5*+0 m of water which is aerated
-3 3 3 at a rate of G = 10 m /m .s at an immersion depth of the diffusers
of d. = 2,70 m. The oxygenation capacity has "been found as oc =
0,025 g 0 /m .s. The head loss in the total tubing system and the
diffusers Ah = 0,36 m, the efficiency of the motor and blower is
n = 0,60.
Compute the-oxygen utilization, also per m of d., the percent oxygen
absorption, the oxygenation efficiency, and the gross power dissipa
ted per unit volume.
According to eq. 3.17 the oxygen utilization is
OU = oc/G = 0.025/10-3 = 25 g 02/m? of air
which gives an oxygen utilization per m of d. of
OUA^ = 25/2,70 = 9,26 g 02/m3.m
The percent oxygen absorption is (eq. 3.18)
OA = 0.331* • OU = 0.33U . 25 = 8,35 %
-3 3 Since the total rate of air flow amounts to Q = V.G = 5U0.10 m /s
the gross power is (eq. 3.20c)
NQ = 0,51+0 . 1000 . 9,81 . (2,70 + 0,36)/O,60 = 27 000 W
Hence
OK -SS.- SS^-
= 0,025 • 5^0/27000 = 5 • 10-U g 0o/J = 0,5 mg 0o/J 2' " ° 2'
= 5 • 10 . 3600 = 1,8 kg 02/kWh
The gross power dissipated per unit volume is
eG = NQ/V (3.21)
3 = 27000/5*40 = 50 W/nr

97
3-32 Fine Bubble Aeration
3-321 Types of Diffusers and Their Arrangement
The diffusers applied for fine bubble aeration consist of porous
media providing different orifice diameters in order of magnitude of
0,1 mm. The size of the "bubble produced ranges under operational con
ditions from about 1 to 6 mm. The porous media may be formed in the
shape of tubes, plates covering a box, or domes.
The porous media may be of the filter type, consisting of granular
material bound by synthetic resins (Brandol-diffuser), or of plastic
foam (Flygt-diffuser), sometimes of ceramic nature. Small orifices
are also obtained by winding a Saran plastic cord around a tube of
corrugated sheet metal, into which holes of some 3 mm of diameter
are drilled (Saran tube). Examples are given in figure 3.22.
For efficient gas transfer the air flow per diffuser unit may be
varied within certain limits only. The lower limit is determined by
the air rate required to release bubbles all over the diffuser sur
face in order to prevent water or pollutants from entering into it.
The upper limit is set by the increase of the resistance against air
flow and by the fact, that increasing air rates increase the bubble
size. Finally, the bubble concentration (number of bubbles per unit
tank volume) increases as does the chance of two or more bubbles to
collide and coalesce to one great bubble. All effect reduce the inter-
facial area and hence the rate of gas transfer. The optimum air rate 3 2
ranges from 0,01 to 0,02 m air per m diffuser surface per second.
Since the effective aerating surface of the commercial diffusers 2
ranges from 0,15 to 0,30 m , optimum air flow rates vary between
1,5-10 and 6,0.10 m /s per unit (5 to 22 nr/h per unit).

98
70 mm 0, 1085 nun long, equipped with 2 filter tubes "Brandol" granulation a6 requested, each 70/^0 mm 0, 500 mm long, fixed with tie rod, 2 flanges, central piece for admission of air with inside thread 1",nut and washers. Steel and cast iron mountings coated with stoved lacquer. Weight about ? kilos. -Effective aerating surface 0,22 ffl
Pressure loss of cylindrical aerator 70 mm 0 with "Brandol" tubes of different granulation in relation to volume of air. Distribution of air into water.
c a 3
H O
O
U 0)
4-> <0
(0 (0
o
o 3 10 <0 4)
u 04
^ 00
300
200
100
10 20 30 kO 50
volume of air (m",
The indicated volume of air is the intake volume at 20 C. The pressure losses indicated are to be understood for complete cylindrical aerators with wet "Brandol" tubes without consideration of the liquid column above the aerators.
Fig. 3.22 a DIFFUSER FOR FINE BUBBLE AERATION - SCHUMACHER-TUBE (70 mm diam.)

99
100 nm 0, about 1100 mm long, equipped with 2 filter tubes "Brandol" granulation as requested, each 100*60 mm 0, 500 mm long, fixed with tie rod 2 fiances, central piece for admission of air with inside thread 1", nut and washers. Steel and cast iron mountings coated with stoved lacquer* Weight about 13,3 kg . Effective aerating surface 0.31^ mc
-~1100
i
Pressure loss of cylindrical aerator 100 mm 0 with "Brandol tubes of different granulation in relation to volume of air. Distribution of air into water.
c a 3
<-\ O o u 4->
a
e G W 10 o
4) I* 3 <0 <0 4) U P.
500
*+00
300
200
100
.o<
CJ2&&*
& /
10 20 30 40 50
Volume of air (nr/h)
The indicated volume of air is the intake volume at 20 C. The pressure losses indicated are to be understood for complete cylindrical aerators with wet "Brandol" tubes without consideration of the liquid column above the aerators.
Fig. 3.22 b DIFFUSER FOR FINE BUBBLE AERATION - SCHUMACHER-TUBE (100 mm diam.)

03mm
-80 •* surface area: 0,1525
Fig. 3.22 c DIFFUSER FOR FINE BUBBLE AERATION - SARAN-TUBE
D:1 mm watercolumn
m /hour 10 20 30 40 50
1000
mm^ rW&
dimensions of the diffuser in mm
Fig. 3.22 d DIFFUSER FOR FINE BUBBLE AERATION - FLYGT-DIFFUSER

The following table gives an indication of the loss of head of the
forementioned diffuser types
Diffuser Type
Brandol
Saran
Flygt
air rate per unit
10 ° nT/s
2,8
5,6
8,3
11,1
1,7
3,3
5,0
5,6
8,3
11,1
13,9
loss of head
kPa
1,96
2,9U
3,92
^,90
1,50
1,57
1,70 '
0,10
0,15
0,3^
0,59
mm column of water
200
300
Uoo
500
153
• 160
173
10
15
35
60
Generally the diffusers are placed as near to the tank bottom as
possible to make full use of the tank depth for the bubble rise. The
diffusers may be arranged as follows:
a) near one side wall of the tank, producing a spiral flow of the '
tank content, which is facilitated by a quadratic cross section of
the tank. Diffuser tubes may be arranged parallel to the side wall
("narrow band") or rectangular to it ("wide band") as shown in
figure 3.23. A dubble spiral flow is obtained by arranging the
narrow or wide band system at both sides of a tank, which is
preferably twice as wide as deep. Reducing this width leads to
the arrangement generally referred to as
sewage feed
Fig. 3.23 WIDE BAND ARRANGEMENT OF DIFFUSER TUBES

102
b) "longitudinal pattern". This system is achieved by placing three
or more diffuser bands within a tank of optional width ( fig. 3.20a)
mim Fig. 3.20 a ARRANGEMENT OF DIFFUSER WITHIN
AN AERATION TANK AND THE CORRESPONDING PATTERN OF FLOW
L 1»2 m A filter plate
separator
Fig. 3.24 CROSS-SECTION OF TANK BOTTOM WITH RIDGE-AND-FURROW DIFFUSER ARRANGEMENT
or with the well known "ridge- and -furrow" system (fig. 3.2U),
consisting of the ridge for seperating the bubble streams produced
by filter plates placed in the furrows at the bottom of the tank.
Filter domes spread over the tank bottom also produce a longitu
dinal pattern.
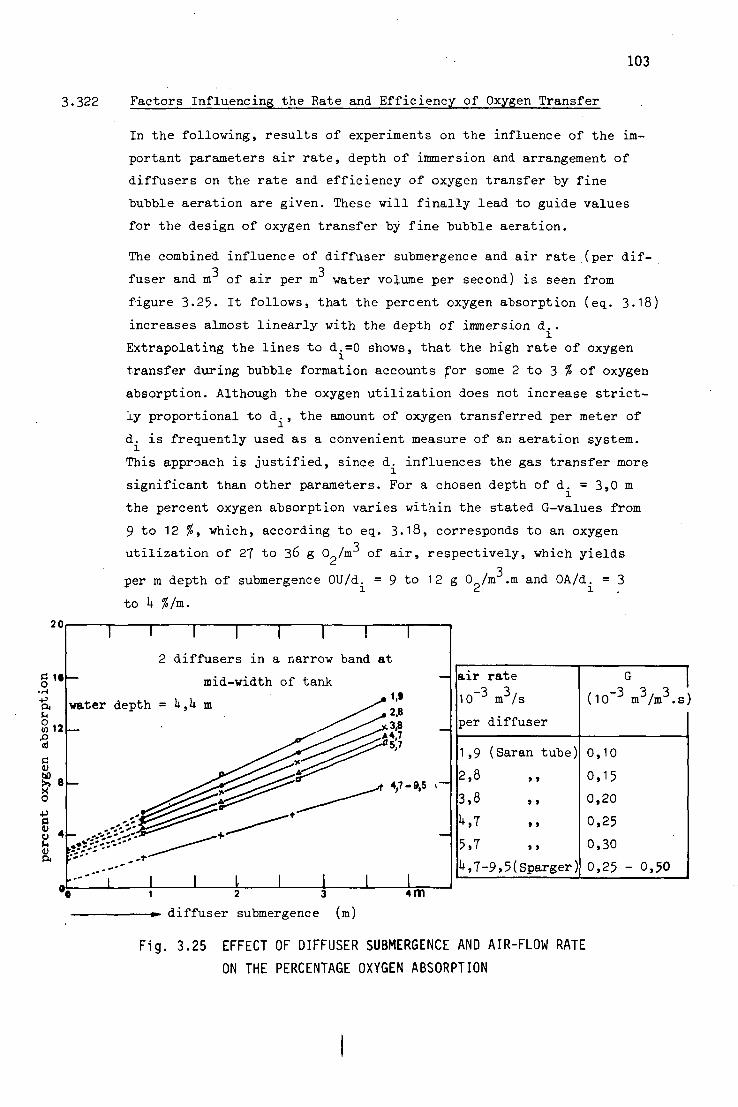
103
3.322 Factors Influencing the Rate and Efficiency of Oxygen Transfer
In the following, results of experiments on the influence of the im
portant parameters air rate, depth of immersion and arrangement of
diffusers on the rate and efficiency of oxygen transfer by fine
bubble aeration are given. These will finally lead to guide values
for the design of oxygen transfer by fine bubble aeration.
20
gl.h-
CM
•8 a a; tg
£8
o
8 « u V PM
The combined influence of diffuser submergence and air rate (per dif-3 • 3 fuser and m of air per m water volume per second) is seen from
figure 3.25. It follows, that the percent oxygen absorption (eq. 3.18)
increases almost linearly with the depth of immersion d..
Extrapolating the lines to d.=0 shows, that the high rate of oxygen
transfer during bubble formation accounts for some 2 to 3 % of oxygen
absorption. Although the oxygen utilization does not increase strict
ly proportional to d., the amount of oxygen transferred per meter of
d. is frequently used as a convenient measure of an aeration system.
This approach is justified, since d. influences the gas transfer more
significant than other parameters. For a chosen depth of d. = 3,0 m
the percent oxygen absorption varies within the stated G-values from
9 to 12 %, which, according to eq. 3-18, corresponds to an oxygen
utilization of 27 to 36 g 0 /m of air, respectively, which yields
per m depth of submergence OU/d. = 9 to 12 g 0 /m .m and OA/d. = 3
to k %/m.
water
I | | | | 1 2 diffusers in a narrow band at
mid-width of tank
depth = h,k m
4,7-9,5
A. 1 1 2 3
-»• diffuser submergence (m) 4m
air rate
10 m /s
per diffuser
1,9 (Saran tube)
2,8
3,8
M 5,7
^,7-9,5(Sparger)
I (10~3 m3/m3.s)
0,10
0,15
0,20
0,25
0,30
0,25 - 0,50
Fig. 3.25 EFFECT OF DIFFUSER SUBMERGENCE AND AIR-FLOW RATE
ON THE PERCENTAGE OXYGEN ABSORPTION

104
Similar results can be read from figure 3.26, where the oxygenation o
capacity oc (g 0 /m .s) is given as a function of the.air rate
G (m /m .s) in dependence of the diffuser arrangement.
0,100
4- 0,075 CvJ
O
0,050 o o
0,025
Experimental conditions:
tap water
d. = 3,1*0 m
Saran-Tubes
longitudinal pattern
. — — double spiral flow
— — — spiral flow
0 0,5 1,0 1,5
-*• air rate G (10~3 nr/m .s)
Fig. 3.26 EFFECT OF DIFFUSER ARRANGEMENT ON THE OXYGENATION CAPACITY
Application of eq. 3.17 then indicates the following ranges of oxygen
utilization:
diffuser bands
per tank width
1
2
3
range of oxygen utilization
OU (g 02/m3)
33 - U0
35 - 1*5
>+5 - 55
0U/di (g 02/m3.m)
range
9,7 - 11,8
10,3 - 13,2
13,3 - 16,3
average
11 ,0
11,8
15,3
Summarizing, it may be stated, that the oxygen transfer by small
bubble aeration can be characterized by the oxygen utilization per m
of diffuser submergence (OU/d.) which amounts for common tank depth
(2 to 5 m) to some 8 - 15 g 0 /m .m. Within this range,
a) the arrangement sequence narrow - wide band - longitudinal pattern
will increase OU/d. caused by a reduction of the upward water velo
city v (comp. eq. 3.13 and 3.11*); —3 3 3
b) an increase of G within the common range of 0,5 to 1,8.10 m /m .s
will lower OU/d., due to the accompanied increase of the air rate
per diffuser unit, which gives rise to the formation of bubbles of
greater size and of coalescence of bubbles.
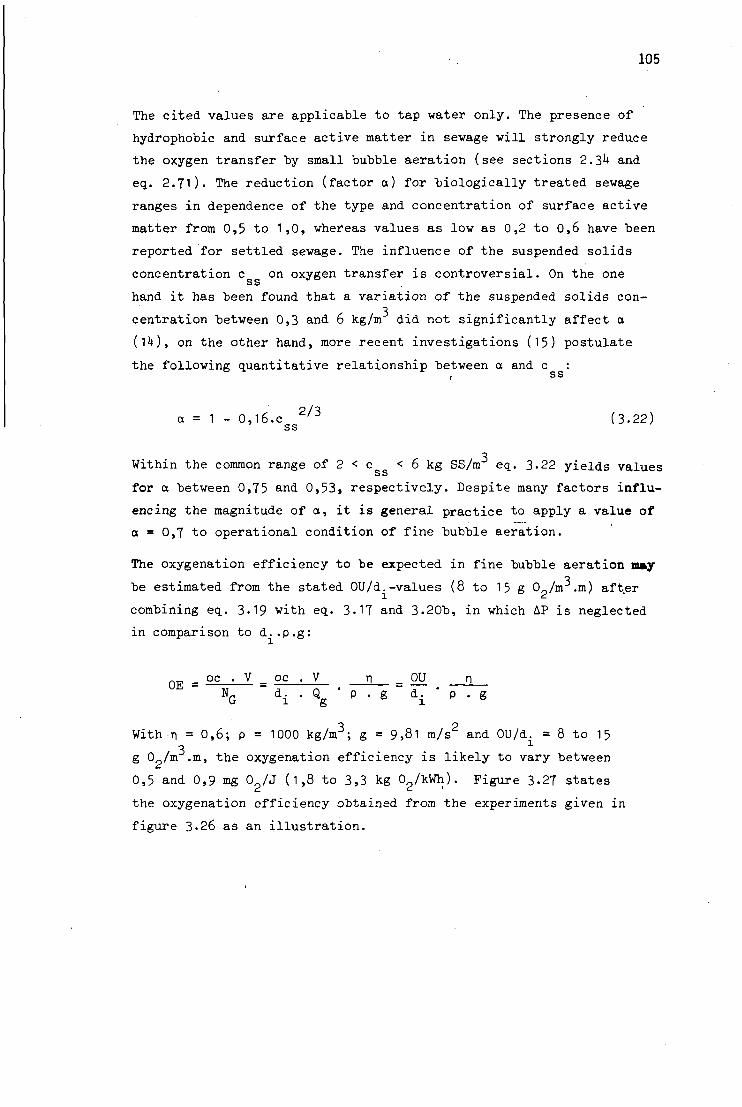
105
The cited values are applicable to tap water only. The presence of
hydrophobic and surface active matter in sevage will strongly reduce
the oxygen transfer by small bubble aeration (see sections 2.3^ and
eq. 2.71). The reduction (factor a) for biologically treated sewage
ranges in dependence of the type and concentration of surface active
matter from 0,5 to 1,0, whereas values as low as 0,2 to 0,6 have been
reported for settled sewage. The influence of the suspended solids
concentration c on oxygen transfer is controversial. On the one ss .
hand it has been found that a variation of the suspended solids con's
centration between 0,3 and 6 kg/m did not significantly affect a
(1^), on the other hand, more recent investigations (15) postulate
the following quantitative relationship between a and c :
a = 1 - 0,16.C 2 / 3 (3.22) ss
Within the common range of 2 < c < 6 kg SS/m eq. 3.22 yields values
for a between 0,75 and 0,53, respectively. Despite many factors influ
encing the magnitude of a, it is general practice to apply a value of
a = 0,7 to operational condition of fine bubble aeration.
The oxygenation efficiency to be expected in fine bubble aeration m»y
be estimated from the stated OU/d.-values (8 to 15 g 0p/m .m) after
combining eq. 3.19 with eq. 3.17 and 3.20b, in which AP is neglected
in comparison to d..p.g:
r\i? - oc • V _ oc . V n _ OH n
G i " \ P ' g i P • 8
With-n = 0,6; p = 1000 kg/m3; g = 9,81 m/s2 and OU/d. = 8 to 15 3 . . . . . x
g 0_/m .m, the oxygenation efficiency is likely to vary between
0,5 and 0,9 mg 0 /J (1,8 to 3,3 kg 02/kWh). Figure 3-27 states
the oxygenation efficiency obtained from the experiments given in
figure 3-26 as an illustration.

106
_._._ longitudinal pattern
_ _ _ — double spiral flow
• spiral flow
0,75 1,0 1,25 1,5 -3 3 3
air rate per unit volume G (10 m /m .s)
g. 3.27 THE INFLUENCE OF THE AIR RATE G ON THE OXYGENATION EFFICIENCY OE
The following table summarizes the most important guide values for
designing oxygen transfer by fine bubble aeration in the activated
sludge treatment process.
Guide Values for Oxygenation by Fine Bubble Aeration
tapwater
operational
conditions
(a = 0,7)
optimum conditions
OU/d. l
g 02/m .m
12
8,5
OE
mg Og/J
0,6
0,U2
kg 02/kWh
2,2
1,5
average conditions
OU/d.
g 02/m .m
10
7
0E
mg 02/J
0,1*7
0,33
kg '02/kWh
1,7
1,2
323 Practical Aspects
The advantage of a great oxygen transfer efficiency by fine bubble
aeration has to be paid for by a careful control of operation to pre
vent clogging of the fine pores of the diffusers.
Clogging may be caused by pollutants in the compressed air like dust,
soot from the environment, or oil particles from the blowers, corro
sion of the air distribution system. From outside, the diffusers can
be clogged by matter contained in the water or sewage (carbonates,
high pH-values, metal ions which precipitate, grease, oil, fine sand)
or by penetration of sludge particles when the blowers do not work
(break down of electricity supply etc.).
c o
•|W
S 0,9
op CM
S •p a) (3 0) W M O >> X o
0,7
0,6
ns
- * ^
V N

Cleansing of the diffusers is brought about by lowering of the water
level in order to significantly increase the air rate per unit. More
convenient in this respect are swing diffusers (fig. 3-28): a battery
of some ^ to 10 diffusers are mounted at one or two pipes fixed to
the air distribution main by movable joints. This construction allows
to increase the air rate for cleaning by lifting one battery or
facilitates replacing of a clogged unit. Partial replacing of units,
however, leads to unequal restistance of the diffuser units and con
sequently to an uneven distribution of the diffused air over the
aeration tank. Throttling of the air rate for replaced diffuser bat
teries may overcome this drawback, but leads to an increased power
consumption again.
mating tyttom to mint at (ffhistr mntfotdi
H U B B i l l rfrfTfrr
Fig. 3.28 SWING DIFFUSER ARRANGEMENT (SCHUMACHER)
Thus, fine bubble aeration requires skilled maintenance and is hence
applied in great installations only, treating water or sewage not
likely to give rise to diffuser clogging.
The air has carefully to be filtered and blowers discharging oil free
air have to be applied.
Example: The maximum oxygen demand of an activated sludge treatment
unit (d. = 3,70 m) has been found to be max 0D = TO g O^/s, the
minimum value min OD = 20 g 0 /s. Estimate the maximum and minimum
air rate required and the number of Saran tubes to be installed
(operation range for Saran tube according fig. 3.22 is 1,5 to
5,5 • 10 m of air per second, optimum rate is 3,3 . 10 m /s)
when the oxygen saturation concentration under operational conditions 3 • 3
is c = 10,5 g/m and a oxygen concentration of c = 1,5 g/m has to s

be maintained in the mixed liquor.
What is the maximum gross power consumption?
At zero oxygen content in the tank, the oxygenation capacity of the
aeration system OC has to be equal to the oxygen demand OD:
oc . V. = OD
Inserting eq. 3-17 and 3• 16 into this expression yields
OU . G.V = OU . Q = OD g
or
Qe =0U7d~'d"~ U 3ofair/s) , (3.23) i i
To allow for the required oxygen concentration c = 1,5 g/m the air
rate has to be increased by c /(c - c) to give
OD 1 Cs Qg " (OU/d.) * d. ' c - c
1' 1 S
•3
Hence, with OU/d. = 7 g 0 /m for average operational conditions:
max Qg = r • sTfo • 10,5-1,5 = 3 ' 1 5 m / s
. . 20 1 mm Q = — ^ f ^ r = 0,90 m3/s
•g 7 ' 3,70 * 10,5-1,5
Since increased air rates reduce the oxygen transfer efficiency, the
number of tubes is estimated by comparing min Q with the lower limit
of the air rate per tube (1,5-10 m /s):
Number of tubes = min Q /1,5.10~3 = 0,9/1,5-10~3 = 600 g
For max Q the air rate per tube equals to S -3 3
max Q /600 = 3,15/600 = 5.2.10 m /s which is below the upper limit of 5,5-10-3 m3/s.
Assuming an oxygenation efficiency of 0E = 0,33 mg 0 /J, the maximum
gross power is obtained from max 0D = 70 g 0^/s as 70.1000/0,33 J/s = 3
212 kW at c = 0 g 0 /m • Thus, the actual maximum gross power is
212.10,5/(10,5-1,5) = 2U7 kW.
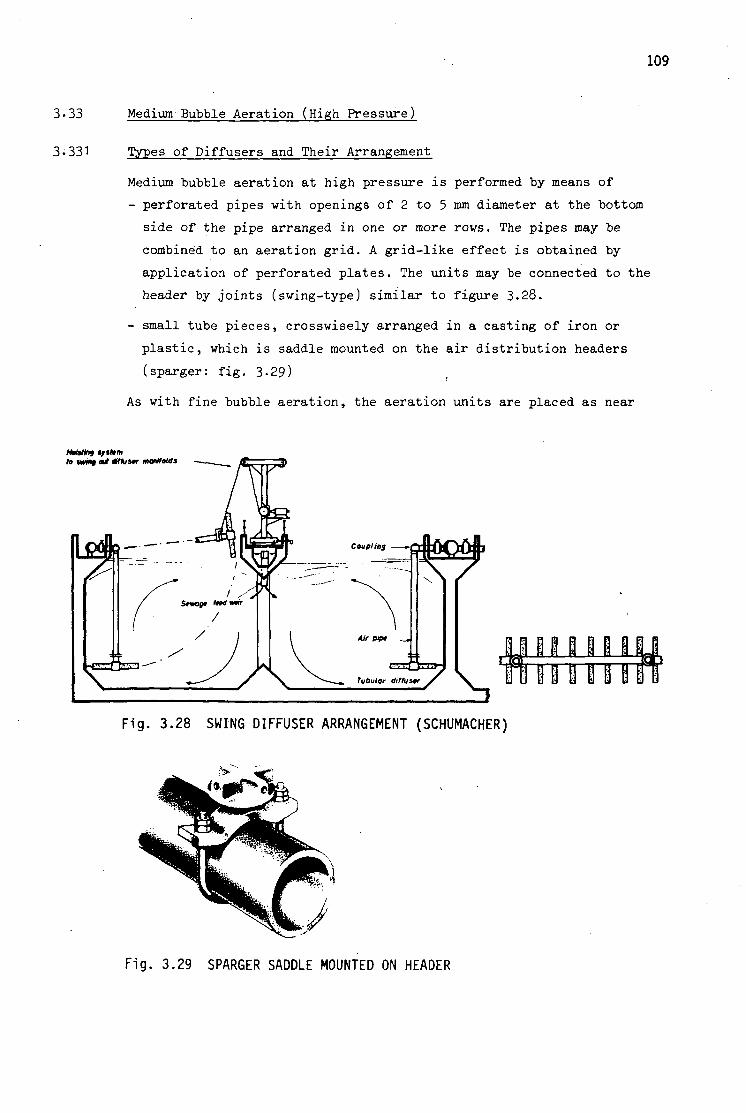
3.33 Medium Bubble Aeration (High Pressure)
3-331 Types of Diffusers and Their Arrangement
Medium bubble aeration at high pressure is performed by means of
- perforated pipes with openings of 2 to 5 mm diameter at the bottom
side of the pipe arranged in one or more rows. The pipes may be
combined to an aeration grid. A grid-like effect is obtained by
application of perforated plates. The units may be connected to the
header by joints (swing-type) similar to figure 3.28.
- small tube pieces, crosswisely arranged in a casting of iron or
plastic, which is saddle mounted on the air distribution headers
(sparger: fig. 3-29)
As with fine bubble aeration, the aeration units are placed as near
Httitin) (/stem to twins oJ dUtunr manifold i
J Mll l l l t rnrnTT
Fig. 3.28 SWING DIFFUSER ARRANGEMENT (SCHUMACHER)
Fig. 3.29 SPARGER SADDLE MOUNTED ON HEADER

no
to the tank 'bottom as possible to make full use of the tank height
for contact between air and water. High pressure "blowers are required
therefore. On the other hand perforated pipes or grids are applied at
shallow submergence (combined with low pressure fans). This system
is covered-in section 3.33*+.
Generally, the wide or narrow band type of arrangement of the diffuser
units is applied.
3.332 Factors Influencing the Rate and Efficiency of Oxygen Transfer
The main difference of rate and efficiency of medium bubble aeration
as compared to oxygen transfer by fine bubble is caused by 2 factors:
1. The larger bubbles provide a smaller total interfacial area;
2. The bubbles are not formed by a slow increase of their size, but
are released in a chain-like manner. Partly, the formed bubbles
are to great to withstand the hydraulic shear imposed on them by
the high water velocity around the place of bubble formation.
Breaking into a number of smaller bubbles in the consequence,
then.
The firstly mentioned decrease of the total interfacial area obvious
ly leads to a decrease of the rate of oxygen transfer as compared to
fine bubble aeration.
Due to the difference in bubble formation, mentioned under item 2,
the oxygen transfer during formation is much less pro
nounced than with fine bubbles. This is evident from figure 3.25.
Whereas the process of bubble formation accounts to some 2 to 3 % of
oxygen absorption with Saran tubes, this effect is decreased to
about 0,5 % when applying medium bubble aeration by spargers. The
figure also reveals, that variation of the air rate per diffuser
unit or per tank volume is of neglegible influence on the gas trans
fer efficiency. Moreover, the size of the orifices within the stated
range of 2 to 5'mm is of no significant influence. This has been
shown by applying various opening diameters within this range
and air discharge velocities from 3 to 100 m/s. No significant dif
ferences concerning the oxygen utilization had been obtained.
Finally medium bubble aeration is less susceptible than fine bubble

I l l
air rate G
10-3 m3/s (10~3 m3/m3.s)
per diffuser
1,9 (Saran tube) 0,10
2,8 ,, 0,15
3,8 ,, 0,20
H,T ,, 0,25
5,7 ,, 0,30
*»,7-9.5 (Sparger) 0,25 - 0,50
0 1 2 3 4 m ' d i f f u s e r submergence (m)
Fig. 3.25 EFFECT OF DIFFUSER SUBMERGENCE AND AIR-FLOW RATE
ON THE PERCENTAGE OXYGEN ABSORPTION
diffusion to hydrophobic or surface active matter. On the average a
reduction factor of a = 0,8 represents the experience of practice for
operational conditions as compared to 0,7 for fine bubble aeration.
Concerning the guide values, refering to the oxygen utilization per
meter of submergence, a first estimate may be taken from figure 3'.25,
which shows for the cited experiment with spargers a percent oxygen
absorption of some 6 % for 3 m of submergence, or 2% per m submergence.
Applying eq.. 3.18, this is equivalent to OU/d. = 6/0,331*.3 = 3 3
6 g 0p/m .m. This result corresponds very well to the guide values on
OU/d. for medium bubble aeration in activated sludge treatment given
in the following table. This table states also the oxygenation
efficiency to be expected.
Guide Values for Oxygenation by Medium Bubble Aeration
tap water
operational
conditions
(a = 0,8)
optimum conditions
OU/d.
•3
g 02/m .m
7
5,5
OE
mg 02/J
0,39
0,31
kg 02/kWh
1,U
. . .
average conditions
ou/di
g 02/m .m
6
U,5
0E
mg 02/J
0,31
0,22
kg 0 /kWh
1,1
0,8
c oi»h •H -p ft u o ,o 12 a) a o b0 X 8
O •P C 1) o u
I I I I I 2 d i f f u s e r s i n a narrow band a t
mid-width of t ank
water depth = k,k m
S,
V-%5
112
3.333 Practical Aspects
The main advantage of medium t>ubt>le aeration lies in the fact that
air-side clogging of the diffusers does not occur. The air needs "but
rough cleaning by coarse screening to prevent larger particles from
entering into the aeration system. Water-side clogging happens equally
often as with porous diffusers but is eliminated more easily. Cleaning
is, of course facilitated by the swing arrangement of the diffuser
units.
Due to the small resistance of air flow imparted by the diffusers,
they have to be constructed almost perfectly horizontal in order to
guarantee a uniform air distribution all over the tank area. The
uniform distribution is also achieved by arranging throttle-valves
between header and diffuser unit.
Since medium bubble aeration requires less skilled maintenance it is
preferably applied for small and medium large treatment works hand
ling primarily domestic sewage. Efficient primary sedimention,
however, is then a prerequisite to help in preventing the diffusers
from clogging. Medium bubble aeration is used also for large treatment
works in case the energy cost are low.
3-33^ Medium Bubbles Aeration (Low Pressure)
Medium bubble aeration at low depth of submergence is used for oxyge
nation of the mixed liquor in activated sludge plants as well as for
oxygenation and primarily carbon dioxide removal in water treatment
works. This aeration system is known under the commercial name of Inka
(it has been developed by INDUSTRIKEMISKA AB, Sweden) for sewage
treatment, whereas the somewhat different design, applied for water
treatment is referred to by Inka-Intensive aeration.
3.33U1 The Inka Aeration System
The main features of the Inka aeration system applied for oxygen
transfer within the activated sludge treatment process are an aera
tion grid made from stainless steel or plastic with orifices of 2,5
to U,5 mm diameter placed at about 0,80 m depth of submergence,
covering one half of the aeration tank, the other half being separa
ted by a vertical wall extending until about again 0,80 m above the
tank bottom (see figure 3-30). Aeration enforces a rotational move
ment of the tank content at high velocity by an action, similar to
that of a mammoth pump. Thereby a fair portion of the bubbles is

113
air distribution channel
::|fe^! settled sewage
JO
(a) ARRANGEMENT AERATION GRID
0,5
c o •H 0)
u 4>
o
«.•
^
1 N ^ ^ — - 1 1
0,9 yT 1,1 1,2 1,3 1,4
*. relative oxygenation efficiency (arbitrary units)
(b) INFLUENCE OF THE DEPTH OF IMMERSION ON THE
OXYGENATION EFFICIENCY OE
Fig. 3-30 INKA-AERATION
forced to move downwards into the compartment opposite to the aera
tion grid, increasing the average detention time of the bubble with
in the liquid and hence the total interfacial area.
Increase of the air rate (which is commonly 5 times as high as with
conventional fine or medium bubble aeration) generally leads to an
increase in percent oxygen absorption. This is evident, since increase
of the air rate enhances the rotational movement and thus enforces a
greater portion of the bubbles into the not aerated division of the

114
tank..
Since the grids are manufactured at a width of 1,50 m and since a
depth of submergence of 0,80 m has been evaluated to be optimal (see
figure 3-30), the tank dimensions as given by figure 3.30 are appro
priate. Although the aeration grids are generally placed at 0,80 m of
submergence, the guide values for oxygen utilization are given per
meter of submergence for easy comparison with other bubble aeration
systems. The amount of energy to be spent for diffusing the air is
small, firstly because of the low depth of immersion, secondly be
cause of the low resistance to air flow, the air being distributed by
wide air channels above the water level of the tank (see figure 3.30),
and thirdly because the fans applied for aeration generally reach a
higher efficiency than high-pressure blowers.
Guide Valves for Oxygenation by Low Pressure Medium Bubble Aeration
(Inka)
tap water
operational
conditions
(a = 0,8)
optimum conditions
OU/d.
•3
g 0 /m .m
9
7,5
0E
mg 02/j
0,50
0,1+0
kg 02/kWh
1,8
1,5
average conditions
OU/d.
g 02/m .m
8
6,5
0E
mg 02/J
0,U0
0,32
kg 02/kWh
• 1»5
1,2
Concerning practical aspects of the Inka aeration system it has to be
mentioned that the aeration grating has to be carefully placed hori
zontally. The same holds for the outlet weir to guarantee a horizon
tal water surface. Small deviations in either respect will lead to an
uneven distribution of the air over the tank surface. This is of
special importance for the Inka system since the total pressure (sum
of head loss, head loss of discharge through orifices, and water
head) amount to only some 0,90 to 0,95 m of water column, so that
small head differences will have a significant effect. Partial water
side clogging of the aeration grid will lead to an uneven distribu
tion of the air also. Moreover, any increase of the resistance due
to clogging will significantly decrease the air rate since pressure
increase strongly reduces the capacity of the fan. Thus, efficient
primary sedimention is a prerequisite for the application of the

115
Inka low pressure aeration. Especially filamentous material has to be
completely removed in order to prevent formation of pig-tails- at the
grating.
3.33^2 The Inka Intensive Aeration
The basic Inka principle, namely aeration through a grid of orifices
at a pressure low enough to enable the application of fans, is used
also in the course of water treatment for oxygenation and removal of
carbon dioxide (and possibly taste and odor producing volatile
matter). The design of this system, referred to by Inka Intensive
Aeration, differs significantly from that used for oxygenation of
sewage, however (compare fig. 3-30 and 3-31)- Hence, the principal
features are a plate of stainless steel, perforated with orifices of
some 2 mm diameter, covering about 2 to 3 % of the "grid" area, which
is placed horizontally on a foundation consisting of a concrete cham
ber. The water is uniformly distributed over the front width of the
plate by a sprinkle pipe. To stabilize the bubble layer above the
plate, a foam screen is placed at the discharge end of the plate, the
slot width controlling the foam thickness. Air is supplied by a fan,
passes through the water and is carried off by an exhaust stack.
Fig. 3.31 THE INKA INTENSIVE AERATION

By proper choice of number, size and location of the plate holes, of
the water and air rate and of the slot width controlling the thickness
of the foam layer, the water is distributed in a continuous layer of
almost uniform polyhedral bubbles. The bubbles consist of a thin
water film, thus providing a large air-water interface. A continuous
vertical up and down movement of the liquid has been ascertained,
which leads to a continuing renewal of the interfacial area. Both
facts give rise to a great rate of gas transfer.
Depending on the desired degree of oxygenation or carbon dioxide re
moval, the air to water flow ratio RQ is varied from 25 to 500. With
such large ratios no significant increase of gases to be removed
within the gaseous phase will occur which might decrease the rate
of stripping (compare section 2.5)•
Due to the interaction of the operational variables the optimum
operation can be established experimentally only. Important inter
actions are the following:
the narrower the slot width of the foam screen is chosen, the more
water is retained on the plate and the higher is the foam layer which
leads to a longer time of contact between air and water, promoting the
exchange of gases. On the other hand, however, this increases the
total resistance against air flow and is reducing the air rate dis
charged by the fan which will decrease the gas exchange efficiency.
The same effects are observed when increasing the flow rate of water
at constant slot width of the foam screen. Finally, the described
interdependencies are influenced by the size and the arrangement of
the holes of the plate.
Despite the difficulties met in optimalization, the Inka intensive
aeration system is an very efficient process for removing carbon
dioxide. At high ratios of air to water flow carbon dioxide can al
most fully be stripped from the water. Hard water and water containing
appreciable amounts of iron and/or manganese may cause operational
troubles'by clogging of the holes by precipitates of calcium, iron,
and manganese.
Although the oxygenation of the treated water is excellent too, the
process is not very efficient in this respect from an economical
point of view:
the oxygenation efficiency 0E does not reach values of larger than
0,19 to 0,28 mg 02/J (0,7 to 1,0 kg Og/kWh).

117
3-3U Coarse Bubble Aeration
3-3 1 Types Diffusers and Their Arrangement
Coarse bubble aeration is performed by means of slotted or perforated
pipes or plates with orifices greater than 5 mm diameter, or of open
pipes of 25 to 50 mm diameter which are vertically arranged within
the aeration tank.
The size of the produced bubbles may be reduced by additional devices
near the air discharge openings. In principle these devices create a
locally increased turbulence, excerting shear forces on the bubbles
large enough to subdivide them. Two typica'l constructions are depicted
in figure 3-32. Figure 3.32a shows a deflecting plate mounted at the
lower end of a 57 mm diameter pipe. The plate is inclined in the
directions of the spiral flow to induce a high shearing velocity upon
the discharged coarse bubble. Ribs are welded on the plate to assist
in breaking up the coarse bubbles. Figure 3.32b shows the shear box
direction of
spiral flow
pipe J0 57 mm
telescope pipe & 50 mm l^"N'
detail A
Fig. 3.32 a DEFLECTING PLATE FOR DISINTEGRATION OF COARSE BUBBLES
construction, a square shaped box with a closed bottom and an open top
mounted on the header. Air is introduced through a nozzle with a large
opening. Induced counter flowing air-liquid streams shear large bubbles
released from the nozzle into fioe nubbles,.
Tank dimensions and the arrangement of the diffusers within the tank
are similar to those reported for fine and medium bubble aeration.

118
°0
loo ;|
air bubbles
water flov
0
o 0 0
.•--IPL:-
*'~"
i
distribution hei
I
/ / / / / / / / / / / /
Fig. 3.32 b SHEAR BOX FOR DISINTEGRATION OF COARSE BUBBLES
3.3^2 Factors Influencing the Rate and Efficiency of Oxygen Transfer
Due to the large size of the bubbles and the corresponding small
total interfacial area, coarse bubble aeration shows the least oxygen
utilization OU of all air diffusion systems. As with medium bubble aera
tion the oxygenation during formation of the bubbles is almost negle-
gible. Hence the oxygen utilization increases linearly with increasing
water depth. The application of deflecting plates or shear devices
for breaking up the large bubbles significantly increases the
efficiency of aeration. This is seen from a comparison of the guide
values for oxygen utilization with and without deflecting plates
given in the two following tables, respectively.
Although it is general practice to consider a a value of 0,8 for
operational conditions, hydrophobic and surface active matter has
but little influence on the oxygen utilization as is seen from a
comparison of fine and coarse bubble aeration in figure 3.33. 14
_ ____ /f/f i yyS^h ——. —^— — _ _ fine bubbles
_ « • » coarse bubbles
operational conditions
1.0 1.5 G (m3/m3.s).1cf
Fig. 3.33 EFFECT OF SEWAGE CONSTITUENTS ON THE OXYGEN UTILIZATION USING FINE AND COARSE BUBBLE AERATION
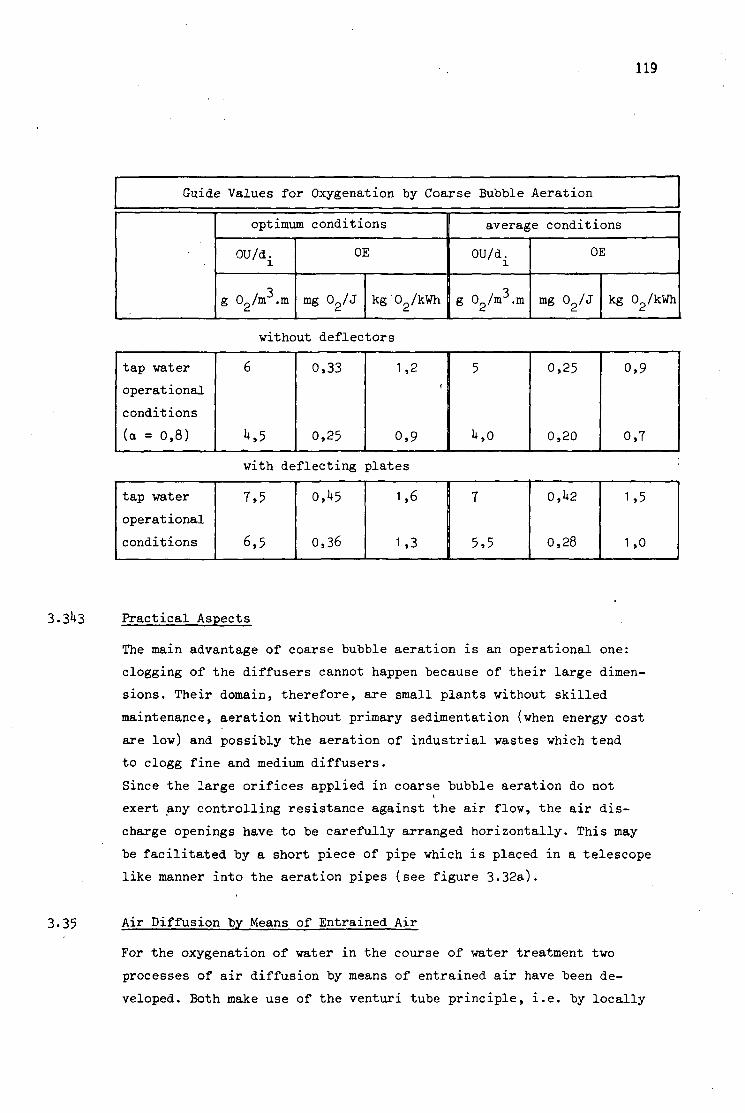
119
Guide Values for Oxygenation by Coarse Bubble Aeration
optimum conditions
ou/di
g 02/m .m
OE
mg 02/J
average conditions
OU/d.
kg'02/kWh [ g 02/m3.m
OE
mg 02/J kg 02/kWh
without deflectors
tap water
operational
conditions
(a = 0,8)
6
»»,5
0,33
0,25
1,2 I
0,9
5
u,o
0,25
0,20
0,9
0,7
with deflecting plates
tap water
operational
conditions
7,5
6,5
0,1+5
0,36
1,6
1,3
I T I 5,5
0,1*2
0,28
1,5
1,0
3.31*3 Practical Aspects
The main advantage of coarse bubble aeration is an operational one:
clogging of the diffusers cannot happen because of their large dimen
sions. Their domain, therefore, are small plants without skilled
maintenance, aeration without primary sedimentation (when energy cost
are low) and possibly the aeration of industrial wastes which tend
to clogg fine and medium diffusers.
Since the large orifices applied in coarse bubble aeration do not
exert any controlling resistance against the air flow, the air dis
charge openings have to be carefully arranged horizontally. This may
be facilitated by a short piece of pipe which is placed in a telescope
like manner into the aeration pipes (see figure 3.32a).
3.35 Air Diffusion by Means of Entrained Air
For the oxygenation of water in the course of water treatment two
processes of air diffusion by means of entrained air have been de
veloped. Both make use of the venturi tube principle, i.e. by locally

120
increasing the streaming velocity of water the velocity head v /2.g
is increased as to let the pressure head fall below the geodetic
head.
This principle is shown for the venturi aerator as example in figure
3-3^. It is evident that at the point of high velocity a vacuum is
produced. This will cause air to be entrained if the tube is perfo
rated.
In the following the venturi aerator and the deep well aerator (U-tube
aerator), both being based on this principle, will be discussed.
velocity head
pressure headi air
pressure head
water
geodetic head
JHJ. ,_ /vacuum / i
— dispersion of air
in water
Fig. 3.34 PRINCIPLE OF AERATION BY MEANS OF ENTRAINED AIR
3.351 The Venturi Aerator
Figure 3.35 gives a schematic representation of a venturi aerator.
The air is entrained in the inlet throat of the venturi tube. The
strong turbulence at water velocities between 6 and 12 m/s causes an
intensive mixing of the entrained air with the water which leads to
a dispersion of fine bubbles. The dispersion is carried away with
the water stream, also when this is directed downwards. Thus, a great
interfacial area between air and water and a large time of contact
is provided. Since there is almost no difference to be observed in
the velocities of water and air bubbles, the renewal of the inter
facial surface is low, which partially offsets the above mentioned
positive effects with regard to the rate of oxygen transfer.
Fig. 3.35 THE VENTURI AERATOR
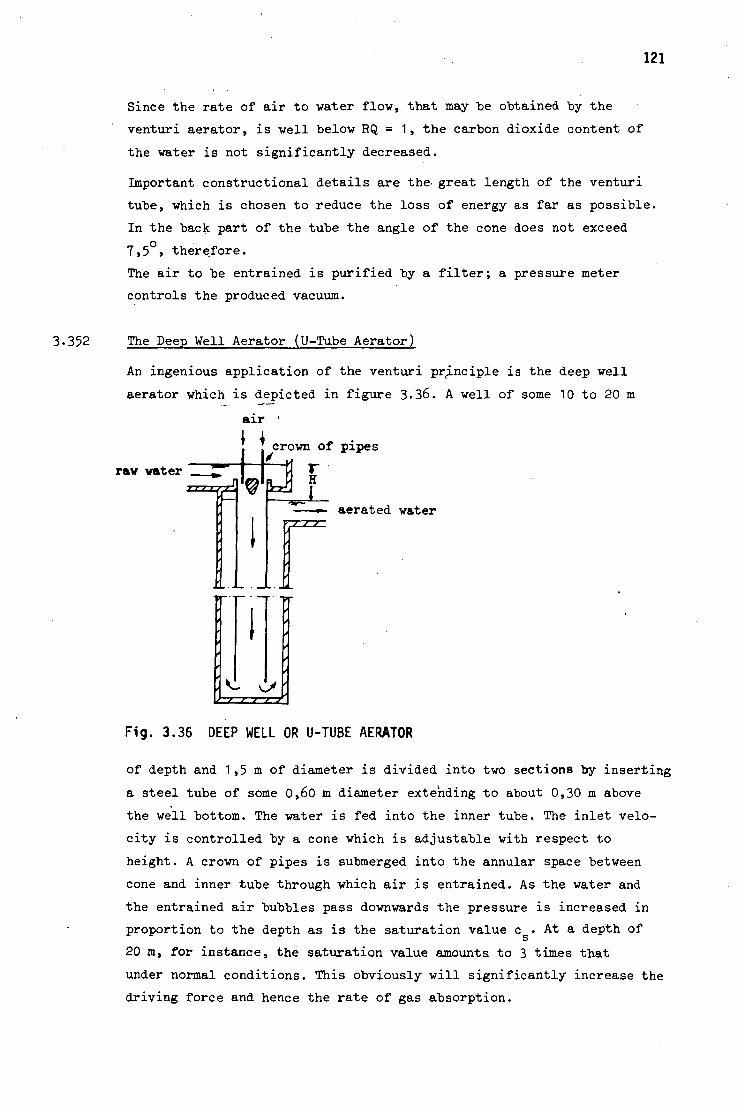
121
Since the rate of air to water flow, that may be obtained by the
venturi aerator, is well below RQ = 1, the carbon dioxide content of
the water is not significantly decreased.
Important constructional details are the- great length of the venturi
tube, which is chosen to reduce the loss of energy as far as possible.
In the back part of the tube the angle of the cone does not exceed
7,5 > therefore.
The air to be entrained is purified by a filter; a pressure meter
controls the produced vacuum.
3.352 The Deep Well Aerator (U-Tube Aerator)
An ingenious application of the venturi principle is the deep well
aerator which is depicted in figure 3.36. A well of some 10 to 20 m
raw water
in i
air i . - I
1
crown of pipes
—»- aerated water V,/ / /
i t t t r.
Fig. 3.36 DEEP WELL OR U-TUBE AERATOR
of depth and 1,5 m of diameter is divided into two sections by inserting
a steel tube of some 0,60 m diameter extending to about 0,30 m above
the well bottom. The water is fed into the inner tube. The inlet velo
city is controlled by a cone which is adjustable with respect to
height. A crown of pipes is submerged into the annular space between
cone and inner tube through which air is entrained. As the water and
the entrained air bubbles pass downwards the pressure is increased in
proportion to the depth as is the saturation value c . At a depth of
20 m, for instance, the saturation value amounts to 3 times that
under normal conditions. This obviously will significantly increase the
driving force and hence the rate of gas absorption.

The downwards velocity should be 0,50 m/s at least in order to guaran
tee that the air bubbles cannot rise. The maximum downwards velocity-
is below 1,5 m/s to prevent loss of energy which would reduce the oxy
genation efficiency. For the same reasons the upwards velocity in the
outer annular space has to be chosen as small as possible. Generally
it is designed to be 1/3 to 2/3 of the downwards velocity.
The flow rate may be controlled by either adjusting the height of the
cone or by changing the pressure head H. The first measure has no
influence on the oxygenation capacity of the system, whereas varia
tion of the head and the well depth are the prime parameters control
ling the amount of gas absorbed. Figure 3.37 indicates the influence
of these parameters on the efficiency coefficient
K = (c - c )/(c - c ), where c refers to atmospheric pressure. It is c \j »vj u so
seen that with a depth of 15 m an efficiency coefficient of greater
than 0,9 is obtained. With deeper wells (depth some 20 m) a K-value
of greater than 1,0 may be obtained even, indicating that super-
saturation will be reached. Referring to the small heads applied
(see figure 3.37) it is evident, that the deep well aeration seems to
be the most efficient system for oxygenation of water. The oxygenation
efficiency varies depending on the well depth and the rate of flow
from 0,7 to 1,8 mg Q^J (2,5 to 6,5 kg 02/kWh).
Since the ratio of air to water flow RQ is very small, deep well
aeration is not efficient in removing gases. The efficiency coeffi
cient K for removing carbon dioxide, for instance, has been found as
low as some 0,1 to 0,15-
depth: k,3 m
8,6 m
11,6 m
15,3 m
0,3 0,4 Ofi 0,6 0,7 0,8 0<t \fi
*- efficiency coefficient K
Fig. 3.37 RELATIONSHIP OF TUBE DEPTH TO EFFICIENCY
•*"»
a 3 0,78
Si
01
£ (0 co O L S O
u o<
025
/ /
i
/ / ' J
/ / .
/ / / / / ' /
/ / /
f t
' /
1 1
1 1
1 1
1 1 i
1 t 1
/ /
'7 / .
/ /
J ' ' t ! !
/
/ •

%
123
3.1* Mechanical or Surface Aeration
3- 1 General Considerations
Mechanical aeration is performed by rotating devices which are slight
ly submerged into the water and thereby effect spreading of the water
above the water surface. This action at the same time enforces a
spirally shaped flow of the water within the tank, the pattern of
which depends on the geometry of the aeration device and the tank.
The exchange of gases by the described action of mechanical aerators
is achieved by several mechanism: '
1. By spreading of the water in the form of droplets and/or water
films above the water surface a large interfacial area is created.
2. By reentering of the spread droplets and films of water into the
bulk of the tank content the gases absorbed at their surfaces are
mixed with the bulk of the water. Furthermore bubbles are entrained
when the spread water submerges into the tank content, an effect
similar to that observed in weir aeration (section 3.11), however
less pronounced due to the low height of fall.
3. An entrainement of bubbles into the water is achieved by the ro
tating aeration device itself. At certain points of the device the
velocity of the water is great enough as to locally produce a par
tial vacuum by which the entrainement is caused. Some devices are
especially equipped to promote this additional effect of gas trans
fer.
U. The pattern of flow in the tank induced by the aerator furnishes a
steady renewal of the water surface of the tank, assisting in gas
exchange. Moreover the spiral like flow pattern is frequently of
a velocity great enough to carry the entrained bubbles downwards,
which leads to a longer time of contact between bubbles and water.
High streaming velocities of the water in the same direction as
the peripheral motion of the aerating device are to be avoided.
Thereby the velocity difference between water and aerator decreases,
may eventually approach zero, and the above major mechanisms of
gas transfer are minimized.
Thus it is seen, that a variety of mechanisms cause the exchange of
gases in mechanical aeration. The alternative term of "surface aera
tion" refers only to the mechanisms mentioned under 1 and partially
124
under 2. The greater the share of the total gas transfer by these
mechanisms is, the more is the term "surface aeration" justified. A
quantitative measure for this effect may be the flow of water (m /s)
spread by the aerators by its "pumping action". The other mechanisms
causing gas transfer are strongly dependent on the size and shape of
the aeration tank which mainly determine the flow pattern.
Mechanical aeration is primarily used for oxygenation of the mixed
liquor in activated sludge treatment. Comparing mechanical aeration
with air diffusion, some of the more obvious advantages of mechanical
aerators are the elimination of several appurtenances of the diffused
air system such as piping, branching of pipes, valves, blowers or
fans, air filters etc. Moverover the mechanical aerator is also
generally more maintenance free and does nbt need the high degree of
attention that is required for cleaning of the diffusers. These ad
vantages have led to almost an explosion of marketed types of mecha
nical aerators, the end of which seems not yet to be within sight.
This development has been promoted by the fact, that mechanical
aerators can easily be float mounted and thus conveniently be applied
in larger tanks or for aeration of lagoons or surface waters.
Basically, the types of mechanical aerators may be differentiated as
follows (compare section 1.2)
1. Rotor aerators (formerly referred to as "brushes"), consisting- of
a horizontal revolving shaft with combs, blades or angles attached
to it which are slightly dipping into the water.
2. Cones, impellers or turbines revolving round a vertical shaft. The
cones may be further subdivided into the following types:
2.1 Plate types
discharging the water in radial direction at the tank surface
at high velocity which leads to a peripheral hydraulic jump.
Both effects cause a rapid renewal, of the air-water interface
• and partially also air entrainement.
2.2 Updraft types
actually acting like a pump, discharging large quantities of
water at the surface at relatively low heads.
2.3 Downdraft types
a unit where oxygen is supplied by air selfinduced from a
negative head produced by the rotating element. Due to this
entrainement of air, being the prime mechanism of gas transfer,
the downdraft types are no surface aerators.

125
The oxygen transfer efficiency of mechanical aerators is generally
stated in g of oxygen transferred per aerator per second, (or kg C^/h),
being equivalent to the oxygenation capacity (OC) as defined by eq.
2.65- Prime factors influencing the oxygenation capacity are the size
of the aerator, the depth of submergence; the speed of rotation.
Concerning the size, the diameter gives sufficient information for
cone-type aerators, mentioned under 2, whereas the oxygenation capa
city for rotors is generally related to their diameter and a rotor
length of 1 m.
Increasing these controlling parameters will generally increase the
oxygenation capacity (OC), but will vary the oxygenation efficiency
OE (mg 0 /J) in such fashion as to provide optimum conditions at a
certain magnitude of rotational speed and submergence as is qualita-
tively shown in figure 3-38. At magnitudes of the controlling para
meter below the optimum values, the oxygenation capacity OC generally
increases with increasing the size of the aeration device, expressed
by its diameter D , the depth of immersion d., and its peripheral
speed v • Generally, this increase may be approximated by the follo
wing relations concerning
a) the size of the aerator OC « D c
b) the depth of immersion OC « d.
c) the peripheral speed OC <* v n
with 2,5 < n < 3,0
-»» depth of immersion (m)
— freeboard (m)
~» rotational speed (rps)
••• peripheral speed (m/s)
Fig. 3.38 SCHEMATIC SHOWING EFFECT OF SPEED AND SUBMERGENCE ON OXYGENATION EFFICIENCY

126
As already has been mentioned, also the pattern of flow and its velo
city are of significant influence on the oxygenation capacity. Both
parameters are primarily modified by the size and the geometry of the
tank, keeping the size of the cone, its rotational speed and depth of
immersion constant. Quantitative measures for these influences are
the velocity difference between water and the aerator periphery and
the ratios of aerator diameter D over the tank width w (D /w) and c c
over the tank depth d (D /d).
Applying well shaped aeration tanks, the size then will have a great
influence on the oxygenation capacity achieved with a surface unit.
Generally speaking, the larger the tank is, the smaller are the velo
cities of the induced spiral flow and the less pronounced are the
transfer mechanisms mentioned under point h.
A quantitative measure for this influence is the amount of energy
dissipated per unit tank volume e (W/m ) which will be seen to be
of significant influence on the oxygenation efficiency OE (mg 0 /j)-
Concerning the influence of hydrophobic and surface active matter on
the oxygenation capacity of mechanical aerators it may be stated,
that the turbulence in the region of the aerator is generally large
enough to prevent reformation of a layer of such substances at the
produced air-water interfaces (compare section 2.3U). Thus the posi
tive effects of surface active agents on gas transfer will prevail
and cause an increase of the oxygenation capacity with increasing
content of surfactants. On the other hand, the effect of the entrain
ed air bubbles on gas exchange will generally be lowered by the
presence of surfactants, as was evident for air diffusion systems.
The sum of both effects leads generally to a much less pronounced
decrease of the rate of gas transfer by surface active matter than in
bubble aeration; frequently such substances will even increase the
oxygenation capacity of a surface aerator.
In the following sections the mentioned types of mechanical aerators
are covered in detail giving due attention to their construction and
operation, to their oxygenation capacity, to the commonly applied
tanks, and to practical aspects of operation.
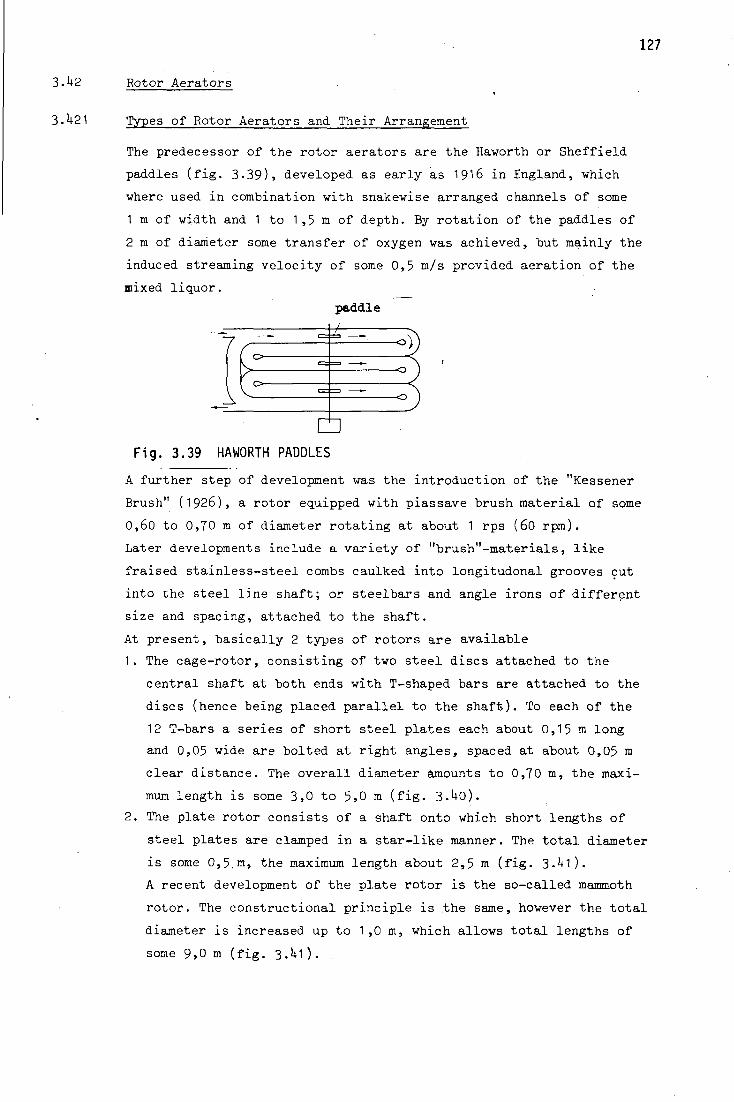
127
H2 Rotor Aerators
U21 Types of Rotor Aerators and Their Arrangement
The predecessor of the rotor aerators are the Haworth or Sheffield
paddles (fig. 3.39), developed as early as 1916 in England, which
where used in combination with snakewise arranged channels of some
1 m of width and 1 to 1,5 n of depth. By rotation of the paddles of
2 m of diameter some transfer of oxygen was achieved, but mainly the
induced streaming velocity of some 0,5 m/s provided aeration of the
mixed liquor.
paddle
-/
1 r >
1 1^ Fig. 3.39 HAWORTH PADDLES
A further step of development was the introduction of the "Kessener
Brush" (1926), a rotor equipped with piassave brush material of some
0,60 to 0,70 m of diameter rotating at about 1 rps (60 rpm).
Later developments include a variety of "brush"-materials, like
fraised stainless-steel combs caulked into longitudonal grooves cut
into the steel line shaft; or steelbars and angle irons of different
size and spacing, attached to the shaft.
At present, basically 2 types of rotors are available
1. The cage-rotor, consisting of two steel discs attached to the
central shaft at both ends with T-shaped bars are attached to the
discs (hence being placed parallel to the shaft). To each of the
12 T-bars a series of short steel plates each about 0,15 m long
and 0,05 wide are bolted at right angles, spaced at about 0,05 m
clear distance. The overall diameter amounts to 0,70 m, the maxi
mum length is some 3,0 to 5,0 m (fig. 3.^0).
2. The plate rotor consists of a shaft onto which short lengths of
steel plates are clamped in a star-like manner. The total diameter
is some 0,5,m, the maximum length about 2,5 m (fig. 3.M).
A recent development of the plate rotor is the so-called mammoth
rotor. The constructional principle is the same, however the total
diameter is increased up to 1,0 m, which allows total lengths of
some 9,0 m (fig. 3.U1).

128
E E
8
O I— o I
Ul
<
CD
DC CO
ITS
O
O)
CD Q
CO
or o I — o 0£.
I U l
<
o

129
Fig. 3.41 a PLATE-ROTOR
3^%:^/;wr^s^ ,^"--*.iY^'.v«W:
Fig. 3.41 b MAMMOTH-ROTOR

Rotors are applied in connection with two typer. of tanks:
1 . A tank cf rectangular or round cross-section, with the brushes
placed along one side of the tank length. The rotors then induce
a spiral flow which is rectangular to the displacement velocity
of the mixed liquor through the tank (fig. 3.^2). For this type
of tank generally plate rotors or mammoth rotors are applied al
though cage-rotors have been used also.
To achieve thorough mixing all over the cross-section guide baffl
are frequently required which force the water velocity induced at
the tank surface into the deeper parts of the tank (fig. 3. *2 a
+ b with so-called pressure baffles). Rectangular tanks are addi-
tionaly equipped suction baffles under the rotor, (fig. 3.^2 c
+ d) which assist in achieving a good mixing also with this type
of cross-section.
With plate rotors the cross-section is generally square, whereas
with mammoth rotors the width may be increased to twice the depth
without serious decrease of proper mixing conditions.
The rotors may be covered with easily removable splash-guards.
baff le
= 13,0 m
(a)
BRUSH AERATION 0 0.52 m
"t? 3 m B 3 m 6
3 m
>>/>f7///*}>>>>>>f>>f.
AERATION TANK
b a f f l e
A = U,0
MAMMUT-R0T0R 0 1.0 rn
rzzr •77*. ' . %rT77,»>.<> <>,.;>»l>.< >.->< f//•>&>>,>>„»
PROPOSITION-AERATION TANK
(C) (d)
Fig. 3.42 ARRANGEMENT OF ROTOR AERATORS (ROTOR SHAFT IN DIRECTION OF DISPLACEMENT VELOCITY)

131
2. A long circuit-like tank of rectangular or trapezoidal cross-
section. One or more rotors are arranged across the circuit chan
nel and induce a longitudinal velocity great enough for proper
mixing of the mixed liquor (fig. 3.^3a). Classical examples of
this types of tank are the Haworth channel (although without
rotors) and the oxidation ditch (fig. 3.^3t>). For this type of
tank the cage rotor and the mammoth rotor are primarily applied.
In order to achieve proper mixing all over the cross-sectional area the
depth of either tank type has to be limited to some 3,50 m. The ditch-
type tank, when operated with cage-rotors, should not exceed a depth
of 1,50 to 1,60 m.
00
03
>m
r L £
: i
0 1.0 m
•
i , 100 m
1
l
I
/
i Fig . 3.43 a CHANNEL-LIKE TANK WITH MAMMOTH-ROTORS
effluent
raw sewage
F ig . 3.43 b OXYDATION DITCH WITH CAGE ROTOR

132
3.1+22 Factors Influencing the Rate and Efficiency of Oxygen Transfer
The main mechanisms of gas transfer by rotor aeration are:
- whipping of air bubbles into the water by the blades of the rotor;
- spreading of the water in the form of droplets over the water
surface in front of the rotor;
- inducing a circular or longitudinal streaming velocity
possibly guided by baffles, which renews the water surface and
submerges the entrained air bubbles.
The main factors which determine the oxygenation capacity achieved
by these mechanisms are the peripheral spe'ed of the rotor v (m/s), IT
the depth of submergence of the blades of the rotor d. (m). Generally
the oxygenation capacity per m of rotor length (OC ) increases in
proportion to the depth of immersion d. and to some power of the
peripheral speed v :
QC, = K . v p . d. (g CL/s.m of rotor length) (3.2H) 1 r p 1 2
where K = a constant depending on the specific rotor construction
and the tank geometry
?> = exponent
For a tank of square cross-sectional area (3,0 m width and 3,0 m
depth) equipped with pressure and suction baffles, for instance, the
above constants for a plate type rotor of 0,52 rr. total diameter were
found to be K = 1,33 and 6 = 2,6 at depths of immersion of 0,0U <
d. <_: 0,1*4 m and. peripheral velocities of 1,8 <_ v < 2,h m/s. From I • p ---
further investigations it may be concluded that especially K is
strongly dependent on the specific conditions of rotor ana tank con
struction, whereas much less variation of the exponent £ is to be
expected.
Since the gross power required generally increases in proportion to
the depth of immersion d. and to the second power of the peripheral 2 . 1
speed (v ), it is evident from equation 3.2*4 that variation of the
depth of immersion d. will not alter the oxygenation efficiency 0E
significantly, whereas the difference of the exponents of v refering P
to OC and the gross power indicates, that the oxygenation efficiency

133
OE will increase with increasing peripheral speed v . This would call
P
for very high numbers of revolution of the rotor. In practical opera
tion, however, an upper limit is set due to the fact that hydrophic
and surface active matter reduce the spiral velocity of the tank at
high rotational speeds.
Frequently the spiral flow is confined to the upper part of the tank,
the content of which renders into a dispersion of fine bubbles in the
water, rotating above the water of the lower part of the tank;. This
effect may be strongly reduced by the baffles, but nevertheless an
"optimum" peripheral speed can be established in terms of maximum
oxygenation efficiency. An example is given in figure 3.UU, indicating
v = 2,k m/s to be optimum for a square tank.
>> o c 4)
•H O
•H <H <H
a> a o
0,5
0,4
O 0,3
S 3 c a> w go o & o A
0,2
0,1
"£3-52 CtTl
o 1,5 2,0 2,5 3,0 3,5
-•peripheral speed v (m/s) XT
Fig. 3.44 OXYGENATION EFFICIENCY OF A PLATE ROTOR ARRANGED IN A TANK OF QUADRATIC CROSS-SECTION
The rotational speed nowedays applied is generally set by the manu
facturers. Plate rotors with a total diameter of 0,50 m are mostly
designed for 2,0 rps (120 rpm), giving v = 3,1U m/s, the depth of
immersion being varied from 0,05 to 0,15 m; cage rotors for
1,25 to 1,33 rps (75 to 80 rpm), with 2,75 <, v 4 2,93 and a range
for di of some 0,10 to 0,20 m; whereas large rotors of 1 m of dia
meter are manufactured for 0,88 rps (53 rpm) corresponding to v =
2,77 m/s and for 1,20 rps (72 rpm) which is equivalent to v = P
3,77 m/s, with a depth variation from 0,10 to 0,30 m.
Within the variations caused by the size and geometry of the tank the
following empirical equations are given to estimate the oxygenation
capacity per m length of rotor.

a) Plate rotor (see figure 3.1*5; data taken from large municipal
plant,tank according to figure 3.1+2b with a cross-sectional area 2
of 6,5 m and a rotor length of 0,82 m per m of tank length):
0C = - 0,070 + 3,8 . d. g 0 /m.s (3.25)
0,25 + 13,7 • d. k g °2 / m- h
0.10;
OyM
no
o
0,06
ll 0,04
0,02 /
/ /
f J
io#d
/W( > cross-sectional area: 6,5 m
rotor length: 0,82 m per meter of tank length
0|p5 0,10 0,15
• depth of immersion d. (m)
Fig. 3.45 OXYGENATION CAPACITY OF PLATE ROTORS (diam. 0,5 m,2 rps) AS MEASURED AT A LARGE MUNICIPAL PLANT
b) Cage rotors (see figure 3.U6; data from manufacturer for 1,25 rps
= 75 rpm)
0C = - 0,61 + 9,1 • di g 02/m.s (3.26)
2,2 + 32,8 . d. kg 02/m.h
c) Large rotor (see figure 3.1+7, data for mammoth rotor given by
manufacturer for 72 rpm)
for 0,10 d. < 0,20 m
0C = - 0,11 + 11,7 • di g 02/m.s 13.27)
= - 0,1+ + U2,0 . d. kg 0 /m.h

135
2 0,14 0,16 0,18 Q20 Q22
depth of immersion d. (m)
Fig. 3.46 OXYGENATION CAPACITY PER METER LENGTH OF A CAGE-ROTOR
(data from manufacturer for 0,70 m diam. and 1,25 rps = 75 rpm)
As is seen from fig. 3.^7S the oxygenation capacity increases less
than proportional to d. for depths of immersion above 0,20 m.
The oxygenation efficiency for all three types is a"bout 0,55 mg 0 /J
2 kg 0 2
<M O
E
ft
-p
o cd ft
o
a o •H -P cd
gen
>> X o
/ kWh) .
tn
B
> 3 , 0 bO
~ 2.5 H
O o
2,0 .c -p - _
ff V> 0)
H
jj 1.0 -p O u 0,5
t 0,1 0,2 0,3 m
depth of immersion d. (m)
Fig. 3.47 OXYGENATION CAPACITY OF A MAMMOTH-ROTOR (data from manufacturer
for 1,0 m diam. and 1,2 rps = 72 rpm at depths of 2,5 to 3,0 m)

136
The presence of detergents or hydrophobic matter generally increases
the oxygenation capacity OC and the efficiency OE. Depending on the
depth of immersion and the induced pattern flow :.he increase of the
oxygenation capacity may be as high as some 80 %, that of the
oxygenation efficiency somewhat less.
Example: Estimate the total length of
a) plate rotors and b) mammoth rotors to supply the oxygen requirement
of an activated sludge treatment plant, which amounts to U5 g 0o/s as
daily average. Select the depth of immersion in order to meet the
expected hourly variations of the oxygen demand ranging from 0,70 to 3 3
1,30 of the daily average. Assume c =10 g/m , 2 g 0 /m to be maintained in the aeration tank and a = 1,0. Estimate the average power
-0 <
dissipation e (W/m ), assuming an average oxygenation efficiency of 3
0,55 mg 0 /J (2 kg 0„/kWh) and a total tank volume of 1000 m .
a) Plate rotors
The maximum oxygen demand is 1 ,3 . 5 = 58,5 g 0o/s for which d.
is chosen at max d. = 0,15 m. At operational conditions the (0C )
of the rotor is (0C ) = 0C . a (c - c)/c = 0C_ . 1 , 0 . (l0-2)/10 1 op J. s s i
= 0,8 OC . The total rotor length 1D may be obtained bv
using eq. 3.25: 58,5 = 0,8 . 0C1 . 1R = 0,8 . 1R . (-0,070 + 3,8.0,15)
1R = IU7 m
With the maximum rotor length of 2,5 m this would require 1)47/2,5
= 58,8, hence 59 rotors, each 2,5 m long.
Similarly, the depth of immersion at minimum oxygen demand of
0,7 . *+5 = 31,5 g 0 /s may be estimated from
31,5 = 0,8 . 1U7 (-0,070 + 3,8 . d.)
which yields
d. = 0,089 m 1
Since the construction length including bearings of the rotor is
some 3,0 m, the 59 rotors require a tank length of 59 . 3,0 =
177 m, which corresponds to a cross-sectional area of 1000/177 =
5,6 m . The tank may be shaped according to figure 3.'+2fc.

137
b) Mammoth rotor
For the peak oxygen demand of 58,5 g 0 /s a depth of immersion of
d. = 0,30 is chosen. According to figure 3.^7 the OC amounts
to 2,9 g 0 /m.s.
Hence
2,9 . 1,0 . lj~- . 1R = 58,5
which yields
1 R=25,2
To estimate d. for the minimum oxygen demand eq. 3.27 is applied:
31,5 = 0,8 . 25,2.(-0,11 + 11 ,7 . &±)
from which follows
d. = 0,11* m l
The design would include 6 mammoth rotors of 1*,5 m length each,
arranged in a channel-like tank according to figure 3.1*3a with a
total width of 2.(U,5+1,0) = 11 m. Taking a depth of 2,5 m the
length of the tank would be 1000/11 . 2,5 = 37 m.
The average power dissipation, based on 0,55 mg 0 /J and 1*5 g 0 /s
amounts to 1+5/0,55-10~3= 82000 J/s = 82 kW.
Hence the power dissipation per unit volume is
e_ = N_/V = 82 . 1000/1000 = 82 W/m3. (J G
o
From the oxygen demand and per unit volume (1*5 mg/m .s) and the 3 power dissipation e_ = 82 W/m it is evident that the example is
based on a high-rate activated sludge process. With low-rate or 3
extended aeration installation e may be as low as 10 W/m . G
3.1*23 Practical Aspects
The great advantage of rotor aerators, as compared to air diffusers
for instance, is the fact, that due to the simple and open construction
clogging cannot occur. On the contrary, the intensive mechanical
action of the rotor works somewhat like a comminutor, disintegrating
solid matter with exception of rubber, plastic and leather pieces.
Hence, rotor aeration may be applied without primary sedimentation
138
(oxidation ditch). A disadvantage of the rotor construction are main
ly the bearings, which require careful maintenance. Water (or mixed
liquor) lubricated bearings, primarily used in former times, are
nowedays replaced by fat-pressure bearing. Since moreover the develop
ment of large rotors with construction lengths up to 9 m reduced the
number of bearings significantly, the maintenance problem of bearings
seems to be solved.
The variation of the oxygenation capacity by changing the depth of
immersion of the rotors is generally achieved by an adjustable out
let weir of the aeration tank, although adjusting the height of the
total rotor construction is also been used in connection with cage
rotors for oxidation ditches. The number of revolutions is generally
kept constant. But motors with pole changing windings have also
been applied to enable two different peripheral speeds to be applied.
Furthermore the oxygenation capacity may be adjusted to the oxygen
demand by switching off or on of rotor units, in case several are
installed. Care should be taken then, however, to maintain a streaming
velocity and mixing conditions which prevent solids from settling.
Appropriate baffling may assist such efforts by diverting the
velocity primarily induced at the surface region of the tank into
its lower parts. This will generally increase the oxygenation
efficiency OE somewhat, at the same time.
3.^3 Cone Aeration
3. 31 Types of Cones and Their Arrangement
Contrary to rotors cones are mounted on a vertical shaft. Therefore,
they are generally arranged within a tank of square or round horizon
tal cross-section. Several tank units may be combined to a large
tank. This arrangement induces two spiral motions overlapping each
other to a complex pattern of flow. The first type is caused by the
"pumping" and/or radial discharge action of the cone, producing an
upward flow in the tank center and a downward flow near the tank
walls (vertical spiral flow). The second type of motion is a slow
rotation of the total tank content induced by the rotation of the
impeller (horizontal spiral flow). From the previous discussion of
the mechanism of gas transfer by mechanical aeration it is obvious,

139
that the vertical spiral flow significantly controls the rate of gas
transfer, whereas an increase of the horizontal spiral flow decreases
the velocity difference between water and cone periphery and thus
decreases the oxygenation capacity and efficiency. Frequently, the
tank is equipped with baffles in order to minimize the horizontal
spiral flow.
Cone aeration is also applied in connection with a special type of
oxidation ditch (type carrousel, fig. 3.U8). The basic principle is
also a round or square tank, but to one side two long channels are
connected, which provide the large tank volume required for oxidation
ditches. This, obviously, then leads to a longitudinal flow pattern
rather than to a spiral one. In other words: The horizontal spiral
flow induced by the cone is transformed to a longitudinal flow by
means of the middle wall extending up to the cone periphery.
Finally cone aeration is extensively used in aerated lagoons and for
reaeration of surface waters. For this purpose the aerators are
frequently float mounted, whereas for the other types of application
bridge mounting is the design of preference, although some of the
cone types used in large tanks are float mounted.
The tank dimensions for optimum oxygen transfer and operation depend
primarily on the size of the cones, ranging from some 0,U0 m to
H,50 m; and secondly on the type of cone. These aspects will more
fully be covered in section 3.^32.
I-I.
i- r.
[JLfJLj
Fig. 3.48 LARGE OXIDATION DITCH (TYPE CARROUSEL) OPERATED WITH CONE AERATORS

140
In the following section some of the marketed aerators are described.
Although it is tried to mention the cones in the order of types
(plate-, updraft-, dovmdraft type), these underlaying principles
overlap and are sometimes used in combination.
3.1*311 Plate Aerators
The best known plate aerator is the Vortair-Cone which consists of a
circular flat plate with 20 to 30 vertical blades attached at the
periphery of the plate (fig. 3- +9) • The angle of the plates with the
radius is adjustable from 0° to 25°. Openings behind the blades faci
litate entrainement of air.
Fig. 3.49 SCHEMATIC REPRESENTATION OF A PLATE TYPE AERATOR (VORTAIR-CONE)
The Vortair-Cone is manufactured in 16 different sizes ranging from
0,1*0 to 1*,5 m in diameter. The cone uses a standard motor and gear
drive unit. The gross power input varies within the above range of
sizes from 0,75 to 75 kW.
As already mentioned, the oxygen transfer is basically achieved by
two mechanisms. At rotation of the cone slightly below the water level,
the water is radially discharged which leads to a peripheral hydraulic
jump. At optimum rotational speed the top plate is clear of water and
air is entrained through the openings due to the low pressure behind
each of the blades. This second effect accounts for some 10 % of the
oxygenation capacity.
Although the Vortair-Cone has originally been developed for aeration
of ponds and lagoons, it has sucessfully been applied in conventional
activated sludge treatment at tank depths 2,0 to 3,5 m depending on
the cone size. At greater depths the oxygenation capacity generally
decreases.

141
3.U312 Updraft Aerators
The updraft type is the most common cone aerator. The variety of up
draft types marketed requires a further subdivision into types
working according to somewhat different principles: although the com
mon principle is a pumping action, there is a certain difference in
the way of discharging the water: either the water is issued in the
form of large jets onto the water surface at low head (jet aerators)
or it is sprayed. In the first case the cone somewhat resembles an
impeller of a centrifugal pump, in the second case a vane-type pump
is submerged issuing the water at an orifice in an exposure pattern
formed by the diffuser. The jet aerators apply open and closed im-
peller cones. The pumping action of the closed units is somewhat
superior but they are more likely to clogg. Finally, the updraft may be
guided by draft tubes which permits greater tank depths to be applied.
The following updraft aerators will be discussed:
Simcar-Cone : an open impeller (jet aerator without
draft tube)
Gyrox-Cone : open and closed impeller (jet aerator) without
draft tube '
Simplex-Cone : 3 closed types of impellers (jet aerators) with
draft tube, partially combined with plates
peripherally mounted on the impeller to produce a
hydraulic jump
BSK-Turbine : a open and closed impeller unit (jet aerator) without
draft tube
Hamburg-Rotor: a rotating draft tube with 6 to 10 radially mounted
discharge tubes (jets) and, plates for inducing
a peripheral hydraulic jump
Aqua-Lator : a closed spray aerator
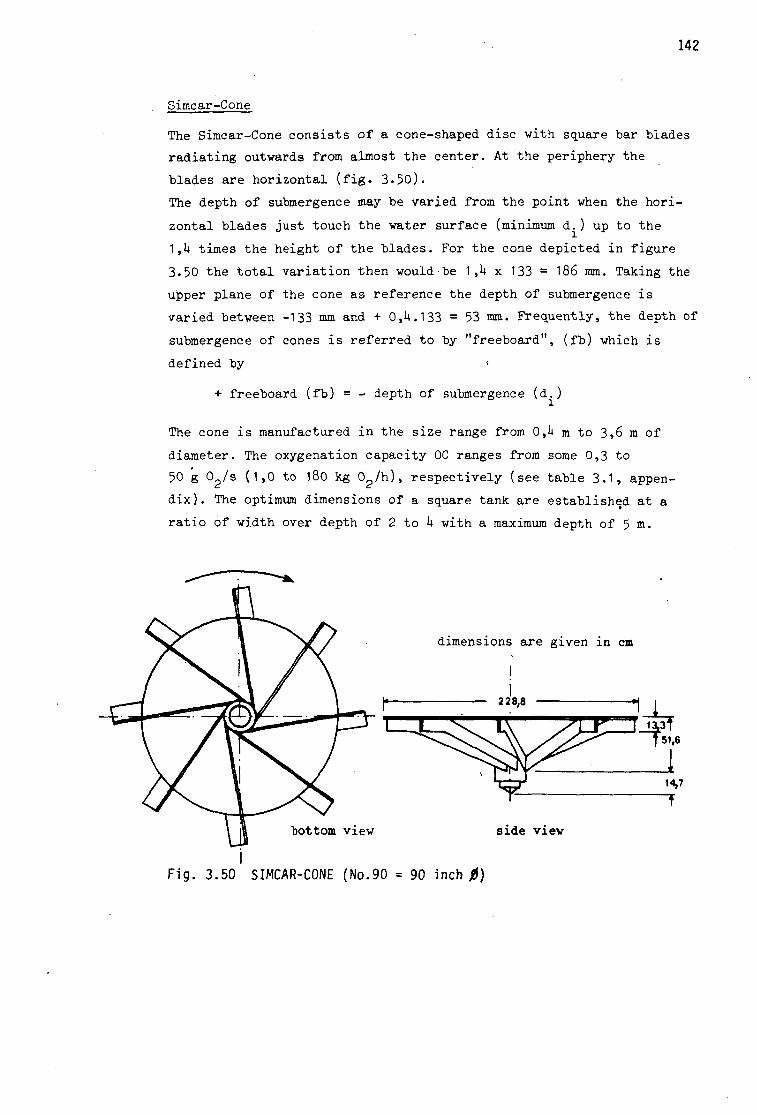
142
Simcar-Cone
The Simcar-Cone consists of a cone-shaped disc with square bar blades
radiating outwards from almost the center. At the periphery the
blades are horizontal (fig. 3.50).
The depth of submergence may be varied from the point when the hori
zontal blades just touch the water surface (minimum d.) up to the
1,U times the height of the blades. For the cone depicted in figure
3.50 the total variation then would-be 1,h x 133 = 186 mm. Taking the
upper plane of the cone as reference the depth of submergence is
varied between -133 mm and + 0,^.133 = 53 mm. Frequently, the depth of
submergence of cones is referred to by "freeboard", (fb) which is
defined by <
+ freeboard (fb) = - depth of submergence (d.)
The cone is manufactured in the size range from 0,1* m to 3,6 m of
diameter. The oxygenation capacity 0C ranges from some 0,3 to
50 g 02/s (1,0 to 180 kg 02/h), respectively (see table 3.1, appen
dix). The optimum dimensions of a square tank are established at a
ratio of width over depth of 2 to h with a maximum depth of 5 m.
dimensions are given in cm
side view
Fig. 3.50 SIMCAR-CONE (No.90 = 90 inch iJ)
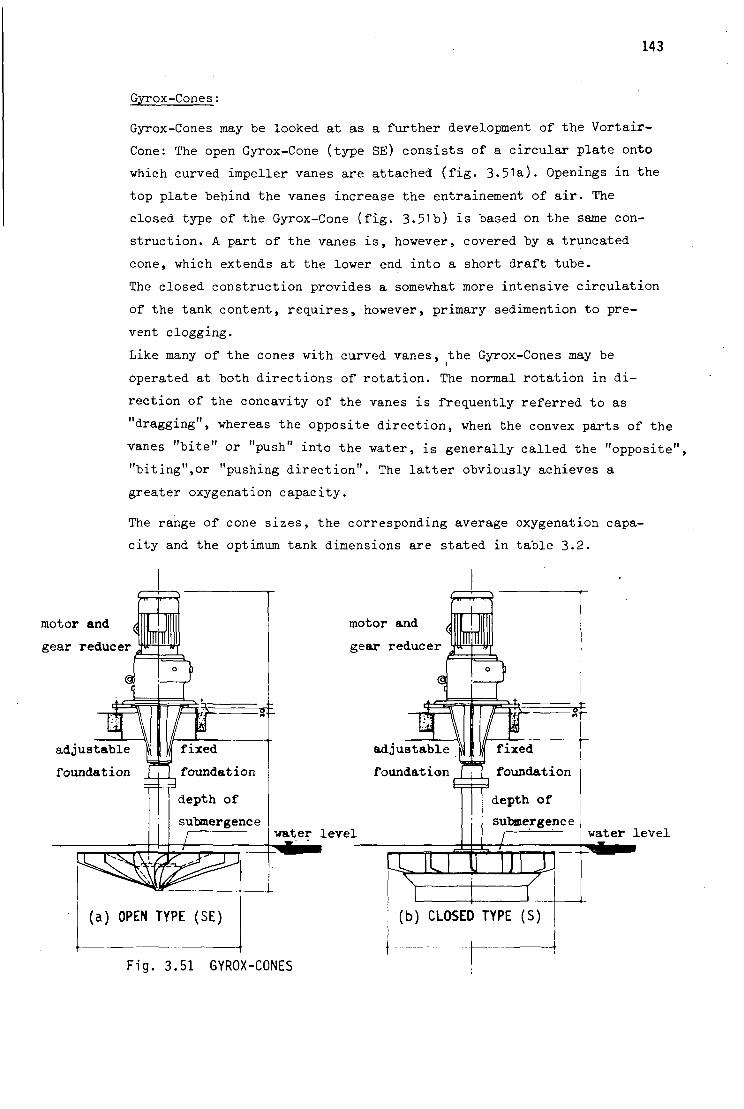
143
Gyrox-Cones:
Gyrox-Cones may be looked at as a further development of the Vortair-
Cone: The open Gyrox-Cone (type SE) consists of a circular plate onto
which curved impeller vanes are attached (fig. 3.51a). Openings in the
top plate behind the vanes increase the entrainement of air. The
closed type of the Gyrox-Cone (fig. 3.51b) is based on the same con
struction. A part of the vanes is, however, covered by a truncated
cone, which extends at the lower end into a short draft tube.
The closed construction provides a somewhat more intensive circulation
of the tank, content, requires, however, primary sedimention to pre
vent clogging.
Like many of the cones with curved vanes, the Gyrox-Cones may be
operated at both directions of rotation. The normal rotation in di
rection of the concavity of the vanes is frequently referred to as
"dragging", whereas the opposite direction, when the convex parts of the
vanes "bite" or "push" into the water, is generally called the "opposite",
"biting",or "pushing direction". The latter obviously achieves a
greater oxygenation capacity.
The range of cone sizes, the corresponding average oxygenation capa
city and the optimum tank dimensions are stated in table 3.2.
motor and
gear reducer
adjustable
foundation
j fixed
El foundation depth of
submergence water level
(a) OPEN TYPE (SE)
motor and
gear reducer
Fig. 3.51 GYROX-CONES
adjustable
foundation | j | foundation
CE
depth of
subanergenc e water level
o ; (b) CLOSED TYPE (S) I
'— 1

Simplex-Cones:
The basic type (type HL) consists of an open-ended conical shell
formed out of steel plate, to the inner face of which a number of
specially shaped blades are attached. The conical shell extends at
the lower end into a ring, which covers the stationary draft tube of
the tank. On the top of the vanes an annular ring is welded. Into
this ring a number of short stays are fitted, which support the cone
from the driving ring attached to the gear head (see figure 3.52).
The type Simplex-S is essentially like the HL-type but a number of
steel blades are fixed to the outer part of the conical shell addi
tionally (fig. 3.53)- Thereby, not only the pumping action of the
inner construction but also the turbulence of the water surface in
duced by the outer ribs assists in transferring oxygen. Obviously,
the oxygenation capacity of the S-type is superior to that of the
HL-type.
dimensions in cm
(a) SIMPLEX-CONE WITH DRAFT TUBE (b) SCHEMATIC REPRESENTATION OF THE SPIRAL FLOW INDUCED BY AN UPDRAFT-CONE (SIMPLEX)
Fig. 3.52 SIMPLEX-CONE

SL
^ ^ ^ ^m? ^ ^
HL - type S - type SL - type
Fig. 3.53 TYPES OF SIMPLEX-CONES
A further increase of the oxygenation capacity is achieved by the
SL-type, which is mainly a completely closed impeller (fig. 3-53),
discharging water jets at low head. The channels of the impeller are
large to prevent clogging.
The E-type is based again on the HL-type, however a circular plate
of a diameter greater than the cone covers the blades (see figure
3.5M- This plate disintegrates the discharged water jets to some
degree, creating a larger interfacial area between air and water.
The Simplex types are manufactured in sizes from 0,6 to 3,0 m of dia
meter. They may be arranged to adjust the freeboard or fixed (fig.
3.5M• The range of variation of the depth of submergence is limited
by stationary draft tube (see also table 3.3, appendix).
W///M}^////////^
(a) with decontrol (b) f ixed
Fig. 3.54 SIMPLEX-CONE TYPE E

Due to the action of the draft tube tanks equipped with Simplex-Cones
are generally deeper than with other cones. The optimum ratio of width
to depth for square tanks ranges from 2 to 3- With very shallow tanks
or for aeration of lagoons or surface waters the stationary draft tube
may be omitted.
BSK-Turbines:
The BSK-Turbine is a cone-like impeller made out of glasfiber rein
forced polyester. With the open type, named Gigant, the impeller chan
nels are formed by open T-like beams situated at the bottom side of
the cone '(figure 3.55a), whereas with the closed type (Favorit), the
channels are covered (fig. 3-55b) giving rise to an increased pum
ping action of the impeller. The top plate of the closed type contains
holes for entrainement of air.
Both turbines are operated in the normal directions of rotation as
well as in the "biting" direction for achieving higher oxygenation
capacities.
The open type is produced in sizes from 0,75 to 2,0 m of diameter with
a range of oxygenation capacities from some 0,3 to 28 g 0o/s (i to
100 kg 0 /h), the closed type from 0,5 to 3,15 m and 0,3 to 100 g 09/s
(1 to 370 kg 0^/h), respectively (see table 3.lt, appendix).
For optimum oxygen transfer the ratio of width to depth of square
tanks should be in the range of 2,5 to ^,5- At greater depths a cone
situated at the tank bottom under the aerator is installed to provide
I
(a) OPEN TYPE (GIGANT) (b) CLOSED TYPE (FAVORIT)
Fig. 3.55 BSK-TURBINES
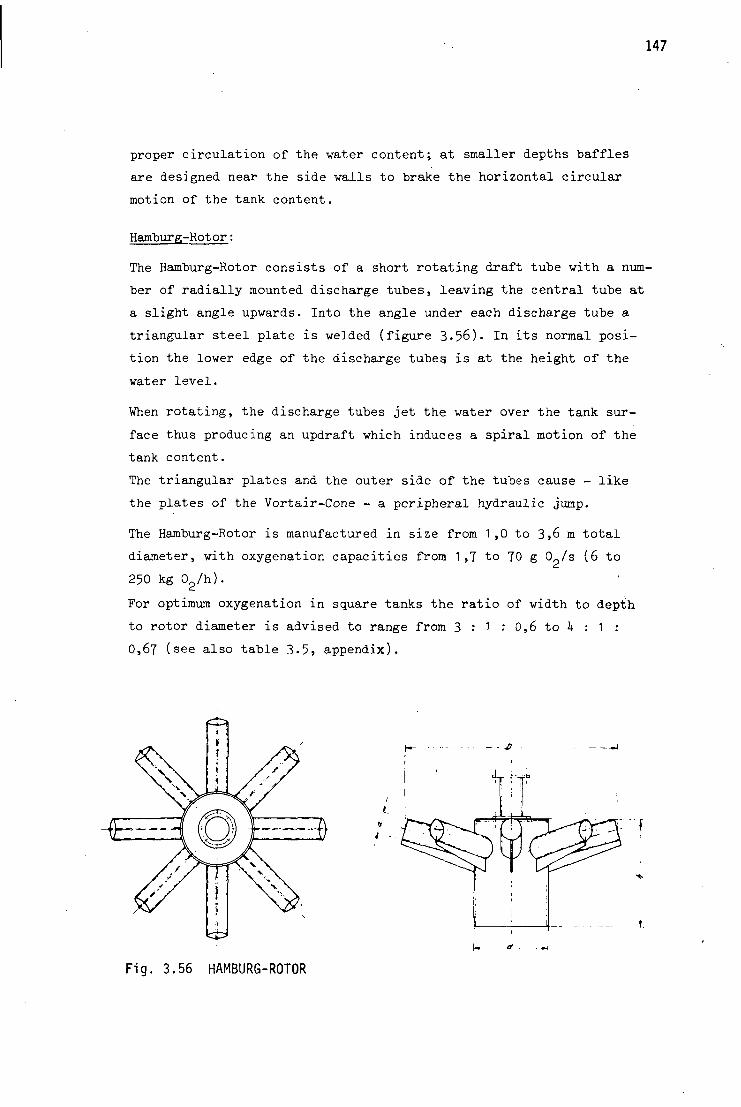
147
proper circulation of the water content; at smaller depths taffies
are designed near the side walls to brake the horizontal circular
motion of the tank content.
Hamburg-Rotor:
The Hamburg-Rotor consists of a short rotating draft tube with a num
ber of radially mounted discharge tubes, leaving the central tube at
a slight angle upwards. Into the angle under each discharge tube a
triangular steel plate is welded (figure 3-56). In its normal posi
tion the lower edge of the discharge tubes, is at the height of the
water level.
When rotating, the discharge tubes jet the water over the tank sur
face thus producing an updraft which induces a spiral motion of the
tank content.
The triangular plates and the outer side of the tubes cause - like
the plates of the Vortair-Cone - a peripheral hydraulic jump.
The Hamburg-Rotor is manufactured in size from 1,0 to 3,6 m total
diameter, with oxygenation capacities from 1,7 to 70 g 0 /s (6 to
250 kg 02/h).
For optimum oxygenation in square tanks the ratio of width to depth
to rotor diameter is advised to range from 3 : 1 : 0,6 to h : 1 :
0,67 (see also table 3.5, appendix).
Fig. 3.56 HAMBURG-ROTOR

148
Aqua-Lator:
The Aqua-Lator consists of a float mounted high speed impeller which
sucks the water through a short draft tube and sprays it through a
discharge cone over the tank surface. The circular float unit (see
figure 3-57) is made out of glasfiber inforced polyester, filled with
plastic foam.
The Aqua-Lator is available on various sizes up to some 3,50 m dia
meter of the total unit with oxygenation capacities from about
2 to 25 g 0 /s (7 to 90 kg 0 /h) (see also table 3.6, appendix).
Although preferably used for the aeration of lagoons, ponds and
surface waters, the Aqua-Lator may also be applied in large activated
sludge tanks. '
Due to the intense updraft the minimum depth of lagoons and ponds is
anchor
Fig. 3.57 AQUA-LATOR
2 to 3 m to prevent erosion of the bottom, whereas the maximum depth
is already reached at 3,5 to H,2 m, depending on the size of the
turbine. To the lower end of the draft tube a flat cone may be at
tached to prevent erosion by inducing a vertical input velocity. The
depths then can be reduced to 0,8 to 1,2 m, respectively.
3.U313 Downdraft Aerators
The common principle of all downdraft aerators is a turbine placed at
or near the bottom of a square or round tank. The high speed turbine
induces a downdraft followed by a circular motion of the tank content
in a direction opposite to that of the updraft types. The high water

149
velocities near the impeller produce a partial vacuum entraining air
through the hollow drive shaft extending into the air. A small addi
tional effect of gas transfer is achieved by the constant renewal of
the water surface. Most of the dissipated energy is used, however,
for creating turbulence, not of air-water interfaces, giving rise to
low oxygenation capacities and efficiencies.
Since moreover the oxygenation capacity cannot be varied in a simple
manner under operational conditions, it is obvious that downdraft
aerators have more and more been displaced by updraft types.
3.1*32 Factors Influencing the Rate and Efficiency of Oxygen Transfer
Referring to the discussed mechanisms of dxygen transfer by mechani
cal aeration (section 3-Ul) it is evident that the oxygenation capa-
city of cones is primarily determined by the flow (m /s) pumped by
the aerator and by the size of the jets or droplets spread onto the
surface.
The flow is strongly influenced by the size of the cone or its dia
meter D , the rotational speed or peripheral speed v , its direction,
and the depth of submergence d. or freeboard. These factors and
furthermore the construction of the cone itself determine the air-
liquid interface of the discharged water.
The additional effects of gas transfer by air entrainement, previous
ly discussed, are basically determined by the tank size: the smaller
the tank is, the greater are the spiral velocities and the more
significant are these "secondary" effects. In an infinitely large
tank volume (pond, lagoon, surface water) these effects will almost
approach zero. Hence it is reasonable to relate the oxygenation capa
city and oxygenation efficiency to the power dissipation per unit
volume zn (W/m ). Qualitatively, a greater en will yield a higher
oxygenation capacity OC and a greater oxygenation efficiency OE. The
power dissipation (N„) again, is determined by the before mentioned
factors of D , v , d. and direction of rotation, c p i
The forementioned considerations will be discussed in the following
by means of a few examples referring to updraft aerators.
The influence of the cone diameter D , the peripheral speed v and
the depth of immersion on the oxygenation capacity has been shown to
follow the relationship
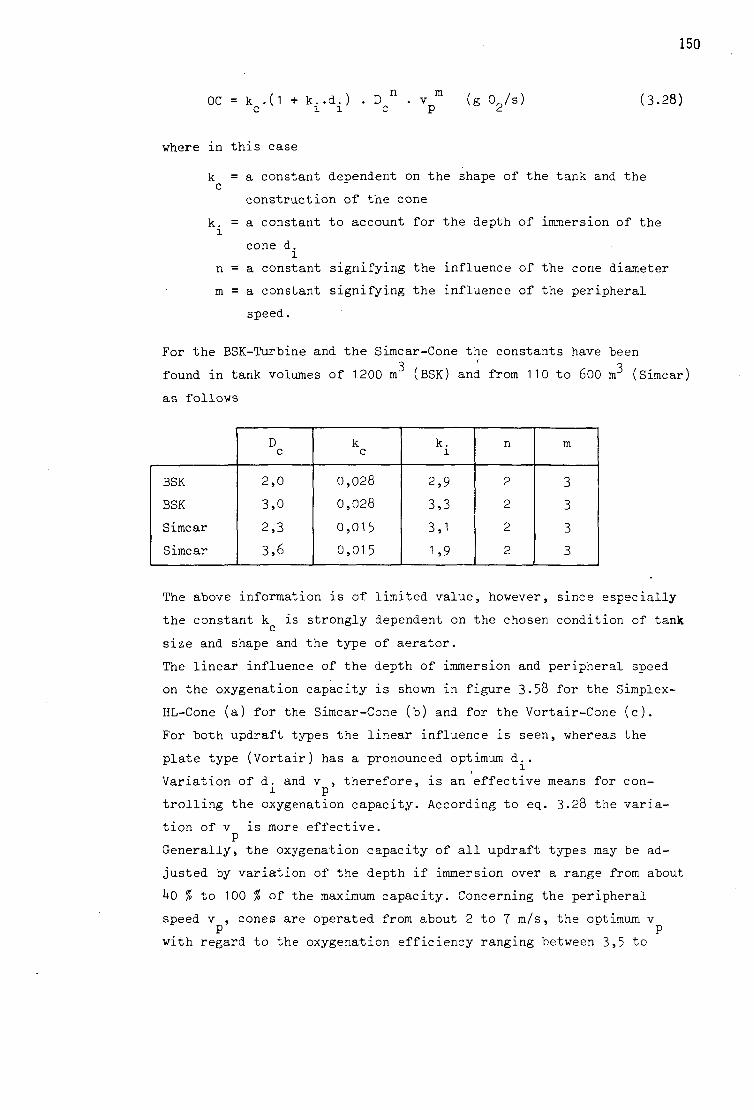
OC = k .(1 + k..d.) . D . v m (g 0,./s) (3.28) c 1 1 c p d
where in this case
k = a constant dependent on the shape of the tank and the c
construction of the cone
k. = a constant to account for the depth of immersion of the I
cone d. l
n = a constant signifying the influence of the cone diameter
m = a constant signifying the influence of the peripheral
speed.
For the BSK-Turbine and the Simcar-Cone the constants have been 3 ' 3
found in tank volumes of 1200 m (BSK) and from 110 to 600 irr (Simcar as follows
BSK
BSK
Simcar
Simcar
D c
2,0
3,0
2,3
3,6
k c
0,028
0,028
0,015
0,015
k. I
2,9
3,3
3,1
1,9
n
2
2
2
2
m
3
3
3
3
The above information is of limited value, however, since especially
the constant k is strongly dependent on the chosen condition of tank
size and shape and the type of aerator.
The linear influence of the depth of immersion and peripheral speed
on the oxygenation capacity is shown in figure 3.58 for the Simplex-
HL-Cone (a) for the Simcar-Cone (b) and for the Vortair-Cone (c).
For both updraft types the linear influence is seen, whereas the
plate type (Vortair) has a pronounced optimum d..
Variation of d. and v , therefore, is an effective means for con-1 p
trolling the oxygenation capacity. According to eq. 3.28 the variation of v is more effective.
P
Generally, the oxygenation capacity of all updraft types may be ad
justed by variation of the depth if immersion over a range from about
ho % to 100 % of the maximum capacity. Concerning the peripheral speed v , cones are operated from about 2 to 7 m/s, the optimum v
p . p
with regard to the oxygenation efficiency ranging between 3,5 to

151
to
8
^fe 39 3,6 3,3
005 0,10 0,15 f reeboard fb (m)
(a) SIMPLEX
D 1 , 5 2 4 m
120 m3
<X05 0.10 0,15 freeboard fb (m)
(b) SIMCAR
D = 2,288 m c
V = 115 m3
angle of plates
radially 25°
- 25° radially - 25°
rpm
83 107 87 65 65
r-v (m/s) P U,5 5,8 M " 3,5 3,5 -
4£
4,7
3L5
) 004 0,08 0,11 depth of immersion d. (m)
(c) VORTAIR
D. 1,04 m 3
V = 135 m
Fig. 3.58 INFLUENCE OF d. AND v„ ON THE OXYGENATION CAPACITY
5 m/s. Within these ranges the greater velocities refer to smaller
cones and vice versa.
Changing v by means of motors with pole changing windings (e.g. doub-P
ling of rotational speed) would allow to reduce the oxygenation capa-o
city according to eq. 3.28 from 100 % to (§) = 12,5 % of the maximum
capacity. In practice, however, a gradual control is required to meet
the variation of the oxygen demand. This vis most effectively attained
by variation of the depth of immersion d. of the cone. On the other
hand, an alteration of the rotational speed also influences the "se
condary effects" of surface aeration. Hence the range of control is
generally less than would be expected from the above consideration.
By combining both control mechanisms (d. and v ) the oxygenation
capacity may commonly be varied from about 15 % to 100 % of the maxi
mum capacity.
As already mentioned, the influence of the tank size may be accounted
for by relating the power dissipation per unit volume e (W/m ) to
the oxygenation capacity. Since the power requirement of a mixing
device generally increases with the second power of the diameter and
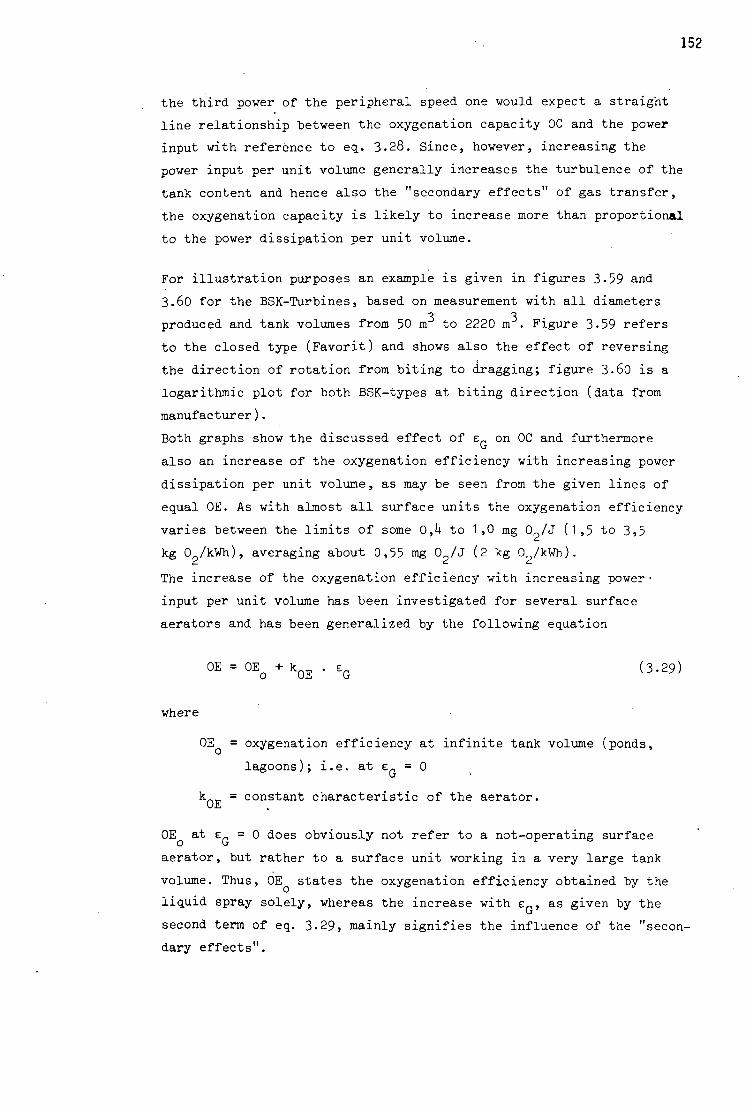
the third power of the peripheral speed one would expect a straight
line relationship between the oxygenation capacity OC and the power
input with reference to eq. 3.28. Since, however, increasing the
power input per unit volume generally increases the turbulence of the
tank content and hence also the "secondary effects" of gas transfer,
the oxygenation capacity is likely to increase more than proportional
to the power dissipation per unit volume.
For illustration purposes an example is given in figures 3-59 and
3.60 for the BSK-Turbines, based on measurement with all diameters 3 3
produced and tank volumes from 50 m to 2220 m . Figure 3 - 59 refers
to the closed type (Favorit) and shows also the effect of reversing
the direction of rotation from biting to dragging; figure 3.60 is a
logarithmic plot for both BSK-types at biting direction (data from
manufacturer).
Both graphs show the discussed effect of e on OC and furthermore
also an increase of the oxygenation efficiency with increasing power
dissipation per unit volume, as may be seen from the given lines of
equal 0E. As with almost all surface units the oxygenation efficiency
varies between the limits of some 0,*+ to 1,0 mg 0?/J (1,5 to 3,5
kg 0 /kWh), averaging about 0,55 mg 0 /J (2 kg 0 /kWh).
The increase of the oxygenation efficiency with increasing power-
input per unit volume has been investigated for several surface
aerators and has been generalized by the following equation
0 E = 0 E o + k 0 E ' EG ( 3' 2 9 )
where
0E = oxygenation efficiency at infinite tank volume (ponds,
lagoons); i.e. at e_ = 0 u v
k._ = constant characteristic of the aerator. 0E
0E at e = 0 does obviously not refer to a not-operating surface
aerator, but rather to a surface unit working in a very large tank
volume. Thus, 0E states the oxygenation efficiency obtained by the
liquid spray solely, whereas the increase with e„, as given by the
second term of eq. 3.29, mainly signifies the influence of the "secon
dary effects".

153
20 40 60 80 100 120 140 W/rrr *• power dissipation per unit volume e (W/m )
Fig. 3.59 OXYGENATION CAPACITY cc AND EFFICIENCY OE OF CLOSED BSK-TURBINES (FAVORIT) AS A FUNCTION OF THE POWER DISSIPATION PER UNIT VOLUME E„

',T/„3, ->- power dissipation per unit volume z (W/m )
Fig. 3.60 OXYGENATION CAPACITY oc AND EFFICIENCY 0E OF BSK-TURBINES AS A FUNCTION OF THE POWER DISSIPATION PER UNIT VOLUME -,
Figure 3-61 states an example for eq. 3.29- The following table sum
marizes the constants thusfar determined and the respective exper-
ireiii.til conditions.
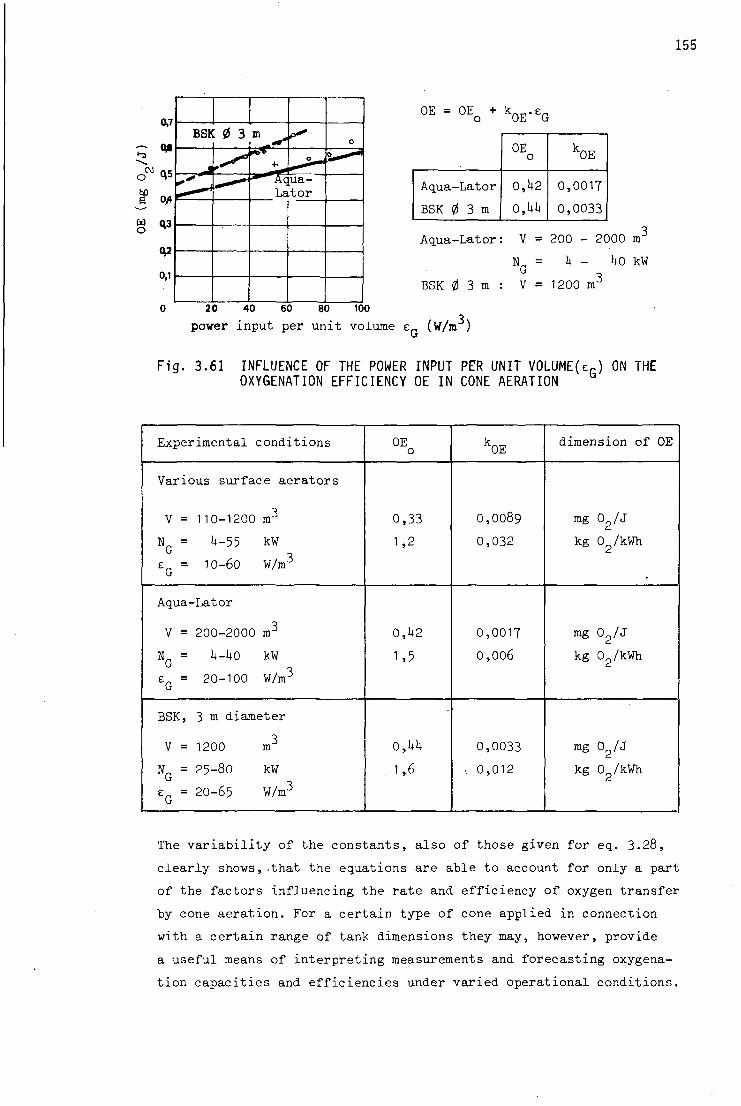
155
0 E = 0Eo + kOE-EG
Aqua-Lator
BSK 0 3 m
OE o
0,U2
0,Uk
k0E
0,0017
0,0033
Aqua-Lator: V = 200 - 2000 m
N = k - Ho kW 3
BSK 0 3 m : V = 1200 m°
0 20 40 60 80 100 o
power input per unit volume ep (W/m )
Fig. 3.61 INFLUENCE OF THE POWER INPUT PER UNIT V0LUME(er) ON THE OXYGENATION EFFICIENCY OE IN CONE AERATION b
Experimental conditions
Various surface aerators
V = 110-1200 m3
N = U-55 kW
e_ = 10-60 W/m0
Aqua-Lator
V = 200-2000 m3
K = U-UO kW
zn = 20-100 W/mJ
BSK, 3 m diameter
V = 1200 m3
N_ = 25-80 kW
en = 20-65 W/m-5
OE 0
0,33
1,2
0,U2
1,5
o,uu 1,6
k0E
0,0089
0,032
0,0017
0,006
0,0033
v 0,012
dimension of OE
mg 02/J
kg 02/kWh
mg 02/J
kg 02/kWh
mg 02/J
kg 02/kWh
The variability of the constants, also of those given for eq. 3.28,
clearly shows, .that the equations are able to account for only a part
of the factors influencing the rate and efficiency of oxygen transfer
by cone aeration. For a certain type of cone applied in connection
with a certain range of tank dimensions they may, however, provide
a useful means of interpreting measurements and forecasting oxygena
tion capacities and efficiencies under varied operational conditions.
BSK 0 3 m MP*
r*^ +-
0
^"Aqua-Lator
0
°-^"

156
Concerning the effect of surface active and hydrophobic matter on the
oxygenation capacity and efficiency, it follows from what has been
stated in section 3.Ul for mechanical aeration, that in regions of
high turbulence (e.g. near the blades of the cones) an increase is
to be expected, whereas at places of low turbulence (e.g. entrained
bubbles in the bulk of the tank content) a reduction is encountered.
Thus, the overall influence varies with the type of aerator and
furthermore with the power input per unit volume.
A reduction of the OC and OE in comparison to tap water is rare and
never reaches the values encountered in air diffusion, a-values as
high as 1,kh have been reported but should obviously not be applied
within a conservative design. Unless their is no evidence of a serious
reduction of the rate of oxygen transfer, a value of a = 1 should be
chosen, therefore.
For illustration purposes the design information as given by the ma
nufacturer is appendixed in the tables 3.1 to 3-6 for the Simcar-Cone,
the Gyrox-Cone, the Simplex-Cone (type E), the BSK-Turbine (type
Favorit), the Hamburg-Rotor and the Aqua-Lator.
Unless otherwise stated, the values refer to the maximum attainable
oxygenation capacity. This also includes the direction of rotation.
3-^33 Practical Aspects
Generally closed cones are susceptible to clogging and require pri
mary sedimentation therefore, whereas the open types can be used
without any pretreatment and are hence primarily applied in connection
with extended aeration and large oxydation ditches. The tendency of
clogging of the closed types obviously-depends on the dimensions of
the cone channels. If they are large enough, also closed types may be
used without pretreatment. Following these principles will reduce
maintenance to a minimum.
At proper shaping of the tanks and sufficient power input per unit
volume (e.g. e >_ 10 W/m ) the cones commonly provide a bottom velo-
city of the water which will prevent the activated sludge from sett
ling. Proper shaping of the tanks includes additional structures as
a hopper-like bottom or a solid cone situated on the bottom in the
center of the tank. The requirement of sufficient bottom velocities
(v >_ 0,15 m/s) limits the tank depth. In this connection updraft
types generally allow greater depths than plate types; with draft
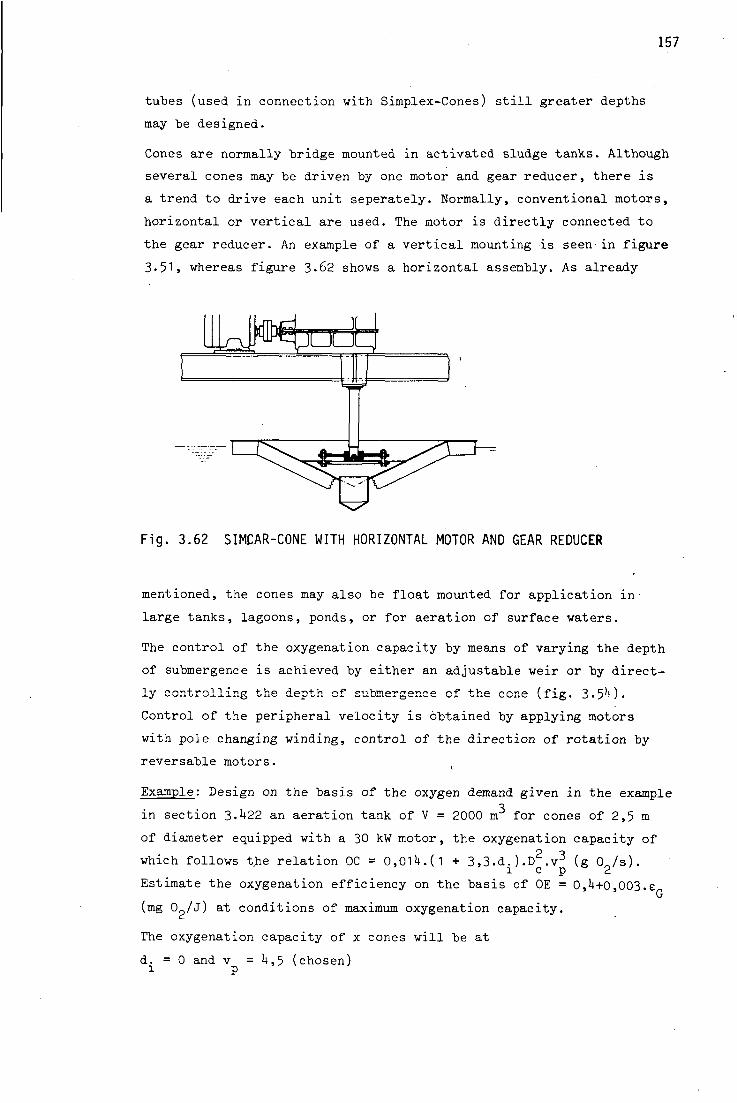
157
tubes (used in connection with Simplex-Cones) still greater depths
may be designed.
Cones are normally bridge mounted in activated sludge tanks. Although
several cones may be driven by one motor and gear reducer, there is
a trend to drive each unit seperately. Normally, conventional motors,
horizontal or vertical are used. The motor is directly connected to
the gear reducer. An example of a vertical mounting is seen in figure
3.51> whereas figure 3.62 shows a horizontal assembly. As already
Fig. 3.62 SIMCAR-CONE WITH HORIZONTAL MOTOR AND GEAR REDUCER
mentioned, the cones may also be float mounted for application in'
large tanks, lagoons, ponds, or for aeration of surface waters.
The control of the oxygenation capacity by means of varying the depth
of submergence is achieved by either an adjustable weir or by direct
ly controlling the depth of submergence of the cone (fig. 3.5'i).
Control of the peripheral velocity is obtained by applying motors
with pole changing winding, control of the direction of rotation by
reversable motors.
Example: Design on the basis of the oxygen demand given in the example
in section 3.1+22 an aeration tank of V = 2000 m for cones of 2,5 m
of diameter equipped with a 30 kW motor, the oxygenation capacity of
which follows the relation 0C = 0,01U.(1 + 3,3.d.).D2.v3 (g 0 /s). 1 c p 2
Estimate the oxygenation efficiency on the basis of 0E = 0,l*+0,003.e G
(mg 0„/j) at conditions of maximum oxygenation capacity. The oxygenation capacity of x cones will be at
d. = 0 and v = l+,5 (chosen) 1 P

OC = x . 0,01*+ . 2,52 • U,53
= x . 8 g 02/s
At an oxygen concentration of c - 2 and a = 1
the oxygenation capacity is
OC _0 = x . 8 . (10 - 2)/10 = x . 6,1+ g 0o/s Z—c- d.
The number of cones is determined by equalizing this oxygenation
capacity with the minimum oxygen demand of 5 -0,7 g 0p/s:
1+5 • 0,7 = x . 6,1+
x = U,9
i.e. 5 cones of the above specification are required. The maximum
oxygen demand of U5.1,3 g 0 /s can be met by increasing the depth of
submergence.
The required d. may be obtained by setting the maximum demand equal
to the oxygenation capacity of the 5 cones at operational conditions
(5-6,U g 0?/s) and multiplication with the term accounting for the
influence of d.:
1+5 • 1,3 = 5 • 6,U . (1 + 3,3.di)
d. = 0,25 m
The oxygenation efficiency is obtained from the power input per unit
volume at maximum oxygenation capacity, which amounts to
e = 5 . 30 kW/2000 m3
G
= 75 W/m3
Hence
0E = 0,U + 0,003 . 75
= 0,62 mg 02/J
=2,2 kg 02/kWh
Since the rectangular tank should comprise 5 square units, the tank
dimensions are designed at about a ratio of length : width : depth =
5 : 1 : 0,25 to give a length of 60 m, a width of 12 m and a depth of
2,80 m.

159
Combined Aerator Types
Combined aeration is a combination of bubble aeration and mechanical
means for dispersion of the bubbles and creating turbulence, also
assisting in transfer of gases. Since both mechanisms may be control
led seperately, the oxygenation capacity may be varied over wide
limits to meet the variations of oxygen demand in activated sludge
treatment. Their application in water treatment is rare.
The DO-Turbine (Dorr Oliver) is depicted in figure 3.63. It consists
of a sparge ring releasing air bubbles of medium size through ori
fices of 1 to 2 mm of diameter and a centrally arranged vertical shaft
with one or two bladed impellers, one closely above the sparge ring.
DO-Turbines are preferably used in deep tanks of square cross-secti
onal area.
For efficient oxygen transfer the rotational speed of the impeller(s)
should be adjusted to the air flow. An example is given in the fol
lowing table (recommandation of manufacturer).
-3 3 air flow 10 m /s
rotational speed rps
16
0 ,9
28
11,3
39
12,6
51
li+ , 0
dimensions i n cm
1*1* ho les of 0 16 mm
-£331 sparge ring of 125 mm internal diameter
T -g- compressed air
-70 - ^ ±
Fig. 3.63 DO-TURBINE

The given rotational speeds indicate that a geared drive is required.
Two thirds of the total power are taken by the turbine, one third
by the air diffusion on the average. The oxygenation efficiency is
generally less than with mechanical aeration, amounting to about
0,k mg 02/J (1,5 mg 02/kWh).
A somewhat different design is the Permeator, using a sparge ring'
also, but two seperately driven impellers, one just above the sparge
ring, the other near the surface to act as an surface aerator.
The Vogelbusch-Disperser (fig. 3.6U) has primarily been developed for
aeration in connection with industrial processes (fermentation pro
cesses, oxidation of dye-stuff) but has also been used for oxygena-
tion and carbon dioxide removal in water treatment.
The aerator consists of a sickle-like impeller, with slots on the
back side, mounted on a hollow shaft, through which compressed air is
diffused.
I JZIqEZt—•compressed air
L-
» 12,5
1 8
-J
dimensions in cm
Fig. 3.64 VOGELBUSCH - DISPERSER

161
The air discharged "by the slots is dispersed into fine bubbles of
2 - h mm of diameter by the turbulence and shear action induced by
the rotation of the impeller. The air-pressure to be applied is ge
nerally less than the depth of submergence due to a partial vacuum
being produced at the reverse side of the impeller.
Hence deep tanks of square or circular cross-section are appropriate,
in which the rising air bubbles induce an upwards velocity in the
center region of the tank and a downwards motion at the side walls,
effecting sufficient mixing of the tank content. To prevent a high
horizontal circular velocity, depreciating the oxygenating and mixing
conditions, the tanks are generally baffled.
It is evident that - like with the other combined types also - the
mechanical action accounts for the dispersion of the air bubbles,
whereas the injected air primarily determines the oxygenation capa
city. The oxygen utilization per unit depth of submergence has been
found in the order of 6 to 7 g 0 /m .m, the oxygenation efficiency
ranging from but 0,3 to 0,h mg 0 J J (1 to 1,5 kg 0 /kWh). Since the
system is basically fine bubble aeration at high turbulence, the gas
transfer is somewhat less reduced by surface active agents than air
diffusion: a-values of 0,8 to 0,95 have been reported.
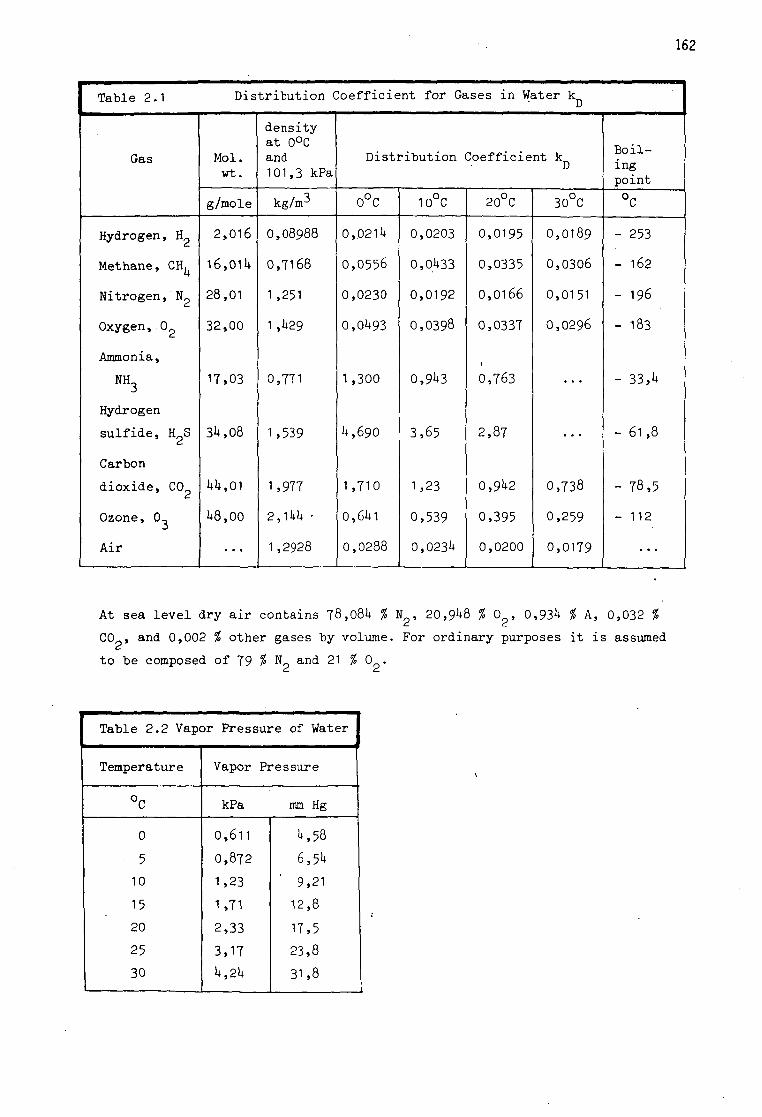
162
Table 2.1 Distribution Coefficient for Gases in Water k
Gas
Hydrogen, H 2
Methane, CH^
Nitrogen, N 2
Oxygen, 0 g
Ammonia,
NH
Hydrogen
sulfide, H 2S
Carbon
dioxide, CO
Ozone, 0_
Air
Mol. wt.
g/mole
2,016
16,01H
28,01
32,00
17,03
3U.08
1*1+,01
1+8,00
density at 0°C and 101,3 kPa
kg/m3
0,08988
0,7168
1,251
1,1*29
0,771
1,539
1,977
2,11+1+ -
1,2928
Distribution Coefficient k_
0°C
0,0211+
0,0556
0,0230
0,oU93
1,300
U,690
1,710
0,6U1
0,0288
10°C
0,0203
0,0U33
0,0192
0,0398
0,91*3
3,65
1,23
0,539
0,0231*
20°C
0,0195
0,0335
0,0166
0,0337
0,763
2,87
0,91*2
0,395
0,0200
30°C
0,0189
0,0306
0,0151
0,0296
0,738
0,259
0,0179
Boiling point
°C
- 253
- 162
- 196
- 183
- 33,1+
- 61,8
- 78,5
- 112
At sea l e v e l d ry a i r c o n t a i n s 78,081+ % N , 20,91+8 % 0 , 0,93l* % A, 0,032 %
C 0 ? , and 0,002 % o t h e r gases by volume. For o r d i n a r y purposes i t i s assumed
t o be composed of 79 % N and 21 % 0 .
Table 2.2 Vapor Pressure of Water
Temperature
°C
0
5
10
15
20
25
30
Vapor Pressure
kPa mm Hg
0,611
0,872
1,23
1,71
2,33
3,17
l+,2l+
l*,58
6,51*
9,21
12,8
17,5
23,8
31,8

Table 2.3
Temperature in °C
0 1 2 3 h 5
6 7 8 9 10
11 12 13 1U 15
16 17 18 19 20
21 22 23 2k 25
Solubili ty of Oxygen in Wat er Exposed
at a total pressure of 1013
Chloride Concentration in Water
0
1U.6 11+.2 13,8
13,5 13,1 12,8
12,5 12,2
11,9 11,6
11.3
11,1 10,8 10,6
10, k 10,2
10,0
9,7 9,5 9,U 9,2 9,0 8,8 8,7 8,5 8,U
5.000 10.000 15.000
Dissolved Oxygen
13,8 13.U
13,1 12,7 12, h 12,1
11,8
11,5 11 ,2 11,0
10,7
10,5 10,3 10,1
9,9 9,7
9,5 9,3 9,1 8,9 8,7 8,6 8,U 8,3 8,1 8,0
13,0 12,6
12,3 12,0
11,7 1 1 , »4
1 1 , 1
10,9 10,6
10,U 10,1
9,9 9,7 9,5 9,3 9,1
9,0 8,8 8,6 8,5 8,3
8,1 8,0 7,9 7,7 7,6
12,1 11,8
11,5 11,2 11,0 '
10,7
10,5 10,2 10,0
9,8 9,6
9,k 9,2 9,0 8,8 8,6
8,5 8,3 8,2 8,0 7,9
7,7 7,6 7,U 7,3 7,2
tc Water-mbar (T6C
g/m3
20.000
g/m3
11,3 11 ,0 10,8
10,5 10,3 10,0
9,8 9,6 9,U 9,2 9,0
8,8 8,6 8,5 8,3 8,1 8,0 7,8 7,7 7,6 7,U
7,3 7,1 7,0 6,9 6,7
-Saturated Air ) mm Hg)
Difference
per 100 mg
Chloride
0,017 0,016
0,015 0,015 0.01U 0,01U
0 ,oiU 0,013 0,013 0,012 0,012
0,011 0,011 0,011 0,010 0,010
0,010 0,010
0,009 0,009 0,009
0,009 0,008 0,008 0,008 0,008

Table 2.1+ C o e f f i c i e n t s of D i f f u s i o n of Gases i n Water
Gas
N2
°2 CHU
co2
,H2S
H2
C o e f f i c i e n t of D i f fu s ion
D (10 y m / s ) a t a
Temperature of
10°C
1,27
1,39
1 ,16
1,30
1,09
3,98
20°C
1,61+
1,80
1,50
1,68
1,1+1
5,13
30°C
2 ,20
2,1+2
2 ,02
2 ,26
1,90
6 ,90
Table 2.5 Correction Factor /D /D,
r(»C)
5 6 7 8 9
10 11 12 13 14
15 16 17 18 19
20 21 22 23 24
0,0
1,0977 1,0774 1,0575 1,0380 1,0188
1,0000 0,9815 0,9634 0,9456 0,9281
0,9110 0,8941 0,8776 0,8614 0,8455
0,8299 0,8145 0,7995 0,7847 0,7702
0,1
1,0957 1,0754 1,0556 1,0361 1,0169
0,9981 0,9797 0,9616 0,9438 0,9264
0,9093 0,8925 0,8760 0,8598 0,8439
0,8283 0,8130 0,7980 0,7833 0,7688
0,2
1,0936 1,0734 1,0536 1,0341 1,0150
0,9963 0,9779 0,9598 0,9421 0,9247
0,9076 0,8908 0,8744 0,8582 0,8423
0,8268 0,8115 0,7965 0,7818 0,7674
0,3
1,0916 1,0714 1,0516 1,0322 1,0131
0,9944 0,9760 0,9580 0,9403 0,9229
0,9059 0,8892 0,8727 0,8566 0,8408
0,8252 0,8100 0,7950 0,7803 0,7659
0,4
1,0896 1,0694 1,0497 1,0303 1,0113
0,9926 0,9742 0,9562 0,9386 0,9212
0,9042 0,8875 0,8711 0,8550 0,8392
0,8237 0,8085 0,7936 0,7789 0,7645
0,5
1,0875 1,0674 1,0477 1,0284 1,0094
0,9907 0,9724 0,9545 0,9368 0,9195
0,9025 0,8858 0,8695 0,8534 0,8376
0,8222 0,8970 0,7921 0,7774 0,7631
0,6
1,0855 1,0655 1,0458 1,0265 1,0075
0,9889 0,9706 0,9527 0,9351 0,9178
0,9008 0,8842 0,8679 0,8518 0,8361
0,8206 0,8055 0,7906 0,7760 0,7617
0,7
1,0835 1,0635 1,0438 1,0245 1,0056
0,9870 0,9688 0,9509 0,9333 0,9161
0,8992 0,8825 0,8662 0,8502 0,8345
0,8191 0,8040 0,7891 0,7745 0,7602
0,8
1,0815 1,0615 1,0419 1,0226 1,0037
0,9852 0,9670 0,9491 0,9316 0,9144
0,8975 0,8809 0,8646 0,8487 0,8330
0,8176 0,8025 0,7877 0,7731 0,7588
0,9
1,0795 1,0595 1,0399 1,0207 1,0019
0,9834 0,9652 0,9474 0,9299 0,9127
0,8958 0,8793 0,8630 0,8471 0,8314
0,8161 0,8010 0,7862 0,7717 0,7574

165
Table 3.1 Oxygenation Capacity of Simcar-Cones (data from manufacturer]
80 -
60
50
40
30 -
20
10
8
6
5
4
CM O
O O
8 ' ni o a o • H -P
5 0,5 s o
The size of the cone (D ) c
is given by the type number in inch. The OC-range is achieved by variation of d. and v

Table 3.2 Oxygenation Capacity and Tank
Dimensions for Gyrox-Cones
(as given by manufacturer)
Type
closed (S)
71 s
81 S
93 S
107 s
12U s
1U+ S
160 s
206 s
230 S
25k s
288 S
318 s
3 8 S
390 s
open (SE)
70 SE
80 SE
90 SE
100 SE
120 SE
130 SE
1U0 SE
170 SE
180 SE
200 SE
220 SE
250 SE
280 SE
OC
g 02/s
1,1
^^
2,5
2,8
2,9
6,1
7,5
10,5
13
17
20
25
30
ko
k2
kg
Tank Dimensions (m)
from
5 x 5 x 1,2
5 x 5 x 1,2
5 x 5 x 1,2
5 x 5 x 1,2
5 x 5 x 1,2
6 x 6x1,2
6 x 6x1,5
6 x 6x1,5
7 x 7 x 2
9 x 9 x 2,5
9 x 9 x 2,5
10 x 10 x 2,5
10 x 10 x 2,8
10 x 10 x 3
10 x 10 x 3
10 x 10 x 3,3
10 x 10 x 3,3
to
6 x 6x1,5
7 x 7 x 1,5
7 x 7 x 1,8
10 x 10 x 1,8
12 x 12 x 2
1 3 x 1 3 x 2
•\k x Ik x 2,2
15 x 15 x 2,7
19 x 19 x 3
21 x 21 x 3,5
2k x 2k x 3,7
26 x 26 x 3,7
29 x 29 x It
31 x 31 x-U,5
33 x 33 x i+,7
36 x 36 x 5
38 x 38 x 5,5
The type number indicates the cone size (D) in cm.
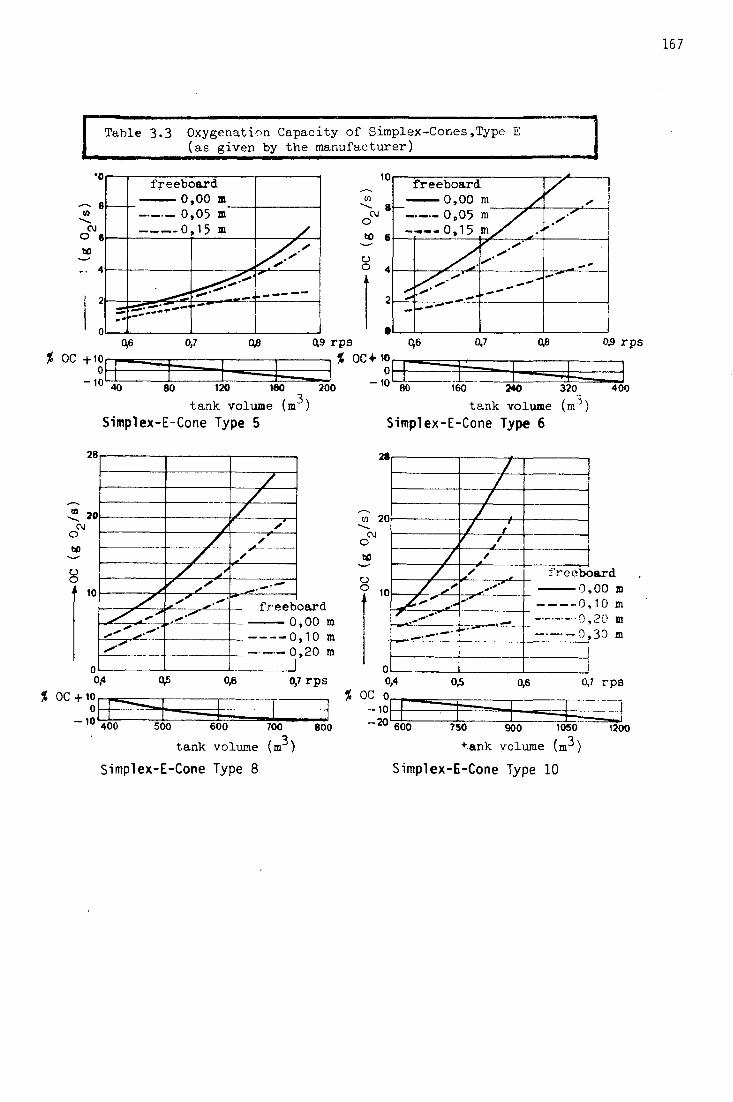
Table 3.3 Oxygenation Capacity of Simplex-Cones,Type E (as given by the manufacturer) H
•o
-— 8 to C\J
O 6
- . 4
—
freeb< 0 0 0
sard ,00 m ,05 m ,15 m
*'
10
OJ
o 60 6
O "=> A
_ freeboard
0 ,00 0,05
- , 0 ,15
-* -•
m y " > ^ "
x
— —"
0,7 08 0.9 r p s
tank volume (m )
Simplex-E-Cone Type 5
160 340 320 -3 -
400
t a n k volume (m ) Simplex-E-Cone Type 6
0,10 m 0,20 m 0,30 m
t a n k volume (m )
Simplex-E-Cone Type 8
750 900
+-ank volume (m )
Simplex-E-Cone Type 10
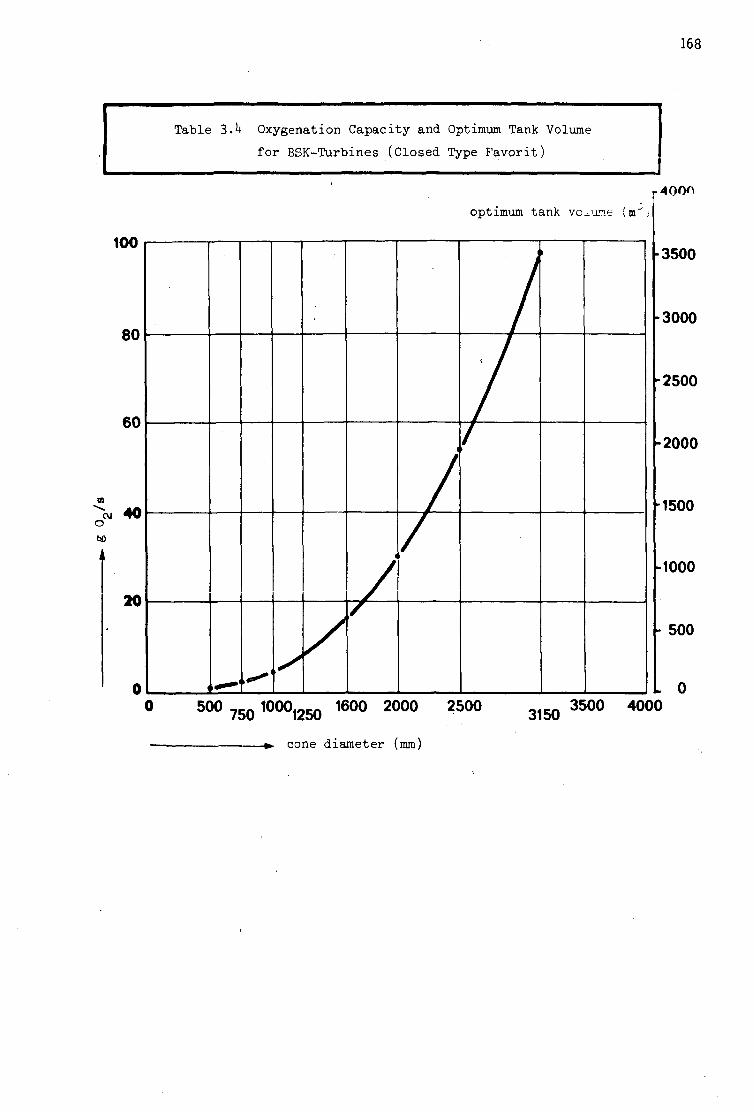
168
Table 3.U Oxygenation Capacity and Optimum Tank Volume
for BSK-Turbines (Closed Type Favorit)
optimum tank volume (m"
<
/
— - / —
4000
-3500
-3000
-2500
-2000
-1500
-1000
- 500
I 0 0 500 ? 5 0 10001250 1600 2000 2500 ^ 3500 4000
cone d i a m e t e r (mm)

169
Table 3-5 Oxygenation Capacity and Tank Dimensions for Hamburg Rotors
(as given by manufacturer)
Rotor dimensions in mm
(comp. fig. 3-50)
D c
1000
1150
1350
1600
1900
2250
2650
3100
3600
d
350
1+00
U7 0
500
620
770
900
1000
1200
h
500
550
650
800
950
1100
1300
1500
1800
jet tubes
number
6 6 6 8 8 8 8
10
10
a
133,0
139,7
159,0
139,7
159,0
193,7
216,0
216,0
219,1
oc
g 02/s
1,9
2,6
h,9
7,2
12,0
19,1+
35
U9
70
tank dimensions
width (m)
5,00 - 6,20
5,80 - 7,10
6,80 - 8,1+0
8,00 - 10,00
9,50 - 11,8d
11 ,30 - 11+.00
13,30 - 16,1+0
15,50 - 19,20
18,00 - 22,50
depth (m)
1 ,50 - 2,00
1 ,50 - 2,20
1 ,60 - 2,60
1,90 - 3,00
2,20 - 3,60
2,50 - l+,20
3,00 - U,80
3,50 - 5,00
l+,00 - 5,20
0 volume (m )
37,5 - 76,5
50,0 - 110,0
73,0 - 185,0
122,0 - 300,0
198,0 - 500,0
320,0 - 825,0
530,0 - 1290,0
81+0,0 - 1930,0
1295,0 - 2600,0
Table 3-6
Power
kW
3,7
7,5 11,2
1U.9
37,3
UU.T
Specifi
rational
rps
29
20
20
20
15
15
Specifications of the Aqua-Lator and
cations
speed
rpm
1750
1200
1200
1200
900
900
Experimental Results
Diame
ter of
float
m
1,68
1,98
3,32
3,32
Experimental results A
gross
power
input
kW
M5
17,0
1+0,0
OC
g 02/s
2,0
7,U 21 ,2
0E
mg 02/J
0,1+5
0,1+3
0,53
Experimental results B
gross
power
input
kW
hM
17,0
1+0,0
OC
g 02/s
1,9
7,2
17.2
0E
mg 02/J
: 0,1+1+
0,1+2
0,1+3
A: tank volume :
shape :
Diameter:
depth :
Experimental
379 m3
circular
12,20 m
3,20 m
Condit ions
B: tank volume
shape
width
depth
slope of side walls
21+30 m3
square
30,0 m
3,66 m
1 : 1,1+