
AERA PAPER PRESENTED APRIL 13, 2009 TO DIVISION … · AERA PAPER PRESENTED APRIL 13, 2009 TO:...
24
AERA PAPER PRESENTED APRIL 13, 2009 TO: DIVISION C — LEARNING AND INSTRUCTION; SECTION 3: MATHEMATICS SESSION: Students' Cognition in Mathematics TITLE Investigating Image-Based Perception and Reasoning in Geometry AUTHORS Stephen R. Campbell FACULTY OF EDUCATION EMAIL: SENCAEL@SFU.CA SIMON FRASER UNIVERSITY PHONE: 1-778-782-3630 8888 UNIVERSITY DRIVE FAX: 1-778-782-7187 BURNABY, BC, V5A 1S6, CANADA WEB: WWW.ENGRAMMETRON.NET Kerry Handscomb Nicholas E. Zaparyniuk Li Sha O. Arda Cimen Olga V. Shipulina FACULTY OF EDUCATION SIMON FRASER UNIVERSITY ABSTRACT In this study we seek to identify brain and body activities that correlate in valid and reliable manners, and with a high degree of statistical significance, with different aspects of geometrical image-based perception and reasoning. In so doing, we seek a better understanding of cognitive processes associated with geometrical image-based learning, instruction, and assessment in mathematics education, and to contribute to extending multidisciplinary boundaries of educational research. CITE AS Campbell, S. R., Handscomb, K., Zaparyniuk, N. E., Sha, L., Cimen, O. A., & Shipulina, O. V. (2009, April). Investigating image-based perception and reasoning in geometry. Paper presented to the American Educational Research Association: Brain, Neuroscience, and Education SIG. San Diego, CA, U.S.A. WORD COUNTS ABSTRACT (67 WORDS); PAPER (3208 WORDS); REFERENCES (629 WORDS). RUNNING HEAD ... Geometry
Transcript of AERA PAPER PRESENTED APRIL 13, 2009 TO DIVISION … · AERA PAPER PRESENTED APRIL 13, 2009 TO:...

!
AERA PAPER PRESENTED APRIL 13, 2009 TO:
DIVISION C — LEARNING AND INSTRUCTION; SECTION 3: MATHEMATICS
SESSION:
Students' Cognition in Mathematics
TITLE
Investigating Image-Based Perception and Reasoning in Geometry
AUTHORS
Stephen R. Campbell
FACULTY OF EDUCATION EMAIL: [email protected]
SIMON FRASER UNIVERSITY PHONE: 1-778-782-3630
8888 UNIVERSITY DRIVE FAX: 1-778-782-7187
BURNABY, BC, V5A 1S6, CANADA WEB: WWW.ENGRAMMETRON.NET
Kerry Handscomb
Nicholas E. Zaparyniuk
Li Sha
O. Arda Cimen
Olga V. Shipulina
FACULTY OF EDUCATION
SIMON FRASER UNIVERSITY
ABSTRACT
In this study we seek to identify brain and body activities that correlate in valid and reliable
manners, and with a high degree of statistical significance, with different aspects of geometrical
image-based perception and reasoning. In so doing, we seek a better understanding of cognitive
processes associated with geometrical image-based learning, instruction, and assessment in
mathematics education, and to contribute to extending multidisciplinary boundaries of
educational research.
CITE AS
Campbell, S. R., Handscomb, K., Zaparyniuk, N. E., Sha, L., Cimen, O. A., & Shipulina, O. V.
(2009, April). Investigating image-based perception and reasoning in geometry. Paper presented
to the American Educational Research Association: Brain, Neuroscience, and Education SIG.
San Diego, CA, U.S.A.
WORD COUNTS
ABSTRACT (67 WORDS); PAPER (3208 WORDS); REFERENCES (629 WORDS).
RUNNING HEAD
... Geometry

… Geometry Campbell, et al.
- 1 -
Introduction
Honoring this year’s program theme, this paper outlines two pilot case studies bridging research
in mathematics education, cognitive psychology, and cognitive neuroscience" concerned with
investigating image-based perception and reasoning in geometry. The aim of our research, as per
Division C’s invitation, is to gain insight into various modalities of geometrical cognition to
better inform our understanding of mathematics learning, instruction, and assessment.
Geometry is required for many students, and is often learned, taught, and assessed more
in a heuristic image-based manner, than as a formal axiomatic deductive system (Handscomb,
2005). Students are required to prove general theorems, but diagrams are usually used. It follows
that understanding how students engage in perceiving and reasoning about such diagrams can
provide educators with greater insights into learning, instruction, and assessment of these
matters. Simply put, the end in view of this research program should provide as much insight as
possible into two fundamental questions for any given learner considering a geometrical
diagram. What aspects of that diagram are being perceived from one moment to the next, and in
what manners are those aspects of the diagram being considered. It assumed that such a learner is
having their brain waves monitored by an electroencephalograph and that the geometrical
diagram is being presented on an eye-tracking monitor, recording their point of gaze.
In accord with our theoretical framework of embodied cognition (Campbell, 2001, 2003;
Campbell & Dawson, 1995; Handscomb, 2007; Varela, Thompson, & Rosch, 1991), subjective
experience and objective behavior are unified in such a manner that any change in mental states
and processes exhibit physiological manifestations in brain and body behavior, and vice versa
(Campbell & the ENL Group, 2007). Thus, we attempt to identify physiological manifestations
of geometrical image-based perception and reasoning (Campbell & Handscomb, 2007, April)
through brain and body activity that we can correlate with observations of overt behavior.

… Geometry Campbell, et al.
- 2 -
The focus of our first pilot study is on identifying physiological manifestations of
perceptual shift when a participant is presented with a multi-stable geometrical figure (i.e., a
geometrical gestalt), known as the Necker cube. There are three reasons for using the Necker
cube in our first pilot study: First, it is a simple geometrical diagram that affords 2 dominant
ways of being perceived, thus increasing the likelihood of our being able to identify the
characteristics of a perceptual shift; Secondly, it is geometrical figure that has been extensively
studied by cognitive neuroscientists; Thirdly, and our main goal here, is to simply demonstrate
how shifts in sensory stimuli manifest as shifts in brain waves recorded by
electroencephalography.
In our second pilot study, our participant is presented with a set of slides, where each
slide contains 6 geometrical figures, 5 of which are related by a geometrical concept. The
participant’s task in this study, for each slide, is to identify the “odd one out.” We are using these
slides for three main reasons as well: First, they offer a broad range of opportunities for
geometrical reasoning; Secondly, they are being used to establish that various aspects of
geometrical reasoning are culturally universal; Thirdly, and our main goal here, is to simply
demonstrate how our participant’s brain waves change from initial perception of these
geometrical diagrams to subsequent considerations on these very same diagrams, once he has
had ample opportunities to reflect upon them.
Thus, our initial aim for these pilot studies is simply to establish that brain states can
correlate in valid and reliable manners, and with a high degree of statistical significance, with
different aspects of image-based perception and reasoning in geometry. The extent to which such
correlations can be established, and the granularity that can be achieved, remains to be
determined, and is a long-term goal of a much larger program of research.

… Geometry Campbell, et al.
- 3 -
Theoretical framework
We take all cognition to be embodied cognition. Cartesian dualism rigorously separates the two
worlds of mind (res cogitans) and body (res extensa). Monist formulations variously claim that
all is mind (e.g., idealists) or all is matter (e.g., materialists). Our embodied framework occupies
a middle ground between these monist and dualist extremes (Campbell & Dawson, 1995). As
material beings we exist in the world, but also we are also mindful of a world, and in that sense
the world also exists in us. As embodied beings, then, we are both in the world, and of the world.
Varela et al. write,“[E]mbodiment has this double sense: it encompasses both the body as a lived,
experiential structure and the body as the context or milieu of the mind” (1991, p. xvi, authors’
italics). We interpret this double sense of embodiment as two different epistemological
perspectives on a single embodied ontology.
As mathematics education researchers, we develop cognitive models about mathematical
thinking to help better understand matters concerning learning, instruction, and assessment. To
date, we have typically been restricted in our studies to analyzing and interpreting overt behavior
and self-reports as the empirical ground for our cognitive models using audiovisual recordings of
thought in action (e.g., Campbell & Zazkis, 2002; Zazkis & Campbell, 2006).
A fundamental implication of embodied cognition is that, despite the intrinsic limitations
of measurement, changes in subjective experience must necessarily correspond to physiological
manifestations in brain and body behavior. This view suggests that beyond traditional data sets
such as self-reports, field notes, and audiovisual recordings, we can find further empirical ground
to substantiate our understandings of learning, instruction, and assessment by attending more
closely to less accessible and more covert behaviors of brain and body activity. To do so,
however, requires expanding our methods accordingly. Such is our aim here.

… Geometry Campbell, et al.
- 4 -
Methods, techniques, and modes of analysis
In accord with our theoretical framework, we consider behavior in a broader sense in such a
manner that includes physiological behavior, with special emphasis on recording various aspects
of the electrophysiology of brain and body activity, (i.e., electroencephalography (EEG),
electrocardiography (EKG), electrooculography (EOG)), as well recording eye-related behaviors
such as eye movement, eye gaze, and pupillary response. Extending our methods for research in
mathematics education to include these methods requires integrating audiovisual data with
physiological data in a time-synchronized manner. We report here on two pilot studies utilizing
these methods (also see Campbell & the ENL Group, 2007).
In this paper we focus mainly on our use of EEG, which monitors brain activity.
Electroencephalography, using passive sensors placed on the scalp, measures voltage potentials
resulting from fluctuations of the electrical component of electromagnetic field generated by the
living brain. It is well established that various frequency ranges of electromagnetic energy,
generated from various regional sources in the brain, correlate in statistically significant ways
with various aspects of cognitive function (e.g., Kahana, 2006).
Analysis techniques
There are two common signal analysis techniques that we are using for analyzing EEG data:
Source location and spectral analysis. Source analysis is a form of inverse modeling (Campbell,
2004), which involves determining regional brain source activity that accounts for scalp
measurements observed over a fixed period of time. There are various techniques to accomplish
this inversion. Here, we have used a method of brain electrical source analysis using a model of
multiple discrete equivalent current dipoles or regional brain sources (Scherg 1990). We then
decompose the resultant brain source waveforms into contiguous frequency ranges using a

… Geometry Campbell, et al.
- 5 -
technique, which is ubiquitous in signal processing, called the Fast Fourier Transform (FFT).
Intuitively, this process is akin to decomposing a beam of light into its composite colors with a
prism (see Fig. 1).
Resultant data (e.g., see Fig. 2) from these source location and spectral analysis
techniques then evoke more familiar statistical analyses (at least to educational researchers).
Statistical techniques enable us to more reliably discern between different brain activities, and
thereby, in accord with our aforementioned assumptions regarding embodied cognition, to better
substantiate postulated cognitive activities associated with learning, instruction, and assessment.
Modes of inquiry
How are we to tell what parts or aspects of geometrical diagrams a learner is viewing at any
given time and in what ways are they thinking about them? Again, these questions constitute the
general problematic and program of research that we have embarked upon. The pilot studies
reported here are initial forays toward these ends.
Pilot study 1: Image-based perception
Multi-stable perceptual drawings can be perceived in different ways. Geometrical
diagrams provide cases in point. A simple geometrical drawing is the Necker cube (e.g., see
Figure 3a). This wireframe image allows for the image of a cube to be perceived in two distinct
3-D representational configurations; one has the cube projecting upward to the right (e.g., see
Figure 3b) and the other has it projecting downward and to the left (e.g., see Figure 3c).
Once the participant was “wired up” with physiological sensors, his eyes were calibrated
to the eye-tracker, and baseline EEG was acquired during a period of rest. He was then presented
with a recurring sequence of three screens over 20 trials (Figure 4). The first two screens served
as the control; with the first control screen presenting a blank white screen for two seconds

… Geometry Campbell, et al.
- 6 -
(Figure 4a), and the second presenting a simple wireframe square on a white background for two
seconds (Figure 4b). The first two screens control for visual and neural satiation and memory
correlates (Gaetz, Weinberg, Rzempoluck, & Jatzen, 1998). The third screen presented the
Necker cube (Figure 4c) on a white background. Depending on his initial perception of the
orientation of the cube, the task of the participant was to press the “up arrow” key marking the
moment his initial perception of the cube shifted from a downward to the upward orientation, or
to press the “down arrow” key marking the moment his initial perception of the cube shifted
from an upward to the downward orientation. The next trial would immediately begin once an
arrow key was pressed. Once the participant had completed the 20 trials, another resting baseline
was recorded. We will report our statistical analyses for this pilot study in the presentation. A
quick perusal of Figure 6 illustrates that the characteristic of our participant’s brain waves were
radically different when he was attending to the square and cube than when he was gazing at the
blank screen (much higher energy in the alpha frequency range, as indicated by the time frame
highlighted in yellow on the right side of the figure).
Pilot study 2: Image-based reasoning
Perception entails something we “just see” or something that presents itself within our
sensory field. Reasoning, however, involves intellect and reflection, typically comparing one
thing with another, seeking relations of difference and similarity. To study spontaneous
geometrical image-based reasoning, we used a set of 45 slides, each containing six diagrams,
five of which are related by a geometrical concept (Dehaene, Izard, Pica, & Spelke, 2006).
Once the participant was “wired up” with physiological sensors and was calibrated to the
eye-tracker, he sequentially proceeded through the 45 slides (Figure 5). The participant’s task for
… Geometry Campbell, et al.
- 7 -
each slide was to select the “odd one out” by clicking on the appropriate diagram. The next slide
would then appear, and the experiment continued in this way until he had finished the entire set.
The experimenter had the participant go through this set of slides three times. The first
episode, i.e., the first time through, the participant was instructed to “just do it.” The second time
through, viz., Episode 2, the participant was requested to self-report, i.e., “talk aloud,” about his
experiences with each slide in Episode 1. In Episode 3, the experimenter brought the
participant’s attention to the unifying concept written in the upper left of each slide, and asked
“Had you first attended to this word or phrase when each slide was first presented to you, how
might that have changed your experience?” The audiovisual, eye-tracking, and physiological
data sets were then integrated and time-synchronized for analysis.
Data sources or evidence
The data sources and evidence that we focus on for this proposal mainly concerns EEG
data. We have, however, relied heavily on our audiovisual, eye-tracking, and other data to ensure
we were selecting and analyzing the EEG at the appropriate times. Figures 6 and 7 illustrate
integrated time-synchronized data sets from Pilot Studies 1 and 2, respectively.
Results and/or conclusions/point of view
We focus in this paper on a findings demonstrating our analyses that get to the heart of
our aim to use EEG to discern differences in geometrical image-based perception and reasoning.
Most noticeable from our first study, evident on the right hand side in Figure 5, highlighted in
yellow, is that progression from each trial is punctuated by focused power in the alpha range (8 –
14 Hz). These power bursts mark the time when our participant was gazing at the blank control
screen over a two second period. Strong alpha waves are typically associated with an eyes-
closed, relaxed condition. Our eye-tracking and audiovisual data illustrate our participant

… Geometry Campbell, et al.
- 8 -
maintained an eyes-open condition. This observation is consistent with the results of Knyazev,
Savostyanov, & Levin (2005), providing an indication, if not a reliable measure, of our
participant’s level of “alert wakefulness” or “expectant attention” (Nicolelis & Fanselow, 2002)
to the upcoming task at hand.
Most noticeable from our second pilot study, comparing brain activity from the first second
of exposure to the slides in Episode 1 with the first second of exposure to the slides in Episode 3
are statistically significant variances in different brain regions. In a nutshell, our participant’s
brain waves exhibited greater power in the higher frequency gamma (30-50 Hz) and beta (14-30
Hz) ranges and less active in the lower frequency theta (4-8 Hz) and delta (0-4 Hz) ranges.
Interestingly, in the alpha range (8-14 Hz), our participant exhibited greater power in the
frontal brain regions in Episode 1 and greater power in the posterior brain regions in Episode 3.
Our p- values (p<.05) are recorded in Table 1. In Episode 1, our participant was exposed to the
stimuli for the very first time. Our working hypothesis accounting for these results to this point is
that he was then in a more focused and attentive state of mind. In Episode 3, he was now quite
familiar with the slides as he encountered them, and thus, potentially, was engaged more with
memory at that time. Moreover, his attention in Episode 3 was also more oriented toward
linguistic concerns in attending to reading and comprehension in the upper left areas of the
slides. Consistent with our observations, both of these cognitive states have been correlated with
greater activations in the theta and delta range (e.g., Bastiaansen, et al, 2005).
Educational or scientific importance of the study
Through the Necker cube study researchers may be able to isolate the neural correlate of the
subjective experience of perception of a geometric Gestalt. Through the study utilizing the
Dehaene paradigm, researchers may gain knowledge of the neural correlates of additional

… Geometry Campbell, et al.
- 9 -
subjective cognitive experiences that are relevant for image-based reasoning in geometry—shifts
of attention, for example, or conceptual-verbal identification of a figure. In both cases, there are
other indicators of this subjective, cognitive event. For example, the participant may exhibit
large-scale behavior that implies subjective cognitive experiences of these types, whether by
speech or action. However, the addition of what may be referred to as behavioral data on the
small scale, electrophysiological data, for example, significantly expands the scope that
educational researchers have for building theories that elucidate processes of geometrical
perception and reasoning. In accord with our theoretical framework of embodied cognition,
relationships within the electrophysiological data will imply relationships within the flow of
subjective, first-person experience when a participant is engaged in geometrical perception and
reasoning. Gross behavioral data may have insufficient granularity for these relationships to
emerge from its analysis. These relationships between overt behavior and the more covert
physiological behaviors, recorded and analyzed using electroencephalography can either form
the basis of a theory of image-based perception and reasoning in geometry or they can
substantiate or refute an existing theory on geometrical perception and reasoning. There are
obvious implications for mathematics educators who wish to base pedagogy on sound
empirically grounded theories of mathematical cognition and learning.
Of course, these investigations are still at the earliest stages. There remains considerable
gaps between the experiments described here with any prescriptions for classroom practice.
Nevertheless, some illustrative comments may be made with reference to the model for image-
based reasoning in geometry that was proposed in Handscomb (2005; summarized and
supplemented in 2006). Handscomb’s model relates perception of a geometrical figure to
conceptual understanding of that figure. Accordingly, the process of geometrical reasoning, with

… Geometry Campbell, et al.
- 10 -
an image, will proceed in a series of stages, with one stage flowing into the next. Each stage in
the reasoning process corresponds to one of five “principles of conceptualization.” A
concatenation of these stages constitutes a geometrical argument. The five principles of
conceptualization may be further analyzed into local and global conceptualization and local and
global deduction.
Perception of the Gestalt figure of the Necker cube corresponds simply and
straightforwardly to a global conceptualization in Handscomb’s model (see Figure 8). On the
other hand, the reasoning process through the Dehaene paradigm is considerably more complex,
even though it does not yet involve the stringing together of a series of deductions. It is possible
to isolate local conceptualization as well as global conceptualization, meaning that the
participant identifies relationships between components of the figures. The widening and
narrowing of focal attention correspond to Handscomb’s Principles 4 and 5, respectively, as the
participant “steps back,” as it were, to review the whole diagram before once again focusing
attention on a specific aspect of it. His remaining three principles of conceptualization
correspond to relationships between conceptual-verbal understandings developed with respect to
geometrical figures. These relationships are present as the participant interacts with the
experimental paradigm in the second and third viewings. Clearly, the research discussed in the
present paper touches peripherally only on the full model for image-based perception and
reasoning. However, there is potential for a more extensive study that would lead to
substantiating or refuting Handscomb’s model.
Follow-up studies will utilize the further research of Handscomb (2009), in which he
develops a model for the brain physiological activity that accompanies mathematical reasoning.
Experiments such as those presented here are therefore part of an on-going research program that

… Geometry Campbell, et al.
- 11 -
is still in its infancy. Mathematics educators who are concerned about classroom applications of
such a research program should bear this in mind. Nevertheless, it is apparent that these first few
steps are leading in a direction that will be of paramount importance for mathematics education
through the twenty-first century. Researchers in mathematics education must continue to strive to
achieve the multidisciplinary legitimacy of a mature field of academic endeavor.
This paper, then, in accord with the conference theme, illustrates that the boundaries of
educational research can continue to be extended to incorporate methods and techniques such as
eye-tracking and electroencephalography from other disciplines such as psychophysiology and
cognitive neuroscience. The importance of this incipient program of research is to illustrate that
qualitatively and quantitatively significant discernments regarding the cognitive processes of
learners can be made using these methods. That, in accord with our theoretical framework, is
what we have set out to accomplish in this paper. Of course, it is too early to determine the
extent and granularity of such discernments. Further research is warranted.
References
Basar, E., Basar-Eroglu, C., Karakas, S., & Schürmann, M. (2001). Gamma, alpha, delta, and
theta oscillations govern cognitive processes. International Journal of Psychophysiology,
39(2-3), 241-248.
Bastiaansen, M.C. M., Berkum, J. J. A. van, & Hagoort, P. (2002). Syntactic processing
modulates the ! rhythm of the human EEG. NeuroImage, 17, 1479-1492.
Campbell, S. R. (2001). Enacting possible worlds: Making sense of (human) nature. In J. F.
Matos, W. Blum, K. Houston, & S. P. Carreira (Eds) Modelling and mathematics
education, ICTMA 9: Applications in science and technology, (pp. 3-14). Horwood Series
on Mathematics and its Applications. Chichester: Horwood Publishing.

… Geometry Campbell, et al.
- 12 -
Campbell, S. R. (2003). Reconnecting mind and world: Enacting a (new) way of life. In S. J.
Lamon, W. A. Parker, & S. K. Houston (Eds.) Mathematical Modelling: A way of life,
ICTMA 11, pp. 245-253. Horwood Series on Mathematics and its Applications.
Chichester: Horwood Publishing.
Campbell, S. R. & Dawson, A. J. (1995). Learning as embodied action. In R. Sutherland & J.
Mason (Eds.), NATO Advanced research workshop: Exploiting mental imagery with
computers in mathematics education, NATO ASI Series F, (vol. 138, pp. 233-49). Berlin:
Springer.
Campbell, S. R., & Handscomb, K. (2007, April). An embodied view of mind-body correlates.
Paper presented to the American Educational Research Association: Brain, Neuroscience,
and Education SIG. Chicago, IL, U.S.A.
Campbell, S. R., & Zazkis, R. (Eds.) (2002). Learning and teaching number theory: Research in
cognition and instruction. In C. Maher & R. Speiser (Eds.) Mathematics, learning, and
cognition: Research Monograph Series of the Journal of Mathematical Behavior (vol. 2).
Westport, CT: Ablex.
Dehaene, S., Izard, V., Pica, P., & Spelke, E. (2006). Core knowledge of geometry in an
Amazonian indigene group. Science, 311, 381-384.
Gaetz, M., Weinberg, H., Rzempoluck, E., & Jantzen, K. J. (1998). Neural network
classifications and correlation analysis of EEG and MEG activity accompanying
spontaneous reversals of the Necker cube. Cognitive Brain Research, 6(4), 335-346.
Handscomb, K. (2005). Image-based reasoning in geometry. (M.Sc. thesis). Retrieved July 12,
2007 from http://ir.lib.sfu.ca/ retrieve/2201/etd1863.pdf

… Geometry Campbell, et al.
- 13 -
Handscomb, K. (2006). Principles of conceptualization for image-based reasoning in geometry.
In S. Alatorre, J. L. Cortina, M. Sáiz, & A. Méndez (Eds) Proceedings of the 28th annual
meeting of the North American Chapter of the International Group for the Psychology of
Mathematics Education (Vol. 2, 418-420). Mérida, México:Universidad Pedagógica
Nacional.
Handscomb, K. (2007). Enactive cognition and Spinoza’s theory of mind. Proceedings of the
North American Chapter of the International Group for the Psychology of Mathematics
Education, 2007, Lake Tahoe, USA.
Handscomb (2009). Perception of structure in geometry. (Doctoral dissertation, unpublished)
Hoechstetter, K., Bornfleth, H., Weckesser, D., Ille, N., Berg, P., & Scherg, M. (2004). BESA
source coherence: A new method to study cortical oscillatory coupling. Brain
Topography, 16(4), 233-238.
Kahana, M. J. (2006). Mini-review: The cognitive correlates of human brain oscillations. The
Journal of Neuroscience, 26(6), 1669-1672.
Knyazev, G. G., Savostyanov, A. N., & Levin, E. A. (2005). Alpha synchronization and anxiety:
Implications for inhibition v. alertness hypotheses. International Journal of
Psychophysiology,
Kolev, V., Yordanova, J., Schürmann, M., & Basar, E. (2001). Increased frontal phase-locking of
event-related alpha oscillations during task processing. International Journal of
Psychophysiology, 39(2-3), 159-165.
Miyamoto, H. and Hensch, T. K. (2003). Reciprocal interaction of sleep and synaptic plasticity.
Molecular Interventions, 3, 404–417.
Scherg, M. (1990). Fundamentals of dipole source potential analysis. In F. Grandori, M. Hoke, &

… Geometry Campbell, et al.
- 14 -
G. L. Romani (Eds.), Auditory evoked magnetic fields and electric potentials — Advances
in Audiology, Vol. 6 (pp. 40-69). Karger: Basel.
Varela, F. J., Thompson, E., & Rosch, E. (1991). The embodied mind: Cognitive science and
human experience. Cambridge, MA: The MIT Press.
Zazkis, R., & Campbell, S. R. (Eds.) (2006). Number theory in mathematics education:
Perspectives and prospects. In A. H. Schoenfeld (Ed.) Studies in mathematical thinking
and learning series. Mahwah, NJ: Lawrence Erlbaum Associates.

… Geometry Campbell, et al.
- 15 -
Figure 1: Regional brain source decomposition (left side) combined with a prism simile for
spectral decomposition of brain sources into discrete frequency ranges using a Fast Fourier
Transform (right side)

… Geometry Campbell, et al.
- 16 -
Figure 2: Actual spectral decomposition (FFT) of brain source location waveforms with data
from different frequency ranges in columns on the right hand side (cf. Fig. 8)

… Geometry Campbell, et al.
- 17 -
(a) (b) (c)
Figure 3: The Necker cube (a); perceived with blackened face in foreground (b) & (c)

… Geometry Campbell, et al.
- 18 -
(a) (b) (c)
Figure 4: Pilot Study 1 stimuli: 20 trials of (a) for 2s; (b) for 2s; (c) upon choice

… Geometry Campbell, et al.
- 19 -
Figure 5: Pilot Study 2 stimuli, slides 1 to 45 (after Dehaene, Izard, Pica, & Spelke, 2006)

… Geometry Campbell, et al.
- 20 -
Figure 6: An integrated time-synchronized data set from Pilot Study 1

… Geometry Campbell, et al.
- 21 -
Figure 7: An integrated time-synchronized data set from Pilot Study 2
Figure 8: Principle 4 of Conceptualization (Handscomb, 2005), indicating the widening of
attention from region I to region J of the geometrical figure, where C represents a conceptual-
verbal understanding of the figure.

… Geometry Campbell, et al.
- 22 -
!
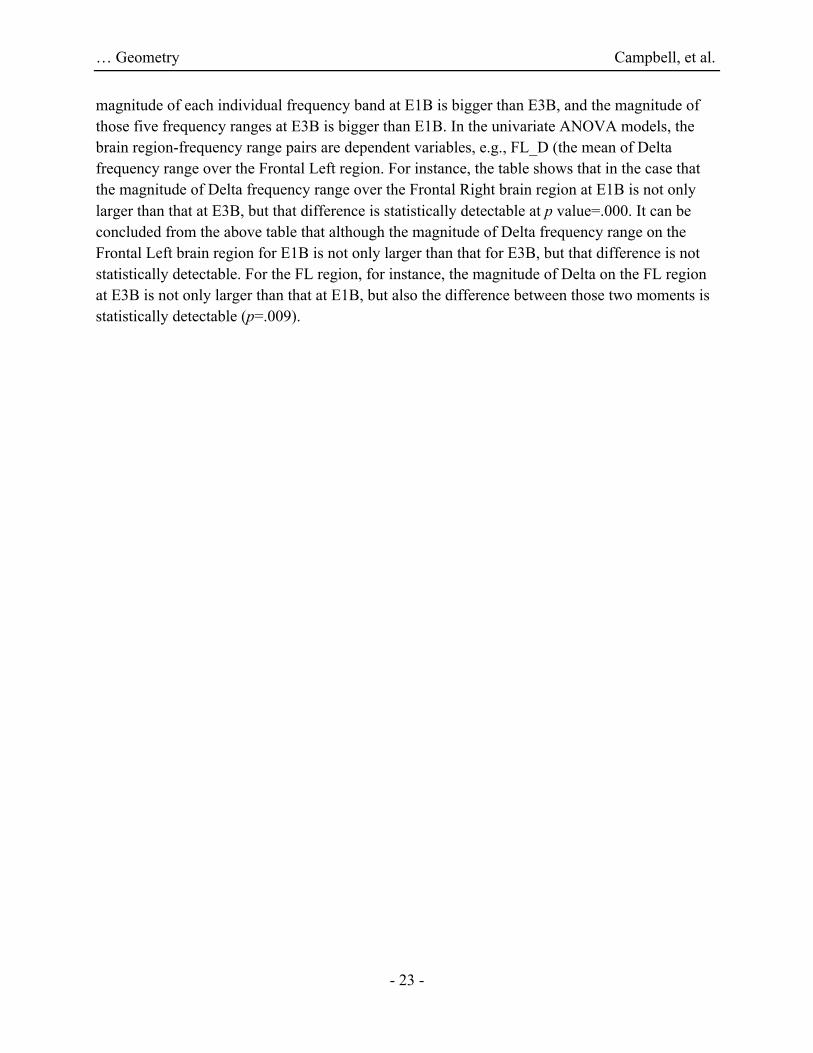
p values in the ANOVA analyses
E1B>E3B E3B>E1B
Brain
Regions1
Delta Theta Alpha Beta Gamma Delta Theta Alpha Beta Gamma
FL 0.014 0.000 0.000 0.009
FR 0.000 0.031 0.000 0.000 0.000
CL 0.008 0.011 0.000
CR 0.000 0.000 0.000
PL 0.054 0.003 0.001 0.001
PR 0.047 0.000 0.000 0.000
TAL 0.000 0.000 0.000
TAR 0.001 0.000 0.000
TPL 0.001 0.002 0.054 0.009
TPR 0.000 0.000 0.000 0.000
FpM 0.018 0.000 0.000 0.001
FM 0.046 0.000 0.000 0.000 0.000
CM 0.001 0.014
PM 0.000 0.000 0.006
OpM 0.002 0.000
Frequency 1 3 7 10 14 6 6 5 1 0
!
Table 1: Frequency of statistically detectable differences for E1B>E3B and E3B>E1B. This table
displays the p values in a series of univariate ANOVA analyses that examined whether the
difference over each brain region and frequency range between those regions on which the
!!!!!!!!!!!!!!!!!!!!!!!!!!!!!!!!!!!!!!!!!!!!!!!!!!!!!!!!!!!!!1 Brain region codes follow the BESA naming scheme of standard sources <www.besa.de>
… Geometry Campbell, et al.
- 23 -
magnitude of each individual frequency band at E1B is bigger than E3B, and the magnitude of
those five frequency ranges at E3B is bigger than E1B. In the univariate ANOVA models, the
brain region-frequency range pairs are dependent variables, e.g., FL_D (the mean of Delta
frequency range over the Frontal Left region. For instance, the table shows that in the case that
the magnitude of Delta frequency range over the Frontal Right brain region at E1B is not only
larger than that at E3B, but that difference is statistically detectable at p value=.000. It can be
concluded from the above table that although the magnitude of Delta frequency range on the
Frontal Left brain region for E1B is not only larger than that for E3B, but that difference is not
statistically detectable. For the FL region, for instance, the magnitude of Delta on the FL region
at E3B is not only larger than that at E1B, but also the difference between those two moments is
statistically detectable (p=.009).