Aebiom Pellet Sector Eu (1)
17
AEBIOM | European Bioenergy Outlook 2013 89 Pellets sector in Europe 8
-
Upload
brian-taylor -
Category
Documents
-
view
3 -
download
0
description
A concise report on the pellet sector in the EU by Aebiom
Transcript of Aebiom Pellet Sector Eu (1)
AEBIOM | European Bioenergy Outlook 2013 89
Pellets sector in Europe 8
90 European Bioenergy Outlook 2013| AEBIOM
The European Pellet Council (EPC) is an umbrella organisation representing the interests of the European wood pellet sector. Its members are national pellet associations or related organisations from 17 countries. The European Pellet Council is a platform for the pellet sector to discuss the issues that need to be managed in the transition from a niche product to a major energy commodity. These issues include standardisation and certification of pellet quality (ENplus), communication, statistics, safety, security of supply, education and training, and the quality of pellet using devices.
This part, dedicated to pellets, has been edited by Gilles Gauthier, the general manager of EPC. Special thanks to EPC member associations which have provided a large part of the data, EIPS Members and other partners from consulting companies, research centres and universities. Data on industrial pellet use have been supplied by Hawkins Wright.
AEBIOM | European Bioenergy Outlook 2013 91
8.1 Generalities of the pellet sector
8.1.1 WORLD WOOD PELLET PRODUCTION
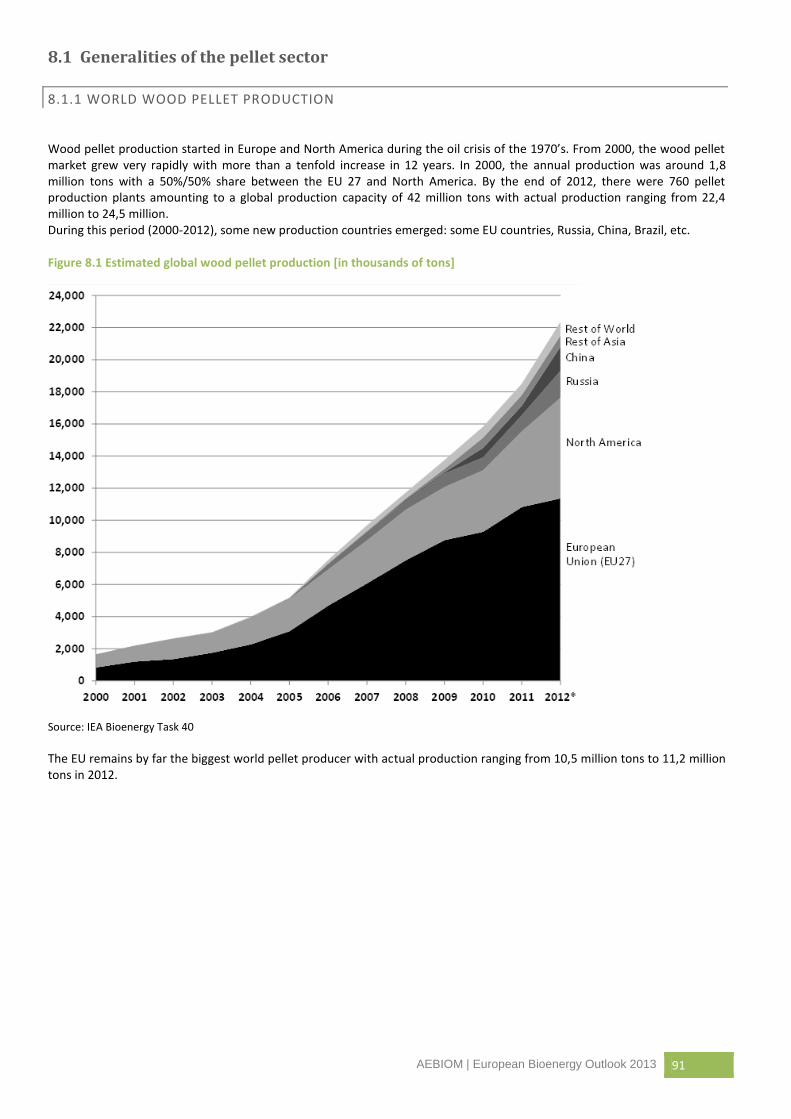
Wood pellet production started in Europe and North America during the oil crisis of the 1970’s. From 2000, the wood pellet market grew very rapidly with more than a tenfold increase in 12 years. In 2000, the annual production was around 1,8 million tons with a 50%/50% share between the EU 27 and North America. By the end of 2012, there were 760 pellet production plants amounting to a global production capacity of 42 million tons with actual production ranging from 22,4 million to 24,5 million. During this period (2000-2012), some new production countries emerged: some EU countries, Russia, China, Brazil, etc.
Figure 8.1 Estimated global wood pellet production [in thousands of tons]
Source: IEA Bioenergy Task 40
The EU remains by far the biggest world pellet producer with actual production ranging from 10,5 million tons to 11,2 million tons in 2012.
92 European Bioenergy Outlook 2013| AEBIOM
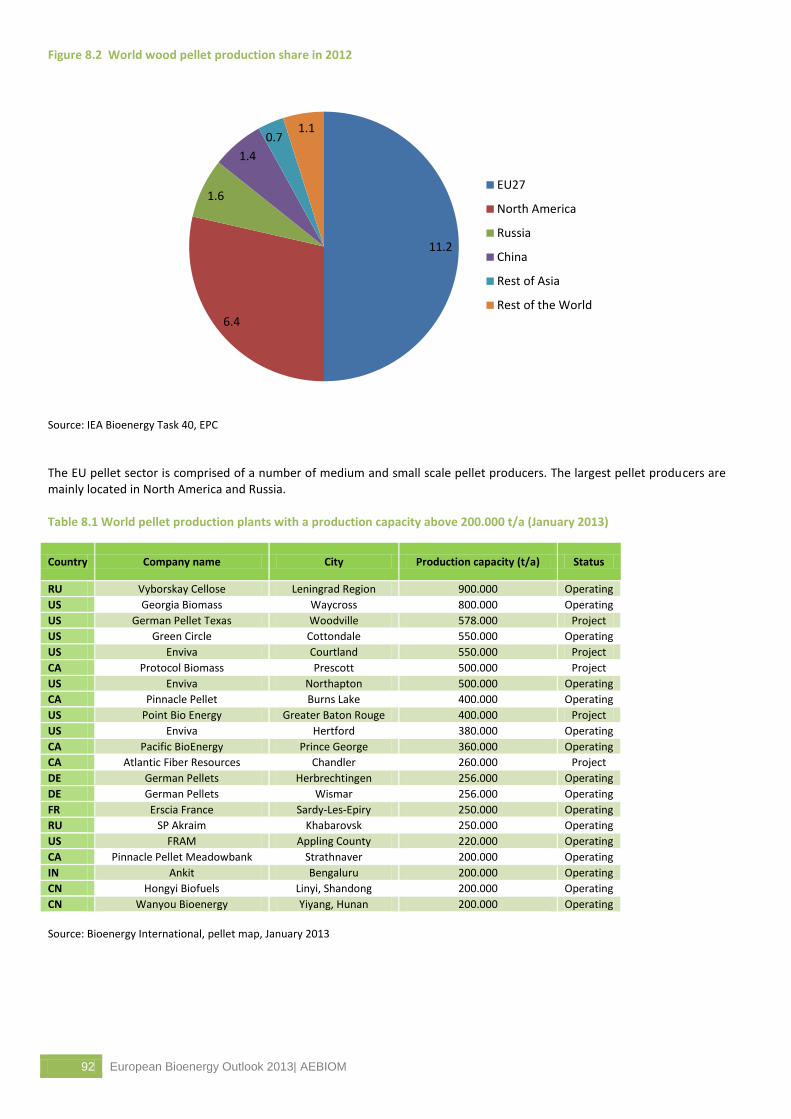
Figure 8.2 World wood pellet production share in 2012
Source: IEA Bioenergy Task 40, EPC
The EU pellet sector is comprised of a number of medium and small scale pellet producers. The largest pellet producers are mainly located in North America and Russia.
Table 8.1 World pellet production plants with a production capacity above 200.000 t/a (January 2013)
Country Company name City Production capacity (t/a) Status
RU Vyborskay Cellose Leningrad Region 900.000 Operating
US Georgia Biomass Waycross 800.000 Operating
US German Pellet Texas Woodville 578.000 Project
US Green Circle Cottondale 550.000 Operating
US Enviva Courtland 550.000 Project
CA Protocol Biomass Prescott 500.000 Project
US Enviva Northapton 500.000 Operating
CA Pinnacle Pellet Burns Lake 400.000 Operating
US Point Bio Energy Greater Baton Rouge 400.000 Project
US Enviva Hertford 380.000 Operating
CA Pacific BioEnergy Prince George 360.000 Operating
CA Atlantic Fiber Resources Chandler 260.000 Project
DE German Pellets Herbrechtingen 256.000 Operating
DE German Pellets Wismar 256.000 Operating
FR Erscia France Sardy-Les-Epiry 250.000 Operating
RU SP Akraim Khabarovsk 250.000 Operating
US FRAM Appling County 220.000 Operating
CA Pinnacle Pellet Meadowbank Strathnaver 200.000 Operating
IN Ankit Bengaluru 200.000 Operating
CN Hongyi Biofuels Linyi, Shandong 200.000 Operating
CN Wanyou Bioenergy Yiyang, Hunan 200.000 Operating
Source: Bioenergy International, pellet map, January 2013
11.2
6.4
1.6
1.4
0.7 1.1
EU27
North America
Russia
China
Rest of Asia
Rest of the World
AEBIOM | European Bioenergy Outlook 2013 93
15.1
4.2
0.1 1.3
0.1
1.1
0.1
EU27
North America
South America
China
Russia
Japan and South Korea
Other
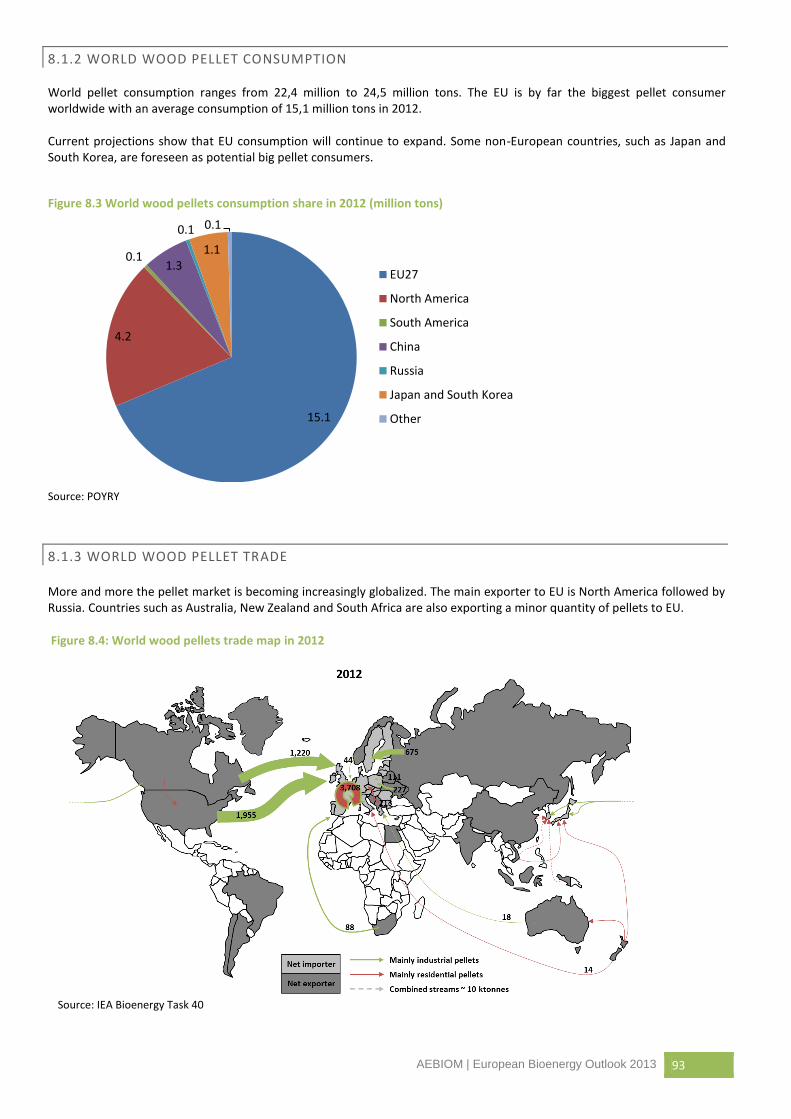
8.1.2 WORLD WOOD PELLET CONSUMPTION
World pellet consumption ranges from 22,4 million to 24,5 million tons. The EU is by far the biggest pellet consumer worldwide with an average consumption of 15,1 million tons in 2012.
Current projections show that EU consumption will continue to expand. Some non-European countries, such as Japan and South Korea, are foreseen as potential big pellet consumers.
Figure 8.3 World wood pellets consumption share in 2012 (million tons)
Source: POYRY
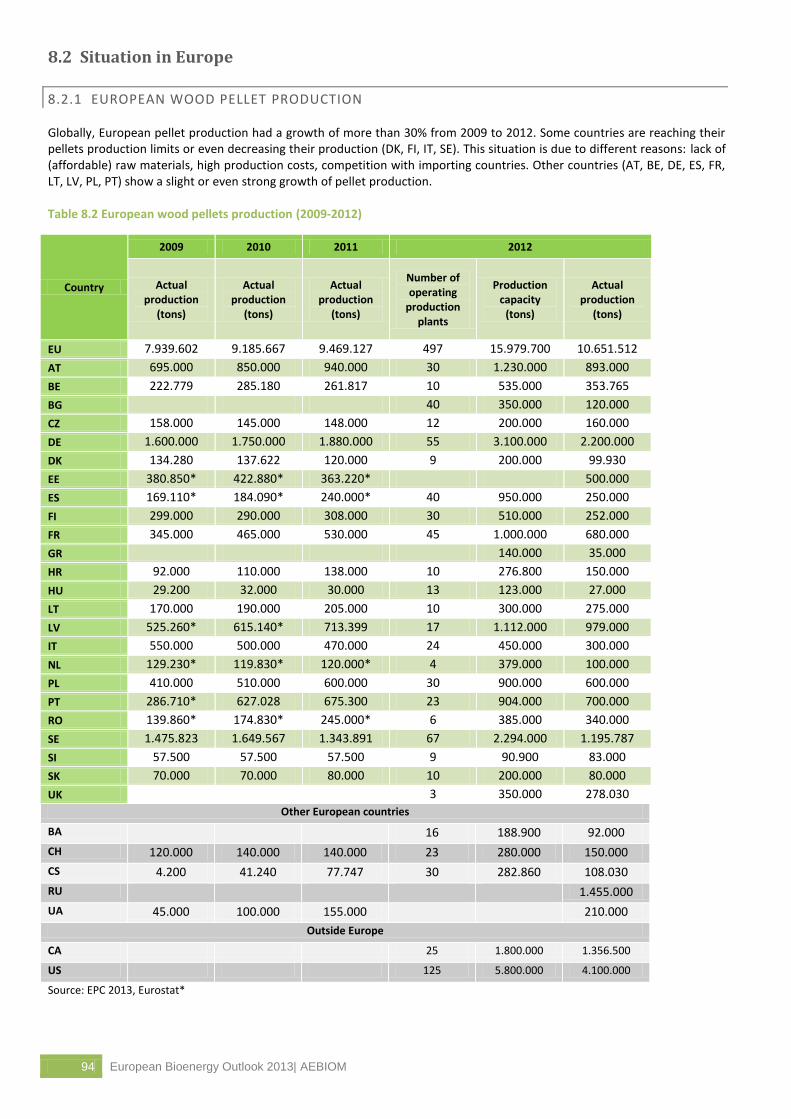
8.1.3 WORLD WOOD PELLET TRADE
More and more the pellet market is becoming increasingly globalized. The main exporter to EU is North America followed by Russia. Countries such as Australia, New Zealand and South Africa are also exporting a minor quantity of pellets to EU.
Figure 8.4: World wood pellets trade map in 2012
Source: IEA Bioenergy Task 40
94 European Bioenergy Outlook 2013| AEBIOM
8.2 Situation in Europe
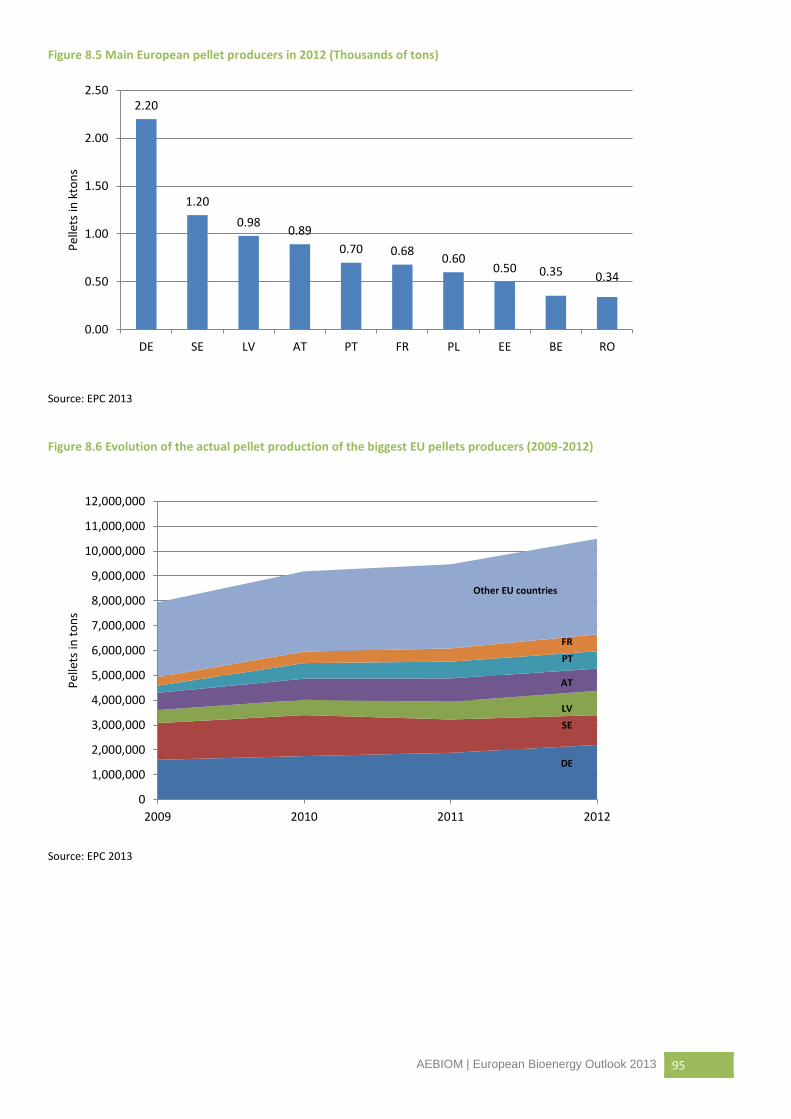
8.2.1 EUROPEAN WOOD PELLET PRODUCTION
Globally, European pellet production had a growth of more than 30% from 2009 to 2012. Some countries are reaching their pellets production limits or even decreasing their production (DK, FI, IT, SE). This situation is due to different reasons: lack of (affordable) raw materials, high production costs, competition with importing countries. Other countries (AT, BE, DE, ES, FR, LT, LV, PL, PT) show a slight or even strong growth of pellet production.
Table 8.2 European wood pellets production (2009-2012)
Country
2009 2010 2011 2012
Actual production
(tons)
Actual production
(tons)
Actual production
(tons)
Number of operating
production plants
Production capacity
(tons)
Actual production
(tons)
EU 7.939.602 9.185.667 9.469.127 497 15.979.700 10.651.512
AT 695.000 850.000 940.000 30 1.230.000 893.000
BE 222.779 285.180 261.817 10 535.000 353.765
BG 40 350.000 120.000
CZ 158.000 145.000 148.000 12 200.000 160.000
DE 1.600.000 1.750.000 1.880.000 55 3.100.000 2.200.000
DK 134.280 137.622 120.000 9 200.000 99.930
EE 380.850* 422.880* 363.220* 500.000
ES 169.110* 184.090* 240.000* 40 950.000 250.000
FI 299.000 290.000 308.000 30 510.000 252.000
FR 345.000 465.000 530.000 45 1.000.000 680.000
GR 140.000 35.000
HR 92.000 110.000 138.000 10 276.800 150.000
HU 29.200 32.000 30.000 13 123.000 27.000
LT 170.000 190.000 205.000 10 300.000 275.000
LV 525.260* 615.140* 713.399 17 1.112.000 979.000
IT 550.000 500.000 470.000 24 450.000 300.000
NL 129.230* 119.830* 120.000* 4 379.000 100.000
PL 410.000 510.000 600.000 30 900.000 600.000
PT 286.710* 627.028 675.300 23 904.000 700.000
RO 139.860* 174.830* 245.000* 6 385.000 340.000
SE 1.475.823 1.649.567 1.343.891 67 2.294.000 1.195.787
SI 57.500 57.500 57.500 9 90.900 83.000
SK 70.000 70.000 80.000 10 200.000 80.000
UK 3 350.000 278.030
Other European countries
BA 16 188.900 92.000
CH 120.000 140.000 140.000 23 280.000 150.000
CS 4.200 41.240 77.747 30 282.860 108.030
RU 1.455.000
UA 45.000 100.000 155.000 210.000
Outside Europe
CA 25 1.800.000 1.356.500
US 125 5.800.000 4.100.000
Source: EPC 2013, Eurostat*
AEBIOM | European Bioenergy Outlook 2013 95
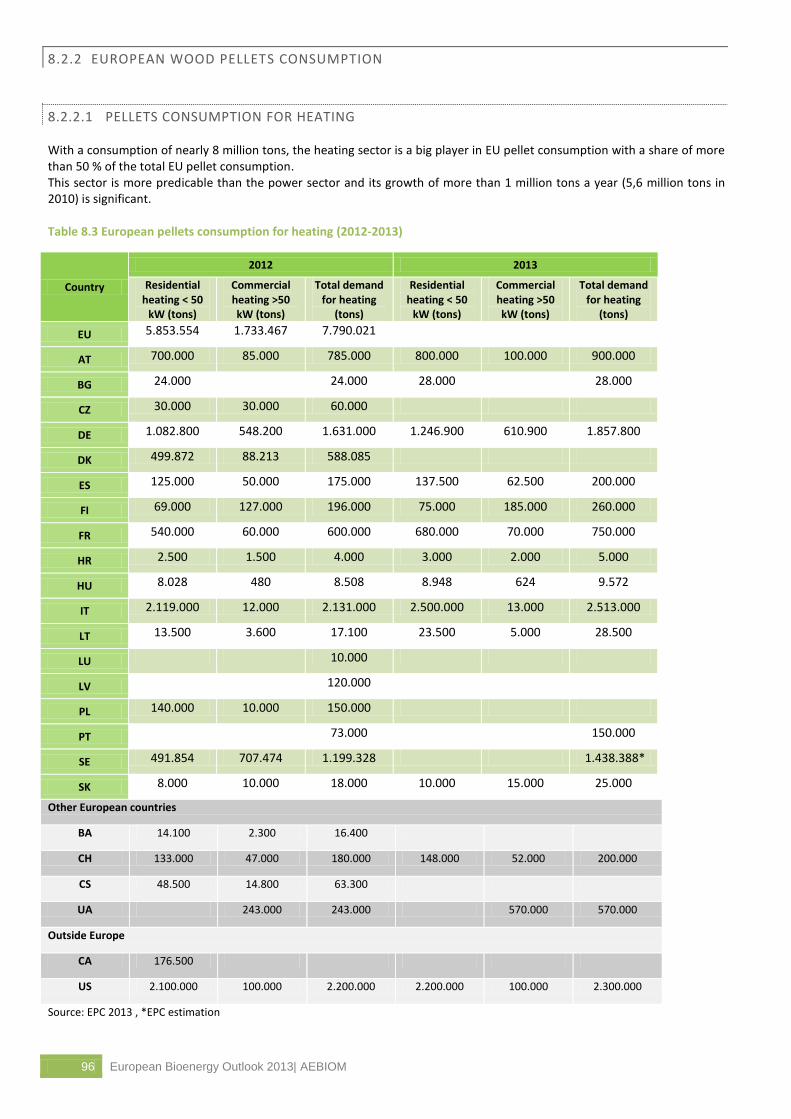
Figure 8.5 Main European pellet producers in 2012 (Thousands of tons)
Source: EPC 2013
Figure 8.6 Evolution of the actual pellet production of the biggest EU pellets producers (2009-2012)
Source: EPC 2013
2.20
1.20
0.98 0.89
0.70 0.68 0.60
0.50 0.35 0.34
0.00
0.50
1.00
1.50
2.00
2.50
DE SE LV AT PT FR PL EE BE RO
Pel
lets
in k
ton
s
0
1,000,000
2,000,000
3,000,000
4,000,000
5,000,000
6,000,000
7,000,000
8,000,000
9,000,000
10,000,000
11,000,000
12,000,000
2009 2010 2011 2012
Pel
lets
in t
on
s
DE
SE
LV
PT
Other EU countries
FR
AT
96 European Bioenergy Outlook 2013| AEBIOM
8.2.2 EUROPEAN WOOD PELLETS CONSUMPTION
8.2.2.1 PELLETS CONSUMPTION FOR HEATING
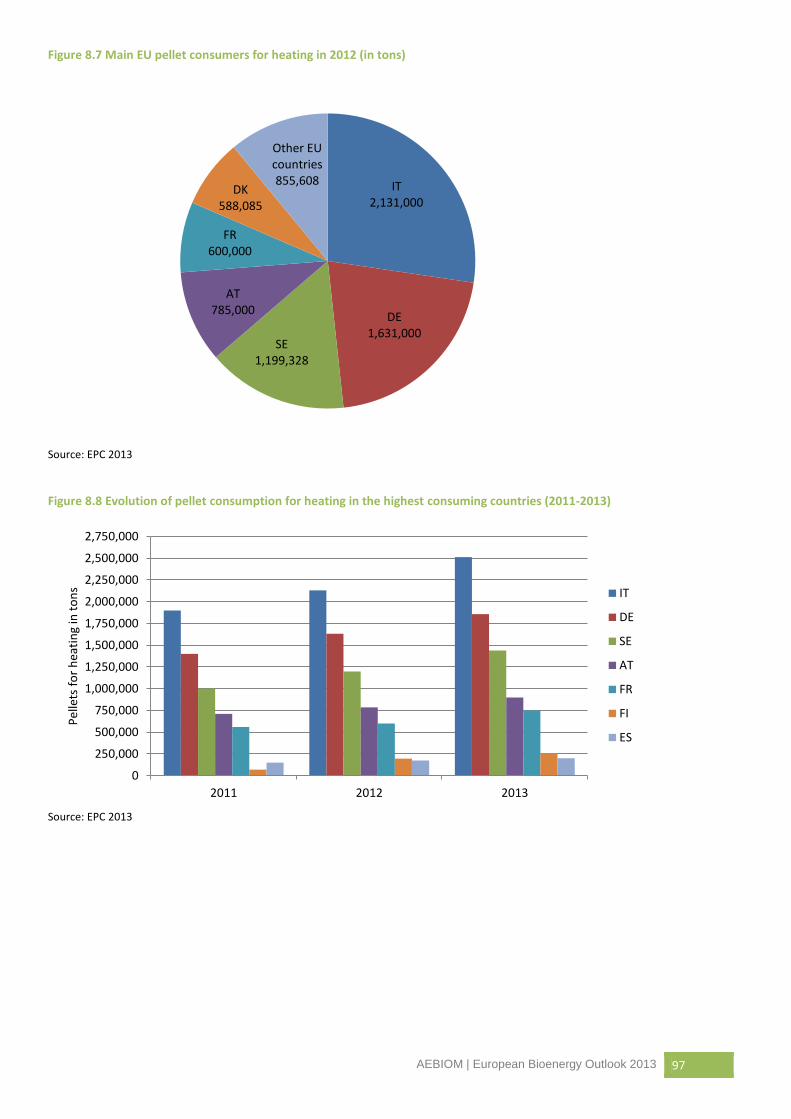
With a consumption of nearly 8 million tons, the heating sector is a big player in EU pellet consumption with a share of more than 50 % of the total EU pellet consumption. This sector is more predicable than the power sector and its growth of more than 1 million tons a year (5,6 million tons in 2010) is significant.
Table 8.3 European pellets consumption for heating (2012-2013)
Country
2012 2013
Residential heating < 50
kW (tons)
Commercial heating >50 kW (tons)
Total demand for heating
(tons)
Residential heating < 50
kW (tons)
Commercial heating >50 kW (tons)
Total demand for heating
(tons)
EU 5.853.554 1.733.467 7.790.021
AT 700.000 85.000 785.000 800.000 100.000 900.000
BG 24.000 24.000 28.000 28.000
CZ 30.000 30.000 60.000
DE 1.082.800 548.200 1.631.000 1.246.900 610.900 1.857.800
DK 499.872 88.213 588.085
ES 125.000 50.000 175.000 137.500 62.500 200.000
FI 69.000 127.000 196.000 75.000 185.000 260.000
FR 540.000 60.000 600.000 680.000 70.000 750.000
HR 2.500 1.500 4.000 3.000 2.000 5.000
HU 8.028 480 8.508 8.948 624 9.572
IT 2.119.000 12.000 2.131.000 2.500.000 13.000 2.513.000
LT 13.500 3.600 17.100 23.500 5.000 28.500
LU 10.000
LV 120.000
PL 140.000 10.000 150.000
PT 73.000 150.000
SE 491.854 707.474 1.199.328 1.438.388*
SK 8.000 10.000 18.000 10.000 15.000 25.000
Other European countries
BA 14.100 2.300 16.400
CH 133.000 47.000 180.000 148.000 52.000 200.000
CS 48.500 14.800 63.300
UA 243.000 243.000 570.000 570.000
Outside Europe
CA 176.500
US 2.100.000 100.000 2.200.000 2.200.000 100.000 2.300.000
Source: EPC 2013 , *EPC estimation
AEBIOM | European Bioenergy Outlook 2013 97
Figure 8.7 Main EU pellet consumers for heating in 2012 (in tons)
Source: EPC 2013
Figure 8.8 Evolution of pellet consumption for heating in the highest consuming countries (2011-2013)
Source: EPC 2013
IT 2,131,000
DE 1,631,000
SE 1,199,328
AT 785,000
FR 600,000
DK 588,085
Other EU countries 855,608
0
250,000
500,000
750,000
1,000,000
1,250,000
1,500,000
1,750,000
2,000,000
2,250,000
2,500,000
2,750,000
2011 2012 2013
Pel
lets
fo
r h
eati
ng
in t
on
s IT
DE
SE
AT
FR
FI
ES
98 European Bioenergy Outlook 2013| AEBIOM
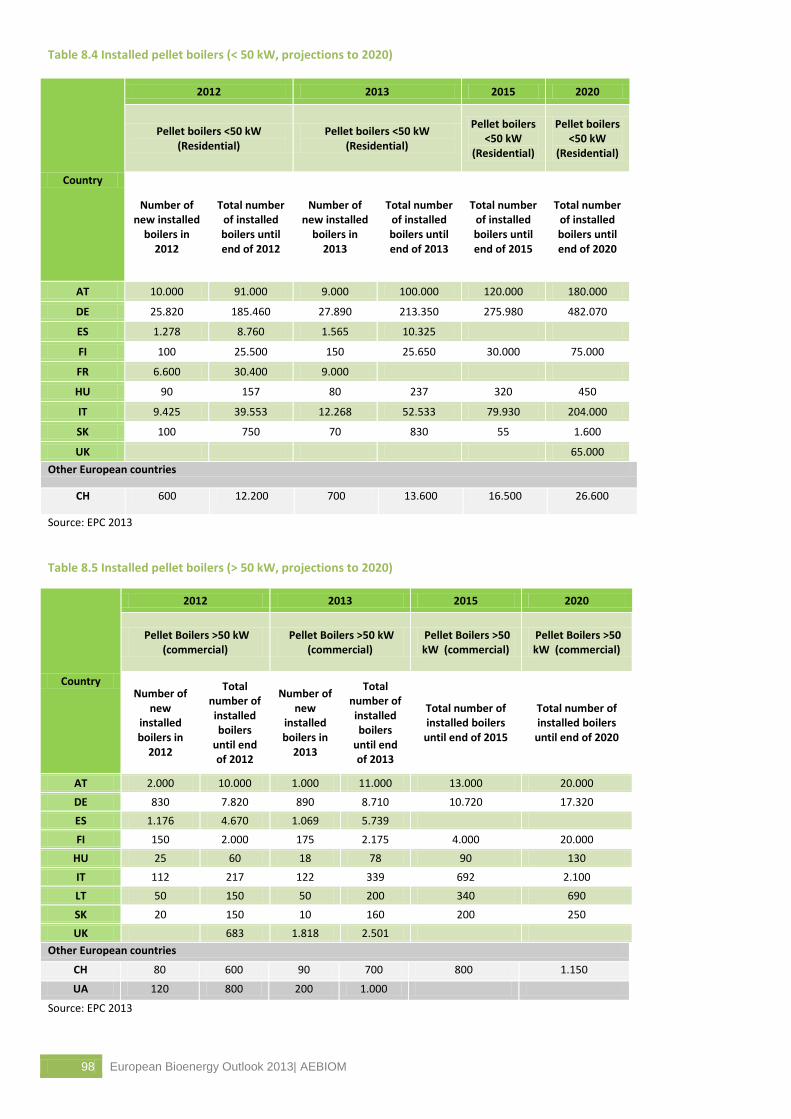
Table 8.4 Installed pellet boilers (< 50 kW, projections to 2020)
Country
2012 2013 2015 2020
Pellet boilers <50 kW (Residential)
Pellet boilers <50 kW (Residential)
Pellet boilers <50 kW
(Residential)
Pellet boilers <50 kW
(Residential)
Number of new installed
boilers in 2012
Total number of installed boilers until end of 2012
Number of new installed
boilers in 2013
Total number of installed boilers until end of 2013
Total number of installed boilers until end of 2015
Total number of installed boilers until end of 2020
AT 10.000 91.000 9.000 100.000 120.000 180.000
DE 25.820 185.460 27.890 213.350 275.980 482.070
ES 1.278 8.760 1.565 10.325
FI 100 25.500 150 25.650 30.000 75.000
FR 6.600 30.400 9.000
HU 90 157 80 237 320 450
IT 9.425 39.553 12.268 52.533 79.930 204.000
SK 100 750 70 830 55 1.600
UK 65.000
Other European countries
CH 600 12.200 700 13.600 16.500 26.600
Source: EPC 2013
Table 8.5 Installed pellet boilers (> 50 kW, projections to 2020)
Country
2012 2013 2015 2020
Pellet Boilers >50 kW (commercial)
Pellet Boilers >50 kW (commercial)
Pellet Boilers >50 kW (commercial)
Pellet Boilers >50 kW (commercial)
Number of new
installed boilers in
2012
Total number of installed boilers
until end of 2012
Number of new
installed boilers in
2013
Total number of installed boilers
until end of 2013
Total number of installed boilers
until end of 2015
Total number of installed boilers
until end of 2020
AT 2.000 10.000 1.000 11.000 13.000 20.000
DE 830 7.820 890 8.710 10.720 17.320
ES 1.176 4.670 1.069 5.739
FI 150 2.000 175 2.175 4.000 20.000
HU 25 60 18 78 90 130
IT 112 217 122 339 692 2.100
LT 50 150 50 200 340 690
SK 20 150 10 160 200 250
UK 683 1.818 2.501
Other European countries
CH 80 600 90 700 800 1.150
UA 120 800 200 1.000
Source: EPC 2013
AEBIOM | European Bioenergy Outlook 2013 99
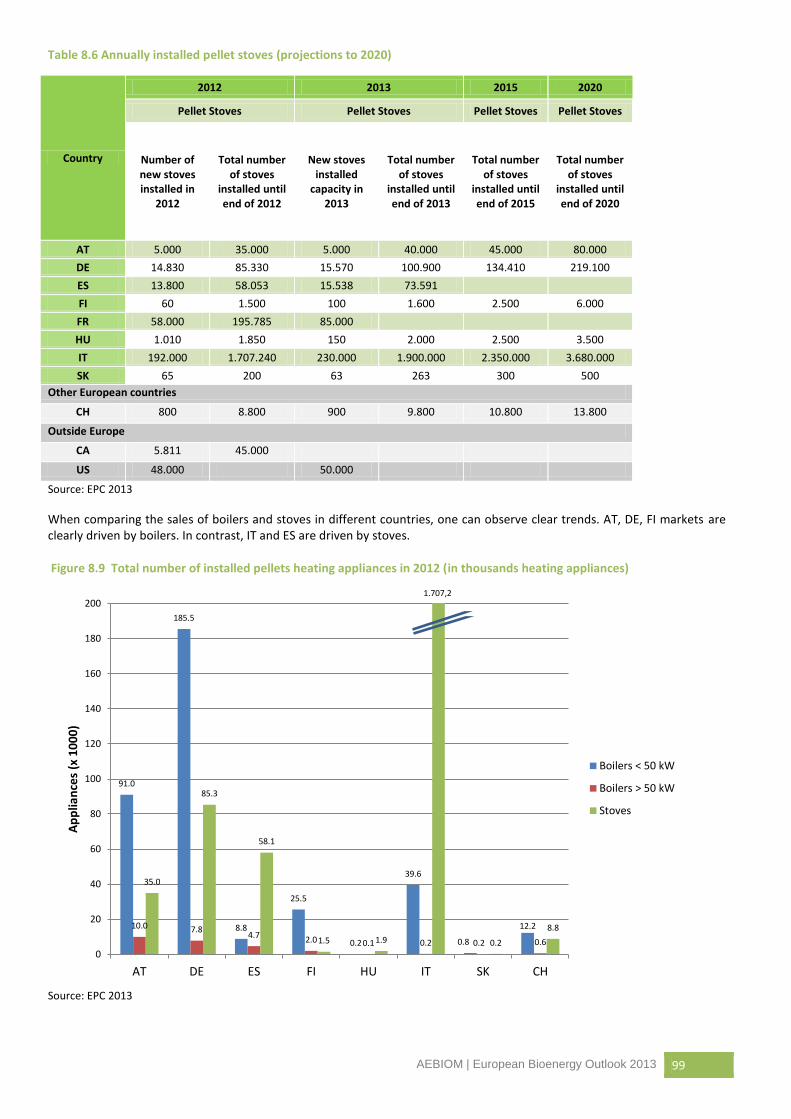
Table 8.6 Annually installed pellet stoves (projections to 2020)
Country
2012 2013 2015 2020
Pellet Stoves Pellet Stoves Pellet Stoves Pellet Stoves
Number of new stoves installed in
2012
Total number of stoves
installed until end of 2012
New stoves installed
capacity in 2013
Total number of stoves
installed until end of 2013
Total number of stoves
installed until end of 2015
Total number of stoves
installed until end of 2020
AT 5.000 35.000 5.000 40.000 45.000 80.000
DE 14.830 85.330 15.570 100.900 134.410 219.100
ES 13.800 58.053 15.538 73.591
FI 60 1.500 100 1.600 2.500 6.000
FR 58.000 195.785 85.000
HU 1.010 1.850 150 2.000 2.500 3.500
IT 192.000 1.707.240 230.000 1.900.000 2.350.000 3.680.000
SK 65 200 63 263 300 500
Other European countries
CH 800 8.800 900 9.800 10.800 13.800
Outside Europe
CA 5.811 45.000
US 48.000 50.000
Source: EPC 2013
When comparing the sales of boilers and stoves in different countries, one can observe clear trends. AT, DE, FI markets are clearly driven by boilers. In contrast, IT and ES are driven by stoves.
Figure 8.9 Total number of installed pellets heating appliances in 2012 (in thousands heating appliances)
Source: EPC 2013
91.0
185.5
8.8
25.5
0.2
39.6
0.8
12.2 10.0 7.8 4.7
2.0 0.1 0.2 0.2 0.6
35.0
85.3
58.1
1.5 1.9 0.2
8.8
0
20
40
60
80
100
120
140
160
180
200
AT DE ES FI HU IT SK CH
Ap
plia
nce
s (x
10
00
)
Boilers < 50 kW
Boilers > 50 kW
Stoves
1.707,2
100 European Bioenergy Outlook 2013| AEBIOM
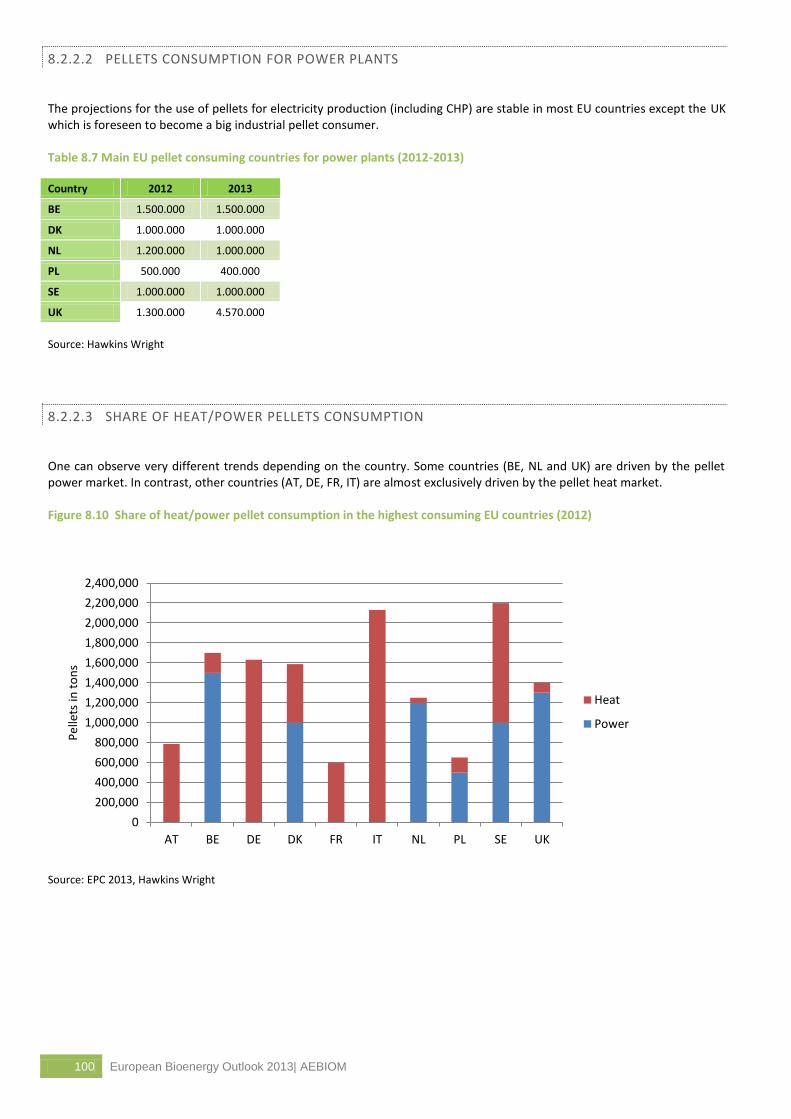
8.2.2.2 PELLETS CONSUMPTION FOR POWER PLANTS
The projections for the use of pellets for electricity production (including CHP) are stable in most EU countries except the UK which is foreseen to become a big industrial pellet consumer.
Table 8.7 Main EU pellet consuming countries for power plants (2012-2013)
Country 2012 2013
BE 1.500.000 1.500.000
DK 1.000.000 1.000.000
NL 1.200.000 1.000.000
PL 500.000 400.000
SE 1.000.000 1.000.000
UK 1.300.000 4.570.000
Source: Hawkins Wright
8.2.2.3 SHARE OF HEAT/POWER PELLETS CONSUMPTION
One can observe very different trends depending on the country. Some countries (BE, NL and UK) are driven by the pellet power market. In contrast, other countries (AT, DE, FR, IT) are almost exclusively driven by the pellet heat market.
Figure 8.10 Share of heat/power pellet consumption in the highest consuming EU countries (2012)
Source: EPC 2013, Hawkins Wright
0
200,000
400,000
600,000
800,000
1,000,000
1,200,000
1,400,000
1,600,000
1,800,000
2,000,000
2,200,000
2,400,000
AT BE DE DK FR IT NL PL SE UK
Pel
lets
in t
on
s
Heat
Power
AEBIOM | European Bioenergy Outlook 2013 101
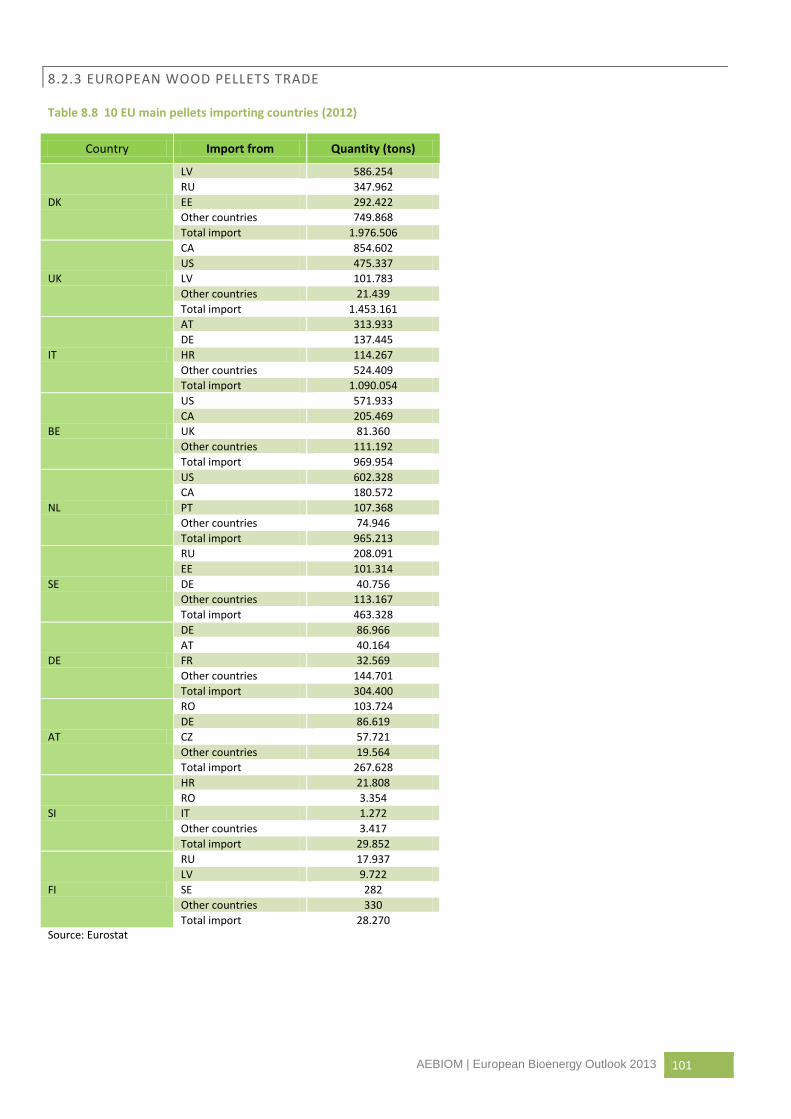
8.2.3 EUROPEAN WOOD PELLETS TRADE
Table 8.8 10 EU main pellets importing countries (2012)
Country Import from Quantity (tons)
DK
LV 586.254
RU 347.962
EE 292.422
Other countries 749.868
Total import 1.976.506
UK
CA 854.602
US 475.337
LV 101.783
Other countries 21.439
Total import 1.453.161
IT
AT 313.933
DE 137.445
HR 114.267
Other countries 524.409
Total import 1.090.054
BE
US 571.933
CA 205.469
UK 81.360
Other countries 111.192
Total import 969.954
NL
US 602.328
CA 180.572
PT 107.368
Other countries 74.946
Total import 965.213
SE
RU 208.091
EE 101.314
DE 40.756
Other countries 113.167
Total import 463.328
DE
DE 86.966
AT 40.164
FR 32.569
Other countries 144.701
Total import 304.400
AT
RO 103.724
DE 86.619
CZ 57.721
Other countries 19.564
Total import 267.628
SI
HR 21.808
RO 3.354
IT 1.272
Other countries 3.417
Total import 29.852
FI
RU 17.937
LV 9.722
SE 282
Other countries 330
Total import 28.270 Source: Eurostat
102 European Bioenergy Outlook 2013| AEBIOM
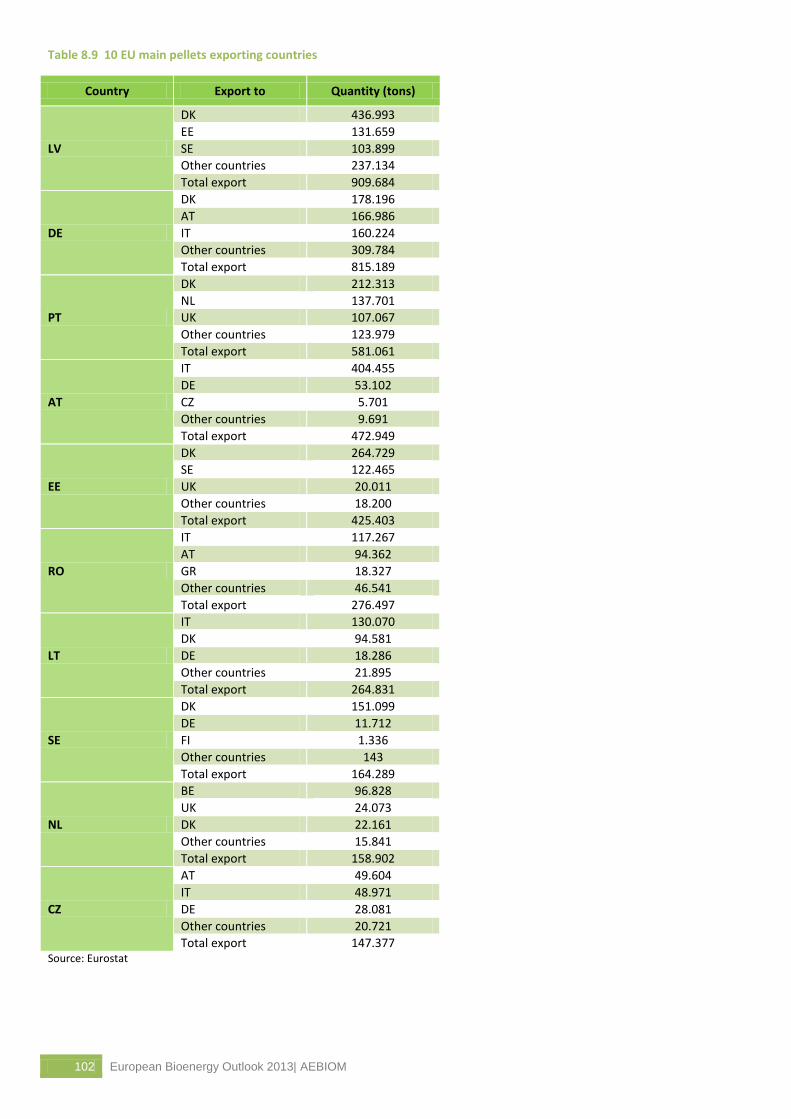
Table 8.9 10 EU main pellets exporting countries
Country Export to Quantity (tons)
LV
DK 436.993
EE 131.659
SE 103.899
Other countries 237.134
Total export 909.684
DE
DK 178.196
AT 166.986
IT 160.224
Other countries 309.784
Total export 815.189
PT
DK 212.313
NL 137.701
UK 107.067
Other countries 123.979
Total export 581.061
AT
IT 404.455
DE 53.102
CZ 5.701
Other countries 9.691
Total export 472.949
EE
DK 264.729
SE 122.465
UK 20.011
Other countries 18.200
Total export 425.403
RO
IT 117.267
AT 94.362
GR 18.327
Other countries 46.541
Total export 276.497
LT
IT 130.070
DK 94.581
DE 18.286
Other countries 21.895
Total export 264.831
SE
DK 151.099
DE 11.712
FI 1.336
Other countries 143
Total export 164.289
NL
BE 96.828
UK 24.073
DK 22.161
Other countries 15.841
Total export 158.902
CZ
AT 49.604
IT 48.971
DE 28.081
Other countries 20.721
Total export 147.377 Source: Eurostat
AEBIOM | European Bioenergy Outlook 2013 103
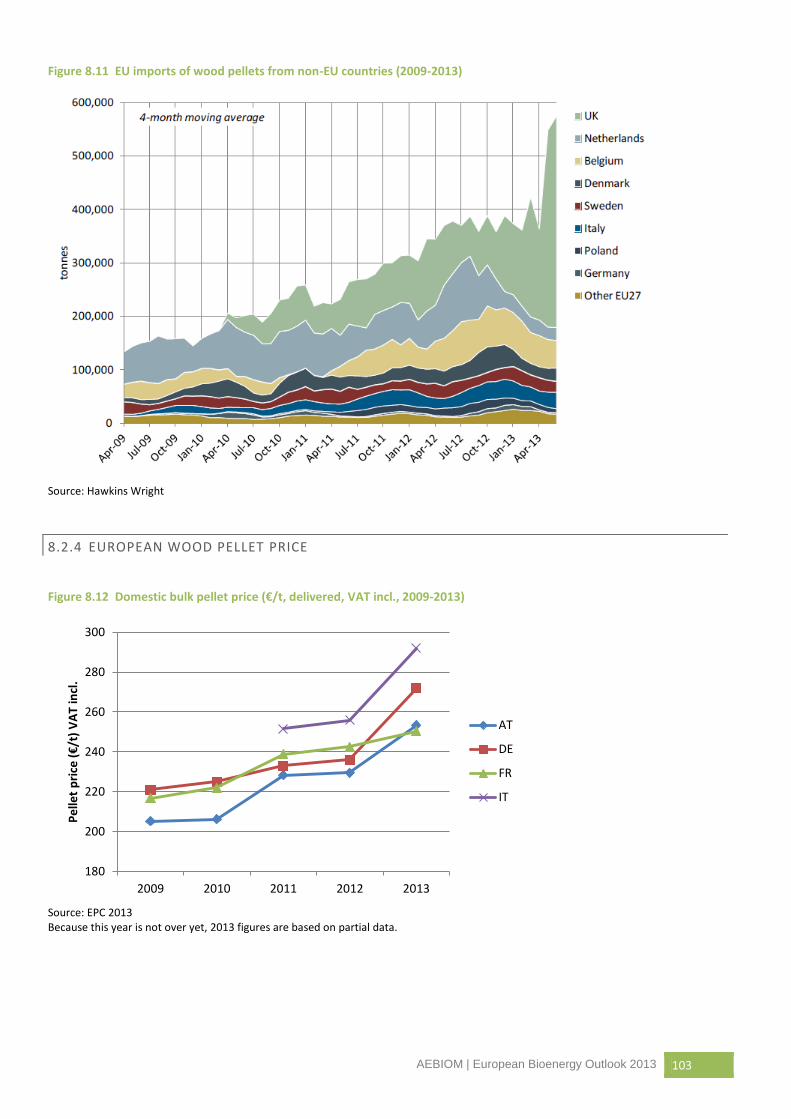
Figure 8.11 EU imports of wood pellets from non-EU countries (2009-2013)
Source: Hawkins Wright
8.2.4 EUROPEAN WOOD PELLET PRICE
Figure 8.12 Domestic bulk pellet price (€/t, delivered, VAT incl., 2009-2013)
Source: EPC 2013 Because this year is not over yet, 2013 figures are based on partial data.
180
200
220
240
260
280
300
2009 2010 2011 2012 2013
Pe
llet
pri
ce (
€/t
) V
AT
incl
.
AT
DE
FR
IT
104 European Bioenergy Outlook 2013| AEBIOM
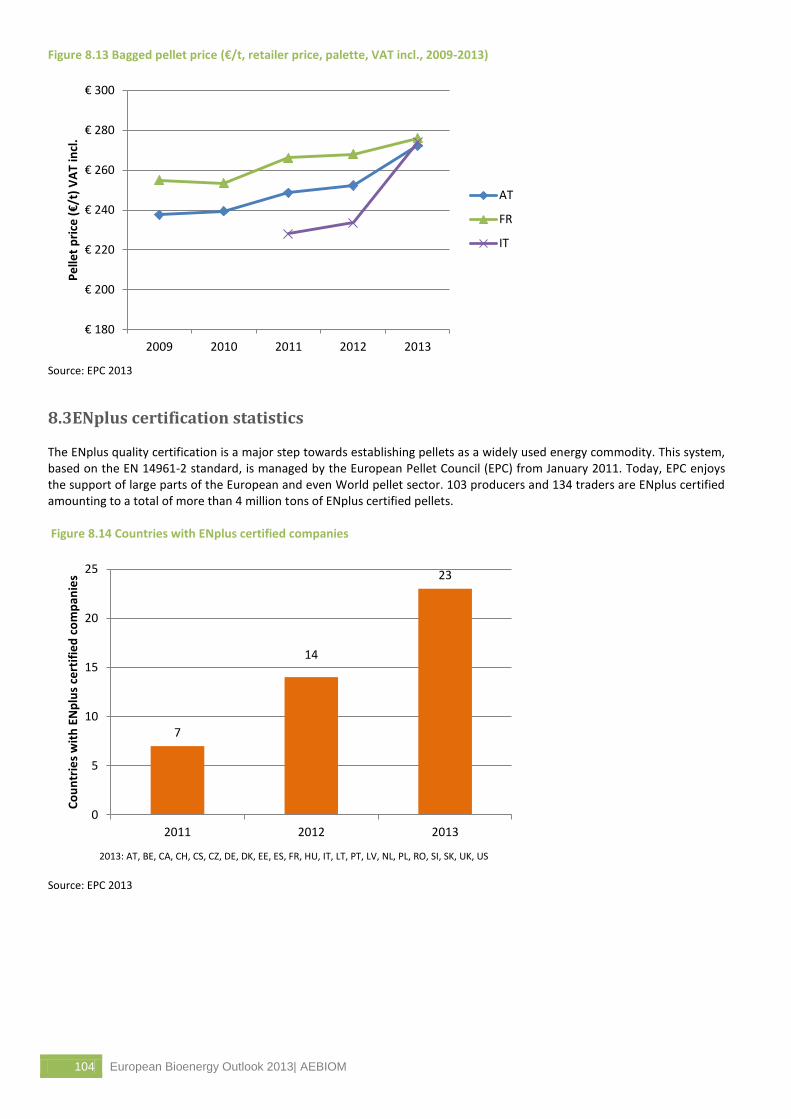
Figure 8.13 Bagged pellet price (€/t, retailer price, palette, VAT incl., 2009-2013)
Source: EPC 2013
8.3ENplus certification statistics
The ENplus quality certification is a major step towards establishing pellets as a widely used energy commodity. This system, based on the EN 14961-2 standard, is managed by the European Pellet Council (EPC) from January 2011. Today, EPC enjoys the support of large parts of the European and even World pellet sector. 103 producers and 134 traders are ENplus certified amounting to a total of more than 4 million tons of ENplus certified pellets.
Figure 8.14 Countries with ENplus certified companies
Source: EPC 2013
€ 180
€ 200
€ 220
€ 240
€ 260
€ 280
€ 300
2009 2010 2011 2012 2013
Pe
llet
pri
ce (
€/t
) V
AT
incl
.
AT
FR
IT
7
14
23
0
5
10
15
20
25
2011 2012 2013
Co
un
trie
s w
ith
EN
plu
s ce
rtif
ied
co
mp
anie
s
2013: AT, BE, CA, CH, CS, CZ, DE, DK, EE, ES, FR, HU, IT, LT, PT, LV, NL, PL, RO, SI, SK, UK, US

AEBIOM | European Bioenergy Outlook 2013 105
ANNEX 9