AE 469/569 TERM PROJECT DEVELOPING CORRECTION FUNCTION FOR TEMPERATURE EFFECTS ON NIR SOYBEAN...
37
AE 469/569 TERM PROJECT AE 469/569 TERM PROJECT DEVELOPING CORRECTION FUNCTION FOR DEVELOPING CORRECTION FUNCTION FOR TEMPERATURE EFFECTS ON NIR SOYBEAN ANALYSIS TEMPERATURE EFFECTS ON NIR SOYBEAN ANALYSIS Jacob Bolson Jacob Bolson Maureen Suryaatmadja Maureen Suryaatmadja Agricultural Engineering Agricultural Engineering Iowa State University Iowa State University May 4, 2005 May 4, 2005
-
Upload
abner-melton -
Category
Documents
-
view
220 -
download
4
Transcript of AE 469/569 TERM PROJECT DEVELOPING CORRECTION FUNCTION FOR TEMPERATURE EFFECTS ON NIR SOYBEAN...

AE 469/569 TERM PROJECTAE 469/569 TERM PROJECTDEVELOPING CORRECTION FUNCTION FOR DEVELOPING CORRECTION FUNCTION FOR TEMPERATURE EFFECTS ON NIR SOYBEAN TEMPERATURE EFFECTS ON NIR SOYBEAN
ANALYSISANALYSIS
Jacob BolsonJacob BolsonMaureen SuryaatmadjaMaureen SuryaatmadjaAgricultural EngineeringAgricultural Engineering
Iowa State UniversityIowa State UniversityMay 4, 2005May 4, 2005

IntroductionIntroduction
NIR instruments play an important NIR instruments play an important role in predicting chemical role in predicting chemical composition and biological properties composition and biological properties of food and agricultural material.of food and agricultural material.
NIR spectroscopy measures the NIR spectroscopy measures the wavelength and intensity of the wavelength and intensity of the absorption of near infrared light absorption of near infrared light (800nm – 2.5μm) by a given sample.(800nm – 2.5μm) by a given sample.

IntroductionIntroduction
NIR is primarily used for the detection of NIR is primarily used for the detection of C-H, N-H and O-H bonds, which relate to C-H, N-H and O-H bonds, which relate to concentration of oil, protein and moisture.concentration of oil, protein and moisture.
The advantages of NIR:The advantages of NIR: a non-destructive procedurea non-destructive procedure minimal sample preparationminimal sample preparation fast analytical techniques (less than 1 minute)fast analytical techniques (less than 1 minute)
Two important factors in NIR analysis:Two important factors in NIR analysis: a spectrum a spectrum reference values reference values

IntroductionIntroduction
The development of calibration model on The development of calibration model on NIR instrument consists of two procedures:NIR instrument consists of two procedures: develop a base calibrationdevelop a base calibration add the samples to the base calibration add the samples to the base calibration
for instrument and temperature for instrument and temperature stabilizationstabilization
Temperature stabilization, collect at grain Temperature stabilization, collect at grain temperatures from -15temperatures from -1500C to 45C to 4500C.C.
(Rippke et all., 1996)(Rippke et all., 1996)

Problem StatementProblem Statement
The method to include some hot and The method to include some hot and cold samples does not work well and cold samples does not work well and quite inconsistent.quite inconsistent.
NIR spectra of liquid component shift NIR spectra of liquid component shift on wavelength axis as temperature on wavelength axis as temperature changes, predicted results become changes, predicted results become less accurate.less accurate.

Problem StatementProblem Statement
Researchers have proven that NIR spectra Researchers have proven that NIR spectra of liquid components shift on the of liquid components shift on the wavelength axis as temperature changes:wavelength axis as temperature changes: The bands corresponding to hydrogen-bonding The bands corresponding to hydrogen-bonding
groups (N-H, O-H bands) are expected to be groups (N-H, O-H bands) are expected to be highly influenced by temperature (Miller, 2001)highly influenced by temperature (Miller, 2001)
Temperature influences the spectra, the Temperature influences the spectra, the increase of temperature allows liberating a increase of temperature allows liberating a part of fixed water – meat measurement part of fixed water – meat measurement (Corbisier et all., 2004)(Corbisier et all., 2004)

ObjectiveObjective
To determine whether a temperature To determine whether a temperature adjustment function could improve adjustment function could improve the accuracy of NIR analysis at the accuracy of NIR analysis at conditions other than room conditions other than room temperature.temperature.

Materials and MethodsMaterials and Methods
Soybean sample Soybean sample temperature set from ISU temperature set from ISU Grain Quality Lab (20 Grain Quality Lab (20 samples)samples)
Run in three conditions: Run in three conditions: cold, room, and hot using cold, room, and hot using Omega G 6110 Analyzer Omega G 6110 Analyzer with temperature with temperature compensation calibration compensation calibration (already exists).(already exists).

Materials and MethodsMaterials and Methods
Recalculate the results using no Recalculate the results using no temperature compensation temperature compensation calibration.calibration.
Calculate the slope from every Calculate the slope from every prediction values of moisture, protein prediction values of moisture, protein and oil using Exceland oil using Excel™™ function. function.
Calculate the average and standard Calculate the average and standard deviation of the slopes.deviation of the slopes.

Materials and MethodsMaterials and Methods
One of the samples was discarded because of One of the samples was discarded because of its extreme values.its extreme values.
Test the slopes on the original samples using Test the slopes on the original samples using this formula:this formula:
Corrected value = Measured value +(m* (25Corrected value = Measured value +(m* (2500C – C – measured temperature))measured temperature))
Calculate the differences between the Calculate the differences between the corrected values at non-room and room corrected values at non-room and room temperature.temperature.
Test the slopes (m, m+sd, m-sd) on the new Test the slopes (m, m+sd, m-sd) on the new seven soybeans samples using the same seven soybeans samples using the same previous procedure. previous procedure.

Result Result Temperature Effect on Spectrum, Bruins Omega G,
Soybeans
-0.250
-0.200
-0.150
-0.100
-0.050
0.000
0.050
0.100
0.150
850 870 890 910 930 950 970 990 1010 1030 1050
Spectrum
Spe
ctru
m v
alue
Room Cold Hot

Result Result Spectra Differences, Bruins Omega G, Soybeans
-0.05
-0.04
-0.03
-0.02
-0.01
0.00
0.01
0.02
0.03
0.04
850 870 890 910 930 950 970 990 1010 1030 1050
Spectra
Sp
ectr
a V
alu
e D
iffer
ence
s
Cold hot

ResultsResults
MoistureMoisture ProteinProtein OilOil
Average (m) Average (m) (%/(%/00C)C) 0.01640.0164 -0.0048-0.0048 0.00630.0063
Std Dev (%/Std Dev (%/00C)C)0.00830.0083 0.01280.0128 0.00420.0042
m+sd (%/m+sd (%/00C)C)0.02470.0247 0.00790.0079 0.01050.0105
m-sd (%/m-sd (%/00C)C)0.00810.0081 -0.0176-0.0176 0.00210.0021
Range (%/Range (%/00C)C)0.01650.0165 0.02550.0255 0.00840.0084

Correction FunctionCorrection Function
M corrected = M measured + (0.0164 M corrected = M measured + (0.0164 (25(2500C- T measured))C- T measured))
P corrected = P measured + (- 0.0048 P corrected = P measured + (- 0.0048 (25(2500C - T measured))C - T measured))
O corrected = O measured + (0.0063 O corrected = O measured + (0.0063 (25(2500C - T measured))C - T measured))
M = MoistureM = Moisture P = ProteinP = Protein O = OilO = Oil

Results (19 Samples)Results (19 Samples)
Moisture Differences Non room and Room Moisture Differences Non room and Room
TemperatureTemperature
Without Without
TemperatureTemperatureUsing Using
CorrectionCorrectionWith With
TemperatureTemperature
CompensationCompensation FunctionFunction CompensationCompensation
Average (%)Average (%) 0.3840.384 0.2080.208 0.3380.338
Std Dev (%)Std Dev (%) 0.2100.210 0.1370.137 0.1770.177

Results Results Moisture Differences of Non-room and Room
Temperature (19 Samples )
-1.0
-0.8
-0.6
-0.4
-0.2
0.0
0.2
0.4
0.6
0.8
0 10 20 30 40 50
Temperature (C)
Mo
istu
re D
iffe
ren
ce
s
(%)
Without temp compensation Correction Function With temp compensation

Results (19 Samples)Results (19 Samples)
Protein Differences Non room and Room Protein Differences Non room and Room
TemperatureTemperature
Without Without
TemperatureTemperatureUsing Using
CorrectionCorrectionWith With
TemperatureTemperature
CompensationCompensation FunctionFunction CompensationCompensation
Average (%)Average (%) 0.4790.479 0.4740.474 0.4570.457
Std Dev (%)Std Dev (%) 0.3090.309 0.3120.312 0.3090.309

ResultsResultsProtein Differences of Non-room and Room
Temperature (19 Samples)
-0.6
-0.4
-0.2
0.0
0.2
0.4
0.6
0.8
1.0
1.2
1.4
0 10 20 30 40 50
Temperature (C)
Pro
tein
Dif
fere
nc
es
(%
)
without temp compensation correction function with temp compensation

Results (19 Samples)Results (19 Samples)
Oil Differences Non room and Room TemperatureOil Differences Non room and Room Temperature
Without Without
TemperatureTemperatureUsing Using
CorrectionCorrectionWith With
TemperatureTemperature
CompensationCompensation FunctionFunction CompensationCompensation
Average (%)Average (%) 0.2000.200 0.1540.154 0.1540.154
Std Dev (%)Std Dev (%) 0.1450.145 0.1130.113 0.1150.115

ResultsResultsOil Differences of Non-room and Room
Temperature (19 Samples)
-0.4
-0.3
-0.2
-0.1
0.0
0.1
0.2
0.3
0.4
0.5
0.6
0 10 20 30 40 50
Temperature (C)
Oil
Diff
eren
ces
(%)
without temp compensation correction function with temp compensation
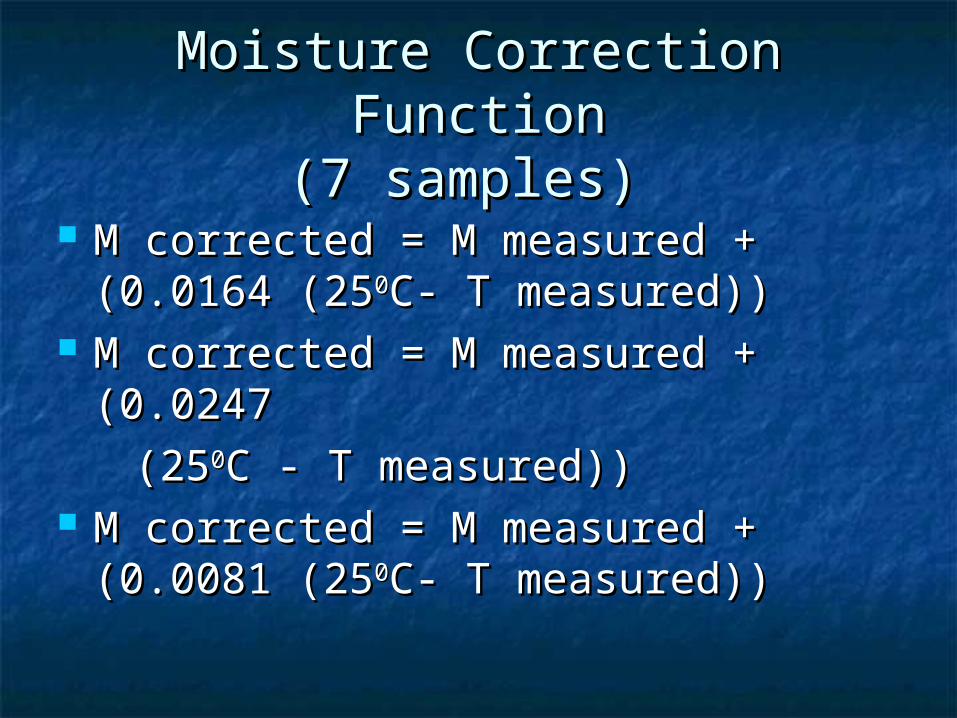
Moisture Correction FunctionMoisture Correction Function(7 samples) (7 samples)
M corrected = M measured + M corrected = M measured + (0.0164 (25(0.0164 (2500C- T measured))C- T measured))
M corrected = M measured + M corrected = M measured + ((0.02470.0247
(25(2500C - T measured))C - T measured)) M corrected = M measured + M corrected = M measured +
(0.0081 (25(0.0081 (2500C- T measured))C- T measured))

Results (7 samples)Results (7 samples)
Moisture Differences Non room and Room Moisture Differences Non room and Room
TemperatureTemperature
Without Without
TemperatureTemperatureUsing Using
CorrectionCorrectionWith With
TemperatureTemperature
Compensation Compensation FunctionFunction CompensationCompensation
Average (%)Average (%) 0.2970.297 0.1280.128 0.1320.132
Std Dev (%)Std Dev (%) 0.1530.153 0.0890.089 0.1030.103

ResultsResultsMoisture Differences of Non-room and Room
Temperature (7 samples)
-0.8
-0.6
-0.4
-0.2
0.0
0.2
0.4
0.6
0 10 20 30 40 50
Temperature (C)
Mo
istu
re D
iffe
ren
ce
s (
%)
without temp compensation correction function with temp compensation

ResultsResultsCorrected Moisture of Individual Sample at
Different Temperature (7 samples)
6.07.08.09.0
10.011.012.013.014.0
5 25 45Temperature (C)
Mo
istu
re (%
)
19980001 19991671 20010461 20020201 20020567
20030028 20030216

ResultsResultsRange Differences of Non-room and Room Corrected
Moisture
-0.6-0.5-0.4-0.3-0.2-0.10.00.10.20.30.4
0 10 20 30 40 50
Temperature (C)
Mo
istu
re D
iffer
ence
s (%
)
m m+sd m-sd

Protein Correction FunctionProtein Correction Function(7 Samples)(7 Samples)
P corrected = P measured + (- P corrected = P measured + (- 0.0048 (250.0048 (2500C - T measured))C - T measured))
P corrected = P measured + (0.0079 P corrected = P measured + (0.0079 (25(2500C - T measured))C - T measured))
P corrected = P measured + (- P corrected = P measured + (- 0.0176 (250.0176 (2500C - T measured))C - T measured))

Results ( 7 samples)Results ( 7 samples)
Protein Differences Non room and Room Protein Differences Non room and Room
TemperatureTemperature
Without Without
TemperatureTemperatureUsing Using
CorrectionCorrectionWith With
TemperatureTemperature
CompensationCompensation FunctionFunction CompensationCompensation
Average (%)Average (%) 0.4500.450 0.3880.388 0.2610.261
Std Dev (%)Std Dev (%) 0.3430.343 0.3210.321 0.1870.187
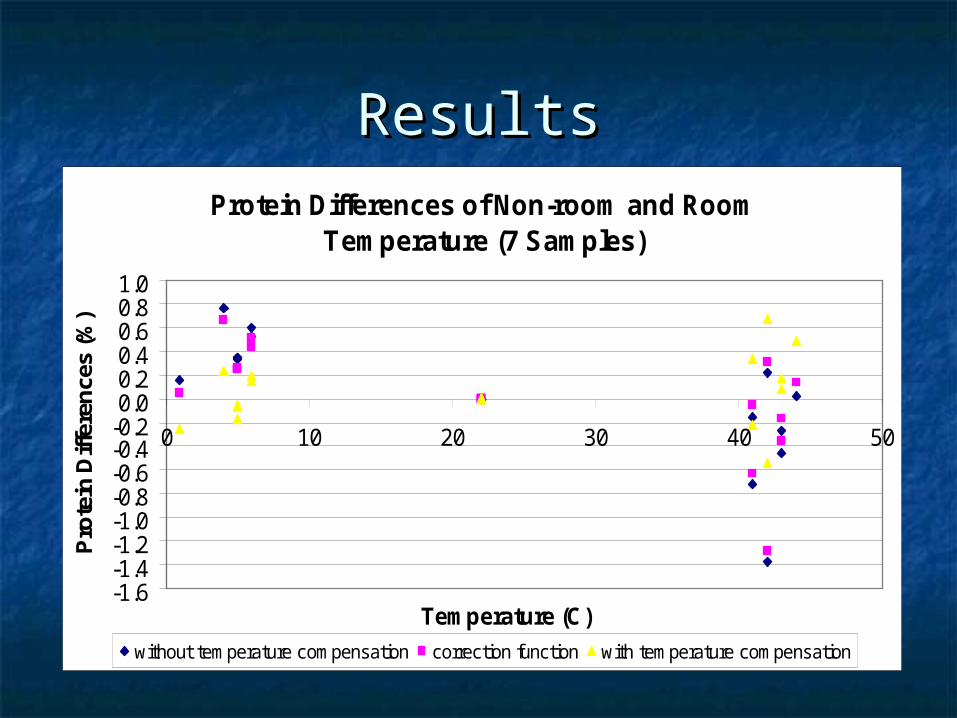
ResultsResultsProtein Differences of Non-room and Room
Temperature (7 Samples)
-1.6-1.4-1.2-1.0-0.8-0.6-0.4-0.20.00.20.40.60.81.0
0 10 20 30 40 50
Temperature (C)
Pro
tein
Diff
eren
ces
(%)
without temperature compensation correction function with temperature compensation

ResultsResultsCorrected Protein of Individual Sample at Different
Temperature (7 samples)
30.031.032.033.034.035.036.037.038.039.040.0
5 25 45Temperature (C)
Pro
tein
(%)
19980001 19991671 20010461 20020201 20020567
20030028 20030216

ResultsResultsRange Differences of Non-Room and Room Corrected
Protein
-2.0
-1.5
-1.0
-0.5
0.0
0.5
1.0
1.5
0 10 20 30 40 50
Temperature (C)
Pro
tein
Diff
eren
ces
(%)
m m+sd m-sd

Oil Correction FunctionOil Correction Function
O corrected = O measured + (0.0063 O corrected = O measured + (0.0063 (25(2500C - T measured))C - T measured))
O corrected = O measured + (0.0105 O corrected = O measured + (0.0105 (25(2500C - T measured))C - T measured))
O corrected = O measured + (0.0021 O corrected = O measured + (0.0021 (25(2500C - T measured))C - T measured))

Results (7 samples)Results (7 samples)
Oil Differences Non room and Room TemperatureOil Differences Non room and Room Temperature
Without Without
TemperatureTemperatureUsing Using
CorrectionCorrectionWith With
TemperatureTemperature
CompensationCompensation FunctionFunction CompensationCompensation
Average (%)Average (%) 0.1360.136 0.1050.105 0.1180.118
Std Dev (%)Std Dev (%) 0.0900.090 0.0720.072 0.0790.079

ResultsResults
Oil Differences of Non-room and Room Temperature (7samples)
-0.20
-0.10
0.00
0.10
0.20
0.30
0.40
0 10 20 30 40 50
Temperature (C)
Oil
Diff
eren
ces
(%)
without temperature compensation correction function with temperature compensation

ResultsResultsCorrected Oil of Individual Sample at Different
Temperature (7 samples)
15.0
16.0
17.0
18.0
19.0
20.0
21.0
22.0
5 25 45Temperature (C)
Oil
(%)
19980001 19991671 20010461 20020201 20020567
20030028 20030216

Results (7 samples)Results (7 samples)Range Differences of Non- Room and Room Corrected
Oil
-0.2
-0.1
0.0
0.1
0.2
0.3
0.4
0 10 20 30 40 50
Temperature (C)
Oil
Diff
eren
ces(
%)
m m+sd m-sd

ConclusionConclusion
1.1. A temperature adjustment function:A temperature adjustment function: M corrected = M measured + (0.0164 (250C- T measured))M corrected = M measured + (0.0164 (250C- T measured)) P corrected = P measured + (- 0.0048 (250C- T measured))P corrected = P measured + (- 0.0048 (250C- T measured)) O corrected = O measured + (0.0063 (250C- T measured))O corrected = O measured + (0.0063 (250C- T measured)) M = MoistureM = Moisture P = ProteinP = Protein O = OilO = Oil
can be used to improve the accuracy of NIR can be used to improve the accuracy of NIR
predicted values at conditions other than room predicted values at conditions other than room temperature.temperature.

ConclusionConclusion
2.2. The correction function applied to soybean The correction function applied to soybean moisture and oil was more consistent than to moisture and oil was more consistent than to protein.protein.
3.3. The implementation of a correction function is The implementation of a correction function is less time consuming than developing less time consuming than developing temperature compensation calibration because temperature compensation calibration because a slope correction can be recalculated for new a slope correction can be recalculated for new calibrations.calibrations.
4.4. The future work should implement the correction The future work should implement the correction function into the soybean calibration function into the soybean calibration development and test with other NIR development and test with other NIR instruments.instruments.