
AE-02188 A SUMMARY OF ECONOMIC CONDITIONS IN …rd.okstate.edu/CED/pdf/Kiowa ORIGINS.pdfsales....
38
AE-02188 A SUMMARY OF ECONOMIC CONDITIONS IN KIOWA COUNTY, OKLAHOMA An ORIGINS Data Product Suzette Barta – Extension Assistant, OSU, Stillwater (405) 744-6186 Susan Trzebiatowski – Student Assistant, OSU, Stillwater (405) 744-6186 Stan Ralstin – Community Development Specialist, OSU, Enid (580) 233-5295 Kent Orrell – County Extension Director, OSU, Hobart (580) 726-5643 Mike D. Woods – Extension Economist, OSU, Stillwater (405) 744-9837 RURAL DEVELOPMENT OKLAHOMA COOPERATIVE EXTENSION SERVICE OKLAHOMA STATE UNIVERSITY November 2002
Transcript of AE-02188 A SUMMARY OF ECONOMIC CONDITIONS IN …rd.okstate.edu/CED/pdf/Kiowa ORIGINS.pdfsales....

AE-02188
A SUMMARY OF ECONOMIC CONDITIONS IN KIOWA COUNTY, OKLAHOMA
An ORIGINS
Data Product
Suzette Barta – Extension Assistant, OSU, Stillwater (405) 744-6186
Susan Trzebiatowski – Student Assistant, OSU, Stillwater
(405) 744-6186
Stan Ralstin – Community Development Specialist, OSU, Enid (580) 233-5295
Kent Orrell – County Extension Director, OSU, Hobart
(580) 726-5643
Mike D. Woods – Extension Economist, OSU, Stillwater (405) 744-9837
RURAL DEVELOPMENT OKLAHOMA COOPERATIVE EXTENSION SERVICE
OKLAHOMA STATE UNIVERSITY
November 2002

ORIGINS http://origins.ou.edu
ORIGINS IS A COOPERATIVE EFFORT OF:
Oklahoma Department of Commerce Division of Research and Planning
The University of Oklahoma Center for Economic and Management Research
Oklahoma State University Department of Agricultural Economics and the
Oklahoma Cooperative Extension Service
ORIGINS is an economic development information system containing current data on Oklahoma. This computerized information service provides bulletins and databases of various economic and demographic data on the state, counties, and cities in Oklahoma.

A Summary of Economic Conditions in Kiowa County, Oklahoma Suzette Barta Extension Assistant Room 527, Ag. Hall Oklahoma State University Stillwater, OK 74078-6026 [email protected]
Susan Trzebiatowski Student Assistant Room 527, Ag. Hall Oklahoma State University Stillwater, OK 74078-6026 [email protected]
Mike Woods Extension Economist Room 514, Ag. Hall Oklahoma State University Stillwater, OK 74078-6026 [email protected]
Kent Orrell Ex. Ed., Agric./4-H & CED 300 S. Main, Courthouse Annex Hobart, OK 73651-4016 [email protected]
Stan Ralstin Comm. Dev. Specialist NW District Ex. Office 205 W. Maple Suite 610 Enid, OK 73701-4011 [email protected]
ABSTRACT
This paper provides a comprehensive overview of the economic conditions of Kiowa County. Information provided includes trends in population, employment, income, and retail sales.
"Oklahoma State University, in compliance with Title VI and VII of the Civil Rights Act of 1964, Executive Order 11246 as amended, Title IX of the Education Amendments of 1972, Americans with Disabilities Act of 1990, and other federal laws and regulations, does not discriminate on the basis of race, color, national origin, sex, age, religion, disability, or status as a veteran in any of its policies, practices or procedures. This includes but is not limited to admissions, employment financial aid, and educational services."
"Readers may make verbatim copies of this document for non-commercial purposes by any means."

1
A Summary of Economic Conditions in Kiowa County, Oklahoma
The economy of Kiowa County is based primarily on services, government, and farming.
These three sectors account for 62% of all jobs in the county. This report is designed to provide
an overview of the economic conditions of Kiowa County. Specifically, trends in population,
employment, income, and retail sales will be examined. No recommendations will be made
regarding the findings of this report.
General Demographic and Population Data
According to the U.S. Bureau of the Census, the population of Kiowa County decreased
9.9 percent from 1990 to 2000. The population of Kiowa County in 2000 was 10,227; of these
persons, 7,848 were living in cities or towns and 2,379 were living in rural areas. From 1990 to
2000, the percentage of rural residents in the county has decreased by 10.1 percent (Table 1).
Total population for Kiowa County was estimated at 9,945 in 2001. Table 2 shows the average
size of household in Kiowa County and its cities and towns. In 2000, Kiowa County averaged
2.35 persons per household.
Table 3 reports school enrollment and educational attainment data for Kiowa County.
Kiowa County had 2,103 students in elementary, high school, college, and graduate school in
2000. Of all residents of the county who were 25 years and over, 77.4 percent had attained a
high school level of education or higher, while 14.8 percent had attained a Bachelor’s degree or
higher.
Figure 1 shows the population growth in Kiowa County for residents age 65 and over and
residents under age 19 from 1980 to 2000. During this time period, the number of residents age
65 and over decreased by 27.1 percent while the number of residents under age 19 decreased by
2
24.5 percent. From 1990 to 2000, the number of older residents decreased by 17.7 percent and
the younger population decreased by 16.5 percent.
From 1980 to 2000, Kiowa County's older population peaked at 2,927 in 1984 and was at
it lowest in 1999 with 2,069 residents age 65 and over. The younger population peaked at 3,584
in 1983 and was at it lowest in 2000 with 2,634 residents under age 19.

3
Table 1 Population of Kiowa County, Oklahoma
1980 1990 2000 % Change 1990 to 2000
Cooperton 31 15 20 33.3%Gotebo 457 370 272 -26.5%Hobart 4,735 4,265 3,997 -6.3%Lone Wolf 613 576 500 -13.2%Mountain Park 557 467 390 -16.5%Mountain View 1,189 1,090 880 -19.3%Roosevelt 396 325 280 -13.8%Snyder 1,848 1,592 1,509 -5.2%Remainder of County 2,885 2,645 2,379 -10.1%Kiowa County 12,711 11,345 10,227 -9.9% Source: U.S. Bureau of the Census, Census 2000

4
Table 2 Population, Housing Units, and Average Household Size for Kiowa County,
Oklahoma 2000
Population Total Housing
Units Average
Household Size Kiowa County 10,227 5,304 2.35Cooperton 20 19 1.67Gotebo 272 157 2.27Hobart 3,997 1,979 2.37Lone Wolf 500 263 2.25Mountain Park 390 210 2.24Mountain View 880 452 2.25Roosevelt 280 179 2.11Snyder 1,509 7.61 2.41 Source: U.S. Bureau of the Census, Census 2000

5
Table 3 Educational Characteristics for Kiowa County, 2000
Enrollment: Persons (3+ Years Old) Enrolled in School 2,390Nursery school, preschool 142Kindergarten 145Elementary school (grades 1-8) 1,115High school (grades 9-12) 674College or graduate school 314 Educational Attainment: Persons 25 years and over 6,963Less than 9th grade 6109th to 12th, no diploma 966High school graduate (includes equivalency) 2,524Some college, no degree 1,511Associate degree 320Bachelor's degree 690Graduate or professional degree 342
Percent high school graduate or higher 77.4Percent bachelor's degree or higher 14.8 Percent high school graduate or higher in OK 80.6 Percent bachelor's degree or higher in OK 20.3
Source: U.S. Bureau of the Census, Census 2000

6
Figure 1. Population for Kiowa County Age Groups 65 and Over and Under Age 19
2,000
2,200
2,400
2,600
2,800
3,000
3,200
3,400
3,600
3,800
1980
1981
1982
1983
1984
1985
1986
1987
1988
1989
1990
1991
1992
1993
1994
1995
1996
1997
1998
1999
2000
Under 19 65 and over

7
Employment Trends
Table 4 shows employment numbers provided by the Oklahoma Employment Security
Commission (OESC), from 1980 to 2002 for Kiowa County with 2002 based on eight months of
data. Employment for the county decreased 13.3 percent over this time period, but increased 4.3
percent from 1990 to 2002 (Figure 2). The unemployment rate during this time peaked at 10.5
percent in 1983 and was its lowest in 2000 at 2.7 percent (Table 4 and Figure 3). The 2002
unemployment rate for the state based on eight months of data is 4.4 percent.
Table 5 provides information on employment by industry for Kiowa County from 1980
and 1990 to 2000. The top three industries that provided the greatest number of jobs in Kiowa
County in 2000 are services, government and government enterprises, and farming respectively.
From 1980 to 2000, growth in employment by industry was largest in the service sector (43.0%)
followed by government and government enterprises (35.4%). Losses were apparent in the
transportation and public utilities sector (-39.7%), retail trade sector (-16.9%), and farm sector
(-3.8%).
From 1990 to 2000, growth in employment by industry was largest in government and
government enterprises (33.0%), followed by services (31.1%). Losses were evident during this
time in the transportation and public utilities sector (-5.0%), wholesale trade (-19.6%), and retail
trade (-6.0%).
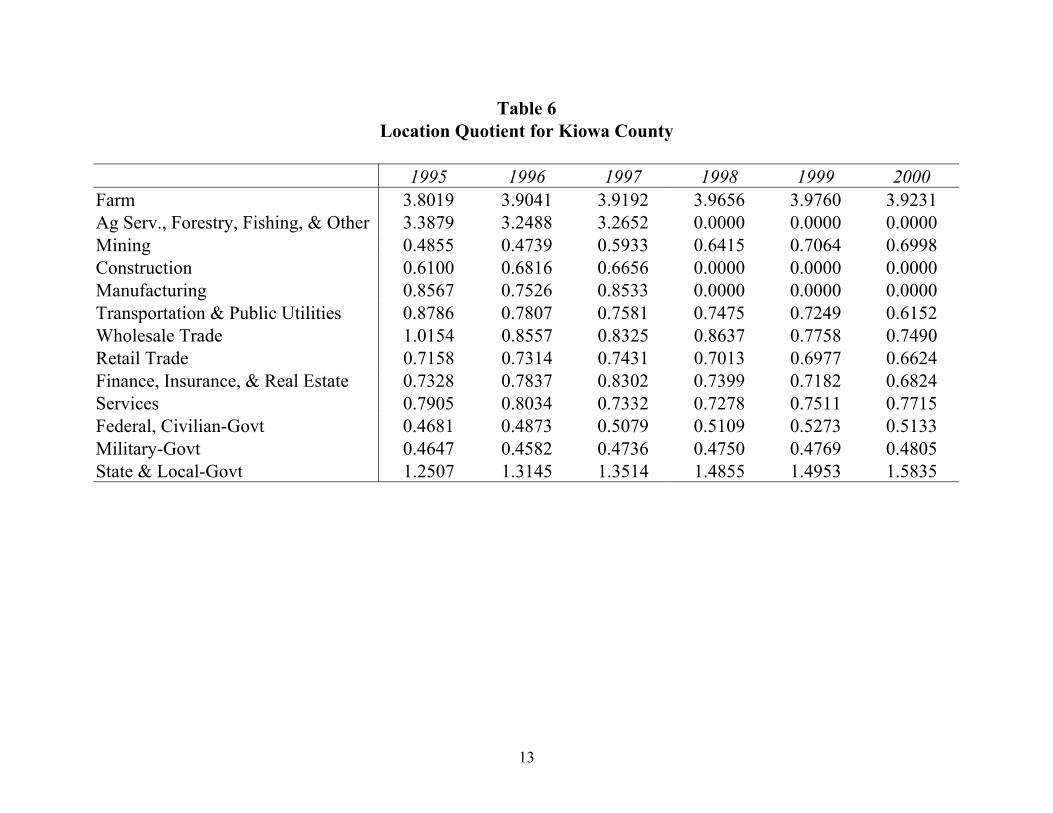
Table 6 further analyzes the conditions in Kiowa County by using a location quotient to
determine a community's degree of self-sufficiency in a particular economic sector. The location
quotient is used to identify exporting activity and is calculated by dividing the percentage of

8
those employed locally in a particular sector by the percentage of those employed in the same
sector statewide.1
The location quotient can be used to interpret whether a county is self-sufficient, is an
importer, or is an exporter in a particular sector. A location quotient that is approximately one
(.75-1.25) suggests self-sufficiency; a quotient less than .75 shows that a county is probably an
importer. If the location quotient is greater than 1.25, the county is considered an exporter in that
sector. The greater the location quotient, the more significant that sector is to the local economy.
According to Table 6 and Figure 4, Kiowa County is likely an exporter in the farm,
agricultural services, and state and local government sectors. It is probably self-sufficient in the
following sectors: manufacturing, wholesale trade, and services. Kiowa County is probably an
importer in the remaining sectors: mining, construction, transportation and public utilities
(borderline), finance, insurance, and real estate (also borderline), federal government, and
military sectors.
1 Community Economic Analysis: A How to Manual. By Ron Hustedde, Ron Shaffer, and Glen Pulver. North Central Regional Center for Rural Development, Iowa State University of Science and Technology, Ames, Iowa. 1984.

9
Table 4 Labor Force Data for Kiowa County, 1980-2002*
Unemployment
Labor Force Employed Unemployed Rate 1980 5,713 5,508 206 3.58 1981 5,767 5,589 178 3.08 1982 5,923 5,672 252 4.20 1983 5,362 4,798 564 10.49 1984 5,460 5,075 385 7.06 1985 5,425 5,059 366 6.76 1986 5,554 5,203 352 6.34 1987 5,512 5,247 265 4.80 1988 5,357 5,099 258 4.80 1989 5,288 5,055 233 4.42 1990 4,796 4,580 217 4.51 1991 4,716 4,490 228 4.82 1992 4,836 4,659 175 3.62 1993 4,882 4,653 229 4.66 1994 4,864 4,673 194 3.99 1995 4,733 4,579 154 3.21 1996 4,611 4,420 192 4.18 1997 4,552 4,328 223 4.87 1998 4,662 4,434 227 4.88 1999 4,754 4,592 161 3.40 2000 4,829 4,702 131 2.68 2001 4,917 4,775 152 3.11 2002* 4,918 4,775 140 2.80
*Based on eight months of data. Source: Oklahoma Employment Security Commission

10
Figure 2. Total Employment for Kiowa County, 1980-2002*
4,000
4,200
4,400
4,600
4,800
5,000
5,200
5,400
5,600
5,800
1980
1981
1982
1983
1984
1985
1986
1987
1988
1989
1990
1991
1992
1993
1994
1995
1996
1997
1998
1999
2000
2001
2002
Source: Oklahoma Employment Security Commission *Based on eight months of data.

11
Figure 3. Unemployment Rate for Kiowa County and the State of Oklahoma, 1980-2002*
0.00
2.00
4.00
6.00
8.00
10.00
12.00
1980
1981
1982
1983
1984
1985
1986
1987
1988
1989
1990
1991
1992
1993
1994
1995
1996
1997
1998
1999
2000
2001
2002
Kiowa County Oklahoma
Source: Oklahoma Employment Security Commission *Based on eight months of data.

12
Table 5 Employment by Major Industry for Kiowa County, 1980, 1990-2000
1980 1990 1991 1992 1993 1994 1995
Farm employment 1,072 880 867 874 963 963 976Ag. services, etc. 163 206 213 188 207 (D) 196Mining (D) 90 93 102 94 (D) 84Construction 187 157 179 181 229 179 148Manufacturing 306 396 384 412 402 414 422Transportation and public utilities 282 179 183 184 203 207 211Wholesale trade (D) 189 191 209 218 212 199Retail trade 715 632 613 596 571 625 610Finance, insurance, and real estate 193 205 189 161 166 180 209Services 848 925 983 1,006 1,008 1,029 1,064Government and government enterprises 816 831 849 866 858 875 881Total full & part-time employment 5,007 4,690 4,744 4,779 4,919 4,990 5,000 % Chg % Chg 1996 1997 1998 1999 2000 1980-2000 1990-2000Farm employment 988 1,004 1,005 1,002 1,031 -3.8% 17.2%Ag. services, etc. 190 195 (D) (D) (D) (D) (D)Mining 72 96 100 105 106 (D) 17.8%Construction 169 167 (D) (D) (D) (D) (D)Manufacturing 371 433 (D) (D) (D) (D) (D)Transportation and public utilities 192 188 195 188 170 -39.7% -5.0%Wholesale trade 163 162 171 156 152 (D) -19.6%Retail trade 631 647 600 603 594 -16.9% -6.0%Finance, insurance, and real estate 227 260 244 245 245 26.9% 19.5%Services 1,114 1,049 1,083 1,139 1,213 43.0% 31.1%Government and government enterprises 897 928 1,005 1,020 1,105 35.4% 33.0%Total full & part-time employment 5,014 5,129 5,196 5,245 5,430 8.4% 15.8%
(D) Not shown to avoid disclosure of confidential information, but the estimates for this item are included in the totals. Source: Regional Economic Information System, Bureau of Economic Analysis
13
Table 6 Location Quotient for Kiowa County
1995 1996 1997 1998 1999 2000
Farm 3.8019 3.9041 3.9192 3.9656 3.9760 3.9231 Ag Serv., Forestry, Fishing, & Other 3.3879 3.2488 3.2652 0.0000 0.0000 0.0000 Mining 0.4855 0.4739 0.5933 0.6415 0.7064 0.6998 Construction 0.6100 0.6816 0.6656 0.0000 0.0000 0.0000 Manufacturing 0.8567 0.7526 0.8533 0.0000 0.0000 0.0000 Transportation & Public Utilities 0.8786 0.7807 0.7581 0.7475 0.7249 0.6152 Wholesale Trade 1.0154 0.8557 0.8325 0.8637 0.7758 0.7490 Retail Trade 0.7158 0.7314 0.7431 0.7013 0.6977 0.6624 Finance, Insurance, & Real Estate 0.7328 0.7837 0.8302 0.7399 0.7182 0.6824 Services 0.7905 0.8034 0.7332 0.7278 0.7511 0.7715 Federal, Civilian-Govt 0.4681 0.4873 0.5079 0.5109 0.5273 0.5133 Military-Govt 0.4647 0.4582 0.4736 0.4750 0.4769 0.4805 State & Local-Govt 1.2507 1.3145 1.3514 1.4855 1.4953 1.5835

14
Figure 4. Location Quotient for Kiowa County, 1995-2000
0
0.5
1
1.5
2
2.5
3
3.5
4
4.5
FarmAg S
erv.
Mining
Const
Manuf
Trans P
ub U
tilWho
lesale
Retail T
rade
F.I.R.E.
Service
sFed
. Gov
t
Military
St & Lo
c Gov
t.
199519961997199819992000

15
Total Personal Income and Per Capita Income
Table 7 provides data showing total personal income by major source for Kiowa County
from 1980 and 1990 to 2000. Overall, total personal income from 1980 to 2000 increased 163.4
percent and from 1990 to 2000 increased 36.7 percent. For these same time periods, the state's
total personal income grew by 180 percent and 60 percent, respectively. From 1990-2000,
Kiowa County's Wage and Salary Income grew by 49.4 percent, and Proprietors' Income
decreased by 11.7 percent. Other Labor Income grew by 56.9 percent while Transfer Payments
increased by 42.7 percent. From 1980 to 2000, Wage and Salary Income grew by 108.1 percent,
Proprietors' Income increased by 163.3 percent, and Other Labor Income grew by 166.2 percent.
Transfer Payments grew by 159.3 percent.
Adjustment for residence income is positive indicating that some residents of Kiowa
County are commuting outside of the county to work. People commuting out of the county to
work still bring their income home with them. Per capita income levels in Kiowa County grew
by 111.0 percent from 1980 to 2000 and by 23.1 percent from 1990 to 2000 (Table 7 and Figure
5).
Transfer payments are often referred to only as “welfare payments,” but in actuality
contain a much more diverse group of recipients. Table 8 gives the breakdown of the various
types of transfer payments received in Kiowa County from 1980 and 1990 to 2000. Income
maintenance benefits (welfare payments) increased by 199.7 percent in the county from 1980 to
2000. From 1990 to 2000, income maintenance benefits increased by 57.7 percent. From 1980
to 2000, medical payments grew the most at 305.7 percent. From 1990 to 2000, payments to
nonprofit institutions increased the most at 74.8 percent.

16
Table 7 Personal Income by Major Source for Kiowa County, 1980, 1990-2000
(In Thousands)
1980 1990 1991 1992 1993 1994 1995 Earnings by place of work 43,981 80,425 67,686 73,742 82,696 83,630 73,997Wage and salary disbursements 28,968 40,336 42,939 44,253 45,885 48,297 48,851Other labor income 3,637 6,171 6,755 7,300 7,850 8,354 7,999Proprietors' income 11,376 33,918 17,992 22,189 28,961 26,979 17,147 plus: Adjustment for residence 6,601 6,268 6,402 6,900 7,246 7,362 7,830plus: Dividends, interest, and rent 24,580 40,431 39,656 37,296 34,058 34,829 36,823plus: Transfer payments 20,348 36,985 38,526 42,137 43,456 45,047 48,670less: Personal cont. for social insurance 1,897 3,609 3,951 4,046 4,244 4,543 4,736 Total Personal Income ($1,000) 7,347 14,157 13,302 14,174 14,738 15,216 14,952 Per capita personal income (dollars) 93,613 160,500 148,319 156,029 163,212 166,325 162,584 % Chg % Chg 1996 1997 1998 1999 2000 1980-2000 1990-2000Earnings by place of work 71,505 84,001 91,797 97,527 99,909 127.2% 24.2%Wage and salary disbursements 49,415 53,619 55,622 58,918 60,274 108.1% 49.4%Other labor income 8,287 8,745 9,076 9,271 9,681 166.2% 56.9%Proprietors' income 13,803 21,637 27,099 29,338 29,954 163.3% -11.7% plus: Adjustment for residence 8,563 8,804 9,226 9,183 9,841 49.1% 57.0%plus: Dividends, interest, and rent 37,412 38,151 39,915 38,275 39,778 61.8% -1.6%plus: Transfer payments 50,129 49,108 50,011 51,660 52,768 159.3% 42.7%less: Personal cont. for social insurance 4,479 4,596 4,563 4,840 4,772 151.6% 32.2% Total Personal Income ($1,000) 15,323 16,518 17,870 18,738 19,352 163.4% 36.7% Per capita personal income (dollars) 163,130 175,468 186,386 191,805 197,524 111.0% 23.1%
Source: Regional Economic Information System, Bureau of Economic Analysis

17
Figure 5. Per Capita Personal Income for Kiowa County, 1980-2000
0
5,000
10,000
15,000
20,000
25,000
1980
1981
1982
1983
1984
1985
1986
1987
1988
1989
1990
1991
1992
1993
1994
1995
1996
1997
1998
1999
2000
Source: Regional Economic Information System, Bureau of Economic Analysis

18
Table 8 Transfer Payments by Type for Kiowa County, 1980,1990-2000
(In Thousands)
1980 1990 1991 1992 1993 1994 1995 Ret. & disab. insurance benefit pymts 10,603 17,412 18,119 18,812 19,435 20,024 20,639Medical payments 4,843 11,842 12,298 13,808 14,674 15,685 17,701Income maintenance benefit payments 2,216 4,211 4,523 5,625 5,345 5,376 6,129Unemployment insurance benefit pymts 248 258 298 464 453 260 231Veterans benefit payments 1,403 1,628 1,687 1,724 1,817 1,883 1,961Fed educ. & trng. asst. pay. (excl. vets) 88 127 101 106 94 108 156Other payments to individuals (L) (L) 50 (L) (L) (L) 57Payments to nonprofit institutions 581 707 731 806 905 954 1,019Business payments to individuals 365 758 719 744 691 712 777Total transfer payments ($1,000) 20,348 36,985 38,526 42,137 43,456 45,047 48,670 % Chg % Chg 1996 1997 1998 1999 2000 1980-2000 1990-2000Ret. & disab. insurance benefit pymts 20,479 20,994 21,284 21,107 21,345 101.3% 22.6%Medical payments 19,079 17,278 17,860 18,899 19,649 305.7% 65.9%Income maintenance benefit payments 6,348 6,252 6,172 6,688 6,641 199.7% 57.7%Unemployment insurance benefit pymts 314 300 296 342 282 13.7% 9.3%Veterans benefit payments 1,975 2,219 2,346 2,483 2,618 86.6% 60.8%Fed educ. & trng. asst. pay. (excl. vets) 129 208 161 160 118 34.1% -7.1%Other payments to individuals 81 (L) (L) (L) (L) (L) (L)Payments to nonprofit institutions 962 1,022 1,051 1,139 1,236 112.7% 74.8%Business payments to individuals 762 793 797 796 838 129.6% 10.6%Total transfer payments ($1,000) 50,129 49,108 50,011 51,660 52,768 159.3% 42.7%
(L) Less than $50,000, but the estimates for this item are included in the totals. Source: Regional Economic Information System, Bureau of Economic Analysis

19
Trends in Retail Sales
Table 9 presents county sales tax collections for Kiowa County from fiscal years 1994 to
2002. Sales tax collections for the county increased from nearly $187,000 in 1994 to over
$230,000 in 2002—an increase of 23.1%. From sales tax collection figures, it is possible to
estimate retail sales activity.
Figure 6 shows estimated retail sales for Kiowa County from 1994 to 2002. Retail sales
growth can be an important indicator for communities to track over time. Not only are retail
sales an indicator of the strength of an economy, but, since most communities depend on
municipal sales tax revenues to fund their budgets, they also determine a local government's
ability to provide for local services. Furthermore, careful analysis of retail strengths and
weaknesses may indicate possible areas of improvement for communities intent on economic
development through the retention of local retail dollars. Contact your county extension office
for more information about retail market analyses performed by the Cooperative Extension
Service.
Farms and Agriculture
The importance of agriculture may be understated in discussions about total employment
and personal income. Many jobs and salaries are generated in businesses that support
agriculture, but the method of reporting data is such that it is difficult to isolate the agricultural
businesses. For example, a farm supply store would be classified as a retail establishment. To
indicate the magnitude of agriculture in Kiowa County, specific agricultural data were collected.
Table 10 contains farm income and expenditure data as reported by the Bureau of
Economic Analysis for the years 1980 and 1990 to 2000. The volume of sales and expenditures

20
reflects, to some extent, the relationship of agriculture to agri-related businesses. The cash
receipts from marketing plus other income totaled $80,054,000 in 2000, a decrease of 3.2 percent
from 1990 and an increase of 41.0 percent since 1980. Total production expenses were
$59,980,000 in 2000, a decrease of 3.9 percent since 1990 and an increase of 17.2 percent since
1980. Although expenses fell slightly faster than income from 1990 through 2000, total farm
labor and proprietors' incomes still decreased by 19.4 percent from 1990 to 2000, from $23.9
million to $19.3 million in 2000. Figure 7 illustrates the total farm labor and proprietors’ income
in Kiowa County. The decline in 1995-96 is typical for the state; however, many counties had
negative farm income at that time.
Table 11 summarizes Census of Agriculture data for 1982, 1987, 1992, and 1997. In
1997, there were 702 farms, of which 288 operators were classified as full owners, 303 as part
owners, and 111 as tenants. The average size of a farm in Kiowa County in that year was 848
acres. The 1997 market value of agriculture products sold was $51,826,000; the average market
value per farm was $73,826.

21
Table 9 Sales Tax Collections for Kiowa County, OK,
1994-2002
Fiscal Year Tax Rate Months County Collections
1994 0.005 12 186,925.49 1995 0.005 12 215,639.84 1996 0.005 12 198,615.02 1997 0.005 12 205,986.10 1998 0.005 12 244,539.86 1999 0.005 12 251,579.53 2000 0.005 12 233,815.06 2001 0.005 12 224,826.22 2002 0.005 12 230,049.06
Source: Oklahoma Tax Commission

22
Figure 6. Total Retail Sales for Kiowa County, 1994-2002
$0.00
$10,000,000.00
$20,000,000.00
$30,000,000.00
$40,000,000.00
$50,000,000.00
$60,000,000.00
1994 1995 1996 1997 1998 1999 2000 2001 2002
Source: Oklahoma Tax Commission

23
Table 10 Farm Income for Kiowa County, 1980, 1990-2000
(In Thousands)
1980 1990 1991 1992 1993 1994 1995 Total cash receipts and other income 56,787 82,704 77,009 64,922 75,675 69,899 61,305
Less: Total production expenses 51,186 62,446 59,200 53,164 55,440 57,470 54,716Realized net income 5,601 20,258 17,809 11,758 20,235 12,429 6,589
plus: Value of inventory change -3,602 3,722 -10,771 618 -1,572 3,138 -2,410 Total net income including corporate farms 1,999 23,980 7,038 12,376 18,663 15,567 4,179
Less: Net income of corporate farms (L) 1,522 380 1,178 1,244 1,885 181Total net farm proprietors' income 1,993 22,458 6,658 11,198 17,419 13,682 3,998
plus: Farm wages and perquisites 1,188 1,427 1,295 1,108 1,218 1,134 1,337plus: Farm other labor income (L) 58 62 57 78 76 81
Total farm labor and proprietors' income 3,214 23,943 8,015 12,363 18,715 14,892 5,416 % Chg % Chg 1996 1997 1998 1999 2000 1980-2000 1990-2000Total cash receipts and other income 55,741 67,838 73,297 80,360 80,054 41.0% -3.2%
Less: Total production expenses 54,438 59,490 57,398 60,285 59,980 17.2% -3.9%Realized net income 1,303 8,348 15,899 20,075 20,074 258.4% -0.9%
plus: Value of inventory change 1,110 2,548 1,377 -2,425 -1,770 -50.9% -147.6% Total net income including corporate farms 2,413 10,896 17,276 17,650 18,304 815.7% -23.7%
Less: Net income of corporate farms 203 1,206 1,170 250 574 (L) -62.3%Total net farm proprietors' income 2,210 9,690 16,106 17,400 17,730 789.6% -21.1%
plus: Farm wages and perquisites 1,339 1,427 1,387 1,569 1,461 23.0% 2.4%plus: Farm other labor income 87 113 111 105 106 (L) 82.8%
Total farm labor and proprietors' income 3,636 11,230 17,604 19,074 19,297 500.4% -19.4%
(L) Less than $50,000, but the estimates for this item are included in the totals. Source: Regional Economic Information System, Bureau of Economic Analysis

24
Figure 7. Total Farm Labor and Proprietors' Income, Kiowa County, 1980-2000
0
5,000
10,000
15,000
20,000
25,000
30,000
1980
1982
1984
1986
1988
1990
1992
1994
1996
1998
2000
Thou
sand
s of
$

25
Table 11 General Farm Characteristics for Kiowa County
1982 1987 1992 1997
Number of Farms 823 760 692 702Total Acres in Farms 588,400 565,089 558,313 595,283Total Acres in Cropland 361,312 364,857 357,670 361,579Average Size of Farm (acres) 715 744 807 848Percent of Land Area in Farms 90.2 86.7% 86.0% 91.7%Farms with Sales of $2,500 or More 785 672 633 598Average Value of Land And Buildings $523,604 $353,108 $372,699 $379,628Per farm Farm Operators by Tenure: Full Owners 311 273 232 288 Part Owners 362 334 337 303 Tenants 150 153 123 111Farms by Type of Organization Individual or Family 749 687 609 610 Partnerships 65 59 62 72 Corporations 5 12 17 16 Other 4 2 4 4Average Age of Farm Operators 52.7 52.5 54.6 56.1Farm Operators by Principal Occupation Farming 549 482 467 406 Other 274 278 225 296Market Value of Agricultural Products $38,623 $42,948 $45,867 $51,826Sold (in $1,000) Average Market Value of Agricultural $46,929 $56,511 $66,282 $73,826Products Sold per Farm
Sources: 1982 Census of Agriculture, Oklahoma State and County Data, Volume 1 Part 36, U.S. Department of Commerce, Bureau of the Census, Issued July 1984. 1987 Census of Agriculture, Oklahoma State and County Data, Volume 1 Part 36, U.S. Department of Commerce, Bureau of the Census, Issued July 1989. 1992 Census of Agriculture, Oklahoma State and County Data, Volume 1 Part 36, U.S. Department of Commerce, Bureau of the Census, Issued October 1994. 1997 Census of Agriculture, Oklahoma State and County Data, Volume 1 Part 36, U.S. Department of Commerce, Bureau of the Census, Issued March 1999.

26
Summary
This report was intended to provide an overview of the economic base of Kiowa County.
Economic development strategies should utilize the existing economic base to maximize the
benefits to local residents.
Other data sources yield information on Kiowa County. The appendix is a copy of county
profiles for Kiowa County. These profiles were prepared by the Research and Planning Division of
the Oklahoma Department of Commerce and U.S. Census Bureau and yield specific information not
found in other secondary sources. If additional data or analyses are desired, please contact your
county extension director.

27
References
Oklahoma Department of Commerce, Oklahoma Community Profiles Online Databases, Oklahoma Resources Integration General Information Network System Homepage. http://www.odoc.state.ok.us/oknet/commprof.nsf/ (June 1, 2001)
Oklahoma Employment Security Commission, OKLAHOMA Labor Force Data. Online
Databases, Oklahoma Resources Integration General Information Network System Homepage. http://origins.ou.edu/databases/LABOR/ (June 1, 2001).
Oklahoma Employment Security Commission, OKLAHOMA Labor Force Data - Metropolitan
Areas and Counties, January 1999 to December 1999. Monthly releases February 1999 to January 2000.
Oklahoma Tax Commission, Sales Subject to Sales Tax - Oklahoma 77 Counties. Online
Databases, Oklahoma Resources Integration General Information Network System Homepage. http://origins.ou.edu/databases/SST/County/ (June 1, 2000).
Regional Economic Information System, Bureau of Economic Analysis, Personal Income and
Employment Estimates for All Counties and Metropolitan Areas in the United States. Regional Economic Information System, 1969-2000, http://www.bea.doc.gov/bea/
regional/reis/ (May 2002). U.S. Department of Commerce, Bureau of the Census, 1998 Estimates of Resident Population By County. http://www.census.gov/population/estimates/county/ (June 1, 2000). U.S. Department of Commerce, Bureau of the Census, Census 2000 Redistricting Data. http://www.census.gov/Press-Release/www/2001/tables/redist_ok.html (March 12, 2001).

28
Appendix
County Profiles for Kiowa County

29
County: KIOWA Region: Southwest 2000 County Population: 10,227 Labor Force within 30 Miles: 62,500
OVERVIEW Located in southwestern Oklahoma, Kiowa County was formed in 1901 from part of the original Kiowa-Comanche-Apache Indian Reservation area, and was named for the Kiowa Indian tribe. Cattle, agriculture and cash crops are the major sources of income for the county. Special annual events held in Hobart, the county seat, include the Kiowa County Junior Livestock Show, the Arts-Crafts Festival, the Hobart Birthday Celebration, the Kiowa County Free Fair and several Shortgrass Theater productions. The county was also home to author N. Scott Momaday and the Kiowa Tribal Museum and Headquarters in Carnegie. The Kiowa County Historical Society has published six books, which are available at the Kiowa County Museum in Hobart. For additional Information, call the county clerk's office at 580-726-5286. Location: Kiowa County is in southwestern Oklahoma. Climate: The average precipitation is 36.0 inches yearly in this area. January's average temperature is 41.8 degrees Fahrenheit and July's average is 81.1 degrees Fahrenheit. County Seat: Hobart - population 3,997 (2000 census data) Distances: Hobart to: Altus - 35 miles Lawton - 64 miles Oklahoma City - 115 miles. Land Area: 1,030 square milesof rolling plains in the north and mountains and bluffs in the south with two major lakes in the county. POPULATION CHARACTERISTICS The population density of the county is 11.2 persons per square mile. The median age of all persons in the county is 37.6, the female median age is 40.4 and the male median age is 35.1.

30
UTILITIES Utility services are provided primarily by the following carriers: Public Service Co. of Oklahoma, Kiwash Electric Cooperative Oklahoma Natural Gas Co. Southwestern Bell Telephone Co., Alltel of Oklahoma, Inc. LABOR FORCE The Kiowa County labor force was 4,550 in 1997. Participation rate in the county labor force constitutes 63.26% of males and 45.47% of females. An average annual unemployment rate of 4.7% was recorded by the county in 1998 and the per capita personal income for this county is $14,607 for 1997. TRANSPORTATION Kiowa County, like other counties in Oklahoma, has the benefit of modern, quality transportation systems, facilities and services. Major highways in this county are U.S. 183 and SH 54. HOUSING The county has 5,645 housing units and of these 74.2% are owner occupied. The median home value in the county is $27,000, the median housing rental contract is $141.00 per month and the statewide housing units number 1,406,499 of which 68.1% are owner occupied. The statewide median home value is $48,100 TAX STRUCTURE The county tax in Kiowa County is .5%, the state sales tax is 4.5% and the local sales tax for cities in this county can be found in the individual community profiles. The corporate tax statewide is 6%. EDUCATIONAL FACILITIES In Kiowa County 65.0% of persons over 25 years of age have a high school diploma and 11.1% are college graduates. Statewide high school graduates in the same age range total 74.6% and the percent of college graduates over 25 years of age is 17.8%.

31
PRIMARY EMPLOYERS IN THE AREA Major Employers Product/Service Number Employed City/Town CR Industries Oil Seals 312 Hobart Elkview Gen Hospital/Home Health
Medical Services 160 Hobart
Hobart Public Schools Education Services 120 Hobart Highland Supply Co. Florist Supplies 90 Hobart Good Samaritan Home & Center
Medical Services 76 Hobart
Kiowa County Government Services 69 Hobart Wal-Mart Stores Retail Store 59 Hobart City of Hobart Government Services 52 Hobart Roosevelt Granite Co. Monuments 40 Snyder United Super Market Retail Store 40 Hobart INDUSTRIAL SITES AND BUILDINGS Data on Industrial and Building sites are available for this county. Please contact Information Management, of the Oklahoma Department of Commerce for a current printout of this Real Estate Database. Call (405) 815-5144 in Oklahoma City. TOURISM POINTS OF INTEREST Recreation Area - Quartz Mountain State Park Major Lakes - Altus, Tom Steed Major Stream Systems - North Fork of Red River, Washita River Revised May, 2000 Oklahoma Department of Commerce Information Management

32

33

34
35


