AAA 2012/2013 Year-End Holidays Travel Forecast - Home | AAA Newsroom
Upload
bcd-travel-australiaCategory
view
603download
0
1 2015 Industry Forecast © 2014 by Advito. All rights reserved.
IndustryForecast2015

2 2015 Industry Forecast © 2014 by Advito. All rights reserved.
Table of contents
IndustryForecast2015
Executive summary 3
Introduction 4
Trends and 2015 forecast 6
Air 6
Hotel 21
Meetings 28
Car rental 33
Rail 36
Appendix 38
Regional ATP 39
Economy class ratio 46
Advance booking 50
Historical ADR development (key countries) 54
Historical ADR development (key cities) 59
Methodology 62

3 2015 Industry Forecast © 2014 by Advito. All rights reserved. Table of contents
Economists expect the global economy to continue improving in 2015, despite concerns about instability in the Middle East and Ukraine. Oxford Economics forecasts growth of 3.1%, up from 2.6% in 2014.
Corporate travel is on the up too, with demand likely to grow more quickly in 2015. However, we don’t expect airfares to rise sharply. In many regions, especially Asia and Europe, competition is also growing, largely from low-cost carriers (LCCs) on short-haul routes and Middle Eastern airlines in long-haul markets. Even where there’s no change in supply, airlines fear damaging business and consumer confidence by increasing fares too fast. So airfares should rise little more than inflation, and in some markets they may even stay flat or fall.
The U.S. domestic market is the one major exception. Consolidation has reduced competition and is already pushing up airfares in some markets. Unlike in other regions, LCCs are suffering rising costs in the U.S., discouraging them from entering any price wars. With few disruptors left, fares could rise sharply over the next couple of years. However, even in the U.S., airlines fear damaging demand with excessively high airfare increases, possibly risking the record profits they’re already making at current prices.
U.S. buyers will need to use even more detailed data than in the past to identify opportunities in negotiations and contract performance review. Elsewhere, buyers should be able to achieve discounts – as long as they make sure to engage with their travelers about smarter booking. We offer more air recommendations on page 10.
On the accommodation side, hotels are once again seeking corporate rate increases of 6% to 8% on average. But will they settle for much less again in 2015 as they did in 2014? Yes and no. In North America (and, to a lesser extent, Europe), hotels will raise prices steeply for clients unable to drive business to preferred suppliers. But travel buyers with a strong track record of meeting
targets coupled with favorable stay patterns, will successfully contain rate rises yet again. In Asia, new hotel openings will enhance buyers’ negotiating positions. But in Latin America, supply is failing to keep up with demand, and higher inflation will likely push up rates.
A small number of cities where demand is especially high, like New York, continue to push through much higher rate increases than the rest of the world. This trend will continue in 2015.
Overall, we recommend that buyers hold firm and not accept the first set of rates suppliers offer them – while making sure their hotel program is robust enough to hold out for better prices. You can find more hotel recommendations on page 25.
It’s a clear seller’s market for meetings in 2014 thanks to booming demand and, in North America and Europe, little new supply. Once again, however, the long-term uncertainty common among all travel suppliers means rate increases will stay reasonable for well-organized corporate buyers.
Late bookers can expect to face availability challenges and higher prices. In recent years, clients have booked nearer and nearer to the date of the meeting. To secure well-priced deals, buyers should start booking further ahead whenever they can, especially with signs of lead-times lengthening again. Watch out too for a rise in extras (such as food and beverage service fees), which hotels are using to push up total price. See page 31 for more meetings recommendations.
Car rental suppliers want to raise corporate rates after years of flat pricing, but we see no evidence for this in the market. However, the situation cannot remain the same forever, and 2015 may be the year rates finally do go up, though probably by no more than 2-4%. Find out how to keep your rates stable on page 34.
Executive summary

4 2015 Industry Forecast © 2014 by Advito. All rights reserved. Table of contents
Economic backgroundThe headline figures hide differing fortunes for the developed economies and emerging markets. For many years, weakness in the developed economies has contrasted with ever strengthening growth in emerging markets, but this trend is now reversing. As developed economies recover, the emergers are seeing their economies slow. Developed economiesRebounding from a weather-hit first quarter, the U.S. economy may grow by 1.5% in 2014. Strong fundamentals should ensure that growth accelerates to 3.2% in 2015.
As the Eurozone finally delivers a tentative recovery, economic growth across Europe will advance from just 0.4% in 2013 to 1.0% in 2014, and then to 1.9% in 2015. The performance of individual countries will vary widely. Germany and the U.K. will drive the recovery, both growing by around 2%.
Emerging marketsWeaker trade and investment have softened growth in emerging markets. Oxford Economics has lowered its 2015 forecast for these countries from 5.1% to 4.7%. Even China is slowing as it reduces its reliance on investment and exports: growth is forecast to dip to 7% in 2015. With debt close to 250% of GDP, a Chinese banking crisis remains a real risk, with global consequences.
Introduction
Source: Oxford Economics, August 2014
Source: Oxford Economics, August 2014
2012 2103 2015
2.8%
-0.1%
4.7%
2.5%
2.6%
3.1%
3.6%
1.9%
0.4%
4.8%
2.7%
2.8%
3.5%
2.4%
2.9%
1.6%
4.2%
2.4%
3.7%
3.8%
3.1%
North America
Europe
Asia
Latin America
Middle East
Africa
Southwest Pacific
World economic GDP growth
2013
2.4% 2014 2015
2.6%
Regional economic growth forecasts 2012-2015
3.1%
2014
1.6%
1.5%
4.4%
1.4%
3.5%
3.5%
3.2%

5 2015 Industry Forecast © 2014 by Advito. All rights reserved. Table of contents
Four big economic risks
Oil pricesOil prices have generally been stable. In the 12 months to June 2014, the Brent crude spot price ranged between US$107 and US$112 per barrel, although it spiked just before and after that period. The U.S. Energy Information Administration (EIA) forecasts average oil prices of US$110 in 2014, up marginally from $109 in 2013. Like the Economist Intelligence Unit, the EIA expects prices to drop to US$105 in 2015, as new supply comes on-stream.
Barring any extreme geo-political events, future oil prices should remain stable. Extra supply and little increase in demand will keep the market well-supplied. There is a risk that increased political tension, particularly in the Middle East and Ukraine, may place upward pressure on prices. Therefore, a forecast range of US$107-US$112 is a safer assumption.
Oil price stability has encouraged airlines to reduce their fuel hedging (buying ahead at a guaranteed rate). This exposes them to any sharp rise in oil prices, which they will attempt to pass onto consumers through increased fuel surcharges.
Safety and securityAside from the hotspots in the Middle East and Ukraine, thespread of terrorism in sub-Saharan countries like Kenya andNigeria has become a concern, as has the Ebola virus outbreak.However, no terror, health or other incidents in the past12 months have, at the time of writing, severely affected globalbusiness travel. For now, severe weather continues to be by far the biggest disruptor, although a U.S. government-led tightening of airport security in July 2014 provided an unwelcome reminder of the ongoing threat of terrorism.
Travel demand and price: steady growth expectedGlobal demand for air travel grew 5.2% in 2013 and 6.2% year-over-year (y-o-y) in January-May 2014.
Companies will want to travel more, as economic conditions continue to improve in 2015. Yet more than five years after the height of the global recession, businesses remain cautious about spending too much too soon, so travel growth will be modest rather than spectacular.
The same is true for price. In advanced economies, the combination of growing demand and limited supply expansion should, in theory, push prices up quickly. Yet travel suppliers remain deeply aware that recovery is fragile, so they are reluctant to raise fares and rates too fast. Rises in line with, or just ahead of, consumer price inflation are most likely, although of course we will see many local variations.
In emerging markets, supply continues to increase, but growth in demand is softening. Some of the best deals for corporate travel buyers in 2015 are likely in regions such as Asia-Pacific. A moderation of economic growth in emerging markets may mean less long haul travel by Western companies to these destinations, providing a welcome stabilization or reduction in average trip costs.
IntroductionChinese banking crisis – there’s a low risk of this, but the global consequences would be very serious.
Investors withdraw money from emerging markets – growth would slow even more.
Russia/Ukraine conflict – threatens Russian growth and trade with Europe.
Eurozone deflation – this could spark another recession.
Oil price assumption
US$ 107-112
per barrel

6 2015 Industry Forecast © 2014 by Advito. All rights reserved. Table of contents
AirTrends and 2015 forecast
AfricaNew capacity from Gulf
carriers and Turkish Airlines is driving lower fares on
SW PacificBusiness fares will rise asdemand strengthens, but
Asia
most fares, although
Middle East
Gulf airlines will drive airfares down across all segments.
Latin AmericaAirfares will rise across most
segments, as demand
than capacity.
EuropeRecovering demand and
management will ensure fares rise in most segments.
North America
control will drive up fares in
regional routes.

7 2015 Industry Forecast © 2014 by Advito. All rights reserved. Table of contents
North AmericaCurrent situationDemandDespite an improving U.S. economy, North American air travel demand rose by only 2.6% during the first five months of 2014.
SupplyAirlines restricted capacity growth to 1.8% y-o-y during January-May 2014, and this may have limited the pace of demand increase. International markets saw the biggest increase in supply, due largely to expansion by foreign carriers, most notably Middle Eastern and Latin American airlines.
U.S. carriers have resisted adding more services, as full flights deliver record profits. However, this may change with the three majors – American Airlines, Delta Air Lines and United Airlines – announcing a small number of new international routes for the closing months of 2014.
On U.S. domestic routes, there is little new capacity. Low-cost carriers (LCCs) seem to have lost their appetite for expansion. To offset rising costs, they’re focusing on boosting revenue through improving yield (the amount they earn per seat) instead of increasing passenger numbers. The little new capacity we expect will come from the retirement of small 50-seat regional jet aircraft by the mainline carriers. In most cases, these small jets are being replaced by larger aircraft, thereby increasing capacity per flight. But in some cases, airlines will eliminate service to unprofitable markets.
Having completed mega-mergers in recent years, the three major U.S airlines are consolidating their networks, which is also keeping capacity growth in check. Smaller markets are losing frequencies or entire services as the big three and even Southwest Airlines withdraw from airports dominated by their competitors.
The trend for avoiding direct competition is also spreading to major routes. As part of its AirTran integration, Southwest pulled out of Atlanta-Dallas, leaving Delta (with a hub in Atlanta) and American (with a hub in Dallas) to share the business. Similarly, American exited
Atlanta-New York LaGuardia. But at the same time there have been examples of airlines provoking more direct competition, such as Delta’s move into Dallas Love Field, the home of Southwest Airlines.
In general, competition remains relatively intense, and is more pronounced in major business markets, routes between two hubs, markets where LCCs are especially active and in secondary markets that lack non-stop flights.
PriceOn domestic routes, rising demand coupled with flat capacity and, in some cases, reduced competition can mean only one thing. Fares are rising, and at a faster rate than originally anticipated for 2014. Even so, the increases are often below what the imbalance between supply and demand would suggest. Carriers remain cautious about killing off the recovery with excessive price rises, and are satisfied to earn large profits at current fare levels.
The markets at most risk of major price increases are those where one carrier dominates; fares will rise far slower in competitive and highly competitive markets, such as transcontinental services, where increases will be moderate and in line with inflation. Competition also remains strong on indirect services between secondary cities where passengers have a choice of transfer hubs.
That said, fare increases can be severe on services where competing airlines (especially former LCCs) have withdrawn. For example, average fares on Atlanta-Dallas have risen 25-30%. Meanwhile, the LCCs’ pursuit of higher yields is also increasing average fares, although they remain lower than the big three.
The tightness of supply has encouraged airlines to withdraw access to their cheapest tickets earlier. Since business travelers usually book later than leisure travelers, they are finding it harder to access the lowest fares.
AirTrends and 2015 forecast
In general, competition remains
relatively intense, and is especially
pronounced in major business markets.
8 2015 Industry Forecast © 2014 by Advito. All rights reserved. Table of contents
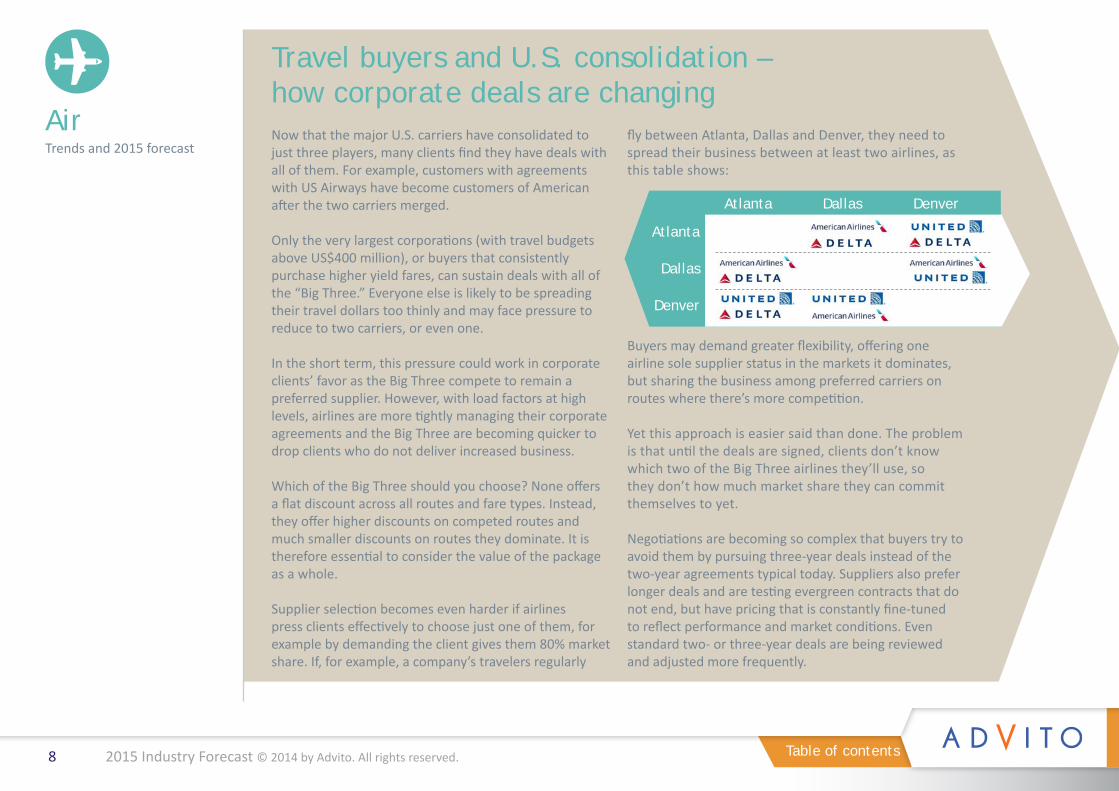
Travel buyers and U.S. consolidation – how corporate deals are changingNow that the major U.S. carriers have consolidated to just three players, many clients find they have deals with all of them. For example, customers with agreements with US Airways have become customers of American after the two carriers merged.
Only the very largest corporations (with travel budgets above US$400 million), or buyers that consistently purchase higher yield fares, can sustain deals with all of the “Big Three.” Everyone else is likely to be spreading their travel dollars too thinly and may face pressure to reduce to two carriers, or even one.
In the short term, this pressure could work in corporate clients’ favor as the Big Three compete to remain a preferred supplier. However, with load factors at high levels, airlines are more tightly managing their corporate agreements and the Big Three are becoming quicker to drop clients who do not deliver increased business.
Which of the Big Three should you choose? None offers a flat discount across all routes and fare types. Instead, they offer higher discounts on competed routes and much smaller discounts on routes they dominate. It is therefore essential to consider the value of the package as a whole.
Supplier selection becomes even harder if airlines press clients effectively to choose just one of them, for example by demanding the client gives them 80% market share. If, for example, a company’s travelers regularly
fly between Atlanta, Dallas and Denver, they need to spread their business between at least two airlines, as this table shows:
Buyers may demand greater flexibility, offering one airline sole supplier status in the markets it dominates, but sharing the business among preferred carriers on routes where there’s more competition.
Yet this approach is easier said than done. The problem is that until the deals are signed, clients don’t know which two of the Big Three airlines they’ll use, so they don’t how much market share they can commit themselves to yet.
Negotiations are becoming so complex that buyers try to avoid them by pursuing three-year deals instead of the two-year agreements typical today. Suppliers also prefer longer deals and are testing evergreen contracts that do not end, but have pricing that is constantly fine-tuned to reflect performance and market conditions. Even standard two- or three-year deals are being reviewed and adjusted more frequently.
AirTrends and 2015 forecast
Atlanta
Atlanta Dallas Denver
Dallas
Denver

9 2015 Industry Forecast © 2014 by Advito. All rights reserved. Table of contents
Chicago – At what is a major hub for both carriers, American Airlines and United will compete for market share in 2015 with locally based customers the winners.
Washington, D.C. – Average fares are high in the federal capital. Concessions made by American and US Airways to secure their merger have allowed JetBlue, Southwest and Virgin America to expand their services. Increased competition from new entrants could push down fares – or the new players may simply choose to enjoy the high yields this market offers.
Seattle – After abandoning their co-operation plans, both Alaska Airlines and Delta are expanding, and increasing head-to-head competition.
Cleveland – United has “de-hubbed” Cleveland, leading to less service for local businesses. It may do the same in Denver, while the merged American/US Airways is likely to de-hub some cities too.
Transcontinental – JetBlue and Virgin America have upgraded their products on their flights from New York to Los Angeles and San Francisco. Competition was already fierce in these markets and will intensify in 2015.
Spotlight on U.S. cities and routes
Strong competition means airlines have found it much harder to raise fares on international routes. One exception is direct transatlantic services to major cities, such as Paris and Frankfurt (but not London – see price spotlight), although passengers can find much lower fares if they are willing to fly indirectly. The same is also true for markets without a direct connection: the joint-ventures based around members of the three global alliances (Oneworld, SkyTeam and Star Alliance) are competing aggressively with each other and, in some cases, with the Middle Eastern airlines (Emirates, Etihad, Qatar Airways and Turkish Airlines) as well.
On trans-Pacific routes, good yields have encouraged U.S. and Asian airlines to add new routes and more seats, but this additional capacity is causing fares to fall again.
OutlookDemandGrowth in demand will accelerate in 2015. Companies have strong cash reserves and U.S. employment figures are improving, as is business confidence. Travel should also receive a boost from an uptick in merger and acquisitions activity.
Good news – U.S.-LondonThe new Delta/Virgin Atlantic joint-venture offers a credible alternative to American/British Airways, so corporate discounts are improving.
Bad news – Philadelphia-EuropeAfter merging with American, US Airways is no longer a disruptor. Corporate discounts are declining on the routes it dominates from Philadelphia to Europe.
Price spotlight on transatlantic routes – good news, bad news
SupplyAirlines will grow capacity more than in the previous five years, mainly by adding more seats to existing routes rather than by network expansion. But don’t expect major changes, especially on domestic routes. The carriers know tight capacity control is helping them push up fares. Air
Trends and 2015 forecast

10 2015 Industry Forecast © 2014 by Advito. All rights reserved. Table of contents
PriceWith the domestic market consolidated around three major carriers, the first steep fare rises started to appear in 2014. This is only the beginning. For now, airlines are generally continuing to post low single-digit fare increases for fear of killing off demand. However, once reduced corporate discounts and early closure of low fare buckets are taken into account, the underlying price paid by business customers is climbing fast. Overall, there will be a few markets where competition remains strong and prices favorable. But these buyer’s markets will reduce in number, and the amount of routes with high average prices will gradually increase.
For 2015, we’re predicting a 2% rise in regional business fares, but expect a more rapid 4% rise in economy fares. We expect intercontinental business fares to go up by 3%, although economy fares should remain flat.
Travel managers need to adapt to reduced competition on domestic flights.• Analyze your air spend in detail route-by-route. • Respond to increasing market complexity (such as new fare
classes) by hiring specialist consultants like Advito to review your spend patterns and recommend negotiating strategies.
• Manage supplier expectations. Use data to show them why one carrier (and sometimes even two) cannot meet your network needs.
• Be realistic. Focus on achieving discounts on routes where you have negotiation leverage, like those where you have premium business and where competition is robust.
• Consider flying indirect on routes where prices have risen too high or book tickets further out from departure to qualify for lower priced restricted tickets.
• If you do want to switch to indirect services, consider the impact on travelers and their work/life balance. Will you use strict policy compliance or persuasion/incentivization to get them to change?
• Be aware that airlines are getting stricter with customers who fail to meet their market-share targets.
• Review contract performance more regularly to take control when meeting with airlines.
• Don’t be afraid to use good data to challenge airlines. If a carrier complains it is receiving less business, show them analysis proving the cause was their uncompetitive pricing or poor availability in lower fare buckets.
Additional fees for services such as hold luggage, seat selection and meals have become a normal way of doing business for airlines over the past few years. Travel buyers continue to press carriers to provide data on what ancillary services their travelers have booked so they can negotiate discounts on this spend. Carriers are resisting revealing this information to keep ancillary spend out of the negotiation: travelers buy most ancillary items after the ticket has already been purchased and most of the spend – especially checking a bag – is unavoidable.
However, airlines are beginning to sell more ancillary items at the same
time they sell the seat, and this will happen increasingly if they introduce IATA’s planned New Distribution Capability (NDC) standards for ticket sales through travel agents. NDC would also lead to airlines bundling services together into packages.
Recommendations• Encourage travelers to buy ancillary
services when they buy their tickets, making it easier to capture data.
• Negotiate elevation for your travelers to higher tiers of preferred airlines’ frequent-flyer programs. Carriers often waive fees on unbundled items for higher-tier members.
Spotlight on ancillary fees
Our recommendations
AirTrends and 2015 forecast
11 2015 Industry Forecast © 2014 by Advito. All rights reserved. Table of contents
EuropeCurrent situationDemandAccording to IATA, overall passenger demand climbed 6.2% y-o-y in Europe from January-May 2014, but corporate market demand is not rising as sharply. Companies are still being very careful with their travel budgets and continue to challenge employees to justify their trips.
The number of short-haul business class tickets purchased continues to fall. Almost all passengers travelling at the front are connecting to or from long-haul services.
SupplyFive LCCs (easyJet, Norwegian, Ryanair, Vueling and Wizz Air) control an ever-growing share of the short-haul market. They fly throughout Europe, not just from their home markets.
Traditional European airlines are retreating from short-haul because their costs are too high to make them profitable. Carriers such as British Airways and Lufthansa mainly use short-haul flights to feed their long-haul networks, where they still make money. Both carriers have withdrawn from regional routes unconnected at either end to their long-haul hubs. We expect Air France-KLM to follow the same trend by migrating more regional flying to its Hop! and Transavia subsidiaries.
On long-haul services, the four big Middle Eastern carriers (including Turkish) provide tough competition for passengers travelling not only to their own region but also to Asia and Africa. They have introduced 500-seat Airbus A380s on many European routes and smaller aircraft to secondary European cities. This provides an attractive option especially for business travelers whose journey cannot be made without a connection.
PriceThe expansion of genuinely low-cost LCCs has kept fares on European routes at reasonable levels for a decade or more. Recently, LCCs have pushed up their average yields by targeting business travelers with higher fares that include “extras,” such as free amendments, free baggage and priority boarding.
Lufthansa is transferring all routes not serving its Frankfurt or Munich hubs to lower-cost subsidiary Germanwings. Originally an LCC, Germanwings now has a higher cost structure than independent LCCs and therefore its fares are higher too. Travelers are beginning to notice.
On long-haul services, consolidation of most of the transatlantic market into three joint-ventures has reduced competition. In practice, most business travelers have a choice of only two joint-ventures, and in some cases, just one. However, demand is still fragile, so fares have not risen significantly yet, although discounts are reducing on direct flights (the London-U.S. market being an exception because of increased competition from Delta/Virgin).
Middle Eastern carrier competition is leading to very attractive pricing on flights to Asia, especially in business class and on routes where the introduction of A380s has dramatically increased capacity and lowered costs per seat. However, there is a danger of European rivals exiting some routes in response, which could push prices back up again.
AirTrends and 2015 forecast

12 2015 Industry Forecast © 2014 by Advito. All rights reserved. Table of contents
Travel managers have long been irritated by airlines covering rising fuel costs by adding a fuel surcharge instead of simply raising ticket prices. The fuel surcharge appears as a box on the ticket known in the aviation industry as the YQ box. Airlines prefer to raise their YQ charge instead of the fare for two reasons:• They give corporate discounts on fares but not on YQ charges• They pay less tax on YQ charges
Now buyers have another reason to be concerned: although fuel costs have remained stable for the last two to three years, YQ charges have continued to rise during that time, from an average of 13% of the total ticket price to 16% today. BCD Travel analysis shows that on some routes in Europe, YQ charges exceed airlines’ entire fuel costs – not just the increases in fuel price that surcharges were originally intended to cover. Since rising fuel costs are no longer an excuse, some carriers have renamed fuel surcharges “international surcharges” or “airline surcharges.”
Recommendations• Demand a breakdown from your airline of the items in the YQ box. Ask the airline to justify its YQ charges.• Let the airlines know when their YQ charges are not competitive with other carriers.• To compensate for increases, push for higher discounts in markets where you have leverage.
OutlookDemandEuropean economies are steadily improving, but companies remain cautious about spending more on travel, especially for internal meetings, so expansion in demand will not be rapid. Businesses are more likely to rely more on managing trip approval than negotiating pricing with suppliers to control costs in 2015.
SupplyTraditional airlines will face increased competition in 2015 as LCCs continue to grow their fleets on short-haul routes and Middle Eastern carriers grow long-haul services. Traditional carriers will resort to both “flight” and “fight” on short-haul: exiting more routes while cutting their costs, for example by introducing more ancillary fees for baggage and food. Expect a mixed response on long-haul too. For example, Lufthansa announced in July 2014 that it is considering a lower-cost long-haul joint-venture with Turkish Airlines.
PriceThe strong position of the LCCs means fares in Europe will remain low, and may even drop further in some markets. LCCs have tended to avoid direct competition with one another. However, this is starting to change as few markets remain without an incumbent LCC, and expansion will increasingly bring them into direct competition. In theory this should force down fares, but instead it’s already encouraging traditional airlines to withdraw from even more routes, including those where only one LCC is currently operating. Abandonment will reduce competition and may create monopolies, which would push prices up once again.
We believe that continued capacity management by Europe’s airlines, coinciding with some recovery in demand will drive up regional fares by between 2% and 3% in 2015.
On long-haul, fares may start to rise faster on transatlantic routes, as airlines operating in joint ventures realize the pricing power of
consolidation. However, for flights to the eastern hemisphere, the continuing introduction of new aircraft by Middle Eastern
carriers should push down prices (and push up corporate discounts) even more.
Buyer beware – the great YQ (fuel surcharge) box scandal
Our recommendations
• Challenge airlines on their surcharges.• Try to negotiate discounts on ancillary fees as
well. Negotiate frequent flyer program status upgrades or bundle services together at time of purchase to avoid paying ancillary fees.
• Control total air travel costs through demand management – monitoring and limiting the number of trips employees take.
AirTrends and 2015 forecast

13 2015 Industry Forecast © 2014 by Advito. All rights reserved. Table of contents
AsiaCurrent situationDemandAir traffic in Asia rose around 7% y-o-y in the first five months of 2014. The region’s airlines have overcome a slowdown of growth in the Chinese economy. Manufacturing activity is up and exports are rising again. Following the Indian general election result in May 2014, air travel demand is booming, especially on India’s domestic routes.
SupplyFull-service airlines, including Cathay Pacific and Singapore Airlines (SIA), say LCC over-capacity is hitting their business, and they must also contend with stiff competition from Middle Eastern carriers on routes to Europe. However, Asia’s full-service airlines typically command fierce loyalty from regular business travelers because of the quality of their service and the strength of their frequent-flyer programs. Travel managers find it hard to move their travelers to other carriers.
Elsewhere, full-service airlines are flourishing. In China, several carriers are ordering narrow-bodied aircraft to expand their domestic networks. China Southern is developing a hub at Urumqi to tap growing interest in previously under-served western China.
In India, newly launched AirAsia India is adding even more capacity to an already over-supplied low-cost segment. The launch of Tata-SIA later in 2014 will give business travelers an alternative to Air India and Jet Airways for full-service travel, as the airline initially focuses on linking key domestic corporate markets.
The big story in Asia-Pacific is the rapid rise of LCCs. According to The Economist, quoting the Centre for Asia Pacific Aviation (CAPA), LCCs’ share of traffic in the region has boomed from nearly zero to 58% over the past ten years. That compares with a market share of 40% in Europe gained over 20 years. Nine of the world’s 15 busiest international LCC routes are in southeast Asia, according to CAPA figures, which also estimates that the number of LCCs in Asia-Pacific will expand from 47 to 59 by the end of 20151.
There is more growth to come. LCCs have only 7% market share in China, where the authorities want to encourage budget airline expansion (although they have not deregulated fares enough in the past to allow this to happen). The low-cost model is also starting to be used for flights over four hours, operated by niche carriers like AirAsia X and Scoot.
However, there are strong signs that LCCs have grown too fast. One major player, Singapore’s Tigerair, has grounded aircraft and closed or sold its businesses in Australia, Indonesia and the Philippines, as it tries to cut group losses. Qantas subsidiary Jetstar Asia has suspended growth and even the region’s largest LCC, AirAsia, is delaying introducing new aircraft.
Spotlight on Asia’s low-cost carriers
U.S. carriers have been adding new routes from a variety of cities to Asia, especially in China. In June 2014:• United launched San Francisco-Chengdu. • American launched Dallas/Fort Worth-Shanghai and Dallas/Fort Worth-Hong Kong.• Delta launched Seattle-Hong Kong and Seattle-Seoul, joining existing flights to Beijing,
Shanghai and Tokyo as it develops a trans-Pacific hub at Seattle.
Chinese carriers are upgrading their cabin service on trans-Pacific routes to compete, leading to growing sales through travel management companies.
Spotlight on trans-Pacific routes
AirTrends and 2015 forecast
1 The Economist, 17 May 2014

14 2015 Industry Forecast © 2014 by Advito. All rights reserved. Table of contents
PriceAlthough demand is strong, aggressive competition is helping prevent fares from rising rapidly. As in Europe, traditional carriers face price competition from LCCs on short-haul and from Middle Eastern airlines on long-haul. However, the Middle Eastern carriers have started to raise their fares from a very low base and are now only marginally cheaper than European competitors on routes to Europe.
Two traditional airlines are also discounting because of poor sales for other reasons: Thai Airways, because of political unrest in Thailand; and Malaysia Airlines, following the fatal loss of aircraft in March and July 2014.
However, the price that companies in Asia pay for air travel continues to depend less on what airlines are offering and more on what their travelers prefer. Travel managers find it difficult to encourage travelers to select an alternative to the airline offering their favorite loyalty program. Travel managers have had less influence over travelers in Asia Pacific than in other parts of the world, but signs of improved control have surfaced during 2014 as companies focus more on saving costs.
OutlookDemandAlthough economic growth has slowed over the past year, it is unlikely to slow much further in 2015, and Asia’s economy is arguably stronger with expansion cooling to a more sustainable level. Barring a Chinese banking crisis or other unexpected problems, demand for air travel should grow healthily again. The rise of middle-income leisure travel in countries like China and India will add to competing demand for seats faced by business passengers.
SupplyExcessive LCC growth should curb expansion in 2015, and some capacity may be lost through airline failures and mergers. But in the Indian market, new entrants like AirAsia India should lift available seats on domestic routes by as much as 10%.
A key long-haul route in global corporate travel, Singapore-New York, has been affected by SIA cancelling its non-stop service between the two cities. With all options now requiring a stop en route, whether with the same carrier or not, the number of competing choices has opened up, helping to prevent fares from rising.
Price spotlight on Singapore-New York
AirTrends and 2015 forecast
2 Flightglobal, 30 May 2014

15 2015 Industry Forecast © 2014 by Advito. All rights reserved. Table of contents
Our recommendations
• Many companies still have major opportunities to improve cost reductions through better data. A high-quality TMC can provide reporting to identify savings through close analysis.
• There are more carrier choices than ever in the region. Don’t be afraid to look at and use all options.
• Communicate more with travelers about how they can achieve savings. Create exception reporting about travelers who book outside policy. In the past, Asian companies have not acted on this information, but attitudes are changing.
• Asian travelers are even bigger users of smartphones than Westerners. Use this technology to engage, educate and win buy-in, maybe through gamification and other incentives.
AirTrends and 2015 forecast
PriceStrong competition in most markets is likely to push average ticket prices down again, and we’re forecasting a 2% drop in regional fares in 2015. India is a case in point, where AirAsia’s launch has launched a pre-emptive fare war among the country’s LCCs.2
Companies will also pursue savings by urging travelers to be more flexible about carrier choice. Employees are starting to use LCCs for leisure trips, and this familiarity will persuade them to try the same airlines for business trips too. With many carrier choices also available on long-haul routes, travelers will increasingly accept they should buy the best fare on the day, regardless of the airline.
Hong Kong is among the markets facing rising fares, with airlines increasing prices two or three times per year. Companies may respond by shifting some travelers from business class to premium economy on long-haul flights and taking advantage of “early bird” and other promotional fares. Across Asia we expect intercontinental business fares to rise by 2%, contrasting to a 3% fall in economy fares.

16 2015 Industry Forecast © 2014 by Advito. All rights reserved. Table of contents
Latin AmericaCurrent situationDemandAir demand jumped around 7% in Latin America in the first five months of 2014, according to IATA. Fast growing markets include Colombia and Peru. Brazil is the region’s powerhouse, accounting for 60% of BCD Travel’s business in Latin America. It has become one of the top ten spend markets worldwide for business travel3, although demand for the 2014 FIFA World Cup masked what would otherwise have been disappointing figures this year as the economy struggles.
SupplyAirlines based both inside and beyond Latin America have continued to add aircraft and launch more routes. LCCs are also becoming popular, with business as well as leisure travelers, especially in Brazil and Mexico. However, there remain fewer LCCs than in regions such as Europe and Asia.
In spite of all this growth, new supply is not keeping pace with booming demand, so flights are full and business passengers struggle to find seats at the times they want to travel. Airlines want to increase capacity even more, but cannot buy aircraft fast enough.
Meanwhile, new pan-Latin American group LATAM is still trying to get the best from the 2012 merger of LAN of Chile and TAM of Brazil. The two airlines have made progress in their integration, though it’s less than was hoped for.
PriceWith demand outstripping supply, prices are rising steadily but not steeply. Airlines like their aircraft full and fear losing passengers by raising fares too quickly.
Full aircraft are preventing business travelers from buying lower advance fares, which are taken up by leisure travelers. Business travelers are not helped in some Latin American countries by a culture of lengthy approval processes, including booking their seat before permission to fly is given. Delays are leading to higher fares and rebooking fees. Multinational companies are starting to change this practice in their Latin American subsidiaries.
OutlookDemandAlthough there are question marks about the Brazilian economy, overall demand throughout the region will keep growing. Not only do Western companies want to tap the region’s raw materials, but Latin Americans are becoming consumers in their own right - and avid travelers too. The proportion of passengers on flights to the U.S. who originate from Latin America, for example, will continue growing during 2015.
SupplyAirlines will add more aircraft next year, but not as fast as they would like.
PriceDemand pressure should force fares up faster than in 2014, but the slowdown in Brazil will remind airlines they need to ensure prices don’t rise too quickly. The threat of inflation could also push fares upwards. Generally we expect Latin American fares to rise by 2% to 3%, although we think intercontinental economy fares will fall by 2%, as the softening economic situation takes some heat out of demand in major markets like Brazil.
Our recommendations
• Analyze data in partnership with your TMC to figure out which alliance group you should use.
• Make sure you negotiate deals with at least some discount, even on very busy flights. This can also prevent travelers from wasting time looking for lower fares on the internet.
• Replace old-fashioned approval processes that prevent travelers from making smart, fast booking decisions.
AirTrends and 2015 forecast
3 Global Business Travel Association

17 2015 Industry Forecast © 2014 by Advito. All rights reserved. Table of contents
Middle EastCurrent situationSupply in the Middle East rose 11% in the first five months of 2014, but demand grew even faster at 14%. The Middle East’s economy is growing strongly but most of the increased air traffic comprises transfer passengers from other regions flying with ever-expanding Emirates, Etihad and Qatar Airways.
Intense competition from these Gulf carriers (and Turkish) is preventing other airlines from pushing up average ticket prices. While the Gulf carriers are using fleet expansion to create new areas of demand, profitability is being hit by the heavy discounts needed to fill seats. In response, the Gulf carriers are delaying or cancelling new aircraft orders and speeding up the retirement of older equipment.
OutlookCapacity growth has slowed during 2014 and this should continue into 2015 as the Gulf carriers look to improve demand still further and eventually move fares upwards. However, this process will take a while, so prices should remain highly competitive for at least another year. For this reason, we forecast business fares will fall by between 1% and 3% in 2015, and economy fares by 3% to 4%.
Our recommendations
Business travelers have a good choice of airlines in the Middle East, but prices may start to firm up from 2016, so prepare by improving travel management basics, such as policy and data analysis.
AirTrends and 2015 forecast

18 2015 Industry Forecast © 2014 by Advito. All rights reserved. Table of contents
AfricaCurrent situationDemand and supplyAfrica has so far been the weakest region for aviation in 2014. Demand was flat in the first five months of the year. South Africa is the continent’s major economic power, but its economy has slowed dramatically and businesses are cutting back on travel.
Supply across Africa grew 4% in the same period. Once again, the Middle Eastern carriers, particularly Turkish Airlines, have continued to add routes into the region, while Brussels Airlines has been expanding too. On regional routes, LCCs are emerging, including Aski in West Africa; Precision Air in Kenya, Tanzania and Uganda; and Cemair in South Africa. After stalling for a couple of years, Fastjet has announced expansion plans, while Kenya Airways is copying a model adopted by Western carriers such as Lufthansa by transferring many short-haul routes to low-cost subsidiary Jambojet.
PriceIn countries where there are more seats than customers, including South Africa and Uganda, fares are stable and airlines are offering discounted promotional fares to business customers. In countries where there are more customers than seats, including Tanzania and Rwanda, fares are rising.
OutlookThe economic situation in South Africa could drive small fare reductions in 2015. Elsewhere, expect more LCCs to launch and existing ones to expand, although not all will survive. Across Africa we predict regional fares to remain flat, although business fares should rise by 2%. With the Middle Eastern carriers adding even more capacity, the overall increase in supply is expected to more than balance the growth in demand, perhaps leading to lower average ticket prices. We’re forecasting a drop in intercontinental fares of between 2% and 3%.
Our recommendations
• Encourage travelers to book as early as possible.
• With more supply than demand in several countries, such as South Africa and Kenya, this is a good time to negotiate new corporate deals.
• Make sure your TMC is checking the special promotional fares some African carriers are offering.
• Ensure passengers understand the rules for their ticket, such as whether amendments and cancellations are allowed.
AirTrends and 2015 forecast

19 2015 Industry Forecast © 2014 by Advito. All rights reserved. Table of contents
Southwest PacificCurrent situationDomestic demand in Australia, the region’s largest market, is starting to return as business recovers from a weak 2013. Qantas is engaged in a capacity war with Virgin Australia, in which the two carriers have adopted very different strategies.4 Virgin Australia has cut back some capacity, and has also slowed its regional growth plans, as it integrates Skywest as Virgin Australia Regional Airlines. In contrast, Qantas is expanding, and at a faster pace than demand, which is moderating the level of domestic fare rises.
OutlookWe believe continued solid economic growth in the region together with strengthening travel demand from Asia, North America and Europe will support a 2% rise in business fares. Competition between Qantas and Virgin Australia and from Gulf carrier expansion will ensure that economy fares remain essentially flat.
Our recommendations
With competition between Qantas and Virgin Australia so intense, review your rates to make sure you’re getting the best deal
AirTrends and 2015 forecast
4 Flightglobal, Is Qantas still hurting itself?, 17 April 2014

20 2015 Industry Forecast © 2014 by Advito. All rights reserved. Table of contents
2015 Airfare forecasts by regionWe predict small increases in North America and Europe, and more sizable increases in Latin America.
EuropeIntercontinental Business
3.0%
Intercontinental Economy
-1.0%
Regional business 3.0%Regional economy 2.0%
Latin AmericaIntercontinental Business
2.0%
Intercontinental Economy
-2.0%
Regional business 3.0%Regional economy 2.0%
AfricaIntercontinental Business
-3.0%
Intercontinental Economy
-2.0%
Regional business 2.0%Regional economy 0%
North AmericaIntercontinental Business
3.0%
Intercontinental Economy
0%
Regional business 2.0%Regional economy 4.0%
AsiaIntercontinental Business
2.0%
Intercontinental Economy
-3.0%
Regional business -2.0%Regional economy -2.0%
Middle EastIntercontinental Business
-1.0%
Intercontinental Economy
-3.0%
Regional business -3.0%Regional economy -4.0%
Southwest PacificIntercontinental Business
2.0%
Intercontinental Economy
0%
Regional business 2.0%Regional economy 1.0%
Source: Advito
AirTrends and 2015 forecast

21 2015 Industry Forecast © 2014 by Advito. All rights reserved. Table of contents
Key points
A lack of new supply in mature markets will lead hotels to seek rate
increases of 6% to 8% on average. Buyers can limit
rate rises if they run a well-controlled program.
Limited new supply
Rate growth in most of Asia will be only 1% to 3% due to widespread
hotel openings.
Low rate rises in Asia
Beware of hotels limiting corporate rate
availability to encourage a shift to dynamic
pricing.
Dynamic pricing
HotelTrends and 2015 forecast

22 2015 Industry Forecast © 2014 by Advito. All rights reserved. Table of contents
Current situationDemand and supplyHotel guest numbers have tracked steadily upwards in most countries as the global economy recovers. New supply, on the other hand, varies by region. The majority of hotel building has been in emerging markets, with Asia leading the way, followed by Latin America. In May 2014, Asia Pacific had 521,017 rooms in 2,336 hotels either under construction or at the planning stage. Shanghai remains a focus for investment, with more than 9,000 rooms across 37 hotels in the pipeline, while Manila, Jakarta, Chengdu, Bali and Delhi all have more than 5,000 rooms under construction.5 As a result, although demand is pushing up rates in these regions, a plentiful supply of new rooms is moderating these increases.
In developed economies, media reports suggest there has been very limited construction. With demand for rooms increasing, occupancy rates are rising. In both Europe and the U.S., most new development is midscale. These hotels typically satisfy many needs of the business traveler, such as providing Wi-Fi and complimentary breakfast. They are increasingly gaining corporate customers from upper four-star and five-star properties, as companies trade down post-recession to maintain their average rate.
PriceIn spite of limited new supply, weak growth in guest numbers means rates are remaining flat or rising just in line with inflation in most European cities, with exceptions in high-demand locations like London and Paris. In the U.S., where the economy looks healthier, a similar lack of new supply means average rates have climbed 4-6%, while the highest-demand cities, especially New York, Chicago and San Francisco, have seen rates rise by more than 10%.
Yet the situation in the U.S. is more complicated than it first looks. Large hotel companies expected negotiated corporate rate increases of 7-8% during 2014. In reality, they are often only achieving 3-5% outside the top cities. Possible reasons include growing competition from mid-priced chains and lack of confidence about the strength of economic recovery, making hotels anxious to retain corporate clients who consistently deliver business. As a result, clients with well-managed travel programs are successfully negotiating corporate rate rises close to inflation. Those with less developed programs risk increases of 7-10% or no deal at all.
In some emerging markets, especially Asia, plentiful new rooms are applying downward pressure on rates and encouraging hotels to seek deals with corporate clients. Companies with well-managed programs can dictate some very attractive deals in the region.
Similarly, in Africa, South Africa’s economic problems have affected occupancy levels, allowing buyers to negotiate zero changes to existing deals. Rates are also soft in Tanzania. However, in many African countries there is still a shortage of good quality hotels, so rates remain high and are growing fast.
The state of supplier relations is only part of the pricing story. In emerging markets, the bigger problem is that most company travel programs still lack control and compliance. In both Asia and Latin America, for example, travel arrangers often book their executives’ rooms directly with hotels, missing out on the negotiated rate. And with few employees having company credit cards, tracking spend through good-quality card data is often difficult. However, cards are growing in popularity in Latin America, as hyper-inflation concerns have eased.
Buyers are increasingly trying to include breakfast and Wi-Fi in their negotiated rates. Increasing numbers of hotels are offering Wi-Fi for free anyway (having, in some cases, first raised their rates to pay for the service). However, buyers need to check the free Wi-Fi is fast enough for their travelers. Some hotels are making only their most basic, slowest Wi-Fi offering complimentary. Try to include the fastest available service in your negotiations.
Spotlight on hotel Wi-Fi
HotelTrends and 2015 forecast
5STR Global Construction Pipeline Report, May 2014

23 2015 Industry Forecast © 2014 by Advito. All rights reserved. Table of contents
While it’s reasonably straightforward for a business to reclaim VAT in its home country, it’s more complicated to reclaim on expenditure made abroad, such as on hotel accommodation. Companies with mature hotel programs may be leaving enormous sums unclaimed. VAT reclaim may provide a valuable new source of savings. Refer to our paper to find out more.
The traditional hotel request for proposal (RFP) process is lengthy, laborious and costly for both buyers and suppliers. So, for several years, hotels have encouraged corporate clients to switch from fixed negotiated corporate rates to dynamic pricing – a small discount off the best available rate (BAR) on the day. Hotel dynamic pricing is appealing in some ways – for example it may reduce the time-consuming annual negotiation process – but in contrast to the air dynamic pricing model, it’s difficult to measure savings. And, some buyers suspect they will lose heavily during periods of high occupancy and have a harder time budgeting likely travel costs. On the other hand, over the past year, more hotels are reducing the number of rooms available at the corporate rate. This is happening even when the client is guaranteed the corporate rate on specific room types in the hotel that are still unsold. This type of guarantee is known as last room availability (LRA), but hotels are finding ways around this, by manipulating their room type inventory based on demand.
These more sophisticated yield management techniques restrict corporate rates during peak periods and reduce the type of inventory available at the negotiated corporate rate. For example, standard room inventory may change by day of week.
Dynamic pricing can work well for some companies – particularly those whose travelers generally book well in advance of arrival. This new hotel pricing model is still evolving and we expect to see some changes as it develops. To learn more about this trending topic, please reference Advito’s newest white paper, “Rate Expectations: Is dynamic pricing coming of age?” available on the Advito website.
The best solution for this change is to be well organized and proactively manage your fixed rate hotel program. Advito now offers a rate availability auditing tool which checks how often the rate the client negotiated is actually available. Armed with this knowledge, buyers can confront the hotel with clear evidence if they’re not getting the rates they negotiated. Hotels are far less likely to block out customers that are actively monitoring their bookings. Advito also offers a rate parity audit, which compares how the client’s negotiated rate compares to online rates for the same hotel over a six-month period. If the internet rate has been cheaper, Advito or the client will warn the hotel they risk weakening the program because lower rates through the internet encourage travelers to book outside official channels.
Spotlight on reclaiming VAT
Spotlight – are hotels trying to force corporate clients into dynamic pricing?
HotelTrends and 2015 forecast

24 2015 Industry Forecast © 2014 by Advito. All rights reserved. Table of contents
Outlook for 2015We expect there to be more hotel openings in 2015 than 2014. Even large cities in developed countries will see some new supply, but once again most growth will be in emerging markets, most notably in second- and third-tier cities in China and India.
With the exception of Europe, demand is likely to grow again as the global economy strengthens, but although this should give hotels more pricing power (for example, in U.S. cities such as Atlanta, Houston, Dallas and Philadelphia), suppliers are not taking demand growth for granted. Hotels know corporate clients are still nervous about authorizing too many trips and are looking to substitute travel with technology wherever it makes sense.
On balance, therefore, rates are likely to grow in 2015. While some hotels will push for more, increases will be modest outside of the world’s busiest business cities (such as New York and London) where rate rises will continue to be much stronger.
Rate growth will be only 1-3% in many Asian countries, including China, where growth in demand and supply will be well-matched. The same range is expected for most of Europe, where negotiating opportunities remain strong for buyers. Even German cities that have traditionally been ultra-expensive during trade fairs are not selling out as they once did, giving buyers a chance to secure good rates year-round.
The Americas will see most of the highest increases. Rates in the U.S. and Canada will rise 3-4%. In Latin America, a combination of inflation and fast-expanding business travel markets will fuel rate rises of 8-10% in Argentina and 6-8% in Brazil. However, rising travel costs are persuading more companies in Latin America to control their spend; better management should help offset some increases.
The sharing economy – people renting beds, cars and other assets directly from each other via the internet - is quickly gaining popularity in the travel industry. Suppliers like Airbnb and Uber are increasingly adding business travel features to their services, disrupting the traditional supply of accommodation and ground transportation.
These new services provide access to increased and often unique supply, such as accommodation in private residences or the rental of personal vehicles. They offer some clear benefits, such as increased inventory, ease of use and safety & security, but also risks, like the need to resolve regulatory issues relating to these new services, both of which we’ll explore in more depth in a forthcoming paper.
We expect traditional travel suppliers to respond to the sharing economy by developing new services and business models of their own. We’ll show how travel managers can work with the new entrants and traditional suppliers to get the best for their travel programs.
Rates in international gateway cities continue to rise higher than those in smaller destinations in most regions, although heavy rate growth is more widespread in Latin America. Among the cities with the biggest increases this year, and likely to rise sharply again next year, are:
Spotlight on the rise of the sharing economy
Spotlight on global hotel rate hotspots
HotelTrends and 2015 forecast
Latin AmericaSão Paulo, Buenos Aires, Lima, Panama City, Bogotá and Santiago
North AmericaNew York, Chicago, San Francisco and Mexico City
EuropeDüsseldorf, Glasgow, Hannover, Istanbul, St Petersburg and Stuttgart
AsiaKuala Lumpur, Osaka and Suzhou

25 2015 Industry Forecast © 2014 by Advito. All rights reserved. Table of contents
Our recommendations
• Benchmark your rates on an ongoing basis during the sourcing process and between sourcing events to ensure your rates remain competitive.
• Use expert advisors such as Advito to sharpen your reporting and identify savings opportunities. For example, Advito can identify whether a large proportion of your spend is on shoulder nights (Sunday, Monday and Thursday), which would help negotiate a better deal.
• Adopt a layered strategy to rates: - Corporate rates with LRA for hotels where you spend heavily - Chain-wide deals to cover secondary markets and provide protection if preferred hotels are sold out - Buying best on the day for in-fill• Don’t submit to hotel demands for large rate rises, especially if your spend with them is substantial. Hold
to the rates you think are reasonable and below market levels.• Continually track and monitor savings and compliance, and above all keep auditing the rates your
suppliers are publishing.• Negotiate deals for meetings and transient (regular business travel) stays with the same suppliers to
leverage your spend even better (see Meetings section).• Above all, manage your program effectively and deliver on the commitments you make. If not, you will
lose credibility and deals with suppliers.• Channel more bookings through your chosen TMC and online booking tool to ensure you retain control
and leverage volume during negotiations.• Consider using more midscale hotels. Take a good look in all regions at local midscale brands you don’t
know well – some are excellent. Remember too that some U.S. midscale brands are higher quality outside their home market.
HotelTrends and 2015 forecast

26 2015 Industry Forecast © 2014 by Advito. All rights reserved. Table of contents
HotelTrends and 2015 forecast
Africa +2-4% SW Pacific +3-5%
Asia +2-4%Middle East +3-5%Latin America +5-7%
Europe +1-3%North America +3-4%b
Hotels are aiming for corporate rate rises of close to double figures due to a lack of new supply in mature markets, but we expect actual increases will be more modest. There’ll be little rate growth in Asia due to widespread hotel openings. Rate growth continues to be strong in Latin America.

27 2015 Industry Forecast © 2014 by Advito. All rights reserved. Table of contents
2015 Hotel average daily rate (ADR) predictions by key market
CA +3%-4%
MX +4%-5%
VE -1% to +1%
AE -1% to +2%
IN -2%-4%
US +3-4%
BR +6-8%
CL +4-6%
AR +8-10%
ZA +2-4%
SA +3-5%
RU +3-5%
JP +1-3%
KO +5-7%
TH +2-4%
SG +2-4%
AU +3-5%
CN +1-3%
DK +1-3%NO +2-4%FI +3-5%
Source: Advito
HotelTrends and 2015 forecast
CZ-SE +3.5%CH-IE-TK-SK +2-4%BE-FR-NL-UK +1-3%DE-HU-IT-PL +1-3%GR-RO +1-3%AT +0-2%ES -1% to +1%PT -3% to +1%

28 2015 Industry Forecast © 2014 by Advito. All rights reserved. Table of contents
Key points
Meetings have become a seller’s market thanks to rising demand and (in
mature markets) precious little new supply.
Even so, rate rises will be moderate (other
than in New York, San Francisco and a handful of highly popular cities)
for customers who book in advance. Late
bookers will increasingly be challenged by non-
availability and high rates.
Watch out for hotels imposing new or higher fees for extras, ranging
from food and beverage service to utilities to meeting room rental.
Seller’s market
Moderate rate rises
Higher fees for extras
MeetingsTrends and 2015 forecast

29 2015 Industry Forecast © 2014 by Advito. All rights reserved. Table of contents
Current situationDemandDemand for meetings is growing worldwide. Hotels are struggling to respond promptly to all the RFPs (requests for proposal) they receive. Part of the problem is that buyers may issue electronic RFPs to too many suppliers unless they are careful about qualifying which venues they approach.
Although businesses are keen to hold more meetings, they remain very cautious about cost, so they continue to stage events with fewer frills than before the 2009 recession.
In Europe, major destinations such as London are proving particularly popular choices in 2014. In Asia, meeting organizers are exploring new destinations such as Vietnam, Indonesia and Cambodia. The weakening U.S. dollar has also encouraged some Asian companies to stage events in Hawaii and the U.S. West Coast.
SupplyThere is very little new supply in the U.S. or Europe, but significant new meeting space in other regions, especially Asia (China and India in particular). New hotels with meeting space are by no means all five-star properties. Lower-tier brands such as Courtyard by Marriott are also offering good facilities and service, which is helping clients avoid being seen as overspending on events.
Supply is growing in Latin America too, especially Brazil, while in the Middle East major convention centers have opened in Abu Dhabi, Bahrain and Oman to cater for local and European customers.
PriceIn the U.S. and Europe, rising demand but static supply means rates are growing. Rates in the U.S. have returned close to previous record levels of 2007-08. It is a seller’s market in almost all destinations, especially in high-demand cities.
Yet again, seemingly limitless demand is pushing up rates faster in New York City than almost anywhere else. Other U.S. hotspots include Chicago, Los Angeles, Miami and San Francisco. North American buyers can find good deals in Mexico, which has some excellent new convention hotels, but is still dealing with image problems. Cruises are also good value, though meetings at sea can present challenges around managing tax exemptions.
In Europe, Portugal and Ireland are attractively priced right now and there are also good rates available in Italy, Spain and France outside the high season. A small amount of new
capacity is failing to keep pace with booming demand in London and Paris, which both still lack large-scale venues, so rates are rising sharply. Demand is also pushing up rates in Barcelona.
In Asia, political instability has pushed down rates in Bangkok, though buyers risk their event being disrupted or even cancelled. Rates continue to rise moderately in Shanghai and Beijing, but new supply is helping negotiations in other mainland Chinese cities. Rates are rising fast in Singapore.
Spotlight on destination rate hotspots and bargains
MeetingsTrends and 2015 forecast

30 2015 Industry Forecast © 2014 by Advito. All rights reserved. Table of contents
Yet, even though they are in a strong position, suppliers are still nervous about raising rates too quickly. In the U.S., they are keeping headline rate increases moderate but growing revenues through additional charges:• Average service charges for food and beverage have risen from 18-
22% to 22-25%.• Some hotels have begun unbundling basics such as energy used as
separate billable items.• Introducing meeting space rental charges, which are common in
Europe but not the U.S.
A lack of availability is causing other problems for meetings buyers:• Hotels aren’t compromising on terms and conditions in contracts,
including the enforcement of cancellation fees.• Hotels are either refusing to hold unconfirmed bookings or
holding the space for less time before giving it instead to clients willing to make a firm booking. In some cases, hotels do not even tell clients with provisional bookings that they have given the space to another customer, forcing the client to look for a new venue at short notice.
With businesses now prepared to hold more meetings, and rates rising, customers are exploring ways to stop total costs from rising too fast. Some are reducing the length of their events, while others are moving to smaller cities with lower demand. Larger corporations are also finding savings by integrating meetings and transient hotel spend (see below). More generally, buyers are trying to use fewer suppliers to negotiate bigger savings.
For a decade or more, lead-times have been shortening. Customers have left confirmations later and later until they have more certainty about their budget.
During the economic downturn, short lead-times worked well for clients, because suppliers struggled to fill their meeting space. However, now that demand has rebounded, hotels are filling their rooms faster. Lead times will inevitably start to lengthen again, as buyers try to avoid high prices and venue sell-outs on their preferred dates.
The evidence varies by region. In the U.S., where demand is outstripping supply more than anywhere else, lead times did not contract in 2013 for the first time in many years. In 2014, there are signs of lead times lengthening, especially for large-scale meetings and incentive programs, which are generally booked a year or more in advance. Hotels report good levels of signed contracts in place for 2016 and beyond. Customers are booking annual events two or more years ahead with the same chain to improve their bargaining power and reduce time spent on contracting.
There is little evidence yet in Europe of lead times growing, other than for a few large-scale events during peak months (spring and autumn). Some customers continue to expect venues to be available at short notice. And even when they do book well in advance, some are delaying confirmation as long as possible.
Lead times are also short in Asia, and there is no sign of them getting longer, other than for incentives. Even though availability is less of a problem than elsewhere, short-term booking is still giving buyers less negotiating power with hotels.
RecommendationsIn both the U.S. and Europe, availability is likely to become even more of a problem in 2015. Therefore:• Encourage early booking to ensure you get the right venue at the best price.• Try to be more flexible about choice of dates and destination.• Work closely with your meetings agency. Give as much notice as possible
about your likely meeting requirements and how much flexibility you have.• Book multi-year events with the same hotel or chain.
Spotlight on lead-times – are they getting shorter?
MeetingsTrends and 2015 forecast

31 2015 Industry Forecast © 2014 by Advito. All rights reserved. Table of contents
There’s been a lot of hype over the past couple of years about the growth of “hybrid” meetings, where some participants attend the event in person and others take part remotely via phone or video conference. We’ve seen no growth in hybrid meetings over past year. While teleconferencing certainly has its place, organizers conclude that face-to-face interaction is much more effective. And if it’s worth some people meeting in person, then it’s worth all of them meeting in person. Those who are meeting face-to-face often find it hard to interact with people not in the same room, while those who aren’t there are easily distracted by multi-tasking. The technology for remote participation is also expensive, so cost savings are often much smaller than expected.
Where technology – mainly social media – is proving much more useful is in extending the life of meetings by enabling conversation, both before and after the event. During the event, interactive apps (for voting or exchanging contact details, for example) are also highly effective.
Whenever you plan to use video conferencing at a meeting, make sure the venue has enough online bandwidth. And don’t forget to check the cost in advance.
Spotlight on “hybrid” meetings – will they take off?
OutlookDemand will continue to grow worldwide in 2015. Supply will not improve in mature markets. As a result, non-availability and high rates will become even more challenging for late bookers. However, even in 2015, suppliers will back away from sharp price increases, if there’s any suggestion that clients might take their business elsewhere. This should help moderate rate rises. As long as meeting planners book early, they should continue to find pricing reasonable – except, yet again, in the biggest meeting destinations, like New York and San Francisco, where increases will be much higher.
More buyers will respond to tightening demand by looking to fewer preferred suppliers for their meeting needs. However, buyers need to avoid limiting their options too much. Heavy demand is making it harder for a single chain to provide all the availability a client needs.
Interest is growing in the combined management of travel and meetings spend. Companies with mature programs see integration as a key to unlock additional savings, while businesses with newer programs want to apply their learning from transient travel to meetings early on.
Integrating travel and meetings is not just about driving more spend through the same suppliers. Buyers find it greatly improves their risk management, which often is not as advanced as it is for their transient travel program. For example, companies typically have a traveler tracking process for transient travel but not for meetings travel.
Over the past year, BCD Travel has seen increasing numbers of client RFPs request pricing from hotels for both transient and meeting stays. Expect another rise in integrated bids next year, although for the time being companies will integrate supplier deals regionally, not globally.
For more information about integrated travel and meetings, click here. Advito offers a dedicated consulting service to help clients start integration.
Spotlight on integrating travel and meetings
MeetingsTrends and 2015 forecast

32 2015 Industry Forecast © 2014 by Advito. All rights reserved. Table of contents
Our recommendations
• Be realistic in this seller’s market. Choose carefully what concessions you request and work out what you can offer in return.
• As soon as you know you are staging a meeting, start sourcing your venue to secure the space and best rates early.
• Don’t delay going to contract on provisionally booked meeting space.• Limit the number of hotels to which you issue a meetings RFP. Tell hotels how many other suppliers you
have invited to compete so they know they have a realistic chance of winning.• Check everything that is included in the total price, not just the room rate, because the extras are going
up fast.• Negotiate away as many extra charges as possible, but include a budget for those you can’t get waived.
Try at least to include a guarantee that extras will not be increased after the initial price quote.• Switch some meetings to less busy, and therefore less expensive, times of the year.• Check out flight availability and potential fares (especially with your regular preferred airlines) before
finalizing your destination choice.• Channel more meetings through a smaller number of chains.• Consider umbrella agreements with suppliers to standardize terms and conditions for all bookings.
MeetingsTrends and 2015 forecast

33 2015 Industry Forecast © 2014 by Advito. All rights reserved. Table of contents
Key pointsCar rentalTrends and 2015 forecast
Although car rental suppliers claim to be
finally pushing up corporate rates in
the U.S., there is little evidence of this in the
marketplace.
No sign of rate rise
That said, rates will have to move upwards soon, and 2015 may well be the year it happens –
though, even then, only 2-4%.
Rate rises may not stick
Buyers need to pay more attention to their rental programs than usual in 2015, watching out for both higher rates and
more blackout dates in their contracts.
RentalPrograms

34 2015 Industry Forecast © 2014 by Advito. All rights reserved. Table of contents
Current situationGlobal demand is up moderately. In North America, by far the world’s largest car rental market, rental companies generally do a good job of matching supply to demand, but some locations are selling out more often during high-demand periods, such as the holiday season and major sporting events.
Corporate pricing in North America has been flat for several years. Two major suppliers now claim to be pushing corporate rates upwards, but BCD Travel sees no evidence of this so far. The reality is that the market remains extremely competitive. Clients who re-sign supplier agreements without going through an RFP process are achieving zero increases, or in some cases suppliers volunteer lower rates to prevent an RFP taking place.
Fierce competition between the three major car rental companies – Avis Budget Group, Enterprise Holdings and Hertz – is ensuring that corporate rates are not rising, even though demand is rising at a time of tight supply. Enterprise continues to set the pace for lower rates, which it can afford to do because it has a lower cost structure.
It remains to be seen how much longer Enterprise Holdings will continue to undercut its competitors. Its lower rates have helped it pick up some market share, but Hertz and Avis often adjust their prices to avoid losing too much business. Since Enterprise Holdings is not making massive market-share gains, it may change strategy by seeking to boost profits by raising rates and improving yield instead. For now, it seems content with smaller margins, perhaps because its international network and product are not as well-developed as its two competitors. While it may not yet be ready to compete on product instead of price, it is getting closer. Among the problems it still has to resolve is former partner Europcar’s retention of National, Enterprise Holdings’ leading corporate brand, in Europe, forcing Enterprise Holdings to open locations in Europe under the Enterprise name instead.
Suppliers are improving revenue in ways that avoid hiking the headline rate. In particular, they have expanded the number of blackout dates, when corporate rates do not apply, in client contracts. In some cases, they have blacked out the entire summer season at locations with heavy leisure demand. Blackout exceptions may now run to as many as three pages in contracts.
Another change to corporate negotiations is the rise in longer agreements (two to three years). Suppliers are trying to avoid RFPs, which not only give them more work, but have led in recent years to them giving more away on price.
Clients are responding to growing problems with availability by relying more heavily on a strong secondary rental supplier in addition to their primary contracted supplier.
Clients are also moving towards global RFPs. Travelers are becoming more accustomed to driving when abroad. However, the U.S. remains the firm number one market for car rental. On average, at least 80% of car rental spend by multinational companies is in the U.S. Over the last 12-18 months, travel managers have started to pay more attention to their spend elsewhere, and suppliers are looking to grow mainly outside the U.S.
OutlookSupply will stay similar to 2014 levels. Although locations are selling out during the week, their cars are under-used on weekends, deterring rental companies from taking on more vehicles. Demand should rise moderately in line with other travel categories.
Price remains the key uncertainty. A price correction in the U.S. seems inevitable after years of flat corporate rates. This could well happen in 2015, if the economy holds and demand continues to rise. Service and product will keep improving at National/Enterprise, giving the company more confidence to abandon its low pricing points. However, even if rates do start to go up in 2015, the increase will not be severe: 2-4% is likely.
Car rentalTrends and 2015 forecast

35 2015 Industry Forecast © 2014 by Advito. All rights reserved. Table of contents
Our recommendations
• Pay more attention than usual to your car rental program for 2015. The long run of flat pricing will likely end and hidden costs such as extended blackout dates are also pushing up total rental prices.
• Monitor what percentage of reservations your travelers book at a corporate rate. The number could be affected by blackout periods and location sell-outs.
• Check new contracts carefully, including increasing blackout dates. Suppliers will usually climb down if you identify the changes and negotiate them. However, they are unlikely to concede during ultra-high demand dates (such as the Super Bowl).
• Get travelers to use your primary rental supplier as often as possible. They are likely to pay a higher rate every time they use a secondary or non-preferred supplier.
• Reconsider whether car rental is always the best option for your travelers’ needs and your budget. In some circumstances, it makes more sense to steer them through policy toward limousines or taxis, with whom buyers are increasingly negotiating.
Car rentalTrends and 2015 forecast

36 2015 Industry Forecast © 2014 by Advito. All rights reserved. Table of contents
Key pointsRailTrends and 2015 forecast
Political arguments continue to hold back
development of high-speed rail in North America.
North America Demand continues to
grow in Western Europe, but new line openings have tailed off for now. The biggest challenges
are booking and ticketing cross-border journeys
involving more than one service.
Europe
China has overcome worries about safety to
start attracting high-speed rail business passengers in
vast numbers.
High-speedRail

37 2015 Industry Forecast © 2014 by Advito. All rights reserved. Table of contents
AsiaA fatal accident in 2011 caused deep concern about China’s fast-expanding high-speed rail network. But safety fears have receded and the country’s ambitious program is back on track, attracting huge passenger numbers while yet more high-speed lines are built. Daily passengers using the Beijing-Shanghai bullet train service soared by almost 30% from 178,000 in 2012 to 230,000 in 2013, jumping by a further 18% to 272,000 in the first half of 20146, partly fuelled by the country’s poor reputation for air service delays and cancellations.7 Since opening in 2011, more than 220 million passengers have used the Beijing-Shanghai rail service.9
Other key routes where high-speed rail is winning customers from air include Beijing-Hangzhou, Beijing-Nanjing, Beijing-Shenyang and Guangzhou-Changsha. Airlines are beginning to reduce schedules in response. For example, airlines have cut flights from Shenzhen to Xiamen by one-third in response to the 2013 opening of a line that cut rail travel time from 11 hours to four.
China aims to have 120,000 km of high-speed track by 2020. Openings in 2014 include Datong-Xi’an in July, and, later in the year, Lanzhou-Urumqi, connecting the far west of the country by reducing travel time from 21 hours to eight.
Rail travel is also significant in India. It is expected to account for 31% of the country’s total travel spend by 2015. After nearly a decade of no price rises, the Ministry of Railways hiked fares nearly 25% in 2013. India has started work on building high-speed lines.
EuropeAfter several frantic years of line openings, Western Europe’s high-speed rail network expansion has slowed for the time being and the shift of business travelers from air to rail has stabilized. Across the continent, however, Turkey opened most of its first high-speed line, between Istanbul and Ankara, in July 2014. The US$4 billion investment will initially reduce journey times from six hours to 3.5.9
Rail demand continues to grow. Eurostar reported a 6% rise in business passengers for the first six months of 2014. There are even
signs that the high-speed rail market will become more competitive. The Spanish government has invited private operators to launch rival passenger services to state-owned operator Renfe.
The biggest challenge for European rail is the difficulty of buying one through-ticket for a journey through two or more countries. Each national rail network has different processes and systems. To take one small but important example, each operator uses different station codes, and their ticketing systems do not connect with each other. The European Commission has introduced regulations to drive standardization, but we don’t expect major progress any time soon.
One area of improvement is the display of rail on the same screen as air in global distribution systems. Cross-border rail service Thalys is one example, allowing agents to make price and timetable comparisons with air.
North AmericaPassenger numbers on Amtrak’s Acela Express, serving Washington, D.C., New York and Boston, grew 7% in the first six months of 2014. Amtrak is planning to introduce 28 new trains to the line. Departures are often sold out at peak times.10
In spite of this success, the U.S. remains deeply divided over high-speed rail. An upgrade to the Chicago-St Louis line, from 78 mph to 110 mph, is set for partial launch in 2014 with full operation by 2017. But a long-proposed San Francisco-Los Angeles high-speed link has become delayed by legal and political disputes. The same is true for a proposed Toronto-London and Kitchener-Waterloo line in Ontario, Canada. A private scheme to build a Dallas-Houston line looks more likely at this stage to become the first true high-speed service in North America. But this is still some years away: Texas Central Railway is pitching to start building in 2017 and launch service in 2020-2021.
RailTrends and 2015 forecast
6 Travel Daily Asia, 1 July 20147 CNN, Traveling to China? Weeks
of flight disruptions lie ahead, 23 July 2014; TIME, Think Your Flight Delays Are Bad?, 23 July 2014
8 China.org.cn, 1 July 20149 Reuters, Turkey’s Erdogan
trumpets high-speed rail link as election looms, 25 July 2014
10 Progressive Rail Roading, 3 July 2014

38 2015 Industry Forecast © 2014 by Advito. All rights reserved. Table of contents
Appendix
IndustryForecast2015
Appendix 38
Regional ATP 39
Economy class ratio 46
Advance booking 50
Historical ADR development (key countries) 54
Historical ADR development (key cities) 59
Methodology 62
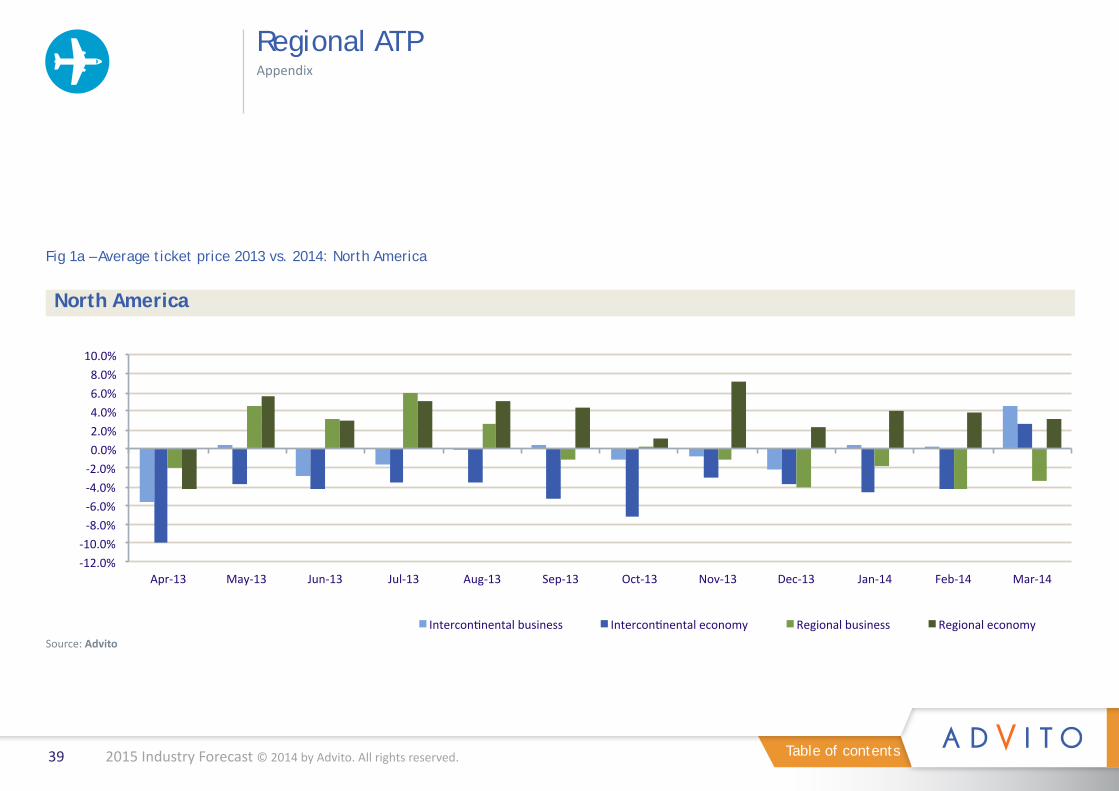
39 2015 Industry Forecast © 2014 by Advito. All rights reserved. Table of contents
-‐12.0% -‐10.0% -‐8.0% -‐6.0% -‐4.0% -‐2.0% 0.0% 2.0% 4.0% 6.0% 8.0%
10.0%
Apr-‐13 May-‐13 Jun-‐13 Jul-‐13 Aug-‐13 Sep-‐13 Oct-‐13 Nov-‐13 Dec-‐13 Jan-‐14 Feb-‐14 Mar-‐14
InterconCnental business InterconCnental economy Regional business Regional economy
North America
Regional ATPAppendix
Fig 1a – Average ticket price 2013 vs. 2014: North America
Source: Advito

40 2015 Industry Forecast © 2014 by Advito. All rights reserved. Table of contents
-‐18.0% -‐16.0% -‐14.0% -‐12.0% -‐10.0% -‐8.0% -‐6.0% -‐4.0% -‐2.0% 0.0% 2.0% 4.0%
Apr-‐13 May-‐13 Jun-‐13 Jul-‐13 Aug-‐13 Sep-‐13 Oct-‐13 Nov-‐13 Dec-‐13 Jan-‐14 Feb-‐14 Mar-‐14
InterconCnental business InterconCnental economy Regional business Regional economy
Asia
Fig 1b – Average ticket price 2013 vs. 2014: Asia
Source: Advito
Regional ATPAppendix

41 2015 Industry Forecast © 2014 by Advito. All rights reserved. Table of contents
-‐10.0%
-‐5.0%
0.0%
5.0%
10.0%
15.0%
Apr-‐13 May-‐13 Jun-‐13 Jul-‐13 Aug-‐13 Sep-‐13 Oct-‐13 Nov-‐13 Dec-‐13 Jan-‐14 Feb-‐14 Mar-‐14
InterconAnental business InterconAnental economy Regional business Regional economy
Europe
Fig 1c – Average ticket price 2013 vs. 2014: Europe
Source: Advito
Regional ATPAppendix

42 2015 Industry Forecast © 2014 by Advito. All rights reserved. Table of contents
Latin America
Fig 1d – Average ticket price 2013 vs. 2014: Latin America
Source: Advito
Regional ATPAppendix
-‐15.0%
-‐10.0%
-‐5.0%
0.0%
5.0%
10.0%
15.0%
Apr-‐13 May-‐13 Jun-‐13 Jul-‐13 Aug-‐13 Sep-‐13 Oct-‐13 Nov-‐13 Dec-‐13 Jan-‐14 Feb-‐14 Mar-‐14
InterconAnental business InterconAnental economy Regional business Regional economy

43 2015 Industry Forecast © 2014 by Advito. All rights reserved. Table of contents
Middle East
Fig 1e – Average ticket price 2013 vs. 2014: Middle East
Source: Advito
Regional ATPAppendix
-‐15.0%
-‐10.0%
-‐5.0%
0.0%
5.0%
10.0%
15.0%
20.0%
25.0%
Apr-‐13 May-‐13 Jun-‐13 Jul-‐13 Aug-‐13 Sep-‐13 Oct-‐13 Nov-‐13 Dec-‐13 Jan-‐14 Feb-‐14 Mar-‐14
InterconBnental business InterconBnental economy Regional business Regional economy
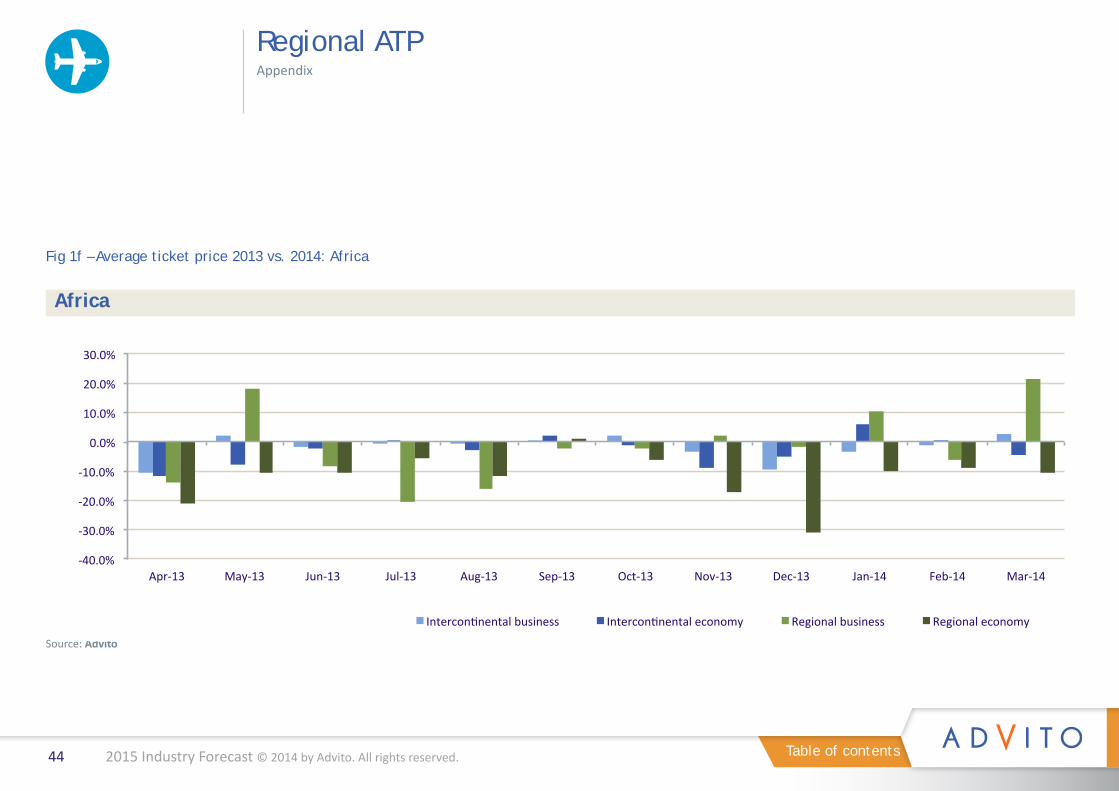
44 2015 Industry Forecast © 2014 by Advito. All rights reserved. Table of contents
Africa
Fig 1f – Average ticket price 2013 vs. 2014: Africa
Source: Advito
Regional ATPAppendix
-‐40.0%
-‐30.0%
-‐20.0%
-‐10.0%
0.0%
10.0%
20.0%
30.0%
Apr-‐13 May-‐13 Jun-‐13 Jul-‐13 Aug-‐13 Sep-‐13 Oct-‐13 Nov-‐13 Dec-‐13 Jan-‐14 Feb-‐14 Mar-‐14
InterconAnental business InterconAnental economy Regional business Regional economy

45 2015 Industry Forecast © 2014 by Advito. All rights reserved. Table of contents
-‐40.0%
-‐20.0%
0.0%
20.0%
40.0%
60.0%
80.0%
100.0%
120.0%
Apr-‐13 May-‐13 Jun-‐13 Jul-‐13 Aug-‐13 Sep-‐13 Oct-‐13 Nov-‐13 Dec-‐13 Jan-‐14 Feb-‐14 Mar-‐14
InterconCnental business InterconCnental economy Regional business Regional economy
Fig 1g – Average ticket price 2013 vs. 2014: Southwest Pacific
Southwest Pacific
Source: Advito
Regional ATPAppendix

46 2015 Industry Forecast © 2014 by Advito. All rights reserved. Table of contents
North America Europe
Fig 3a – Economy class ratio 2012 - 2014 Intercontinental RegionalSource: Advito
Economy class ratioAppendix
56.4%55.9% 55.6%
60.8% 61.4% 61.1%
96.5% 95% 95.8% 95.3%96.7% 96.6%
Based on weighted average for January-March in each year

47 2015 Industry Forecast © 2014 by Advito. All rights reserved. Table of contents
Asia Latin America
Fig 3b – Economy class ratio 2012 - 2014 Intercontinental RegionalSource: Advito
Economy class ratioAppendix
55.6%
92.7% 92.6% 95.9% 96.8% 97.1%93%
57.6% 58.2%
66% 66.9% 69.4%
Based on weighted average for January-March in each year
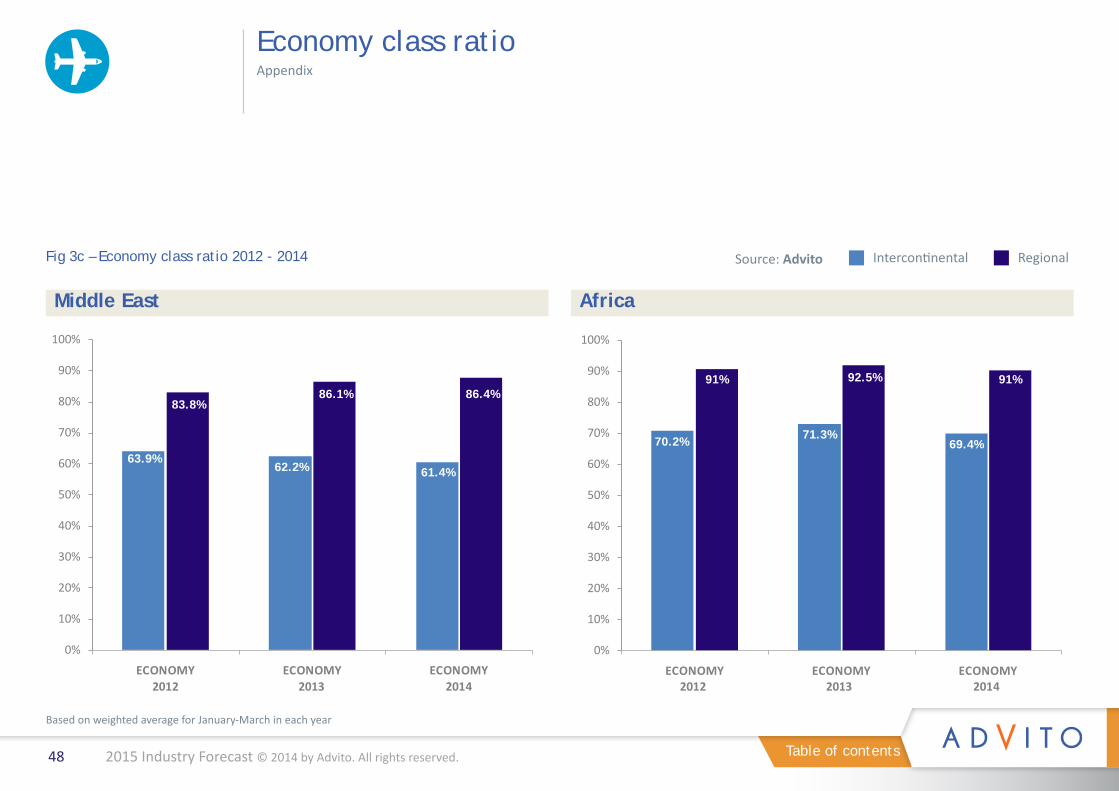
48 2015 Industry Forecast © 2014 by Advito. All rights reserved. Table of contents
Middle East Africa
Fig 3c – Economy class ratio 2012 - 2014 Intercontinental RegionalSource: Advito
Economy class ratioAppendix
0%
10%
20%
30%
40%
50%
60%
70%
80%
90%
100%
ECONOMY ECONOMY ECONOMY
63.9%
83.8%86.1% 86.4%
62.2% 61.4%
70.2%
91% 91%92.5%
69.4%71.3%
Based on weighted average for January-March in each year

49 2015 Industry Forecast © 2014 by Advito. All rights reserved. Table of contents
Southwest Pacifc
Fig 3d – Economy class ratio 2012 - 2014 Intercontinental Regional
Based on weighted average for January-March in each year Source: Advito
Economy class ratioAppendix
62.5%
96.3% 98.1% 98.3%
62%64.2%

50 2015 Industry Forecast © 2014 by Advito. All rights reserved. Table of contents
Fig 4a – Advance booking 2013 and 1014
North America Europe
2013 2014Source: Advito
Advance bookingAppendix
11.5%
19.8%
25.1%
16.5%
27.1%
11.0%
19.3%
25.6%
16.8%
27.3%
0% 5% 10% 15% 20% 25% 30%
0 to 2 Days
3 to 6 Days
7 to 13 Days
14 to 20 Days
21 Days+
Based on weighted average for January-April in each year
13.3%
23.7%
22.7%
12.9%
27.4%
12.2%
23.4%
23.8%
13.5%
27.2%
0% 5% 10% 15% 20% 25% 30%
0 to 2 Days
3 to 6 Days
7 to 13 Days
14 to 20 Days
21 Days+

51 2015 Industry Forecast © 2014 by Advito. All rights reserved. Table of contents
Fig 4b – Advance booking
Asia Latin America
Fig 4b – Advance booking 2013 and 1014
Advance bookingAppendix
Source: Advito 2013 2014
Based on weighted average for January-April in each year
26.5%
27.6%
20.4%
9.9%
15.6%
25.2%
27.6%
20.8%
10.6%
15.8%
0% 5% 10% 15% 20% 25% 30%
0 to 2 Days
3 to 6 Days
7 to 13 Days
14 to 20 Days
21 Days+
22.6%
24.3%
21.1%
11.2%
20.8%
18.8%
21.7%
20.8%
12.1%
26.6%
0% 5% 10% 15% 20% 25% 30%
0 to 2 Days
3 to 6 Days
7 to 13 Days
14 to 20 Days
21 Days+

52 2015 Industry Forecast © 2014 by Advito. All rights reserved. Table of contents
Fig 4c – Advance booking
Middle East Africa
Fig 4c – Advance booking 2012 and 1013
Advance bookingAppendix
Source: Advito 2013 2014
Based on weighted average for January-April in each year
19.4%
24.6%
20.7%
11.6%
23.7%
17.9%
25.0%
22.3%
12.2%
22.7%
0% 5% 10% 15% 20% 25% 30%
0 to 2 Days
3 to 6 Days
7 to 13 Days
14 to 20 Days
21 Days+
17.2%
24.2%
22.0%
11.5%
25.1%
16.5%
22.9%
23.2%
12.8%
24.6%
0% 5% 10% 15% 20% 25% 30%
0 to 2 Days
3 to 6 Days
7 to 13 Days
14 to 20 Days
21 Days+

53 2015 Industry Forecast © 2014 by Advito. All rights reserved. Table of contents
15.7%
25.3%
23.7%
13.9%
21.3%
14.6%
23.7%
27.6%
14.2%
19.9%
0% 5% 10% 15% 20% 25% 30%
0 to 2 Days
3 to 6 Days
7 to 13 Days
14 to 20 Days
21 Days+
Source: Advito
Advance bookingAppendix
Southwest Pacific
Fig 4d– Advance booking 2013 and 1014
Based on weighted average for January-April in each year
2013 2014

54 2015 Industry Forecast © 2014 by Advito. All rights reserved. Table of contents
Historical ADR developmentAppendix
Brazil
China
Canada
France
Fig 2a – Historical Average Daily Rate (ADR) development in 2013/2014 (key countries) ADR growth ADR
Source: Advito
-‐10%
0%
10%
20%
30%
0 50
100 150 200 250 300 350 400
Mar-‐13
Apr-‐1
3
May-‐13
Jun-‐13
Jul-‐13
Aug-‐1
3
Sep-‐1
3
Oct-‐1
3
Nov-‐1
3
Dec-‐1
3
Jan-‐14
Feb-‐1
4
ADR grow
th y-‐o-‐y
ADR in local currency
-‐2%
0%
2%
4%
6%
140 145 150 155 160 165
Mar-‐13
Apr-‐13
May-‐13
Jun-‐13
Jul-‐13
Aug-‐13
Sep-‐13
Oct-‐13
Nov-‐13
Dec-‐13
Jan-‐14
Feb-‐14
Growth y-‐o-‐y
ADR in local currency
-‐10% -‐8% -‐6% -‐4% -‐2% 0%
850 900 950
1,000 1,050 1,100 1,150
Mar-‐13
Apr-‐13
May-‐13
Jun-‐13
Jul-‐13
Aug-‐13
Sep-‐13
Oct-‐13
Nov-‐13
Dec-‐13
Jan-‐14
Feb-‐14
Growth y-‐o-‐y
ADR in local currency
-‐8% -‐6% -‐4% -‐2% 0% 2% 4%
0 20 40 60 80
100 120 140 160 180 200 220
Mar-‐13
Apr-‐13
May-‐13
Jun-‐13
Jul-‐13
Aug-‐13
Sep-‐13
Oct-‐13
Nov-‐13
Dec-‐13
Jan-‐14
Feb-‐14
ADR grow
th y-‐o-‐y
ADR in local currency

55 2015 Industry Forecast © 2014 by Advito. All rights reserved. Table of contents
Germany
Ireland
India
Italy
Fig 2b – Historical Average Daily Rate (ADR) development in 2013/2014 (key countries)
Source: Advito
ADR growth ADR
Historical ADR developmentAppendix
-‐8% -‐6% -‐4% -‐2% 0% 2% 4% 6% 8%
0 20 40 60 80
100 120 140 160
Mar-‐13
Apr-‐13
May-‐13
Jun-‐13
Jul-‐13
Aug-‐13
Sep-‐13
Oct-‐13
Nov-‐13
Dec-‐13
Jan-‐14
Feb-‐14
ADR grow
th y-‐o-‐y
ADR in local currency
-‐15%
-‐10%
-‐5%
0%
5%
7,000
7,500
8,000
8,500
9,000
Mar-‐13
Apr-‐13
May-‐13
Jun-‐13
Jul-‐13
Aug-‐13
Sep-‐13
Oct-‐13
Nov-‐13
Dec-‐13
Jan-‐14
Feb-‐14
ADR grow
th y-‐o-‐y
ADR in local currency
-‐6% -‐4% -‐2% 0% 2% 4% 6%
100 105 110 115 120 125 130
Mar-‐13
Apr-‐13
May-‐13
Jun-‐13
Jul-‐13
Aug-‐13
Sep-‐13
Oct-‐13
Nov-‐13
Dec-‐13
Jan-‐14
Feb-‐14
ADR grow
th y-‐o-‐y
ADR in local currency
-‐10%
0%
10%
20%
30%
0 20 40 60 80
100 120 140 160 180 200
Mar-‐13
Apr-‐13
May-‐13
Jun-‐13
Jul-‐13
Aug-‐13
Sep-‐13
Oct-‐13
Nov-‐13
Dec-‐13
Jan-‐14
Feb-‐14
ADR grow
th y-‐o-‐y
ADR in local currency

56 2015 Industry Forecast © 2014 by Advito. All rights reserved. Table of contents
Japan
Mexico
Korea
Russia
Fig 2c – Historical Average Daily Rate (ADR) development in 2013/2014 (key countries)
Source: Advito
ADR growth ADR
Historical ADR developmentAppendix
-‐2% 0% 2% 4% 6% 8%
18000
20000
22000
24000
Mar-‐13
Apr-‐13
May-‐13
Jun-‐13
Jul-‐13
Aug-‐13
Sep-‐13
Oct-‐13
Nov-‐13
Dec-‐13
Jan-‐14
Feb-‐14
ADR grow
th y-‐o-‐y
ADR in local currency
-‐10% -‐8% -‐6% -‐4% -‐2% 0% 2%
0 50
100 150 200 250 300
Mar-‐13
Apr-‐13
May-‐13
Jun-‐13
Jul-‐13
Aug-‐13
Sep-‐13
Oct-‐13
Nov-‐13
Dec-‐13
Jan-‐14
Feb-‐14
ADR grow
th y-‐oy
ADR in local currency
-‐15% -‐10% -‐5% 0% 5% 10%
1200
1250
1300
1350
Mar-‐13
Apr-‐1
3
May-‐13
Jun-‐13
Jul-‐13
Aug-‐1
3
Sep-‐1
3
Oct-‐1
3
Nov-‐1
3
Dec-‐1
3
Jan-‐14
Feb-‐1
4
ADR grow
th y-‐o-‐y
ADR in local currency
-‐10%
-‐5%
0%
5%
10%
7500
8000
8500
9000
9500
Mar-‐13
Apr-‐13
May-‐13
Jun-‐13
Jul-‐13
Aug-‐13
Sep-‐13
Oct-‐13
Nov-‐13
Dec-‐13
Jan-‐14
Feb-‐14
ADR grow
th y-‐o-‐y
ADR in local currency

57 2015 Industry Forecast © 2014 by Advito. All rights reserved. Table of contents
Singapore
United Arab Emirates
South Africa
United Kingdom
Fig 2d – Historical Average Daily Rate (ADR) development in 2013/2014 (key countries)
Source: Advito
ADR growth ADR
Historical ADR developmentAppendix
-‐15% -‐10% -‐5% 0% 5% 10% 15%
250 260 270 280 290 300 310 320 330 340 350
Mar-‐13
Apr-‐13
May-‐13
Jun-‐13
Jul-‐13
Aug-‐13
Sep-‐13
Oct-‐13
Nov-‐13
Dec-‐13
Jan-‐14
Feb-‐14
ADR grow
th y-‐o-‐y
ADR in local currency
-‐5%
0%
5%
10%
1050
1100
1150
1200
1250
Mar-‐13
Apr-‐1
3
May-‐13
Jun-‐13
Jul-‐13
Aug-‐1
3
Sep-‐1
3
Oct-‐1
3
Nov-‐1
3
Dec-‐1
3
Jan-‐14
Feb-‐1
4
ADR grow
th y-‐o-‐y
ADR in local currency
-‐20%
-‐10%
0%
10%
20%
0 200 400 600 800
1000 1200
Mar-‐13
Apr-‐13
May-‐13
Jun-‐13
Jul-‐13
Aug-‐13
Sep-‐13
Oct-‐13
Nov-‐13
Dec-‐13
Jan-‐14
Feb-‐14
ADR grow
th y-‐o-‐y
ADR in local currency
-‐20%
-‐10%
0%
10%
20%
0 200 400 600 800
1000 1200
Mar-‐13
Apr-‐13
May-‐13
Jun-‐13
Jul-‐13
Aug-‐13
Sep-‐13
Oct-‐13
Nov-‐13
Dec-‐13
Jan-‐14
Feb-‐14
ADR grow
th y-‐o-‐y
ADR in local currency

58 2015 Industry Forecast © 2014 by Advito. All rights reserved. Table of contents
United States
Fig 2e – Historical Average Daily Rate (ADR) development in 2013/2014 (key countries)
ADR growth ADR
Source: Advito
Historical ADR developmentAppendix
-‐1% 0% 1% 1% 2% 2% 3% 3%
120 125 130 135 140 145 150
Mar-‐13
Apr-‐1
3
May-‐13
Jun-‐13
Jul-‐13
Aug-‐1
3
Sep-‐1
3
Oct-‐1
3
Nov-‐1
3
Dec-‐1
3
Jan-‐14
Feb-‐1
4
ADR grow
th y-‐o-‐y
ADR in local currency

59 2015 Industry Forecast © 2014 by Advito. All rights reserved. Table of contents
Fig 3a – Historical Average Daily Rate (ADR) development in 2013/2014: US Cities Source: Advito
Historical ADR developmentAppendix
Top U.S . ci*es 2013 2014
ADR US$ Q1 Q2 Q3 Q4 Q1
Atlanta ADR YoY
125 3.5%
125 1.8%
125 2.5%
126 1.2%
130 3.6%
Boston ADR YoY
160 3.8
191 1.1%
189 2.4%
187 3.5%
168 4.5%
Charlo@e ADR YoY
133 10.7%
135 8.9%
132 5.3%
137 8.1%
141 6.3%
Chicago ADR YoY
139 4.2%
169 6.9%
164 3.8%
162 0.8%
137 -‐1.7%
Dallas ADR YoY
128 4.2%
126 1.7%
125 0.9%
128 3.0%
130 1.8%
Denver ADR YoY
136 4.5%
142 2.5%
143 1.2%
135 -‐0.5%
136 -‐0.2%
Houston ADR YoY
141 5.2%
148 8.6%
141 6.7%
147 8.4%
150 6.3%
Indianapolis ADR YoY
109 -‐0.4%
114 3.8%
116 4.7%
114 4.7%
118 8.2%
Las Vegas ADR YoY
167 -‐2.0%
150 -‐1.8%
132 9.1%
144 7.4%
177 6.1%
Los Angeles ADR YoY
186 3.0%
187 -‐0.1%
180 -‐1.1%
178 -‐0.2%
190 2.5%
Top U.S . ci*es 2013 2014
ADR US$ Q1 Q2 Q3 Q4 Q1
New Orleans ADR YoY
161 5.0%
149 1.7%
133 4.2%
160 11.2%
159 -‐1.3%
New York ADR YoY
258 9.0%
326 6.5%
314 7.2%
343 4.5%
256 -‐0.8%
Philadelphia ADR YoY
147 0.3%
158 0.1%
148 -‐1.1%
149 -‐0.8%
146 -‐0.5%
Phoenix ADR YoY
152 2.2%
122 7.1%
104 0.9%
131 2.5%
159 4.5%
Portland ADR YoY
123 6.5%
134 7.4%
139 5.1%
129 2.5%
130 5.0%
St. Louis ADR YoY
115 2.0%
121 1.6%
119 1.7%
117 1.6%
117 1.9%
San Diego ADR YoY
150 -‐1.5%
153 -‐0.7%
165 -‐0.4%
152 2.9%
161 6.8%
San Francisco ADR YoY
224 3.0%
231 6.2%
256 3.9%
256 13.1%
256 14.4%
SeaNle ADR YoY
148 -‐0.1%
156 8.7%
161 -‐1.4%
145 -‐5.0%
146 -‐1.0%
Washington ADR YoY
192 0.0%
213 0.0%
186 -‐2.1%
192 -‐3.1%
186 3.3%

60 2015 Industry Forecast © 2014 by Advito. All rights reserved. Table of contents
Fig 3b – Historical Average Daily Rate (ADR) development in 2013/2014: European Cities
Historical ADR developmentAppendix
Source: Advito
Top European ci-es 2013 2014
ADR local currency Q1 Q2 Q3 Q4 Q1
Amsterdam ADR YoY
132 -‐5.0%
140 -‐1.5%
141 6.7%
131 -‐1.0%
128 -‐3.1%
Barcelona ADR YoY
121 4.7%
135 -‐2.1%
127 8.4%
125 -‐1.2%
126 4.2%
Berlin ADR YoY
104 -‐2.2%
108 -‐0.9%
104 -‐13.6%
102 1.1%
102 -‐1.8%
Brussels ADR YoY
145 -‐0.9%
157 -‐0.8%
141 -‐13.7%
149 -‐0.9%
142 -‐2.4%
Copenhagen ADR YoY
1101 -‐4.7%
1257 -‐0.3%
1214 5.7%
1171 5.1%
1125 2.1%
Dublin ADR YoY
121 1.2%
128 1.7%
123 -‐0.6%
118 4.6%
112 -‐7.5%
Düsseldorf ADR YoY
103 -‐3.5%
98 -‐13.3%
99 -‐3.8%
119 11.8%
105 1.4%
Frankfurt ADR YoY
129 2.5%
127 -‐5.2%
122 -‐10.2%
131 6.9%
128 -‐0.9%
Hamburg ADR YoY
110 -‐5.5%
111 -‐2.6%
123 -‐6.7%
108 0.4%
103 -‐5.8%
London ADR YoY
167 8.4%
175 7.5%
173 4.7%
173 3.5%
162 -‐2.8%
Top European ci-es 2013 2014
ADR local currency Q1 Q2 Q3 Q4 Q1
Madrid ADR YoY
110 1.5%
117 -‐1.7%
117 2.2%
118 -‐8.0%
113 3.0%
Milan ADR YoY
162 7.1%
163 12.1%
161 3.0%
147 12.8%
151 -‐6.9%
Moscow ADR YoY
9152 -‐1.4%
9140 -‐2.1%
8445 -‐.3.9%
8885 -‐3.4%
8517 -‐6.9%
Munich ADR YoY
126 10.0%
142 1.7%
135 -‐18.3%
126 -‐3.8%
116 -‐7.6%
Paris ADR YoY
185 -‐0.5%
210 1.7%
192 -‐9.2%
190 -‐2.6%
182 -‐1.4%
Prague ADR YoY
2605 -‐1.9%
2764 -‐2.2%
2735 -‐2.4%
2910 2.7%
2643 1.4%
Rome ADR YoY
153 20.4%
153 22.2%
156 17.3%
149 19.5%
143 -‐6.8%
Stockholm ADR YoY
1558 -‐3.4%
1653 -‐3.7%
1569 -‐7.7%
1601 -‐2.3%
1446 -‐7.2%
Vienna ADR YoY
122 -‐3.7%
130 1.5%
124 -‐13.2%
134 -‐2.7%
123 0.4%
Warsaw ADR YoY
431 -‐12.9%
509 -‐17.5%
482 -‐8.2%
514 12.3%
427 -‐0.9%

61 2015 Industry Forecast © 2014 by Advito. All rights reserved. Table of contents
Fig 3c – Historical Average Daily Rate (ADR) development in 2013/2014: Asia, Canada and Latin America
Historical ADR developmentAppendix
Source: Advito
Top Asian ci+es 2013 2014
ADR local currency Q1 Q2 Q3 Q4 Q1
Bangkok ADR YoY
4701 7.3%
4656 -‐0.3%
4586 1.6%
5128 5.0%
4552 -‐3.2%
Beijing ADR YoY
1024 -‐4.8%
1038 -‐9.9%
991 -‐8.6%
992 -‐4.0%
934 -‐8.8%
Delhi ADR YoY
9692 -‐11.0%
8350 -‐5.1%
8815 6.4%
10018 -‐14.0%
9966 2.8%
Hong Kong ADR YoY
2368 1.6%
2195 -‐1.8%
2196 -‐2.3%
2324 -‐1.3%
2313 -‐2.3%
Mumbai ADR YoY
7708 -‐3.1%
6522 -‐5.5%
5194 -‐3.2%
7703 -‐3.2%
7683 -‐0.3%
Seoul ADR YoY
538376 -‐1.2%
227727 -‐7.7%
296067 -‐5.4%
234189 -‐2.3%
328852 -‐38.9%
Shanghai ADR YoY
1017 -‐6.7%
1048 -‐7.8%
988 -‐9.8%
1034 -‐6.2%
1000 -‐1.6%
Singapore ADR YoY
308 -‐5.0%
296 -‐5.1%
307 -‐3.6%
296 -‐1.3%
313 1.4%
Sydney ADR YoY
267 3.6%
252 4.7%
255 9.1%
271 4.2%
262 -‐1.8%
Tokyo ADR YoY
20637 5.9%
23900 6.1%
19934 4.6%
21414 1.8%
21541 4.4%
Canada & LatAm 2013 2014
ADR local currency Q1 Q2 Q3 Q4 Q1
Buenos Aires ADR YoY
842 2.3%
829 13.6%
887 16.0%
966 27.4%
1171 39.1%
Mexico City ADR YoY
1925 2.8%
1870 -‐5.2%
1846 -‐3.4%
1927 4.5%
1976 2.6%
Montreal ADR YoY
147 -‐0.4%
157 0.8%
158 1.6%
158 3.2%
153 3.6%
Rio de Janeiro ADR YoY
434 12.7%
445 4.8%
438 12.1%
435 10.2%
431 -‐0.7%
SanGago ADR YoY
88075 -‐7.8%
76916 -‐10.6%
87844 7.8%
93125 0.5%
96764 9.9%
São Paulo ADR YoY
381 10.2%
373 -‐3.1%
363 6.6%
389 0.3%
393 3.3%
Toronto ADR YoY
151 2.2%
154 0.2%
158 -‐5.9%
157 1.7%
156 3.1%
Vancouver ADR YoY
151 0.0%
169 -‐0.7%
178 3.1%
155 -‐1.0%
158 4.8%

62 2015 Industry Forecast © 2014 by Advito. All rights reserved. Table of contents
AssumptionsWe have assumed (as working hypotheses rather than predictions) that:• The price of oil per barrel (Brent crude) will be essentially
stable, remaining within the range of US$107 and US$112 in 2015.
• World economic growth will expand by about 2.6% in 2014. Growth will pick up pace in 2015, rising to 3.1% year-over-year (YoY).
Approach to analysisOur ongoing research, including in-depth interviews with international experts in corporate travel and meetings management, forms the basis for our discussion of broader industry developments and trends.
We base our category-specific predictions on our analysis of aggregated transaction data for BCD Travel’s corporate clients worldwide.
We base our analysis and forecast on dynamic baskets using the actual number of room nights, car rental bookings and air segments for the period in question to reflect potential shifts in travel pattern and booking behavior. The level of aggregation is determined by the validity of the relevant pool of data, with a minimum threshold set for year-to-date and historical number of transactions for each measure.
We weight monthly averages by category transactions for each unit—the exception is the area/region average for hotel, which is a simple average calculated across all countries in that area/ region. Quarterly averages are also weighted averages of the months in the quarter. Unless stated differently, we base price developments on local currencies; these developments are therefore subject to foreign exchange fluctuations. We normalize local currency transaction data into leading world currencies. To do this, we use the daily average conversion rate on the date of travel (for air and rental car) or planned checkout date (for hotel).
Hotel market tier assignments follow our proprietary classification scheme. Air cabin classes are based on our master table of airline booking classes.
SourcesIn addition to the BCD Travel client data, we use the following sources:• International Air Transport Association (IATA) for airline capacity
and traffic• Oxford Economics for macroeconomic historic and forecast data• International Monetary Fund (IMF) for macroeconomic
predictions and oil price• Economist Intelligence Unit (EIU) for macroeconomic
predictions and oil price• Eurostat for historic macroeconomic indicators and predictions • OANDA for foreign currency exchange rates• Official Airline Guide (OAG) for airline capacity• U.S. Energy Information Administration (EIA) historic and
forecasted oil prices• Flightglobal.com for airline industry news and analysis• Smith Travel Research (STR) for hotel occupancy level
The estimates and predictions are based on data available through May 2014 for air and hotel transactional data and through August 2014 for macroeconomic and industry indicators.
Methodology

63 2015 Industry Forecast © 2014 by Advito. All rights reserved. Table of contents
For more information please contact
500 West Madison StreetSuite 1200Chicago, Illinois 60661
About AdvitoAdvito is the travel industry’s most progressive consultancy, enabling procurement leaders to modernize their approach to managing the travel and meetings spend category. Led by a unique team of multi-disciplinary experts and thought leaders, we work with both clients and suppliers to push the boundaries of traditional air and hotel sourcing and strategic meetings management for higher program returns. We provide advisory, procurement and outsourcing services in the area of corporate travel sourcing, expense and meetings management, along with RFP development and management; benchmarking and vendor management services. We minimize our clients’ travel spend and maximize their travel program value in a data-rich, consumer empowered world. Headquartered in Chicago, Advito operates in key business markets around the world. For more information, visit www.advito.com.
About BCD GroupBCD Group is a market leader in the travel industry. The privately owned company was founded in 1975 by John Fentener van Vlissingen and consists of BCD Travel (global corporate travel management), Travix (online travel: CheapTickets, Vliegwinkel, BudgetAir, Flugladen and Vayama), Park ‘N Fly (off-airport parking) and joint ventures Parkmobile International (mobile parking applications) and AERTrade International (consolidating and fulfillment). BCD Group employs over 12,000 people and operates in almost 100 countries with total sales, including US$ 9.2 billion partner sales, of US$ 24 billion. For more information, visit www.www.bcdgroup.com.
Further information