ADVISORY COMMITTEES ON REGIONAL LAND USE ... of the Third Joint Meeting of the ADVISORY COMMITTEES...
31
Minutes of the Third Joint Meeting of the ADVISORY COMMITTEES ON REGIONAL LAND USE PLANNING AND REGIONAL TRANSPORTATION SYSTEM PLANNING DATE: January 15, 2014 TIME: 9:30 a.m. PLACE: Tommy G. Thompson Youth Center, Meeting Room 5 Wisconsin State Fair Park 640 S. 84 th Street Milwaukee, Wisconsin Members Present Committee on Regional Land Use Planning Julie Anderson .................................. Director of Public Works and Development Services, Racine County Chair Robert J. Bauman ............................................................................................ Alderman, City of Milwaukee Andy M. Buehler ............................................................ Director of Planning Operations, Kenosha County Harlan E. Clinkenbeard ................................................................................. City Planner, City of Pewaukee Michael P. Cotter ................................................................................................ Director, Walworth County Land Use and Resource Management Department Brent DesRoches (alternate for Sheri Schmit) ....................................... Planning and Forecasting Engineer, Wisconsin Department of Transportation Daniel F. Ertl ........................................................ Director of Community Development, City of Brookfield Vanessa Koster.................................................................................................................. Planning Manager, City of Milwaukee Department of City Development Jeffrey B. Labahn ............................. Director, Community Development and Inspections, City of Kenosha Mark Piotrowicz.........................................................City Planner/Operations Manager, City of West Bend Sandy Scherer (alternate for Jason Fruth) ...............................................................................Senior Planner, Waukesha County Department of Parks and Land Use Karen Schmiechen (alternate for Sheri Schmit) ............................................... Program and Policy Analyst, Wisconsin Department of Transportation Douglas Seymour ................................................. Director of Community Development, City of Oak Creek Todd Stuebe ............................................................Director of Community Development, City of Glendale Randy Tetzlaff ......................................... Director of Planning and Development, City of Port Washington Mike Thompson (alternate for Eric Nitschke) ................. NR Region Program Manager, Southeast Region, Wisconsin Department of Natural Resources Committee on Regional Transportation System Planning Fred Abadi .............................................................................. Director of Public Works, City of Waukesha John Bennett.................................................................................................. City Engineer, City of Franklin Scott Brandmeier .............................. Director of Public Works and Village Engineer, Village of Fox Point David E. Cox............................................................................... Village Administrator, Village of Hartland Brent DesRoches (alternate for Sheri Schmit) ....................................... Planning and Forecasting Engineer, Wisconsin Department of Transportation
Transcript of ADVISORY COMMITTEES ON REGIONAL LAND USE ... of the Third Joint Meeting of the ADVISORY COMMITTEES...

Minutes of the Third Joint Meeting of the
ADVISORY COMMITTEES ON REGIONAL LAND USE PLANNING
AND REGIONAL TRANSPORTATION SYSTEM PLANNING DATE: January 15, 2014 TIME: 9:30 a.m. PLACE: Tommy G. Thompson Youth Center, Meeting Room 5 Wisconsin State Fair Park 640 S. 84th Street Milwaukee, Wisconsin Members Present Committee on Regional Land Use Planning Julie Anderson .................................. Director of Public Works and Development Services, Racine County
Chair Robert J. Bauman ............................................................................................ Alderman, City of Milwaukee Andy M. Buehler ............................................................ Director of Planning Operations, Kenosha County Harlan E. Clinkenbeard ................................................................................. City Planner, City of Pewaukee Michael P. Cotter ................................................................................................ Director, Walworth County
Land Use and Resource Management Department Brent DesRoches (alternate for Sheri Schmit) ....................................... Planning and Forecasting Engineer,
Wisconsin Department of Transportation Daniel F. Ertl ........................................................ Director of Community Development, City of Brookfield Vanessa Koster .................................................................................................................. Planning Manager,
City of Milwaukee Department of City Development Jeffrey B. Labahn ............................. Director, Community Development and Inspections, City of Kenosha Mark Piotrowicz ......................................................... City Planner/Operations Manager, City of West Bend Sandy Scherer (alternate for Jason Fruth) ............................................................................... Senior Planner,
Waukesha County Department of Parks and Land Use Karen Schmiechen (alternate for Sheri Schmit) ............................................... Program and Policy Analyst,
Wisconsin Department of Transportation Douglas Seymour ................................................. Director of Community Development, City of Oak Creek Todd Stuebe ............................................................ Director of Community Development, City of Glendale Randy Tetzlaff ......................................... Director of Planning and Development, City of Port Washington Mike Thompson (alternate for Eric Nitschke) ................. NR Region Program Manager, Southeast Region,
Wisconsin Department of Natural Resources Committee on Regional Transportation System Planning Fred Abadi .............................................................................. Director of Public Works, City of Waukesha John Bennett.................................................................................................. City Engineer, City of Franklin Scott Brandmeier .............................. Director of Public Works and Village Engineer, Village of Fox Point David E. Cox ............................................................................... Village Administrator, Village of Hartland Brent DesRoches (alternate for Sheri Schmit) ....................................... Planning and Forecasting Engineer,
Wisconsin Department of Transportation

-2-
Gary Evans .................................................................................... Highway Engineering Division Manager, Waukesha County Department of Public Works
Michael Friedlander (alternate for Bart Sponseller) .......................................... Bureau of Air Management, Wisconsin Department of Natural Resources
Michael Giugno ...................................................... Managing Director, Milwaukee County Transit System Tom Grisa ........................................................... Director, Department of Public Works, City of Brookfield Nik Kovac ....................................................................................................... Alderman, City of Milwaukee Alexis Kuklenski ..................................................... Community Planner, Federal Highway Administration,
U.S. Department of Transportation Michael M. Lemens ...................................... Director of Public Works and City Engineer, City of Kenosha Michael Loughran (alternate for Ghassan A. Korban) ................................... Department of Public Works,
City of Milwaukee John Nordbo (alternate for Sandra Beaupré) ................................. Wisconsin Department of Transportation Jeffrey S. Polenske .................................................................................... City Engineer, City of Milwaukee William D. Sasse ................................................................ Director of Engineering, Village of Mt. Pleasant Jay Saunders (alternate for Michael Mayo Sr.) ................. Public Information Assistant, Milwaukee County Karen Schmiechen (alternate for Sheri Schmit) ............................................... Program and Policy Analyst,
Wisconsin Department of Transportation Leslie Silletti (alternate for Jennifer Gonda) .......................................... Mayor’s Office, City of Milwaukee Mike Thompson (alternate for Eric Nitschke) ................. NR Region Program Manager, Southeast Region,
Wisconsin Department of Natural Resources Dennis Yaccarino .......................... Senior Budget and Policy Manager, Budget and Management Division,
Department of Administration, City of Milwaukee Guests and Staff Present Stephen P. Adams ................................................... Public Involvement and Outreach Manager, SEWRPC Ann Dee Allen ............................................. Senior Public Involvement and Outreach Specialist, SEWRPC Eric D. Lynde ............................................................. Principal Transportation Planner/Engineer, SEWRPC Benjamin R. McKay .......................................................................................... Principal Planner, SEWRPC Kevin J. Muhs ............................................................................... Senior Transportation Planner, SEWRPC Susan Morrison ................................................................. Bureau of Planning and Economic Development,
Wisconsin Department of Transportation David A. Schilling ............................................................................................. Principal Planner, SEWRPC Kerry Thomas ............................................................................................ Executive Director, TransitNOW Kenneth R. Yunker ......................................................................................... Executive Director, SEWRPC CALL TO ORDER
Ms. Anderson called the joint meeting of the Advisory Committees on Regional Land Use Planning and Regional Transportation System Planning to order at 9:30 a.m., welcoming those in attendance. Ms. Anderson stated roll call would be accomplished through circulation of a sign-in sheet. REVIEW AND APPROVAL OF MINUTES OF THE MEETING HELD ON NOVEMBER 18, 2013 Ms. Anderson asked if there were any questions or comments on the November 18, 2013, meeting minutes. There were none. She then asked for a motion to approve the meeting minutes. On a motion by

-3-
Mr. Labahn, seconded by Mr. Clinkenbeard, the November 18, 2013, meeting minutes were unanimously approved. UPDATE ON VISION 2050 EFFORTS Ms. Anderson noted there are three sub-items under this agenda item, including discussion of results of visioning activities to date, the draft VISION 2050 Guiding Statements, and development of sketch land use and transportation scenarios. Results of Visioning Activities to Date Ms. Anderson asked Mr. Muhs of the Commission staff to provide an overview of the results of visioning activities to date. Mr. Muhs noted initial visioning activities had been completed since the last report to the Committees on November 18, 2013. He stated the additional results were similar to the results previously reported to the Committees. Mr. Muhs also noted the second series of visioning workshops are underway where attendees are given an overview of the results of the initial visioning activities and provided the opportunity to rate the draft series of VISION 2050 Guiding Statements. These workshops also include visioning stations where attendees can provide input on how to translate the Guiding Statements into sketch land use and transportation development scenarios. He noted the second series of workshops include seven public workshops and eight workshops hosted by community organizations. All of the public workshops and five of the eight workshops hosted by organizations have been held. Mr. Muhs stated staff will compile the results of the second series of workshops once they are complete and post the results on the VISION 2050 website. He noted the results of the initial visioning activities are also on the VISION 2050 website (http://vision2050sewis.org/Vision2050/TheResults). Draft VISION 2050 Guiding Statements Ms. Anderson asked Mr. Muhs to review the draft VISION 2050 Guiding Statements (see Attachment 1). Mr. Muhs stated the input obtained during the initial visioning activities resulted in the draft series of Guiding Statements, intended to facilitate development of sketch land use and transportation development scenarios. The sketch scenarios will, in turn, form the basis of detailed alternative land use and transportation plans. He noted a first draft of the Guiding Statements was e-mailed to members of the Committees prior to the meeting for comment, staff having adjusted the draft Guiding Statements based on these comments. He stated the Guiding Statements will be further revised based on input from the second series of visioning workshops and any additional comments from members of the Committees. A revised set of Guiding Statements will be reviewed at an upcoming joint meeting of the Committees. Development of Sketch Land Use and Transportation Scenarios Ms. Anderson asked Mr. Muhs to provide an overview of possible sketch land use and transportation scenarios. Mr. Muhs noted an outline of possible land use and transportation scenarios was distributed to members attending the meeting (see Attachment 2). He stated the scenarios are meant to be conceptual alternatives of how the Region might look and function in the future, representing a range of possible futures for land use and transportation development that could achieve the Region’s initial vision as generally identified by the Guiding Statements. He stated the third series of visioning workshops will focus on scenario planning. Members of the public could choose from the options shown in the outline or Commission staff could create pre-existing options and present them to the public at the workshops for comment. Mr. Yunker stated both the guiding statements and scenario outline will be revisited for approval by the Committees at a future meeting. He stated the Committees will be given the opportunity to review and comment on each individual guiding statement and the individual components of the scenario outline. Mr. Polenske asked if the data presented in Chapter II of the plan report will be used to

-4-
evaluate the scenarios. Mr. Yunker responded the data presented in Chapter II is inventory data and staff is developing indicators that will represent possible outcomes of various scenarios. He noted the scenarios are intended to be more broad and conceptual than the alternative plans and the evaluation of scenarios will not be as in-depth as the evaluation of alternative plans. REVIEW AND CONSIDERATION OF PRELIMINARY DRAFTS OF THE FOLLOWING CHAPTERS OF SEWRPC PLANNING REPORT NO. 55, “VISION 2050: A REGIONAL LAND USE AND TRANSPORTATION SYSTEM PLAN FOR SOUTHEASTERN WISCONSIN”
Volume I, Chapter II, “Existing Conditions and Trends: Population, Employment, and Land Use”
Volume I, Chapter III, “Review of Currently Adopted Regional Land Use and Transportation System Plans”
Ms. Anderson noted there are two sub-items under this agenda item, including a review of Volume I, Chapter II of the plan report and Volume I, Chapter III of the plan report. Volume I, Chapter II, “Existing Conditions and Trends: Population, Employment, and Land Use” Ms. Anderson asked Mr. Schilling of the Commission staff to review the preliminary draft of Volume I, Chapter II, “Existing Conditions and Trends: Population, Employment, and Land Use,” of the regional land use and transportation plan (the chapter is available on the SEWRPC website: http://www.sewrpc.org/SEWRPC/VISION_2050/2050RegLandUseTranspPlan.htm). The following comments and discussion points were made during the review:
1. Mr. Bauman asked if race/ethnicity data are available by County. Mr. Yunker responded that this data would be included in the Chapter.
2. Mr. Yaccarino asked if data on wage trends are available. Mr. Yunker responded that this data is available in SEWRPC Technical Report No. 10, The Economy of Southeastern Wisconsin, and it can be included in the Chapter. Mr. Yaccarino asked if the Technical Report includes property value data. Mr. Yunker responded that it does not. Mr. Polenske suggested presenting the wage data by County. Mr. Bauman suggested including data for the City of Milwaukee because of the disparity between the City and the rest of Milwaukee County and the Region. He noted data on the availability of personal vehicles as an example. Mr. Yunker stated the data requested on race/ethnicity and income will be presented by county and the City of Milwaukee. He noted data on personal vehicle availability will be presented in Volume I, Chapter IV, “Inventory of Travel Facilities and Services,” of the plan report.
Ms. Anderson asked if there were any further comments on the chapter. Hearing no further comments, Ms. Anderson asked for a motion to approve as revised the preliminary draft of Volume I, Chapter II, “Existing Conditions and Trends: Population, Employment, and Land Use.” Mr. Clinkenbeard moved and Mr. Cox seconded the motion to approve the chapter with the understanding that the revisions suggested by Mr. Bauman and Mr. Yaccarino will be incorporated. Mr. Bauman asked if the purpose of the chapter is to describe the physical condition of the Region and broad population levels or if it is to show the human condition of the Region, noting the Milwaukee area’s status as one of the most segregated large metropolitan areas in the Country. Mr. Yunker responded the chapter is intended to provide a high level snapshot of the Region, and the data requested will be added and presented for each County and the City of Milwaukee. Ms. Koster suggested waiting for the vote on approval of the chapter until a revised draft can be reviewed. Mr. Yunker stated the planning process is running on a tight

-5-
schedule; however, waiting for approval of this chapter will not delay the start of other work. Mr. Thompson noted WDNR staff would provide some suggested edits regarding the air quality section following the meeting. Mr. Yunker indicated that Commission staff would incorporate these suggested edits. Mr. Grisa noted additions to the chapters during past regional planning efforts have typically been handled through review and approval of the meeting minutes. Mr. Polenske noted these additions change the scope of the chapter, and it may be helpful to see them in the context of a revised draft of the chapter. Mr. Yunker stated staff appreciates the current motion and noted that the suggestions are for additions to the draft chapter and not for revisions to the existing text. He stated a full revised draft could be considered for approval at a future meeting if the current motion and second are withdrawn. Mr. Clinkenbeard withdrew the motion and Mr. Cox withdrew the second. Mr. Polenske moved and Mr. Bauman seconded to layover consideration of the chapter to a future meeting to address the additions as discussed. The motion was approved unanimously.
[Secretary’s Note: Following the meeting, Commission staff revised Chapter II as follows:
Added information on the total population and households in the four largest cities in the Region and the remainder of those cities’ respective counties.
Added information on the minority and non-minority population and personal income levels in each of the seven counties, the four largest cities in the Region, and the remainder of those cities’ respective counties.
Added information on the job/housing analysis conducted as part of the recently adopted regional housing plan.
Incorporated suggested edits to the air quality section received by WDNR staff following the meeting.]
Volume I, Chapter III, “Review of Currently Adopted Regional Land Use and Transportation System Plans” Ms. Anderson asked Mr. Lynde of the Commission staff to review the preliminary draft of Volume I, Chapter III, “Review of Currently Adopted Regional Land Use and Transportation System Plans,” of the regional land use and transportation plan (the chapter is available on the SEWRPC website: http://www.sewrpc.org/SEWRPC/VISION_2050/2050RegLandUseTranspPlan.htm). The following comments and discussion points were made during the review:
1. Mr. Kovac referred to Map III-2, and noted it shows growth between 2000 and 2010 that is both consistent and inconsistent with plan recommendations. He then noted that regional plan recommendations are advisory. Mr. Piotrowicz noted the need for town and county comprehensive plans to be consistent and asked if the county comprehensive plan has to be consistent with the regional transportation system plan. Mr. Yunker responded county comprehensive plans are not required to be consistent with the regional transportation plan. He noted the State comprehensive planning law does have language referencing consistency between county comprehensive plan transportation elements and the regional transportation plan, but it has not necessarily been followed. Mr. Clinkenbeard stated a regional level government would be needed to enforce consistency between comprehensive plans and regional plans. He stated that one purpose of the regional plans is to present basic planning data needed to develop local and county plans. He stated the regional land use plan is critical to the development of the regional

-6-
transportation plan, which is required by the Federal government. The land use plan, he noted, is advisory and must be realistic and take into account political feasibility. Mr. Yunker stated local and county governments must complete nine planning elements that are required by the State comprehensive planning law. He noted the Commission drafted a letter to the State Legislature urging the inclusion of a regional planning commission review requirement; however, no such requirement was included in the law.
2. Mr. Clinkenbeard referred to Map III-4, “Status of Major Parks Recommended Under the 2035 Regional Land Use Plan,” and asked why Ryan Park in Waukesha County is not shown. Mr. Yunker responded the status of Ryan Park will be addressed in the meeting minutes.
[Secretary’s Note: Major parks have an area of at least 250 acres and provide opportunities for a variety of resource-oriented outdoor recreational activities. Ryan Park is 204 acres in size and does not provide opportunities for a variety of activities. The development of Ryan Park will be monitored and its status will be updated at such time that it meets the major park criteria.]
3. Mr. Saunders referred to Map III-3 and noted the 76th/Brown Deer Road major economic activity
center (formerly known as Northridge) is shown as having dropped below the threshold employment level in 2010. He noted other uses for this area are under consideration and it may warrant a longer term analysis. Mr. Yunker noted this particular analysis considers employment status as of 2010. He stated the City of Milwaukee comprehensive plan will be consulted to determine whether the area should be identified as a planned major economic activity center in the 2050 regional plan.
4. Ms. Koster noted the Milwaukee River Corridor is in the Milwaukee River Greenway Overlay Zone in the City of Milwaukee, which differs from a traditional conservancy zoning district. Mr. Yunker responded the overlay will be addressed in the chapter text.
[Secretary’s Note: The following footnote has been added to the last full sentence on page
III-13 after the term “local conservancy zoning”:
“The portion of the Milwaukee River encompassed by primary environmental corridor in the City of Milwaukee between North Avenue and Hampton Avenue is covered by the Milwaukee River Greenway Overlay Zone. This overlay zone allows protection of the primary environmental corridor and sustainable development that is compatible with the City’s comprehensive plan.”]
5. Mr. Sasse referred to Map III-5, “Protection of Primary Environmental Corridors in the Region,” and noted the Pike River Corridor in Racine County is not shown.
[Secretary’s Note: The portion of the Pike River Corridor located in Racine County is
classified as Secondary Environmental Corridor.]
6. Mr. Bauman asked if it was necessary that a highway project be identified in the recommended regional transportation plan in order to receive Federal funding. Mr. Yunker indicated that the Commission prepares a transportation improvement program (TIP) which lists all transit and
-7-
arterial highway projects proposed to use Federal funding over a four-year period, and that projects in the TIP need to be consistent with the regional transportation plan.
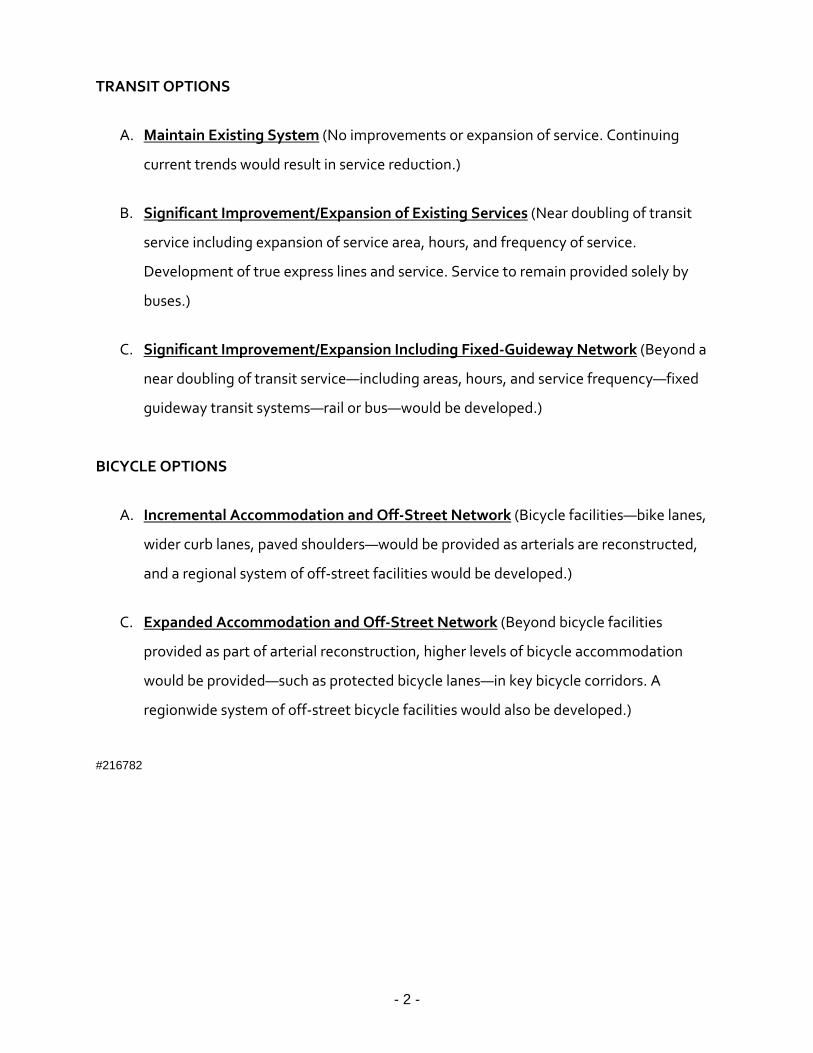
7. Mr. Yunker referred to Map III-8, “Public Transit Element of the Regional Transportation System Plan: Year 2035,” and noted the recommended plan identifies high-speed rail and the Milwaukee Streetcar under fixed guideway routes. He then noted Map III-9, “Potential Rapid Transit Commuter Rail and Express Transit Bus Guideway/Light Rail Lines Under the Recommended Year 2035 Regional Transportation Plan,” shows potential corridors for upgrading rapid and express transit service from bus lines to fixed guideway facilities. Mr. Ertl asked about the status of high-speed rail in the regional plan. Mr. Yunker responded discussion will be added regarding its implementation status.
[Secretary’s Note: The following text has been added under a new subsection titled “High-Speed Rail Service” before the subsection titled “Rapid Transit Service” on page III-23:
“The planned high-speed rail line between Chicago, Milwaukee, and Madison will be developed and overseen by WisDOT, which received Federal funding for the project in January 2010. The planned high-speed rail line is intended to be part of an initial phase in the development of a Midwest high-speed rail network, developed in partnership with other Midwest states and Amtrak. Implementation of the planned Chicago-Milwaukee-Madison high-speed rail service will include improvements to Amtrak’s existing Hiawatha Service operating between Chicago and Milwaukee and infrastructure improvements to allow service to continue to Madison, with trains reaching maximum speeds of 110 miles per hour between Milwaukee and Madison.” In addition, the following text has been added as a new paragraph following the first paragraph on page III-42: “Implementation of WisDOT’s planned Chicago-Milwaukee-Madison high-speed rail line was indefinitely postponed following withdrawal of the majority of the Federal funding awarded to the project by the U.S. Department of Transportation (USDOT) in December 2010. Despite its postponement, this proposed service remains a part of WisDOT’s long-range state rail plan scheduled to be completed in 201. In addition, WisDOT is continuing efforts to increase service and improve travel times of Amtrak’s existing Hiawatha Service operating between Chicago and Milwaukee.”]
8. Mr. Kovac noted several communities prepared station area plans as part of the proposed Kenosha-Racine-Milwaukee (KRM) commuter rail line, demonstrating the link between land use and transportation planning. Mr. Lynde noted the station area plans were endorsed by most of the communities. Mr. Yunker noted some communities may incorporate the station area plans into their comprehensive plans, based on their perception of the status of the KRM project. Mr. Clinkenbeard asked if the KRM project is still in the regional plan. Mr. Yunker responded it was not removed from the 2035 regional transportation system plan.

-8-
9. Mr. Yunker referred to text on page III-41 and noted the public transit element of the 2035 regional transportation plan recommends a near doubling of public transit service by the plan design year. He noted that the plan assumed local dedicated funding, a regional transit authority (RTA), and adequate State funding would be provided to achieve this recommendation. Mr. Bauman stated the State Legislature could provide adequate funding to implement the public transit element of the 2035 transportation plan, similar to State funding of highway expansions, and that an RTA may not be necessary to achieve the plan’s recommended transit service improvement and expansion. He noted the State committed to funding 10 percent of a proposed light rail line in the 1995-96 State biennial budget, and that the State had also committed to funding a certain portion of the proposed KRM project. Mr. Yunker noted local governments must provide a match to State funding from their property tax levies, and that the purpose of the text was to demonstrate that State legislation allowing for local dedicated funding and RTAs almost passed. He indicated that the minutes would include a discussion on State funding for the KRM project, and indicated that transportation funding would be considered during development of the recommended year 2050 regional land use and transportation plan.
[Secretary’s Note: The financial plan for the KRM commuter rail line—included in the New
Starts application submitted to the Federal Transit Administration in June 2010 and subsequently withdrawn in July 2011—assumed State capital assistance for the project under one or both of two State programs. The State Section 85.064 Commuter Rail Transit System Development program called for the State to pay up to half of the non-Federal share of annual project capital costs, at a maximum of 25 percent of project costs. The State Section 85.11 Southeast Wisconsin Transit Capital Assistance Program could have paid up to half of the non-Federal share of annual project capital costs or 25 percent of project costs, whichever is less, up to $50 million. The financial plan assumed State operating assistance for the project under the State Section 85.20 Mass Transit Operating Assistance Program, which has provided has provided about $100 million annually to fund local urban public transit system operations in Wisconsin.]
10. Mr. Yunker noted the text on the bottom of page III-41 and stated the amount of transit service in
the Region has declined from the time of plan adoption in 2006 to 2012. There was a decrease of 7 percent in fixed-route bus service and an increase of 17 percent in demand-responsive service, which resulted in an overall 4 percent decrease in service.
11. Mr. Stuebe noted Map III-13 does not show portions of Port Washington Road in the City of Glendale. Mr. Yunker responded Port Washington Road is likely lying under IH-43 on the map because of their close proximity. He stated staff will modify the map to make Port Washington Road visible (see Attachment 3).
12. Mr. Lynde referred to the second paragraph on page III-43 and noted Kenosha County adopted a comprehensive bike plan in 2013, which could be referenced in the chapter as a recent example of a plan intended to implement the recommendations of the 2035 regional plan’s bicycle and pedestrian element.
[Secretary’s Note: The second paragraph on page III-43 was revised as follows:

-9-
“A number of local and county plans have been completed or are in development that will help to implement the recommendations of the regional plan’s bicycle and pedestrian element. Examples include the Kenosha County Comprehensive Bike Plan completed in July 2013 and a bicycle plan for the City of Milwaukee that recommends a broad range of measures to improve conditions for bicycling in Milwaukee.”]
13. Mr. Giugno referred to the third bullet on page III-45 and noted the Milwaukee County Transit System will not be installing “next bus” information signing at bus stops, but will instead be making next bus information available using new mobile technologies.
[Secretary’s Note: The second sentence of the third bullet on page III-45 was revised as follows:
“Milwaukee County Transit System has initiated implementation of “next bus” information technology that is expected to be completed in 2014.”]
14. Mr. Bauman referred to the discussion of vehicle-miles of travel (VMT) forecasts starting on page III-47 and asked if the latest VMT estimate for the Region is from 2008. Mr. Yunker noted that data from 2011 will be available soon and will be incorporated into the chapter. Mr. Bauman noted there appears to be a nationwide trend of declining annual VMT. Mr. Yunker indicated that the year 2050 forecasts will likely include a flattening trend in VMT, and noted that a recent report had been published by WISPIRG concluding that there had been about a 21 percent decrease in VMT per capita between 2006 and 2011 in the Milwaukee urbanized area. He referred to a handout distributed by Commission staff presenting the data for 2006 and 2011 used by WISPIRG in its report (see Attachment 4). He indicated that data for the Milwaukee urbanized area are reported to the Federal Highway Administration (FHWA) by the Wisconsin Department of Transportation (WisDOT), and that between 2006 and 2011 WisDOT changed their method of estimating VMT. He pointed out that the data showed a decline in VMT in the Milwaukee urbanized area almost entirely due to a 77 percent decline in VMT on local streets, which would not appear to be reasonable.
[Secretary’s Note: Tables III-14 and III-15 were revised (see Attachment 5) and the last three sentences of the first paragraph on page III-48 were revised as follows:
“The latest regional vehicle-miles of travel estimate is for the year 2011, using WisDOT traffic counts in the Region for the years 2008 through 2012. In 2011, it is estimated that there were 40.9 million vehicle-miles of travel on the Region’s arterial street and highway system on an average weekday. Forecast year 2011 vehicle-miles of travel in the Region under the year 2035 regional transportation plan totaled 43.5 million arterial system vehicle-miles of travel on an average weekday, approximately 2.6 million vehicle-miles, or about 6.4 percent, less than the estimated Region arterial vehicle-miles of travel on an average weekday in 2011.”]

-10-
15. Mr. Bauman referred to the public transit bullet on page III-51 under the Summary and Conclusions Section for Part Three and stated the text regarding implementation of the public transit element of the year 2035 regional transportation system plan should be much stronger. He noted no new forms of public transit have been implemented and there was a 7 percent service decline in the existing fixed-route public transit system between 2006 and 2012. Mr. Bauman noted that implementation of the regional plan should result in positive outcomes, such as increased access to jobs and orderly growth. He suggested adding text that explains implementation is in the interest of the public good and there are negative consequences to not implementing the plan. Mr. Yunker responded discussion about the consequences of not implementing the 2035 regional plan will be added to the chapter and will be reflected in the meeting minutes (see Attachment 6).
16. Mr. Clinkenbeard stated county and local governments are largely responsible for implementing the regional land use plan and the regional transportation plan serves the land use plan. Mr. Yunker responded this will be included in the discussion about the consequences of not implementing the regional plan. Mr. Yunker also noted there have been some successes in implementing the regional plan that can also be included in the discussion. An example is the protection of environmental corridors, which was not embraced by communities when first proposed in the 1960s, but is now widely embraced. Mr. Piotrowicz asked if all elements of the 2035 plan would be included in the discussion. Mr. Yunker responded all elements will be included. Mr. Clinkenbeard suggested avoiding political factors. Mr. Yunker stated the discussion will only include the consequences of not implementing the 2035 regional plan, such as decreased job accessibility.
Mr. Yunker noted the chapter as presented to the Committees could be approved and the suggestions discussed today will be added to the chapter. He stated that chapter additions can be approved by the Committees through review of the meeting minutes. Ms. Anderson asked if there were any further comments on the chapter. Hearing no further comments, Ms. Anderson asked for a motion to approve as revised the preliminary draft of Volume I, Chapter III, “Review of the Currently Adopted Regional Land Use and Transportation System Plans.” Mr. Clinkenbeard moved and Mr. Stuebe seconded the motion to approve the chapter with the understanding that the suggestions will be added as discussed. The motion was approved unanimously. DISCUSSION OF SCHEDULE AND LOCATION OF FUTURE MEETINGS Mr. Yunker stated the next joint meeting of the Advisory Committees is scheduled for March 12, 2014. He noted the Tommy Thompson Youth Center is not available and staff is considering suggestions for alternative locations received from members of the Committees. Mr. Yunker also noted there may be a need to hold a separate meeting of the Advisory Committee on Regional Transportation System Planning in February. He stated staff will notify members of both Committees of the meeting date in the next few weeks. He noted members of the Advisory Committee on Regional Land Use Planning are welcome to attend. PUBLIC COMMENTS Ms. Anderson asked if there were any public comments. There were none.

-11-
ADJOURNMENT Ms. Anderson thanked everyone for attending and asked for a motion to adjourn the meeting. Mr. Clinkenbeard moved and Mr. Sasse seconded the motion to adjourn. The meeting was adjourned at 11:38 a.m. Respectfully submitted, Benjamin R. McKay Recording Secretary
* * *
PCE/DAS/BRM/EDL VISION 2050 - Joint AC Minutes - Mtg 3 - 1/15/14 (00215994).DOCX (PDF: #216795)


Attachment 1
- FRONT -
DRAFT VISION 2050 GUIDING STATEMENTS
The following 15 draft VISION 2050 Guiding Statements express a preliminary vision for land use and transportation in the Region based on the key values and priorities expressed through initial visioning activities. These statements are intended to serve as a guide for how the Region should move forward and for developing “sketch” future land use and transportation scenarios. Note: no priority is implied by the order of these draft Guiding Statements. 1. Strengthen Existing Urban Areas
The individual character of desirable neighborhoods, including natural, historic, and cultural resources, should be preserved and protected and blighted neighborhoods should be renewed. New urban development and major job centers should occur through infill development, redevelopment, and development adjacent to existing urban areas.
2. Maintain Small Town Character Small town character is part of the Region’s identity. The individual character of communities in rural areas, including natural, historic, and cultural resources, should be preserved and protected.
3. Balance Jobs and Housing Links between jobs and workers should be improved by providing affordable housing near job centers, increasing job opportunities near affordable housing, and improving public transit between job centers and affordable housing.
4. Achieve More Compact Development Compact development creates desirable neighborhoods that are walkable and have a mix of uses, such as housing, businesses, schools, and parks. Future growth should occur in areas that can be readily provided with public services and facilities, and infill and redevelopment should be encouraged.
5. Preserve Natural Resources and Open Spaces Natural resources provide many environmental and recreational benefits that cannot be replaced if they are eliminated or disturbed. Future growth and transportation investments should preserve and protect valuable natural features, including lakes, rivers, wetlands, floodplains, groundwater, woodlands, open spaces, natural areas, and fish and wildlife habitats.
6. Preserve Farmland Productive farmland is vital to the health and economy of the Region. Future growth and transportation investments should preserve and protect productive farmland.
7. Be Environmentally Responsible Sustainable land and transportation development and construction practices should be used to minimize the use of nonrenewable resources and reduce impacts on the local, regional, and global environment, such as impacts on air and water quality.

216781 v1 12/6/13 EDL
- BACK -
8. Develop an Integrated, Multimodal Transportation System
Safe, efficient, and convenient travel in the Region requires an integrated, multimodal transportation system, which provides choices among transportation modes. This system should provide a sufficient level of service for all modes to effectively serve the travel demand generated by the Region’s land development pattern.
9. Develop an Expansive, Well-connected Bicycle Network Bicycle and pedestrian travel in the Region should be encouraged as an alternative to personal vehicle travel. The network should provide on- and off-street bicycle connections that are safe, secure, and convenient.
10. Achieve a Robust, Regional Transit System The Region’s transit services should accommodate the travel needs of all residents, including travel that crosses municipal or county boundaries. Transit service should be fast, frequent, safe, and convenient in order to provide an alternative to personal vehicle travel.
11. Provide a High-quality Network of Streets and Highways The Region’s streets and highways need to be well maintained in order to continue to carry the overwhelming majority of personal and freight traffic in the Region. As roadways are reconstructed, modern design improvements should be included, with a focus on improving the efficiency and safety of the roadway and incorporating bicycle, pedestrian, and transit accommodations.
12. Ensure that Goods Move Efficiently The considerable needs of the Region’s businesses, industries, and freight companies must be a factor in the development of a balanced transportation system. Barriers to the efficient movement of goods within the Region and between the Region and other areas should be identified and addressed.
13. Prepare for Change in Travel Preferences and Technologies New and expected trends in travel behavior should be considered when developing the Region’s transportation system. Technologies that improve the ability and capacity to travel should also be considered.
14. Make Wise Infrastructure Investments The benefits of specific investments in the Region’s infrastructure must be weighed against the estimated costs of those investments. The limited funding available to the Region for infrastructure investments must be spent wisely.
15. Work Together Toward Common Goals Cooperation and collaboration at the local, county, State, and Federal levels is necessary to address the land use and transportation issues facing the Region.
Attachment 2
(OVER)
DRAFT OUTLINE OF SKETCH VISION 2050 LAND USE AND TRANSPORTATION SCENARIOS
The following provides an outline of initial possible “sketch” land use and transportation
scenarios developed by Commission staff for consideration by the Advisory Committees on
Regional Land Use Planning and Regional Transportation System Planning. These scenarios
are meant to be conceptual alternatives of how the Region might look and function in the
future, representing a range of possible futures for land use and transportation which could
achieve the Region’s initial vision, as generally identified by the Guiding Statements.
LAND USE OPTIONS
A. Baseline (Continuation of current trends.)
B. Orderly Urban Growth (Similar to adopted Year 2035 Regional Land Use Plan. New
development to occur largely as infill or redevelopment in existing urban centers, and at
the immediate outer boundary of existing urban centers. Medium and high urban
development densities will be emphasized, resulting in a reversal of trends in declining
urban density.)
C. Compact Transit-Oriented Development (New development to occur along major
transit lines and particularly at transit stations. Emphasis on high urban development
densities.)
HIGHWAY OPTIONS
A. Maintain Existing System (Improvements limited to modernization to current design
standards.)
B. Capacity Expansion (Beyond improvements to current design standards,
reconstruction of existing facilities to include additional traffic lanes and construction of
new arterial facilities to address existing and future traffic congestion.)
- 2 -
TRANSIT OPTIONS
A. Maintain Existing System (No improvements or expansion of service. Continuing
current trends would result in service reduction.)
B. Significant Improvement/Expansion of Existing Services (Near doubling of transit
service including expansion of service area, hours, and frequency of service.
Development of true express lines and service. Service to remain provided solely by
buses.)
C. Significant Improvement/Expansion Including Fixed-Guideway Network (Beyond a
near doubling of transit service—including areas, hours, and service frequency—fixed
guideway transit systems—rail or bus—would be developed.)
BICYCLE OPTIONS
A. Incremental Accommodation and Off-Street Network (Bicycle facilities—bike lanes,
wider curb lanes, paved shoulders—would be provided as arterials are reconstructed,
and a regional system of off-street facilities would be developed.)
C. Expanded Accommodation and Off-Street Network (Beyond bicycle facilities
provided as part of arterial reconstruction, higher levels of bicycle accommodation
would be provided—such as protected bicycle lanes—in key bicycle corridors. A
regionwide system of off-street bicycle facilities would also be developed.)
#216782

I:\Tran\WORK\RTSP2050\Inventory\Maps\Ch 3\Map III-13 - Revised Milw Funct Plan.mxd
Map III-13 (Revised)
FUNCTIONAL IMPROVEMENTS TO THE ARTERIAL STREET AND HIGHWAY SYSTEM IN MILWAUKEE
COUNTY: PROPOSED AMENDED YEAR 2035 REGIONAL TRANSPORTATION SYSTEM PLAN
ARTERIAL STREET OR HIGHWAY
NEW
WIDENING AND/OR OTHERIMPROVEMENT TO PROVIDESIGNIFICANT ADDITIONAL CAPACITY
RESERVE RIGHT-OF-WAY TOACCOMMODATE FUTURE IMPROVEMENT(ADDITIONAL LANES OR NEW FACILITY)
RESURFACING OR RECONSTRUCTION TO PROVIDE ESSENTIALLY THE SAME CAPACITY
FREEWAY INTERCHANGE
4 NUMBER OF LANES(2 WHERE UNNUMBERED)
NEW!
HALF NEW
M
EXISTING!
THE FOLLOWING NOTES SUPPLEMENT THE RECOMMENDATIONS PORTRAYED ON THIS MAP:1. Each proposed arterial street and highway improvement, expansion, orpreservation project would need to undergo preliminary engineering andenvironmental studies by the responsible State, county, or municipal governmentprior to implementation. The preliminary engineering and environmental studies willconsider alternatives and impacts, and final decisions as to whether and how a planand project will proceed to implementation will be made by the responsible State,county, or municipal government (State for state highways, County for countyhighways, and municipal for municipal arterial streets) at the conclusion ofpreliminary engineering.
2. The 127 miles of freeway widening proposed in the plan, and in particular the 19miles of widening in the City of Milwaukee (IH 94 between the Zoo and Marquetteinterchanges and IH 43 between the Mitchell and Silver Spring interchanges), willundergo preliminary engineering and environmental impact statement by theWisconsin Department of Transportation. During preliminary engineering,alternatives will be considered, including rebuild as-is, various options of rebuild tomodern design standards, compromises to rebuilding to modern design standards,rebuilding with additional lanes, and rebuilding with the existing number of lanes.Only at the conclusion of preliminary engineering would a determination be madeas to how the freeway would be reconstructed.
3. The plan also provides further recommendations with respect to freeway half-interchanges. The plan recommends that the Wisconsin Department ofTransportation, during the reconstruction of the freeway system:
--Convert the S. 27th Street with IH 94 interchange to a full interchange;
--Consider as an alternative (where conditions permit) combining selected half-interchanges into one full interchange. (For example, STH 100 and S. 124th Streetwith IH 43.)
--Retain all other existing half-interchanges and examine during preliminaryengineering the improvement of connection between adjacent interchanges.
4. The plan also recommends that during preliminary engineering for thereconstruction of STH 100 from W. Forest Home Avenue to IH 43, consideration begiven to alternatives without additional traffic lanes, alternatives with additionaltraffic lanes or auxiliary lanes, and alternatives with frontage roads.
!
!
!
!
!
!
!
M ! ! !
! ! L !!
! !
!
!
!
!
!
!
!
!
!!
!
!!
!
!
!
!
!
!
!
!
!!
L
!
LL
L
N
O
!
N
N
M
M
N
L!M!
!
!
!
!
!
!
L
R 21 E R 22 E
T 8 N
T 7 N
T 6 N
T 5 N
R 21 ER 23 ER 22 E
T 5 N
T 6 N
T 7 N
T 8 N
OZAUKEE CO.
WA
UK
ES
HA
CO
.
RACINE CO.
ST.
SOUTH
CUDAHY
FRANCIS
FRANKLIN
GLENDALE
OAK
MILWAUKEE
WAUWATOSA
MILWAUKEE
GREENFIELD
WEST ALLIS
CREEK
WEST
BAYSIDE
GREENDALE
MILWAUKEE
SHOREWOOD
BROWN DEER
RIVER HILLS
CORNERS
BAY
FOX
WHITEFISH
HALES
POINT
MIL
WA
UK
EE
CO
.
MILWAUKEE CO.
MILWAUKEE CO.
,-43
,-43
,-94
,-43
,-94
,-94
,-43
,-43
,-94
,-894
,-794
,-894
M I
C H
I G
A N
RIVER
L A
K E
ME
NO
MO
NE
E
RIVE
R
MILWAUKEE
ROOT
ROOT RIVER
ROOT RIVER
RIVER
MENOMONEE
RIV
ER
RO
OT
OAK
BRANCH
FISH
PARK
CREEK
RIV
ER
CR
EE
K
HO
NE
Y
RIV
ER
CREEK
LITT
LE
WIL
SO
N
LIN
CO
LN
MENO
MO
NEE
CREEK
INDIA
NCREEK
RIV
ER
LY
ON
SP
AR
KCREEK
NO
RT
H
OF
BRANCHEAST
OF
RIV
ER
RO
OT
CREEK
KINNICKINNIC
CAN
ADI A
N
CAN
ADIA
N
RAILR
OAD
AND
RAI
LRO
AD
RAILROAD
RAILR
OAD
RAILROAD
RAILR
OAD
PAC
IFIC
PAC
IFICSYSTEM
UNION
PAC
IF IC
UNION
UN
ION
UN
ION
UNION
RAILW
AY
UNION
UN
ION
COMPANY
CEN
TRAL
PACIFIC
PACIFIC
RAI
LWA
Y
PACIFIC
PACIFIC
PACIFIC
RAILROAD
SOUTHERN
RAILROAD
PACIFIC
WISCONSIN
WISC
ON
SIN
")Y
")W")F
")G
")S
")W
")E
")S
")U
")N
")Y
")T
")V
")U
")A
")H
")V
")PP
")EE
")PP
")NN
")ZZ
")BB
")ZZ
")BB
")MM
")OO
")J
")D
QR57
QR32
QR32
QR32
QR24
QR36
QR32
QR57
QR59
QR38
QR59
QR24
QR100
QR100
QR145
QR175
QR181
QR190
QR181
QR38
QR100
QR190
QR100
QR181
QR100
QR119
QR32
QR100
QR145
QR794
QR32
QR36
QR100
QR32
QR57
QR145
QR57
QR341
QR241
QR241
,-43
,-43
,-94
,-43
,-94
,-94
,-43
,-43
,-94
,-894
,-794
,-894
0145
0145
0141
0145
0141
0118
01410145
0118
0145 0141
0141
0141
0145
8
8
8
8
8
8
8
6
8
8
8
88
8
8
6
88
8
8
8
8
6
8
8
888
8
8
8
8
8
8
8
6
8
8
88
8
8
8
8
8
8
8
8
6
8 4
4
4
44
4
4
4
4
4
4
44
4
4
4
4
4
4
4
4
4
6
4
8 4
6
4
44
66
66
44
6
8
4
4
4 4
4
4
8
4
88
8
44
44
4
6
4
4 4
4
GRAPHIC SCALE
0 4,000 8,000 12,000 16,000 FEET
0 1 2 MILES
p
#216351ATTACHMENT 3


UR
BA
NIZ
ED A
REA
S -
200
6M
ILES
AN
D D
AIL
Y V
EHIC
LE -
MIL
ES T
RA
VELE
D
TAB
LE H
M-7
1
OC
TOB
ER
200
7S
HE
ET
1 O
F 9
MIL
ES
DA
ILY
VE
HIC
LE-M
ILE
S O
F TR
AV
EL
(TH
OU
SA
ND
S)
STA
TEE
STI
MA
TED
OTH
ER
OTH
ER
FED
ER
AL-
AID
LOC
ATI
ON
PO
PU
LATI
ON
FRE
EW
AY
SO
THE
RM
INO
RFR
EE
WA
YS
OTH
ER
MIN
OR
UR
BA
NIZ
ED
AR
EA
1/
(1,0
00)
INTE
RS
TATE
AN
DP
RIN
CIP
AL
AR
TER
IAL
CO
LLE
CTO
RLO
CA
LTO
TAL
INTE
RS
TATE
AN
DP
RIN
CIP
AL
AR
TER
IAL
CO
LLE
CTO
RLO
CA
LTO
TAL
EX
PR
ES
SW
AY
SA
RTE
RIA
LE
XP
RE
SS
WA
YS
AR
TER
IAL
New
Yor
k-N
ewar
k
18,2
24
506
70
6
2,60
1
4,82
7
3,88
0
30,9
70
43,4
90
57
,297
60
,945
64,7
24
56,4
00
24,0
77
47,4
70
31
0,91
3
N
Y12
,056
25
1
477
1,
498
2,
635
2,
126
15
,749
22
,736
28,0
78
37,3
65
32
,336
37
,725
15
,388
25
,868
176,
760
NJ
6,16
8
25
5
229
1,
103
2,
192
1,
754
15
,217
20
,750
29,2
19
23,5
80
32
,388
18
,675
8,
688
21
,601
134,
151
CT
--
--
--
4
4
--
--
1
1
2
Los
Ang
eles
-Lon
g B
each
-San
ta A
na C
A12
,345
35
6
319
2,
472
3,
148
2,
639
15
,899
24
,833
80,4
12
53,0
41
70
,477
49
,166
11
,429
14
,021
278,
546
C
hica
go
8,
453
463
55
1,
831
2,
533
2,
581
18
,090
25
,553
51,2
75
2,78
2
44,8
07
32,7
97
18,8
68
21,0
79
17
1,60
8
IN
491
66
16
17
4
24
4
28
9
1,
708
2,49
7
4,17
5
578
3,38
8
1,
802
712
2,46
4
13,1
19
IL
7,96
2
39
7
39
1,65
7
2,28
9
2,29
2
16,3
82
23,0
56
47
,100
2,
204
41
,419
30
,995
18
,156
18
,615
158,
489
M
iam
i F
L5,
379
131
20
0
705
952
1,32
3
13,6
70
16,9
81
21
,872
18
,488
28,4
26
24,4
85
14,7
74
25,9
15
13
3,96
0
Phi
lade
lphi
a
5,27
5
27
0
198
1,
347
1,
715
1,
962
13
,891
19
,383
25,1
64
10,7
81
30
,196
17
,715
11
,092
12
,596
107,
544
PA
3,63
3
16
3
112
90
3
97
2
1,
318
8,
844
12,3
12
16
,535
5,
704
17
,751
11
,210
7,
893
6,
948
66
,041
NJ
1,13
3
65
78
30
3
61
6
43
4
3,
655
5,15
1
4,91
2
4,70
1
8,03
7
4,
907
1,81
4
3,33
7
27,7
08
M
D26
1
2
11
15
19
75
12
3
83
36
21
8
77
53
49
516
DE
483
41
6
130
112
191
1,31
7
1,
797
3,
634
34
0
4,
190
1,52
1
1,
332
2,
262
13
,279
D
alla
s-Fo
rt W
orth
-Arli
ngto
n T
X4,
377
291
23
1
984
1,16
1
2,09
3
13,0
50
17,8
10
34
,082
19
,162
27,6
11
18,0
27
10,8
72
5,23
1
114,
985
A
tlant
a G
A4,
361
298
59
58
3
2,
020
1,
291
15
,515
19
,766
42,8
41
5,21
4
15,5
80
28,8
53
9,44
0
25,2
96
12
7,22
4
Was
hing
ton
4,
308
185
14
3
705
1,11
1
1,13
9
8,34
9
11
,632
29,2
41
9,00
4
25,2
24
17,3
57
7,14
2
8,04
6
96,0
14
V
A2,
038
90
48
304
575
529
3,64
3
5,
189
13
,823
3,
437
12
,103
9,
631
3,27
3
3,45
0
45,7
17
M
D1,
689
82
75
300
371
454
3,66
1
4,
943
14
,270
4,
504
10
,257
5,
706
3,03
5
2,59
6
40,3
68
D
C58
1
13
20
101
165
156
1,04
5
1,
500
1,
148
1,
063
2,
864
2,02
0
83
4
2,
000
9,
929
Bos
ton
4,
101
279
16
7
1,12
1
2,11
2
1,84
5
11,2
66
16,7
90
29
,588
10
,502
20,7
73
14,5
19
5,67
7
12,6
65
93
,724
RI
--
--
--
--
--
--
--
-
NH
111
10
2
23
63
92
556
74
6
81
2
82
431
72
4
447
298
2,79
4
MA
3,99
0
26
9
165
1,
098
2,
049
1,
753
10
,710
16
,044
28,7
76
10,4
20
20
,342
13
,795
5,
230
12
,367
90,9
30
Det
roit
MI
3,91
8
22
0
84
1,11
3
1,47
3
1,08
6
10,8
27
14,8
03
26
,136
6,
930
33
,663
18
,908
6,
501
10
,083
102,
221
P
hoen
ix A
Z3,
350
53
160
86
4
89
5
56
3
9,
840
12,3
75
9,
778
19
,674
22,7
62
11,5
62
4,47
7
9,30
9
77,5
62
San
Fra
ncis
co-O
akla
nd C
A3,
162
142
12
5
451
857
850
4,70
1
7,
126
22
,897
15
,997
12,0
52
11,8
48
4,49
8
2,23
9
69,5
31
Sea
ttle
WA
3,05
6
13
9
181
71
6
1,
155
1,
137
8,
662
11,9
90
20
,913
9,
551
14
,970
12
,350
5,
507
7,
823
71
,114
S
an D
iego
CA
2,95
1
15
0
130
28
6
75
6
76
8
2,
989
5,07
9
27,6
69
11,5
03
8,
591
13,8
77
4,55
2
2,02
8
68,2
20
Hou
ston
TX
2,80
1
13
7
240
69
3
1,
488
1,
410
11
,586
15
,554
24,2
95
22,4
04
20
,239
21
,072
9,
022
4,
139
10
1,17
1
Min
neap
olis
-St.
Pau
l M
N2,
519
198
13
1
197
1,55
9
1,19
4
7,82
9
11
,108
20,0
05
8,65
9
5,72
1
17
,844
4,
916
6,
534
63
,679
S
an J
uan
PR
2,30
6
96
56
24
2
53
9
63
0
5,
718
7,28
1
9,02
9
3,16
4
7,26
6
6,
027
3,97
3
3,51
4
32,9
73
Tam
pa-S
t. P
eter
sbur
g F
L2,
293
118
51
40
9
55
1
82
7
7,
567
9,52
3
11,6
74
1,91
1
16,0
86
13,2
69
7,34
5
14,3
47
64
,632
S
t. Lo
uis
2,
212
255
11
6
602
767
1,15
5
7,45
8
10
,353
23,0
08
4,85
3
11,2
93
7,47
1
5,
203
12
,306
64,1
34
M
O1,
770
166
99
36
0
46
6
84
3
5,
297
7,23
1
19,1
22
4,61
2
7,97
5
5,
109
4,07
7
10,7
79
51
,674
IL44
2
89
17
242
301
312
2,16
1
3,
122
3,
886
24
1
3,
318
2,36
2
1,
126
1,
527
12
,460
B
altim
ore
MD
2,14
9
14
1
150
39
3
66
3
72
4
5,
062
7,13
3
17,7
87
8,69
5
10,0
52
8,32
2
3,
835
3,
805
52
,496
D
enve
r-A
uror
a C
O2,
133
108
15
0
502
595
685
6,23
6
8,
276
12
,148
7,
787
16
,336
7,
193
4,03
5
5,27
8
52,7
77
Riv
ersi
de-S
an B
erna
rdin
o C
A1,
917
106
62
20
1
69
1
73
2
3,
254
5,04
6
15,7
01
8,80
9
4,36
7
8,
579
3,30
9
2,88
0
43,6
45
Sac
ram
ento
CA
1,85
8
64
59
35
5
33
0
52
7
3,
410
4,74
5
8,40
2
7,40
1
10,0
30
4,47
2
2,
895
97
4
34
,174
P
ittsb
urgh
PA
1,81
6
17
0
131
55
0
90
6
87
2
6,
656
9,28
5
8,36
4
3,79
1
9,83
5
7,
442
3,84
4
4,76
8
38,0
44
Por
tland
1,77
4
90
61
29
9
59
6
89
0
5,
002
6,93
8
9,93
2
3,67
0
7,46
1
6,
478
3,89
8
3,95
0
35,3
89
W
A33
9
22
34
66
131
148
844
1,
245
1,
736
1,
227
1,
247
823
48
2
68
2
6,
197
O
R1,
435
68
27
233
465
742
4,15
8
5,
693
8,
196
2,
443
6,
214
5,65
5
3,
416
3,
268
29
,192
C
leve
land
OH
1,74
5
19
2
52
356
643
656
5,33
7
7,
236
15
,740
2,
466
5,
632
6,27
9
2,
822
6,
293
39
,232
S
an J
ose
CA
1,70
3
41
85
31
7
39
1
36
7
2,
779
3,98
0
6,74
1
9,96
7
10,8
00
6,05
9
1,
523
2,
034
37
,124
C
inci
nnat
i
1,64
7
16
9
39
350
548
568
5,02
1
6,
695
17
,358
1,
462
6,
210
5,89
4
3,
285
6,
802
41
,011
OH
1,33
3
12
7
38
271
440
449
3,95
7
5,
282
12
,760
1,
426
4,
687
4,64
3
2,
721
6,
105
32
,342
KY
314
42
1
79
108
119
1,06
4
1,
413
4,
598
36
1,
523
1,25
1
56
4
69
7
8,
669
IN
--
--
--
--
--
--
--
- V
irgin
ia B
each
VA
1,52
8
11
6
68
304
555
557
4,32
3
5,
923
10
,921
2,
280
7,
216
8,11
2
2,
663
4,
274
35
,466
K
ansa
s C
ity
1,
520
204
17
7
353
814
677
6,44
4
8,
669
14
,909
5,
907
6,
044
6,99
3
2,
315
7,
549
43
,717
MO
875
12
5
112
23
4
50
1
33
6
3,
534
4,84
2
8,71
0
3,84
9
3,56
1
3,
905
932
4,84
3
25,8
00
K
S64
5
79
65
119
313
341
2,91
0
3,
827
6,
199
2,
058
2,
483
3,08
8
1,
383
2,
706
17
,917
S
an A
nton
io T
X1,
407
135
76
27
9
46
7
57
9
3,
580
5,11
6
14,1
18
6,10
6
6,21
6
5,
904
3,37
2
2,12
9
37,8
45
Milw
auke
e W
I1,
399
95
53
660
796
481
4,04
7
6,
132
8,
373
2,
577
9,
292
5,52
0
1,
174
7,
044
33
,980
O
rland
o F
L1,
376
39
142
20
8
34
2
52
7
4,
340
5,59
8
6,06
1
6,91
9
8,18
3
8,
515
5,40
6
6,23
2
41,3
16
Pro
vide
nce
1,
238
84
100
39
5
52
2
71
9
4,
515
6,33
5
7,38
8
3,89
1
6,53
4
4,
568
2,45
8
1,82
4
26,6
63
R
I98
7
50
82
347
329
588
3,61
4
5,
010
4,
862
3,
213
5,
915
3,02
1
1,
984
75
7
19
,752
MA
251
34
18
48
19
3
13
1
90
1
1,32
5
2,52
6
678
619
1,
547
474
1,06
7
6,91
1
C
olum
bus
OH
1,20
3
12
7
37
197
494
425
4,01
8
5,
298
13
,183
2,
247
4,
069
6,16
5
2,
446
3,
417
31
,527
B
uffa
lo N
Y1,
071
75
68
325
518
462
2,89
2
4,
340
4,
829
2,
042
5,
830
4,82
6
2,
128
2,
968
22
,623
M
emph
is
1,
021
81
39
275
572
410
2,53
2
3,
909
6,
879
1,
674
6,
983
6,73
7
1,
892
2,
945
27
,110
TN
887
57
24
21
6
51
5
35
9
1,
972
3,14
3
5,77
4
1,26
3
5,96
4
6,
256
1,64
4
2,50
6
23,4
07
For f
ootn
otes
, see
Foo
tnot
es P
age.
ATTACHMENT 4#215881
ELYNDE
Highlight

UR
BA
NIZ
ED A
REA
S -
201
1M
ILES
AN
D D
AILY
VEH
ICLE
- M
ILES
TR
AVEL
ED
TAB
LE H
M-7
1
FEB
RU
ARY
2013
SH
EE
T 1
OF
8
MIL
ES
DAI
LY V
EH
ICLE
-MIL
ES
OF
TRAV
EL
(TH
OU
SAN
DS
)
CE
NS
US
OTH
ER
OTH
ER
FED
ER
AL-A
IDP
OP
ULA
TIO
NFR
EE
WAY
SO
THE
RM
INO
RM
AJO
RM
INO
RFR
EE
WAY
SO
THE
RM
INO
RM
AJO
RM
INO
R
UR
BAN
IZE
D A
RE
A 1
/IN
TER
STA
TEAN
DP
RIN
CIP
ALAR
TER
IAL
CO
LLE
CTO
RC
OLL
EC
TOR
LOC
ALTO
TAL
INTE
RS
TATE
AND
PR
INC
IPAL
ARTE
RIA
LC
OLL
EC
TOR
CO
LLE
CTO
RLO
CAL
TOTA
L
EXP
RE
SS
WAY
SAR
TER
IAL
EXP
RE
SS
WAY
SAR
TER
IAL
New
Yor
k--N
ewar
k, N
Y--N
J--C
T18
,351
,295
50
7
70
8
2,59
5
4,81
5
3,83
7
-31
,431
43
,893
55,1
77
58,8
13
61
,651
43
,357
16
,757
-50
,346
286,
101
Los
Ange
les-
-Lon
g B
each
--An
ahei
m, C
A12
,150
,996
35
3
31
7
2,48
4
3,11
8
2,60
7
-16
,000
24
,877
78,8
25
51,3
43
69
,314
46
,770
11
,384
-13
,171
270,
807
Chi
cago
, IL-
-IN8,
608,
208
48
3
52
1,
920
2,
643
2,
889
0
17
,919
25
,905
52,7
00
2,51
7
43,0
55
32,1
56
19,2
98
-
22,9
82
17
2,70
8
M
iam
i, FL
5,50
2,37
9
131
207
70
7
96
8
1,
349
-
1 2,2
79
15,6
41
22
,927
18
,314
27,1
08
21,9
33
13,3
03
-
22,3
15
12
5,89
9
P
hila
delp
hia,
PA-
-NJ-
-DE
--M
D5,
441,
567
27
0
20
8
1,33
9
1,71
6
1,96
7
-14
,366
19
,867
22,5
35
11,0
64
28
,034
16
,839
9,
664
-
11,0
54
99
,190
D
alla
s--F
ort W
orth
--Ar
lingt
on, T
X5,
121,
892
31
5
31
6
1,06
8
1,65
8
2,93
9
-15
,315
21
,610
35,4
68
27,5
07
22
,318
20
,818
13
,874
-5,
403
12
5,38
9
H
oust
on, T
X4,
944,
332
15
1
33
8
835
1,68
5
1,78
8
-13
,588
18
,385
26,0
38
26,4
77
19
,208
20
,662
10
,732
-4,
630
10
7,74
6
W
ashi
ngto
n, D
C--
VA-
-MD
4,58
6,77
0
183
127
73
0
1,
124
1,
170
-
8,99
6
12
,330
29,3
58
7,76
3
26,8
22
17,6
16
7,73
0
-8,
447
97
,736
At
lant
a, G
A4,
515,
419
29
7
76
56
3
2,
072
1,
378
-
16,6
49
21,0
36
39
,710
6,
344
14
,782
26
,938
9,
351
-
32,5
17
12
9,64
1
B
osto
n, M
A--N
H--
RI
4,18
1,01
9
279
176
1,
123
2,
102
1,
838
-
11,5
86
17,1
03
29
,904
10
,679
20,2
05
14,7
55
5,19
2
-12
,984
93,7
19
Det
roit,
MI
3,73
4,09
0
220
83
1,10
2
1,47
6
1,07
5
-10
,863
14
,819
23,8
78
6,17
9
27,7
05
17,5
47
4,95
3
-10
,144
90,4
06
Pho
enix-
-Mes
a, A
Z3,
629,
114
53
16
8
872
890
564
-10
,029
12
,577
9,55
7
19,9
38
21
,194
12
,658
4,
621
-
9,56
2
77,5
30
San
Fra
ncis
co--
Oak
land
, CA
3,28
1,21
2
139
124
45
7
84
9
85
5
-
4,72
5
7,
150
20
,554
15
,454
11,3
81
11,3
05
4,36
1
-3,
874
66
,930
S
eattl
e, W
A3,
059,
393
13
9
18
2
738
1,27
3
1,25
1
-8,
936
12,5
19
20
,788
9,
472
14
,730
12
,527
5,
468
-
7,78
4
70,7
69
San
Die
go, C
A2,
956,
746
15
1
11
7
294
731
842
-3,
117
5,25
2
25,5
50
10,5
01
8,
360
13,2
41
5,73
2
-2,
453
65
,837
M
inne
apol
is--
St.
Pau
l, M
N--
WI
2,65
0,89
0
210
133
18
6
1,
626
1,
196
0
8,
932
12,2
83
19
,845
8,
635
5,
737
17,9
00
4,71
8
0
7,97
2
64,8
07
Tam
pa--
St.
Pet
ersb
urg,
FL
2,44
1,77
0
117
53
414
548
823
-7,
734
9,68
9
12,1
60
1,90
9
15,8
14
11,2
09
5,70
6
-14
,075
60,8
72
Den
ver-
-Aur
ora,
CO
2,37
4,20
3
108
143
50
3
59
5
68
6
-
6,39
4
8,
430
12
,893
7,
719
13
,679
6,
557
3,
694
-
4,94
9
49,4
92
Bal
timor
e, M
D2,
203,
663
14
1
15
1
392
664
726
-5,
288
7,36
1
17,6
45
9,06
9
9,83
5
8,
455
3,
964
-
3,77
3
52,7
41
St.
Loui
s, M
O--
IL2,
150,
706
30
6
99
63
0
83
8
1,
361
0
8,
390
11,6
24
26
,114
3,
348
11
,367
7,
796
5,
295
0
11
,919
65,8
39
San
Jua
n, P
R2,
148,
346
10
0
44
25
1
53
8
63
5
-
6,14
6
7,
714
8,
498
2,
668
7,
298
5,53
6
3,74
7
-3,
502
31
,249
R
iver
side
--S
an B
erna
rdin
o, C
A1,
932,
666
10
5
71
25
1
66
4
73
9
-
3,16
7
4,
998
14
,782
7,
832
7,
145
8,74
5
3,47
5
-2,
579
44
,557
La
s V
egas
--H
ende
rson
, NV
1,88
6,01
1
65
41
167
535
-58
5
3,
163
4 ,55
7
7,39
1
3,41
4
5,13
3
9,
763
-
4,27
4
3,87
7
33,8
52
Por
tland
, OR
--W
A1,
849,
898
91
61
31
0
62
8
91
1
-
5,15
4
7,
156
9,
849
3,
539
7,
102
6,59
8
4,00
7
-3,
734
34
,829
C
leve
land
, OH
1,78
0,67
3
192
52
357
643
659
-5,
358
7,26
1
14,9
64
2,26
2
5,50
0
6,
868
3,
853
-
6,28
0
39,7
26
San
Ant
onio
, TX
1,75
8,21
0
142
86
274
634
571
-4,
390
6,09
7
14,0
38
6,22
0
5,48
1
7,
484
3,
225
-
1,69
9
38,1
47
Pitt
sbur
gh, P
A1,
733,
853
20
8
91
55
0
90
7
87
3
-
6,82
1
9,
451
7,
032
1,
704
8,
568
7,17
1
3,61
2
-4,
993
33
,079
S
acra
men
to, C
A1,
723,
634
64
57
38
3
34
2
55
0
-
3,71
3
5,
109
7,
959
7,
076
10
,008
4,
200
2,
855
-
2,86
2
34,9
61
San
Jos
e, C
A1,
664,
496
41
85
29
9
37
1
34
2
-
2,55
5
3,
693
6,
449
10
,385
9,78
1
5,
721
1,
517
-
2,13
2
35,9
85
Cin
cinn
ati,
OH
--K
Y--IN
1,62
4,82
7
176
39
360
562
650
-5,
164
6,95
1
16,9
95
1,50
6
6,65
7
6,
684
4,
789
-
6,93
0
43,5
61
Kan
sas
City
, MO
--K
S1,
519,
417
21
8
19
1
349
836
713
-7,
041
9,34
8
14,8
15
6,35
1
5,82
9
6,
834
2,
555
-
7,61
4
43,9
97
Orla
ndo,
FL
1,51
0,51
6
39
148
22
8
36
1
62
9
-
4,22
5
5,
629
5,
282
6,
738
7,
727
8,16
2
5,83
6
-7,
650
41
,394
In
dian
apol
is, I
N1,
487,
483
15
4
22
40
5
62
7
75
9
-
4,82
4
6,
792
12
,887
61
5
9,
216
6,91
7
4,49
6
-12
,292
46,4
24
Virg
inia
Bea
ch, V
A1,
439,
666
11
4
58
34
5
59
6
62
9
-
4,92
4
6,
665
10
,857
2,
160
7,
845
8,43
0
2,42
0
-4,
716
36
,427
M
ilwau
kee,
WI
1,37
6,47
6
95
62
654
795
491
-4,
073
6,17
0
8,48
3
2,66
9
9,61
8
4,
282
1,
165
-
1,58
9
27,8
06
Col
umbu
s, O
H1,
368,
035
12
7
38
19
8
51
7
42
0
-
4,04
4
5,
342
12
,752
2,
345
3,
897
5,85
8
3,34
9
-3,
411
31
,613
Au
stin
, TX
1,36
2,41
6
41
133
30
3
27
3
68
5
-
3,59
9
5,
035
5,
463
6,
682
7,
332
3,03
9
4 ,61
1
-1,
889
29
,016
C
harlo
tte, N
C--
SC
1,24
9,44
2
123
26
210
296
284
-3,
619
4,55
9
10,8
60
1,21
8
5,10
6
4,
503
2,
429
-
8,85
2
32,9
67
Pro
vide
nce,
RI--
MA
1,19
0,95
6
84
102
39
6
52
1
71
9
-
4,54
8
6,
369
7,
308
3,
835
5,
910
4,05
1
2,54
1
-1,
846
25
,490
Ja
ckso
nville
, FL
1,06
5,21
9
113
48
166
256
438
-4,
416
5,43
7
9,15
1
2,24
5
4,68
4
4,
116
3,
503
-
7,76
9
31,4
68
Mem
phis
, TN
--M
S--
AR1,
060,
061
84
39
27
5
58
9
44
6
1
3,
371
4,80
5
6,89
1
1,58
8
6,26
4
6,
387
1,
793
2
3,
687
26
,611
S
alt L
ake
City
--W
est V
alle
y C
ity, U
T1,
021,
243
66
10
12
6
28
5
25
2
0
2,
420
3,15
9
7,56
4
605
3,53
3
4,
658
1,
960
0
3,
612
21
,933
Lo
uisv
ille/J
effe
rson
Cou
nty,
KY-
-IN97
2,54
6
-
--
--
--
--
--
--
--
-N
ashv
ille-D
avid
son,
TN
969,
587
129
49
276
437
459
-4,
362
5,71
2
12,8
77
2,12
6
6,03
2
5,
230
2,
412
-
6,00
1
34,6
78
Ric
hmon
d, V
A95
3,55
6
13
4
64
23
0
46
8
46
8
-
3,67
1
5,
035
8,
928
2,
605
5,
407
4,36
3
1,88
6
-3,
225
26
,414
B
uffa
lo, N
Y93
5,90
6
74
68
32
2
52
0
45
1
-
2,93
8
4,
372
4,
615
2,
017
5,
378
4,23
2
1,50
7
-2,
968
20
,717
H
artfo
rd, C
T92
4,85
9
80
67
21
1
44
2
53
4
7
2,
784
4,12
5
7 ,69
4
2,86
0
3,38
8
4,
143
2,
220
13
1,
920
22
,239
B
ridge
port-
-Sta
mfo
rd, C
T--N
Y92
3,31
1
51
71
13
9
43
3
42
2
9
2,
834
3,95
8
6,21
8
4,12
1
2,30
6
3,
632
1,
592
18
2,
088
19
,976
N
ew O
rlean
s, L
A89
9,70
3
51
17
21
3
27
0
21
0
-
2,77
3
3,
533
3,
652
1,
242
4,
845
2,80
5
1,04
6
-1,
162
14
,751
R
alei
gh, N
C88
4,89
1
70
30
15
3
34
5
25
6
-
3,43
9
4,
293
6,
467
1,
615
4,
341
5,10
6
2,03
8
-6,
050
25
,618
O
klah
oma
City
, OK
861,
505
106
37
283
545
355
-3,
604
4,93
0
8,40
3
1,93
2
6,34
5
6,
588
1,
845
-
6,50
6
31,6
19
Tucs
on, A
Z84
3,16
8
39
8
238
265
326
-2,
978
3,85
5
3,42
4
310
7,03
6
3,
589
1,
315
-
2,59
6
18,2
70
El P
aso,
TX-
-NM
803,
086
44
60
227
200
243
1
1,73
1
2,
506
4,
041
1,
693
4,
339
1,81
7
1,52
2
4
925
14,3
42
Urb
an H
onol
ulu,
HI
802,
459
41
28
64
73
143
-76
8
1,11
6
4,60
0
1,19
5
1,89
5
1,
201
1,
069
-
3,01
6
12,9
77
Birm
ingh
am, A
L74
9,49
5
12
4
11
12
9
39
0
48
4
0
3,
862
4,99
9
9,27
7
278
3,73
0
4,
104
2,
531
0
6,
023
25
,943
Al
buqu
erqu
e, N
M74
1,31
8
59
-
249
203
-28
7
1,
745
2,54
3
4,99
6
-5,
334
1,84
8
-1,
403
1,
586
15
,167
M
cAlle
n, T
X72
8,82
5
-
52
291
201
625
-2,
594
3,76
2
-3,
176
4,
390
1,50
2
2,56
1
-1,
210
12
,839
O
mah
a, N
E--
IA72
5,00
8
47
35
18
2
25
3
22
0
-
2,05
1
2,
789
3,
418
1,
600
3,
531
2,42
2
844
-1,
697
13
,512
D
ayto
n, O
H72
4,09
1
89
24
21
0
26
0
48
1
-
2,76
6
3,
829
6,
030
87
3
3,
509
2,72
7
2,94
8
-3,
075
19
,162
R
oche
ster
, NY
720,
572
65
46
98
418
299
-2,
292
3,21
9
3,81
0
2,00
6
1,87
5
4,
492
1,
365
-
2,28
4
15,8
31
Alle
ntow
n, P
A--N
J66
4,65
1
61
36
18
5
20
3
40
6
-
2,19
2
3,
084
3,
140
1,
929
3,
315
2,07
6
1,66
3
-1 ,
468
13
,590
Tu
lsa,
OK
655,
479
51
101
18
7
49
5
18
3
-
2,54
5
3,
562
2,
650
4,
737
3,
405
4,69
7
558
-4,
470
20
,518
Fr
esno
, CA
654,
628
-53
12
1
31
2
21
3
-
1,69
3
2,
392
-
3,79
2
2,59
7
3,
472
95
6
-
1,38
2
12,1
99
Sar
asot
a--B
rade
nton
, FL
643,
260
28
-12
7
11
5
37
9
-
2,73
1
3,
380
2,
369
-
4,05
6
2,
141
2,
904
-
4,97
0
16,4
39
For f
ootn
otes
, see
Foo
tnot
es P
age.
ELYNDE
Highlight

EDL/CTA/cta/edl #215617v2 2/25/14
Table III-14 (Revised)
AVERAGE ANNUAL GROWTH RATE OF AVERAGE WEEKDAY VEHICLE-MILES OF TRAVEL IN SOUTHEASTERN WISCONSIN
Time Period Annual
Growth Rate
Historic
1960’s 4.9
1970’s 2.7
1980’s 2.6
1990’s 1.9
2001-2005 1.5
2005-2011 -0.5
Forecast 2000-2007 1.5
2007-2020 1.0
2020-2035 0.6 Source: SEWRPC.
Table III-15 (Revised)
ARTERIAL VEHICLE-MILES OF TRAVEL WITHIN THE REGION ON AN AVERAGE WEEKDAY
Year Vehicle-Miles of Travel
(millions)
Estimated
Historic
1963
1972
1991
2001
2005
2011
13.1
20.1
33.1
39.7
42.2
40.9
Forecast 2011
2035
43.5
54.0 Source: SEWRPC.
ATTACHMENT 5(PDF#216692)


- 1 -
ATTACHMENT 6
Summary and Conclusions for Part Two (replace this section in Chapter III starting on page III-16)
Part Two of this chapter has provided an overview of the currently adopted year 2035 regional land use plan and
assessment of how well that plan is being implemented, focusing on the key plan recommendations. That
assessment indicated the following:
Substantially Implemented Recommendations
The regional plan recommends that urban development primarily occur in existing urban centers as infill
development and redevelopment and within defined urban growth areas adjoining these centers. About
74 percent, or 40 square miles, of the 54 square miles of urban incremental development that occurred in
the Region between 2000 and 2010 was consistent with regional plan recommendations.
The vast majority of housing units constructed in the Region between 2000 and 2010—an estimated
72,100 housing units, or about 86 percent of the estimated total of 84,100 housing units built in the
Region during the 2000s—was provided with public sanitary sewer service consistent with regional plan
recommendations.
The regional plan envisions a total of 60 major economic activity centers in the Region in the year 2035.
By definition, these sites accommodate at least 3,500 total jobs or 2,000 retail jobs. Forty-five such sites
existed in the Region in 2000. The regional plan recommended that these sites continue to serve as major
centers and recommended an additional 15 major centers, all but one of which were at some stage of
development when the regional plan was adopted. Of the 45 existing major centers in 2000, 44 retained
their major center status in 2010.
The regional plan recommends 32 major parks to serve the Region. Such parks have an area of at least
250 acres and provide opportunities for a variety of resource-oriented outdoor recreation activities. Of the
32 major parks identified in the plan, 24 sites had been substantially acquired and developed for park
purposes by 2000. Six other sites experienced significant additional facility development in accordance
with the plan during the 2000s, and land was acquired for two new sites recommended in the plan.
The regional plan recommends the preservation in essentially natural, open use of the Region’s primary
environmental corridors. About 456 square miles, representing 94 percent of the total of 487 square miles
of primary environmental corridors in the Region, were substantially protected from incompatible urban
development in 2010.
- 2 -
Partially Implemented Recommendations
The regional land use plan recommends an increase in residential land consistent with the forecast growth
in the Region’s population and households. Under the plan, about 23 square miles of land were
anticipated to be converted to urban (high-, medium-, and low-density) residential use during the 2000s.
The actual increase was about 26 square miles. Less new medium density residential development and
more new low density residential development occurred than recommended in the plan. The plan
envisioned an increase of almost 18 square miles in medium density residential land during the 2000s; the
actual increase was about 10 square miles. The plan envisioned an increase of about four square miles of
low density residential land; the actual increase was about 13 square miles. The plan also envisioned an
increase of about one square mile of high density residential land, and the actual increase was just under
three square miles.
The regional plan would accommodate additional residential development in rural areas on a limited
basis, recommending that such development occur at a density of no more than one housing unit per five
acres, and be located outside prime agricultural lands. The plan recommends clustering homes at these
densities using conservation subdivision design principles. An increase of two square miles of rural
density residential land was envisioned during the 2000s; the actual increase was about seven square
miles.
The regional plan recommends that the most productive soils for agricultural purposes—agricultural
capability Class I and Class II soil as classified by the U.S. Natural Resources Conservation Service—be
preserved for agricultural use insofar as practicable. Under the plan, the conversion of Class I and Class II
agricultural land to urban use would be confined, for the most part, to locations within planned urban
service areas. Monitoring data indicate that about 15.5 square miles of Class I and Class II agricultural
land were converted to urban use during the 2000s in locations consistent with the regional plan, with
most of this occurring within planned urban service areas. The data further indicate that about 5 square
miles of Class I and Class II agricultural land were converted to urban use in locations not consistent with
the plan.
Recently, the six counties in the Region that have substantial amounts of agricultural land (Kenosha,
Ozaukee, Racine, Walworth, Washington, and Waukesha Counties) updated and extended their farmland
preservation plans, identifying farmland preservation areas that are intended to be reserved for agriculture
and agricultural-related uses. While large blocks of Class I and Class II agricultural land have been
included in these farmland preservation areas, many farming areas with concentrations of Class I and
Class II soils have been excluded. In general, the county farmland preservation plans identify farmland

- 3 -
preservation areas only where local government support for this has been demonstrated. In their local
comprehensive plans, many communities have opted for less restrictive agricultural planning districts,
often relying on agricultural-rural residential districts, which accommodate more residential development
than would be allowed in an exclusive farmland preservation area. While such planning districts serve to
maintain rural densities and rural character, they are not as effective as exclusive farmland preservation
districts in preserving farmland.
Unimplemented Recommendation
The regional plan recommends that new sub-urban density residential development, characterized by
single family homes on lots of two to three acres, should be limited to development that is already
committed in subdivision plats and certified surveys. About three square miles of undeveloped land were
committed to sub-urban density residential development when the plan was prepared. Over six square
miles were converted to sub-urban density residential development during the 2000s.
Conclusions
Implementation of the year 2035 regional land use plan would benefit the Region in several ways. Development
would occur in a compact and efficient pattern that is readily served by basic urban services and facilities and
maximizes the use of existing urban service and facility systems. Mixed use development would be
accommodated in urban areas to provide for convenience and efficiency in day-to-day activities, including ease
and efficiency in travel. The land development needs of the Region would be met while preserving the best
remaining elements of the natural resource base and preserving productive farmland.
Several of the key regional plan recommendations were substantially implemented between 2000 and 2010.
Almost all of the Region’s primary environmental corridors, which contain most of the best remaining woodlands,
wetlands, and wildlife habitat areas in the Region, were substantially protected from incompatible urban
development in 2010. In addition, most of the new housing units built in the Region between 2000 and 2010 were
provided with public sanitary sewer service in accordance with the regional plan and major economic activity
centers and regional parks experienced continued development.
Other key recommendations were only partially implemented or not implemented. Much of the new urban
development that occurred in the Region between 2000 and 2010 was located in accordance with regional plan
recommendations; however, more residential development occurred at lower densities than recommended. New
urban development in areas not in accordance with the regional plan was typically low density and sub-urban
density residential development. Over development of lower density housing has several negative consequences,
including:

- 4 -
Urban development that cannot be efficiently served by urban services such as public sanitary sewer,
water supply, and transit services;
Sub-urban residential density development that is neither truly urban nor rural in character that would not
generally occur in planned neighborhood units; would not be provided with public sanitary sewerage and
water supply facilities; and would receive only minimal public services, such as public safety services;
Higher conversion of agricultural and open land to urban development;
Housing that may not be affordable to area workers because multi-family housing, two-family housing,
and smaller single-family homes on smaller lots tend to be more affordable to a wide range of households
than larger single-family homes on larger lots.
Summary and Conclusions for Part Three (replace this section in Chapter III starting on page III-48)
Part Three of this chapter has provided an overview of the Commission’s currently adopted year 2035 regional
transportation system plan and assessment of how well that plan is being implemented, focusing on the key plan
recommendations. The currently adopted plan is its fifth generation plan, which was originally adopted in 2006
and amended on five occasions, including a review and reaffirmation of the plan that was completed in 2010.
The following are key concepts of the adopted regional transportation system plan as amended to date:
The regional transportation system plan is designed to serve the travel demand generated by the year 2035
regional land use plan. The year 2035 regional land use plan was developed to represent a desired pattern
of regional land use and not a projection of current land use development trends toward further
decentralization of population, employment, and urban land uses.
There are five elements of the year 2035 regional transportation system plan adopted in 2006: bicycle and
pedestrian facilities, public transit, transportation systems management, travel demand management,
arterial streets and highways. In addition, elements relating to transportation safety and transportation
security were added in 2011 as refinements to the regional transportation system plan.
Highway capacity additions were recommended in the regional transportation system plan to address the
traffic congestion which may not be expected to be alleviated by land use, systems management, travel
demand management, bicycle and pedestrian facilities, or public transit measures. The potential of transit,
bicycle and pedestrian facilities, transportation system management, and travel demand management plan
elements to alleviate congestion was first explicitly identified. Highway capacity additions were then
- 5 -
recommended to be added to the regional transportation plan to resolve, to the extent considered
practicable, the residual existing and probable future traffic congestion.
The year 2035 regional transportation system plan was based upon forecasts of personal vehicle availability,
weekday person trips and vehicle trips, vehicle-miles of travel, and transit ridership. The chapter included a
review of these forecasts and comparison to actual current estimates, which indicates that the forecasts underlying
the plan remain valid for long range planning.
Substantially Implemented Recommendations
Bicycle and pedestrian facilities: The bicycle and pedestrian facilities element of the plan is designed to
provide for safe accommodation of bicycle and pedestrian travel, encourage bicycle and pedestrian travel,
and to provide modal choice. The plan element recommends that as the surface arterial street system of
approximately 3,300 miles is resurfaced and reconstructed segment-by-segment, bicycle accommodation
should be considered and implemented, if feasible, through bicycle lanes, widened outside travel lanes,
widened shoulders, and separate bicycle paths. Additionally, the plan element also recommends
development of 586 miles of off-street bicycle and pedestrian paths, along with 147 miles of surface
arterial and non-arterial connections.
Approximately 203 miles of the planned 586 miles of off-street paths existed in 2006, and another 47
miles of the planned paths have since been constructed as of 2012. Also, with respect to recommended
accommodation of bicycle travel on the regional arterial street system, WisDOT and FHWA now require
such consideration during preliminary engineering conducted for State, county, and local arterial
construction and reconstruction using Federal funds.
Transportation systems management: The transportation systems management element of the plan
included measures intended to manage and operate existing transportation facilities to their maximum
carrying capacity and travel efficiency. The transportation systems management element of the plan
includes the following four measures: freeway traffic management, surface arterial street and highway
traffic management, major activity center parking management and guidance, and the preparation of a
Regional Transportation Operations Program.
Implementation has included the expansion of freeway ramp-meters, variable message signs and closed
circuit television cameras, and installation of a 511 travel information system. Other implementation has
included additional traffic signal interconnection and coordination.
- 6 -
Travel demand management: The travel demand management measures included in the recommended
year 2035 regional transportation plan include measures intended to reduce personal and vehicular travel
or to shift such travel to alternative times and routes, allowing for more efficient use of the existing
capacity of the transportation system. Seven categories of travel demand management measures were
recommended in the year 2035 plan: high-occupancy vehicle preferential treatment, park-ride lots, transit
pricing, personal vehicle pricing, travel demand management promotion, transit information and
marketing, and detailed site-specific neighborhood and major activity center land use plans.
Implementation has included expansion of park-ride lots, transit system internet trip planners, and
automatic bus location systems, and development of site specific transit-oriented development
neighborhood plans for the nine potential KRM commuter rail station areas.
Partially Implemented Recommendations
Arterial street and highway system: The adopted regional transportation system plan as amended
recommended three types of functional improvements to the arterial street and highway system: system
preservation, consisting of the resurfacing and reconstruction necessary to properly maintain existing
arterial roadways; system improvement, consisting of the widening of existing facilities to provide
additional traffic lanes; and system expansion, consisting of the construction of new arterial facilities.
About 3,209 miles, or 88 percent, of the total arterial street and highway system would require only
preservation; about 360 miles, or about 10 percent, would require improvement; and about 93 miles, or
about 2 percent, would constitute new facilities.
About 57.3 miles, or 13 percent, of the plan-recommended 453 miles of arterial capacity expansion have
been completed and are open to traffic as of 2012. Also, a 30-mile segment of IH 94 between the Mitchell
Interchange in Milwaukee County and the Wisconsin-Illinois State line is currently being reconstructed
with additional traffic lanes and is planned to be completed in 2021. Reconstruction of the Mitchell
Interchange and the portion of IH 94 from the Wisconsin-Illinois State line to STH 50 in Kenosha County
was completed in 2012. With respect to the other major freeway-to-freeway interchanges in Southeastern
Wisconsin, reconstruction of the Marquette Interchange—the largest and most complicated interchange—
was completed in 2008. Reconstruction of the Zoo Interchange began in 2013 and is planned to be
completed in 2018.
Transportation safety: The safety element contained a review of the transportation safety objectives,
principles, and standards documented in the adopted year 2035 regional transportation plan adopted in
2006, along with presenting a proposed expanded set of transportation safety objectives, principles, and

- 7 -
standards. The safety element also included listing and discussion of the recommendations of the year
2035 regional transportation plan which advance transportation safety. In addition, the element included
recommendations for improved traffic crash and safety data, and recommendations for further study and
improvements on those roadway segments with the most severe safety problems. The safety element was
recently added to the plan (in 2011), so there has not been enough time to track its implementation.
Transportation security: The security element provided an overview of transportation security and
considered security-related issues and efforts that are ongoing to protect transportation networks and
facilities at the Federal, State, and regional levels. The element also provided affirmation of the
Commission’s role in regional coordination of transportation security-related projects, along with the
incorporation of security considerations into future transportation system preservation, improvement, or
expansion projects. The security element was recently added to the plan (in 2011), so there has not been
enough time to track its implementation.
Unimplemented Recommendations
Public transit: The public transit element of the 2035 regional transportation system plan envisioned
significant improvement and expansion of public transit in Southeastern Wisconsin, including
development within the Region of a high-speed rail line, rapid transit and express transit systems,
improvement of existing local bus service, and the integration of local bus service with the recommended
rapid and express transit services. Altogether, service on the regional transit system would be nearly
doubled from service levels existing in 2005 measured in terms of revenue transit vehicle-miles of service
provided, from about 69,000 vehicle-miles of service on an average weekday in the year 2005 to 137,300
vehicle-miles of service in the year 2035.
Since adoption of the regional transportation plan in 2006, the amount of transit service has declined by
about 4 percent (7 percent decrease in fixed route bus service and 17 percent increase in shared-ride taxi
service) and transit fares have increased by amounts greater than general price inflation. The plan
envisioned transit service increases beginning in 2008 at an annual rate of about 2 percent through the
year 2035, and transit fare increases at the general rate of price inflation. It was recognized, however, that
these plan recommendations may only occur upon achieving State legislation for dedicated funding and
would be assisted by creation of a regional transit authority. State legislation was enacted in mid-2009
creating a commuter rail authority with dedicated local funding, and State legislation for a regional transit
authority with dedicated local funding was considered but not adopted in 2009 and again in 2010. In
2011, the regional authority responsible for implementing the commuter rail line was dissolved. In
addition, implementation of the planned high-speed rail line was indefinitely postponed following

- 8 -
withdrawal of Federal funding in December 2010, although high-speed rail remains a part of WisDOT’s
long-range state rail plan.
Conclusions
The year 2035 regional transportation system plan was guided by a vision for “a multimodal transportation system
with high quality public transit, bicycle and pedestrian, and arterial street and highway elements.” When
implementation of any transportation plan element is not realized, this vision is not achieved and can have
significant negative consequences.
This chapter has indicated that several of the key regional transportation system plan recommendations have been
substantially implemented. Significant progress on the bicycle and pedestrian element was made as new off-street
paths were constructed and on-street accommodation on highway construction and reconstruction projects has
been required. Numerous transportation systems management and travel demand management measures have
been continued, implemented, or expanded in accordance with the plan. Planned improvement and expansion of
the arterial street and highway system has progressed, although implementation has generally been slower than
anticipated due to limited available funding. In contrast to the other transportation plan elements, the public transit
element has not been implemented. Instead, transit service levels have been declining since the year 2000 due to
inadequate funding.
Insufficient funding, which has delayed implementation of arterial street and highway system recommendations,
can have negative impacts associated with worsening pavement conditions and with traffic congestion, such as
increased automobile-related emissions, vehicle crashes, and travel times. However, insufficient funding more
severely affects public transit than highways because highway funding is largely capital funding for construction
projects, while transit funding is largely operating funding for providing service. Lagging highway funding may
result in project deferral or delay, but lagging transit funding results in service elimination or passenger fare
increases. This is what has occurred for more than a decade in the Region, and may occur to an even greater
extent in the future as Federal funding now in operating budgets may need to be used for capital projects, unused
“banks” of Federal capital funding have been exhausted, and local funding through increases in property taxes is
currently significantly constrained by State law. Recent and continuing service reductions and fare increases have
significant negative consequences, including:
Reduced access to jobs, health care, shopping, education, and other basic travel needs of those unable to
use or afford a personal automobile;
Reduced ability of public transit to provide congestion relief in the Region’s most heavily travelled
corridors, urban areas, and activity centers, in which it is not possible or desirable to accommodate all
travel by automobile;

- 9 -
A less-balanced, inefficient transportation system, which does not support higher development density
and infill development and redevelopment;
Increased air pollution and energy consumption, which is particularly important given recent and
expected increases in gasoline prices; and
Fewer transportation choices, as high-quality public transit helps to improve quality of life and to
maintain and enhance the Region’s economy.
#216409v2