Adviser: Immersive Field Work for - Brown University · geological record at various points on the...
9
Exploring Geovisualization 46 July/August 2006 Published by the IEEE Computer Society 0272-1716/06/$20.00 © 2006 IEEE G eologists primarily explore the Earth through fieldwork and by analyzing the geological record at various points on the Earth’s sur- face (see Figure 1a). They then integrate individual data points about the Earth’s surface by means of more synoptic analyses. To aid this analysis, they often use image and topographic data that satellites acquire from Earth’s orbit. One of the authors, who has decades of field experience in widely varying terrain—from recent volcanic eruptions 1 to the Earth’s sea floor 2 to Antarti- ca’s Dry Valleys 3 —has demonstrated this strategy’s value and shown how to augment it using images from helicopters or remotely operated vehicles. In contrast, planetary geoscien- tists commonly work in the reverse order: Given the time and distances involved, flybys and orbital space- craft acquire the initial data from individual moons and planets. In some cases, more detail might come later through lander and rover deployments, or—in the Moon’s case—through human explorers. These opposite approaches result in a huge difference in local analysis of the Earth and other planets. While Earth geoscientists can employ 3D in situ strategies, most planetary geoscientists use static or interactive 2D visualizations for their analyses (see Figure 1b). Although these 2D visu- alizations are highly developed and often effective, for tasks involving subtle 3D spatial judgments, we expect that interactive 3D visualizations will likely lead to a more complete understanding of the data—and in some cases to recognition of features missed altogeth- er in 2D visualizations. Our goal is to enhance planetary geologists’ ability to do field work as effectively on other planets as they can on Earth. We also want to enhance the exploration of remote and potentially hazardous Earth environments, such as Antarctica. Guided by multiple questions about Mars’s geological evolution, as well as by future mission objectives, we’re developing the Advanced Visualiza- tion in Solar System Exploration and Research system. 4 As Figure 1c shows, Adviser lets geologists virtually enter the field by recreating remote sites using laser altime- try, camera, atmospheric, and other data. In develop- ing Adviser, we face the challenges of ■ developing algorithms that interactively render a rich 3D environment that combines multiple large data sources; ■ building tools that aid geoscientists in their research; and ■ running formal usability studies to evaluate the sys- tem relative to alternative approaches. Here we describe our system and present observations based on five case studies of its application. System overview Our prototype Adviser implementation operates in a four-wall Cave using the model-view-controller design pattern to organize data, visualizations, and interac- tions. The Adviser system contains topography, camera data, simulated data, and user annotation layers. We visualize the model using OpenGL and, in particular, the Real-Time Optimally Adaptive Meshes 2 (ROAM-2) 5 to render topography and camera data interactively. In terms of performance, an 8,192 × 8,192 heightfield renders at 80 stereo frames per second using an Nvidia GeForce 3000G graphics card. The heightfield can reg- ister multiple high-resolution inset camera images, although each inset incurs a frame-rate penalty. The user can toggle insets on and off to find a balance between information and frame rate. Geologists gener- ally display three inset images, with samples ranging from 1,000 × 1,000 to 15,000 × 14,000. The Cave pro- The Adviser prototype system makes it possible for planetary geologists to conduct virtual field research on remote environments such as Antarctica and Mars. Among Adviser’s interactive tools are mission-planning and measurement tools that let researchers generate new data and gain interpretive insights. Five case studies illustrate the system’s applications and observed benefits. Andrew Forsberg, Prabhat, Graff Haley, Andrew Bragdon, Joseph Levy, Caleb I. Fassett, David Shean, and James W. Head III Brown University Sarah Milkovich Jet Propulsion Laboratory Mark A. Duchaineau Lawrence Livermore National Lab Adviser: Immersive Field Work for Planetary Geoscientists
Transcript of Adviser: Immersive Field Work for - Brown University · geological record at various points on the...

Exploring Geovisualization
46 July/August 2006 Published by the IEEE Computer Society 0272-1716/06/$20.00 © 2006 IEEE
G eologists primarily explore the Earththrough fieldwork and by analyzing the
geological record at various points on the Earth’s sur-face (see Figure 1a). They then integrate individualdata points about the Earth’s surface by means of moresynoptic analyses. To aid this analysis, they often useimage and topographic data that satellites acquire fromEarth’s orbit. One of the authors, who has decades offield experience in widely varying terrain—from recentvolcanic eruptions1 to the Earth’s sea floor2 to Antarti-ca’s Dry Valleys3—has demonstrated this strategy’svalue and shown how to augment it using images from
helicopters or remotely operatedvehicles.
In contrast, planetary geoscien-tists commonly work in the reverseorder: Given the time and distancesinvolved, flybys and orbital space-craft acquire the initial data fromindividual moons and planets. Insome cases, more detail might comelater through lander and roverdeployments, or—in the Moon’scase—through human explorers.These opposite approaches result ina huge difference in local analysisof the Earth and other planets.While Earth geoscientists canemploy 3D in situ strategies, mostplanetary geoscientists use static orinteractive 2D visualizations for
their analyses (see Figure 1b). Although these 2D visu-alizations are highly developed and often effective, fortasks involving subtle 3D spatial judgments, we expectthat interactive 3D visualizations will likely lead to amore complete understanding of the data—and insome cases to recognition of features missed altogeth-er in 2D visualizations.
Our goal is to enhance planetary geologists’ ability todo field work as effectively on other planets as they can
on Earth. We also want to enhance the exploration ofremote and potentially hazardous Earth environments,such as Antarctica. Guided by multiple questions aboutMars’s geological evolution, as well as by future missionobjectives, we’re developing the Advanced Visualiza-tion in Solar System Exploration and Research system.4
As Figure 1c shows, Adviser lets geologists virtually enterthe field by recreating remote sites using laser altime-try, camera, atmospheric, and other data. In develop-ing Adviser, we face the challenges of
■ developing algorithms that interactively render a rich3D environment that combines multiple large datasources;
■ building tools that aid geoscientists in their research;and
■ running formal usability studies to evaluate the sys-tem relative to alternative approaches.
Here we describe our system and present observationsbased on five case studies of its application.
System overviewOur prototype Adviser implementation operates in a
four-wall Cave using the model-view-controller designpattern to organize data, visualizations, and interac-tions. The Adviser system contains topography, cameradata, simulated data, and user annotation layers. Wevisualize the model using OpenGL and, in particular,the Real-Time Optimally Adaptive Meshes 2 (ROAM-2)5
to render topography and camera data interactively. In terms of performance, an 8,192 × 8,192 heightfield
renders at 80 stereo frames per second using an NvidiaGeForce 3000G graphics card. The heightfield can reg-ister multiple high-resolution inset camera images,although each inset incurs a frame-rate penalty. Theuser can toggle insets on and off to find a balancebetween information and frame rate. Geologists gener-ally display three inset images, with samples rangingfrom 1,000 × 1,000 to 15,000 × 14,000. The Cave pro-
The Adviser prototype systemmakes it possible for planetarygeologists to conduct virtualfield research on remoteenvironments such asAntarctica and Mars. AmongAdviser’s interactive tools aremission-planning andmeasurement tools that letresearchers generate new dataand gain interpretive insights.Five case studies illustrate thesystem’s applications andobserved benefits.
Andrew Forsberg, Prabhat, Graff Haley,Andrew Bragdon, Joseph Levy, Caleb I. Fassett,David Shean, and James W. Head III Brown University
Sarah MilkovichJet Propulsion Laboratory
Mark A. DuchaineauLawrence Livermore National Lab
Adviser: ImmersiveField Work forPlanetaryGeoscientists

duces an immersive effect that lets geologists feel likethey’re at the site; they achieve interaction—such as 3Dnavigation and point specification—using a trackedhandheld wand-like device. They also can use a TabletPC for 2D line and gestural input.
Typically, geologists create a session in the laboratory,using their target data elements, then access the sessionin the Cave. They can also create new data within theCave and store it in a networked database that they cansubsequently access from anywhere using a Web portal.
IEEE Computer Graphics and Applications 47
1 Different types of planetary geoscience analysis. a) Glacial geologist Dave Marchant analyzes sublimation till fabrics in the AntarcticDry Valleys. This local data will be integrated with regional air photos and satellite images to provide a broad view of the Mars-likeAntarctic glacial processes. b) Studying 2D maps of Martian topography and camera data. c) Virtually studying topography on Marswith Adviser.
Related WorkMany researchers are currently working on
geovisualization systems. Following are the systems most closely related to Adviser.
Desktop systemsNASA’s World Wind system (see http://worldwind.arc.
nasa.gov) lets users interactively explore a wide variety ofterrain and image data. Google Earth (see http://earth.google.com) lets users look at high-resolution images,annotated data, and 3D models of some structures. TheosgPlanet viewer (see http://www.ossim.org/tiki-read_article.php?articleId=3) can visualize large geospatial datasets and import GIS data via the Web Mapping Serverstandard (see http://portal.opengeospatial.org/files/?artifact_id=5316).
Immersive environmentsImmersive systems have been developed for a range of
specific tasks. Wright and colleagues developed a system forcreating and visualizing 3D terrain for the Mars Pathfindermissions.1 Powell and colleagues developed a data fusionand visualization system for rover data acquired duringMars exploration.2
Although both systems have proven useful forinvestigating topographical features within a small area,we’re interested in planetary-scale data visualization andexploration. In that respect, research focused on exploringlarge data sets 3,4 is closely related to our own. While all theimmersive systems provide excellent features, Adviserfocuses on tasks and tools specific to geological exploration.In addition to its immersive experience, Adviser offersresearch-oriented tools that let geologists do fieldworkinspired tasks.
Algorithms Our choice of terrain-rendering algorithm was guided by
several requirements:
■ strict real-time performance for large data sets,■ open-source code availability,■ ease of integration with our software, and■ utilization of the latest graphics hardware features.
While several excellent algorithms were potentialcandidates for integration—including GeometryClipmaps,5 Batched Dynamic Adaptive Meshes (BDAM),6
the Virtual Terrain Project’s Terrain Library (http://www.vterrain.org/Doc/vtlib.html), and chunked Level-of-Detail(LOD; http://tulrich.com/geekstuff/chunklod.html) wechose Real-Time Optimally Adaptive Meshes 2 (ROAM-2)because it provides interactive terrain rendering and view-frustum culling for large data sets. While high-performancetexture and terrain-paging extensions are also available, wehave yet to integrate them into our system.
References1. J.Wright, F. Hartman, and B. Cooper, “Immersive Environments for
Mission Operations: Beyond Mars Pathfinder,” Proc. Int’l Symp.Space Mission Operations and Ground Data Systems (SpaceOps98), The Space Operations Organization, 1998; http://www-dial.jpl.nasa.gov/~john/papers/SpaceOps98/SpaceOps98.pdf.
2. M. Powell et al., “Scientific Visualization for the Mars ExplorationRovers,” Proc. Int’l Conf. Robotics and Automation, Jet PropulsionLaboratory, NASA, 2005; http://hdl.handle.net/2014/37614.
3. L.E. Hitchner, “The NASA Ames Virtual Planetary Exploration Test-bed,” Proc. IEEE Wescon, vol. 36, IEEE Press, 1992, pp. 376-381.
4. D. Koller et al., “Virtual GIS: A Real-Time 3D Geographic Informa-tion System,” Proc. IEEE Visualization Conf., IEEE CS Press, 1995,pp. 94-100.
5. F. Losasso and H. Hoppe, “Geometry Clipmaps: Terrain Render-ing Using Nested Regular Grids,” Proc. ACM Siggraph, ACM Press,2004, pp. 769-776.
6. P. Cignoni et al., “BDAM—Batched Dynamic Adaptive Meshesfor High Performance Terrain Visualization,” Computer GraphicsForum, vol. 22, no. 3, 2003, pp. 505-514.
(a) (b) (c)

Case studiesResearchers are using Adviser to address multiple
science themes through specific applications. Casestudies 1 (general exploration) and 5 (wind visualiza-tion) support a wide variety of tasks. In contrast, casestudies 2, 3, and 4 support graduate-level research,and the researchers helped build them to suit their specific needs.
While we’ve included images here to offer a generalsense of what users see, these narrow-field-of-view,monoscopic images hardly capture the immersive expe-rience of using Adviser in a Cave. In such an environ-ment, the wide field of view and head-tracked stereoviewing greatly enhance the sense of being present and,in particular, of perceiving spatial relationships.
Case study 1: going virtually into the fieldOne of Adviser’s basic capabilities is that it lets users
freely explore a terrain in 3D. It is our belief that mov-ing through a 3D environment makes it easier to under-stand an environment’s intricacies than simply studyinga 2D map. Establishing 3D relationships among geolog-ic units and structures is particularly important whengeologists are reconstructing the geological history of aregion or planet. In this context, vantage point is partic-ularly important; the different perspectives obtainedwhen researchers constantly shift vantage points andreturn to previous ones are essential. During thisprocess, having a continuously available field toolkit letsresearchers make and record valuable, detailed mea-surements.
Currently, we’re using Adviser to explore 3D environ-ments for both research and education.
Research tool. Geoscientists have used Adviser toexplore Mars and make useful observations about itsfeatures in a context that would be difficult or impossi-ble to achieve with a nonimmersive 2D tool. UsingAdviser as a tool to help understand the evolution ofMars has let researchers accomplish several key tasks.They have, for example,
■ stood inside large craters on Mars and considered illu-mination conditions and solar insulation, and theirrole in the formation and preservation of the crater’sice deposits;6
■ assessed the polar layered deposits’ characteristicsand distribution, which let them make thickness andgeometry measurements to understand the planet’srecent climate history;7
■ planned and verified candidate rover traverses (orpaths) for a proposed NASA mission to explore theNorth Pole’s cap;8 and
■ assessed the general circulation of Martian atmos-phere in different areas and on different time scales.
In addition, researchers previewed the Antarctic DryValley field area by flying through a 3D reconstructionof its topography with overlaid camera data. This expe-rience helped field season candidates to train for geog-raphy, geology, and safety in this harsh and unforgivingregion. Finally, Adviser let researchers place data col-lected over multiple trips to the Antarctic Dry Valleyinto a much broader context, using the same frame ofreference that researchers developed in the field. Thishelped resolve many problems that emerged in thefield, but had proven insoluble without the contextAdviser provided.
Educational tool. Instructors have successfullyused Adviser in a range of classes, from introductory-level courses to graduate seminars. For example, in“Geological Sciences 5: Earth, Moon, and Mars,” morethan 100 students per year study Mars, choose an areaof it in which to pursue a specific scientific question orinvestigation, and then use Adviser to visit Mars andexplore their chosen region in immersive VR. Figure 2illustrates the difference between traditional classroomvisuals and those possible in the Adviser environment.Students uniformly report a positive and rewardingexperience that gave them new insights into the geolo-gy and topography of Mars and a better appreciation forits spatial relationships.
Discussion. The large class size and time con-straints meant that each student group had just 15 min-utes to learn Adviser’s user interface and complete theassignment. To minimize training time, we disabled allAdviser tools except for navigation. This seemed reason-able, as navigation controls appeared to be the primaryfunctional requirement for completing the assignment.However, we found that the constraint led students to
Exploring Geovisualization
48 July/August 2006
2 Two tools for teachinggeologicalsciences. Students (a) inthe classroomand (b) in theCave, usingAdviser to visitTharsis Monteson Mars.
(a) (b)

describe capabilities and tools they believed would havealso been valuable. Among the students’ requests weremaps for navigation, high-resolution overlays, and addi-tional visuals or tools for judging the size of features.From the research and exploration-planning perspec-tive, all participants had a uniformly positive experienceusing Adviser. One said, “It’s like going to a foreign coun-try rather than reading about it in a book!”
Case study 2: traverse planning for rovermissions
We’re currently collaborating with NASA scientistson the Palmer Quest mission’s concept development.Among other things, the mission plans involve landinga rover on Mars’s North Pole and studying the polar lay-ered deposits’ surface properties and structure. Select-ing candidate traverses in advance is vital in missionplanning, because path constraints (slope, distance, andso on) can be important in determining the mission’sscope. Traverse planning is a complex activity involvingclose interactions among multiple groups.
Facilitating collaboration. In our work, we tar-geted collaboration between engineers (who are inti-mately familiar with the rover design constraints) andgeologists (who are knowledgeable about the domainscience). These two parties’ design goals are often con-tradictory: the rover engineers generally prefer a traversethat navigates relatively flat terrain, whereas the geolo-gists might prefer a traverse over steep slopes in order toinvestigate deposit textures and layer outcroppings.
The Adviser system provides an integrated environ-ment in which the two groups can collaborate effective-
ly. For example, the system lets users input roughlysketched traverses with important waypoints. It thenoverlays the traverses on the 3D topography and pre-sents them in the context of the camera image overlays.Engineers can choose to evaluate a target variable (suchas slope) along the traverse, and can also provide somethresholds (such as a maximum slope of 30 degrees).The system then computes path segments that don’t sat-isfy the constraint and presents the information to usersin both the Cave environment (see Figure 3a) and on ahandheld Tablet PC device (see Figure 3b). Using sucha device, geologists can sketch new or modified paths(see Figure 3c); the system then updates the traverseand slope visualization (see Figure 3d).
Collaborators can now examine alternate routes to bypass problematic regions. We adapted the fluid inking system (www.cs.brown.edu/publications/techreports/reports/CS-05-10.html) to provide a nat-ural interface for editing 2D traverses. With it, users canzoom into a target area on the Tablet PC and simplysketch over problematic segments. Adviser reevaluatesthe slope function on the new path accordingly andimmediately presents the results in the immersive envi-ronment and the Tablet PC. The collaborators iterateuntil a traverse that satisfies the constraints is produced;they can then export the final traverse for more sophis-ticated analysis.
Discussion. Presenting traverse information in 2Dwith different overlays requires users to merge disparatesources of information. The typical 3D presentationmakes the traverses easier to comprehend, but is rarelydone in a collaborative mode. Because Adviser presents
IEEE Computer Graphics and Applications 49
3 Traverse planning. (a) Initial rough triangular traverse is visualized in the Cave by a line that snaps to the terrainand vertical bars that connect it to a graph of slope. (b) The Tablet PC’s view of the initial traverse. (c) The usersketches a new traverse, after which (d) the system updates the traverse and slope visualization.
(a) (b)
(c) (d)

traverses in the context of the 3D topography andimages, it noticeably enriches collaborator discussions.
In addition, geologists typically see topography withsubstantial vertical exaggerations (scale factors of 15 to30 are common). This is useful for enhancing importanttopographical features characterized largely by elevationchanges, but which are diminished when visualized overa vast area (similar to the way a nonplanar terrain appearsflat when viewed from an airplane). The rover engineers,however, need terrain presented proportionally so theycan make accurate visual judgments. Adviser’s ability topresent the data with and without exaggeration interac-tively enhances the analysis and mutual understandingbetween the scientists and engineers.
Finally, to remove problematic traverse segments, wedecided to use 2D stroke gestures on a Tablet PC, ratherthan marking a 3D path directly on the terrain. The 2Dinput device seemed much simpler, because it leveragedprecise line-drawing skills and would thus avoid occlu-sion and accuracy problems that users might encounterby drawing 2D lines in a 3D environment. We plan toevaluate this conjecture more formally in a user study.
Currently, Adviser computes a predetermined class offunctions, and we’re planning to incorporate functionexpressions from the MathPad2 system.9 Associating the3D and MathPad2 variables will present a UI challenge.
Case study 3: strike and dip measurementsOn Mars, the North Pole’s layered terrain is composed
of water ice and dust, and the individual layers’ thick-ness and brightness are keys to the planet’s recent cli-
mate record. In addition, the layer spac-ing and 3D configuration are importantfor understanding their emplacement andevolution. Do they represent a flat planewhen they’re emplaced? Or, are theywarped—either during formation (de-posited on rough terrain) or after due to post-emplacement deformation? Theterrain’s ice and dust layers are visualizedby combining data from two sources. TheMars Orbiter Camera offers high-resolu-tion images that reveal alternating dustand ice layers, while the Mars OrbiterLaser Altimeter topographic data lets uscalculate an individual layer’s thicknessand geometry.
Layer analysis. Recent work suggeststhat these ice and dust layers encode a dis-tinctive climate signal related to the sameorbital parameter variations—such asperiodic changes in obliquity and eccen-tricity—that cause the Earth’s ice ages.7
To analyze the geometry of this climaterecord’s individual layers, we’re usingstrike and dip measurements. Field geol-ogists use such measurements to describesubsurface layers’ orientation and struc-ture. The geologist typically identifiesmultiple, surface-exposed points alongthe same layer and then computes a best-
fit plane from the points. The intersection of this planewith the horizontal plane forms a line; the anglebetween this line and the North Pole is the strike andthe plane’s inclination is the dip. Taking multiple strikeand dip measurements along a layer can reveal whetherthe layer is flat or distorted beneath the surface.
As Figures 4a and 4b show, our group’s geologists useArcGIS (see http://www.esri. com/software/arcgis) toplace points along a layer on a desktop system. They cal-culate strike and dip value for a set of points. To aid pointplacement, ArcGIS presents a 2D topography colormap inconjunction with the camera image. Adviser presents thelayer data on a 3D terrain (see Figure 4c). Users canchange the gray-scale images’ contrast settings to enhancelayer details and use a wand to specify points in 3D. Asthe user places more points, Adviser displays and updatesthe best-fit plane, which is a rough approximation to thelocal layer structure. Adviser also presents standard strikeand dip representations (glyphs and numbers), whichusers can record in the virtual field notebook.
Discussion. Contrast enhancement is particularlyimportant for visualizing layers in the Cave as most pro-jector output quality lags behind conventional desktopdisplay capabilities. We compute reasonable default val-ues based on the mean and standard deviation of a cam-era image’s intensity distribution, and give userscontrols to selectively map the input gray-scale intensi-ties to the entire spectrum; this effectively enhances ourcurrent Cave projectors’ limited brightness and resolu-tion capabilities.
Exploring Geovisualization
50 July/August 2006
4 Analyzing layered geometry using strike and dip measurements. (a) A geologist uses adesktop ArcGIS system to take strike and dip measurements. (b) A close-up of the user-specified points on a layer, which show the layer’s ambiguous positioning with referenceto the cliff. (c) The same area as viewed stereoscopically by the user in the Cave immedi-ately resolves the confusion. (d) The geologist places multiple yellow points along theexposed layer and Adviser computes a green best-fitting plane (planar to the head-tracked user).
(a) (b)
(c) (d)

Another key operation is layer disambiguation.Without the topography information, a 2D layer viewcan be confusing and ambiguous. Such a view alsocomplicates users’ ability to establish the presence oflayers relative to topographic features. Presenting lay-ers on a 3D terrain helps disambiguate their structureand positioning.
Finally, users have commented that layer anomalieswere easier to detect in the Cave environment, and thatAdviser helped them select sites for strike and dip mea-surements with much greater confidence. Assumingfinite time and resources to conduct such measure-ments, the Cave system appears to be a better environ-ment than the 2D ArcGIS desktop for preselecting areaswith interesting layering.
In terms of future work, we want to improve how someinteractions are done in the Cave. For example, users canplace points on a layer precisely using a desktop system’smouse input device. However, Cave users sometimes findplacing points using the virtual laser pointer tiring andinefficient. We’re considering whether we can improvethis technique and whether a hybrid technique—using alaser pointer for rough positioning and a joystick for finepositioning—would be more effective.
Case study 4: angle measurements in AntarcticaOur group’s field geologists undertake research expe-
ditions to Antarctica’s Dry Valleys. The Dry Valleys’ geo-logical environment is a hyperarid cold polar desert; itsconditions resemble those on Mars more closely thanany other place on Earth.
Polygon analysis. In one field experiment, geolo-gists are studying contraction-crack polygon formationand how their structure varies along the debris-coveredglaciers.10 One of their operations measures anglesbetween intersecting polygon margins that indicate thepresence of a crack or trough. Because mobility con-straints limit the number of field observations possiblewhile in Antarctica, researchers follow field trips withdesktop-based analyses of image data, such as the Cam-bot image in Figure 5a. As Figure 5b shows, researcherstypically use Adobe Photoshop to mark points (indicat-ing polygons) on the high-resolution cambot imageswithout using topographic information. They thencompute the angle value between the polygon margins.Multiple measurements yield statistics that can pro-vide insight into the polygons’ spatial layout and relationships.
The Adviser system lets geologists perform the samemeasurements. Geologists can bring up high-resolutionCambot images on the topographic base and performcontrast enhancement to reveal the polygons (see Fig-ure 5c) . They can then use a wand to select points onthe polygon margins (see Figure 5d), yielding an anglevalue. To present overall statistics, Adviser bins the anglevalues and computes a histogram, which it can option-ally display on a Cave wall. Users can immediatelydownload the angle data created in the Cave in comma-separated-value format on a standard desktop comput-er; they can then further process the data in applicationssuch as MathWork’s Matlab or Microsoft Excel.
IEEE Computer Graphics and Applications 51
5 Studies of contraction-crack polygon formation inthe Mullins Valley, Antarctica. (a) Topography colormapand Cambot image in ArcGIS. (b) In Adobe Photoshop,researchers use blue points for angle measurement. (c)The data set presented in the Cave and (d) examples ofgroups of three user-specified yellow points that Advis-er uses in angle measurement calculations.
(a)
(b)
(c)
(d)
Discussion. Using Adviser in this context offers sev-eral benefits.
First, our field geologists find it easier to see the Cam-bot images’ glacial lobe structures in the Cave than onthe desktop systems; they’ve noted that subtle correla-tions between topography and camera data jump out tothe eye. For example, one user detected a new chevron-shaped trough pattern that he hadn’t seen before.
Second, users feel an enhanced sense of presence inthe Cave environment. For example, being in the immer-sive environment reminded one geologist of thoughtsand questions that had occurred to him during his fieldseason six months earlier. This is particularly significantbecause he’d already been looking at the same Cambotimages on the desktop for months following the Antarc-tica trip.
Third, the geologists said that the Dry Valleys’ light-ing variation was fascinating when they physically vis-ited the area, so we provided an interface that let theminteractively vary the time, day, and month to updatethe solar illumination. They found this extremely usefulin understanding solar insolation’s role in polygon andglacier development.
Finally, users reported that using Adviser helpedthem find new interesting places to take angle measure-ments. They also reported that after this experiencethey would like to conduct additional measurementswith their 2D tools in those new target areas. As withthe strike and dip measurements, however, there’s noobservable advantage to placing markers on the 3D ter-rain. In fact, using a 6 degree-of-freedom virtual laserpointer to specify points makes the process somewhatharder.
As for future work, our system’s current illuminationmodel uses an OpenGL diffuse Phong lighting model.Computing shadows would make the scene look morerealistic and help in gauging solar effects.
Case study 5: global climate model simulationsOur group is interested in studying Mars’s Tharsis
Montes region because it contains geologically recenttropical glaciers, emplaced when climatic conditionswere considerably different from today.11 Our ability tostudy and interpret this area is critical to determiningthe causes of the climate changes involved in formingtropical mountain glaciers. Key to this understanding isthe atmosphere’s behavior and general circulationunder these conditions.12 By visualizing the atmos-phere’s characteristics and evolution in the context ofthe surface geology, we should be able to gain theinsights necessary to understand how these tropicalmountain glaciers are formed.
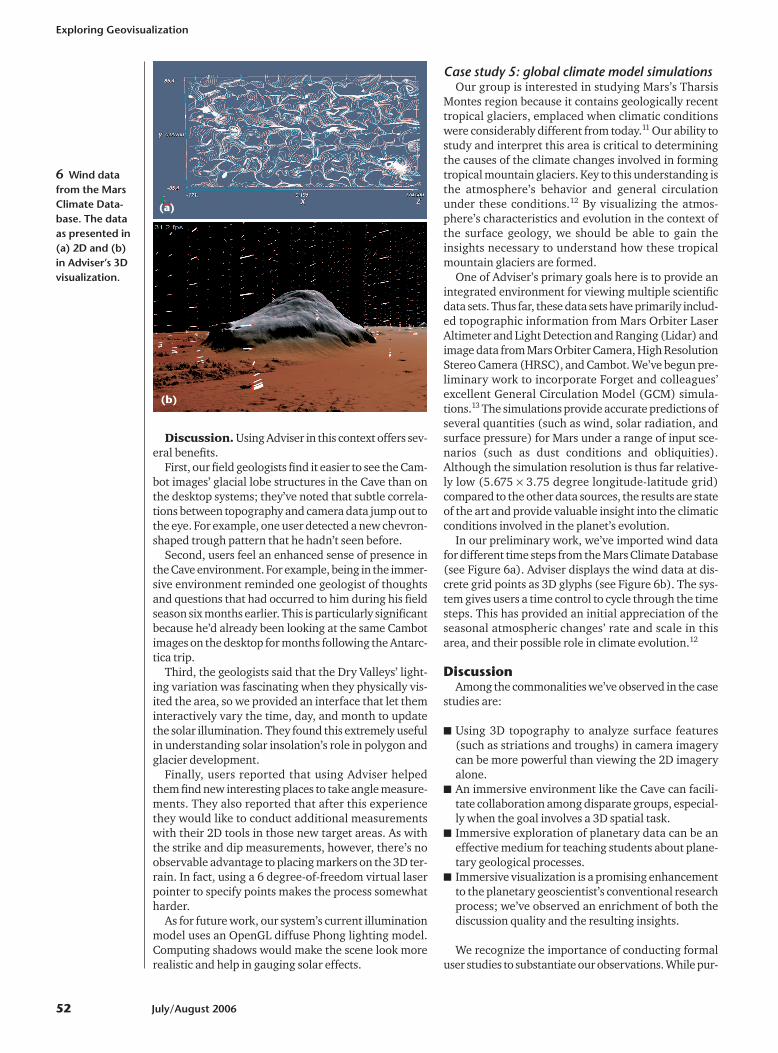
One of Adviser’s primary goals here is to provide anintegrated environment for viewing multiple scientificdata sets. Thus far, these data sets have primarily includ-ed topographic information from Mars Orbiter LaserAltimeter and Light Detection and Ranging (Lidar) andimage data from Mars Orbiter Camera, High ResolutionStereo Camera (HRSC), and Cambot. We’ve begun pre-liminary work to incorporate Forget and colleagues’excellent General Circulation Model (GCM) simula-tions.13 The simulations provide accurate predictions ofseveral quantities (such as wind, solar radiation, andsurface pressure) for Mars under a range of input sce-narios (such as dust conditions and obliquities).Although the simulation resolution is thus far relative-ly low (5.675 × 3.75 degree longitude-latitude grid)compared to the other data sources, the results are stateof the art and provide valuable insight into the climaticconditions involved in the planet’s evolution.
In our preliminary work, we’ve imported wind datafor different time steps from the Mars Climate Database(see Figure 6a). Adviser displays the wind data at dis-crete grid points as 3D glyphs (see Figure 6b). The sys-tem gives users a time control to cycle through the timesteps. This has provided an initial appreciation of theseasonal atmospheric changes’ rate and scale in thisarea, and their possible role in climate evolution.12
DiscussionAmong the commonalities we’ve observed in the case
studies are:
■ Using 3D topography to analyze surface features(such as striations and troughs) in camera imagerycan be more powerful than viewing the 2D imageryalone.
■ An immersive environment like the Cave can facili-tate collaboration among disparate groups, especial-ly when the goal involves a 3D spatial task.
■ Immersive exploration of planetary data can be aneffective medium for teaching students about plane-tary geological processes.
■ Immersive visualization is a promising enhancementto the planetary geoscientist’s conventional researchprocess; we’ve observed an enrichment of both thediscussion quality and the resulting insights.
We recognize the importance of conducting formaluser studies to substantiate our observations. While pur-
Exploring Geovisualization
52 July/August 2006
6 Wind datafrom the MarsClimate Data-base. The dataas presented in(a) 2D and (b)in Adviser’s 3Dvisualization.
(a)
(b)
suing such an evaluation in future works, we must over-come unique challenges. Some research tasks requiresubjects with specialized skills, such as geologists whohave significant field experience in Antarctica or who arestudying polar deposits on Mars. It might be possible tosimplify the tasks to increase our subject pool, but thiswould be at the expense of the domain-specific insightsthat geologists have reported from using Adviser.
ConclusionGeologists report that Adviser is more than just an
exciting and stimulating experience: it gives them aclearer understanding of the 3D terrains. It also helpsthem
■ make better spatial judgments,■ see details overlooked or underappreciated in 2D data
visualizations, and■ make quantitative measurements effectively.
Further, students report a considerably enhanced learn-ing experience from their Cave exploration expeditions.
In the future, we plan to extend Adviser to addition-al geology research tasks on Earth and Mars in serviceof the science themes. Additionally, we plan to:
■ formally evaluate the system’s mature components■ better integrate Adviser with the geologist’s existing
working environment, and■ support data sets on the order of terabytes.
We also plan to make Adviser’s capabilities available forwider use in the research community. ■
AcknowledgmentsWe thank NASA’s Applied Information Systems
Research Program (grant no. NNG05GA61G) and MarsData Analysis Program (grant no. NNG04GJ99G), andthe US National Science Foundation’s Office of Polar Pro-grams (grant no. 185850NGA) for supporting this work.Our work was also supported in part by the Departmentof Energy/Lawrence Livermore National Laboratoryresearch subcontract no. B527302. We thank Andriesvan Dam and Sam Fulcomer for their support, and Rose-mary Simpson for editorial feedback. Finally, we thankthe hundreds of students at Brown University who’veused the system and provided helpful advice.
References1. J.W. Head and L. Wilson, “Lava Fountain Heights at Pu’u
O’o, Kilauea, Hawaii: Indicators of Amount and Variationsof Exsolved Magma Volatiles,” J. Geophys. Res., vol. 92,1987, pp. 13715-13719.
2. J.W. Head and L. Wilson, “Deep Submarine PyroclasticEruptions: Theory and Predicted Landforms and Deposits,”J. Volcanology and Geothermal Research, vol. 121, 2003, pp.155-193.
3. D.R. Marchant and J.W. Head, “Equilibrium Landforms inthe Dry Valleys of Antarctica: Implications for Landscape
Evolution and Climate Change on Mars,” Lunar and Plan-etary Science 36, CD-ROM, abstract 1421, Lunar and Plan-etary Inst., 2005.
4. J. Head et al., “Adviser: Immersive Scientific VisualizationApplied to Mars Research and Exploration,” Photogram-metric Eng. & Remote Sensing, vol. 71, no. 10, 2005, pp.1219-1225.
5. L.M. Hwa, M.A. Duchaineau, and K.I. Joy, “Real-Time Opti-mal Adaptation for Planetary Geometry and Texture: 4-8Tile Hierarchies,” IEEE Trans. Visualization and Comp.Graphics, vol. 11, no. 4, 2005, pp. 355-368.
6. P. Russell, J.W. Head, and M.H. Hecht, “Evolution of IceDeposits in the Local Environment of Martian Circum-PolarCraters and Implications for Polar Cap History,” Lunar andPlanetary Science 35, CD-ROM, abstract 2007, Lunar andPlanetary Inst., 2004.
7. S.M. Milkovich and J.W. Head, “North Polar Cap of Mars:Polar Layered Deposit Characterization and Identificationof a Fundamental Climate Signal,” J. Geophys. Res., vol. 110,no. E01005, 2004, doi: 10.1029/2004JE002349, pp. 1-21.
8. F.D. Carsey et al., “Palmer Quest: A Feasible Nuclear Fis-sion ‘Vision Mission’ to the Mars Polar Caps, Lunar andPlanetary,” Lunar and Planetary Science 36, CD-ROM,abstract 1844, Lunar and Planetary Inst., 2005.
9. J. LaViola and R. Zeleznik, “”MathPad2: A System for theCreation and Exploration of Mathematical Sketches,” ACMTrans. Graphics, vol. 23, no. 3, 2004, pp. 432-440.
10. J. Levy, J. Head, and D. Marchant, “The Origin and Evolutionof Oriented-Network Polygonally Patterned Ground: TheAntarctic Dry Valleys as Mars Analogue,” Lunar and Plane-tary Science 36, CD-ROM, Lunar and Planetary Inst., 2005.
11. D.E. Shean, J.W. Head, and D.R. Marchant, “Origin and Evo-lution of a Cold-Based Tropical Mountain Glacier on Mars:The Pavonis Mons Fan-Shaped Deposit,” J. Geophys. Res.,vol. 110, no. E05001, 2005, doi:10.1029/2004JE002360.
12. F. Forget et al., “Formation of Glaciers on Mars by Atmos-pheric Precipitation at High Obliquity,” Science, vol. 311,no. 5759, 2006, pp. 368-371.
13. F. Forget et al., “Improved General Circulation Models ofthe Martian Atmosphere from the Surface to Above 80km,” J. Geophys. Res., vol. 104, no. E10, 1999, pp. 155-176.
Andrew Forsberg is a research sci-entist in the Brown University Graph-ics Group. His research interestsinclude 2D and 3D user interfaces, scientific visualization, and VR appli-cations. Forsberg has a master’sdegree in computer science fromBrown University. Contact him at
Prabhat is a staff member at BrownUniversity’s Center for Computationand Visualization. His research inter-ests include VR and scientific visual-ization. Prabhat has a B.Tech incomputer science and engineeringfrom the Indian Institute of Tech-nology, New Delhi, and an MS in com-
puter science from Brown University. Contact him atprabhat@cs. brown.edu.
IEEE Computer Graphics and Applications 53

Graff Haley graduated in May2006 with a BA in computer scienceand history from Brown University.Contact him at [email protected].
Andrew Bragdon is a researchassistant in the Brown UniversityGraphics Group. His research inter-ests include Adviser and its associatedsystems. Bragdon is an undergradu-ate student at Brown University incomputer science and economics.Contact him at Andrew_Bragdon@
brown.edu.
Joseph Levy is a PhD student in theDepartment of Geological Sciences’Planetary Geology group at BrownUniversity. His research interestsinclude using ice geomorphology as aclimate indicator on Earth and Mars,particularly through comparisonsbetween Earth-based field data and
remotely sensed data from Mars. Contact him [email protected].
Caleb I. Fassett is a PhD student ingeological sciences at Brown Universi-ty. His research interests include themodification of the Martian surfaceby water, especially early in its geolog-ical evolution. Fassett has an ScMfrom Brown University. Contact himat [email protected].
David Shean is a master’s studentin geology at Brown University. Hisresearch interests include climatechange, glacial geomorphology, andice dynamics on Mars and in Antarc-tica. Contact him at [email protected].
James W. Head III is the ScherckDistinguished Professor of GeologicalSciences at Brown University andchairs the geology discipline group forthe Discovery Messenger Mission toMercury. He is also a coinvestigatorfor the European Space Agency’s MarsExpress Mission. His research inter-
ests include processes that form and modify planetary sur-faces and interiors. Head has a PhD in geological sciencesfrom Brown University. Contact him at [email protected].
Sarah Milkovich is a post-doctor-al scholar at the Jet Propulsion Labo-ratory in Pasadena, California. Herresearch interests include the historyand stratigraphy of Martian polarregions, the planet’s surface geologywith regard to recent climate history,and the evolution of planetary sur-
faces. Milkovich has a PhD in planetary geology fromBrown University. Contact her at [email protected].
Mark A. Duchaineau is a comput-er scientist at Lawrence LivermoreNational Laboratory’s Center forApplied Scientific Computing. Hisresearch interests include real-time,multiple-resolution representationsand algorithms with applications tolarge-data modeling, analysis, com-
pression, and display. Duchaineau has a PhD in comput-er science from the University of California, Davis. Contacthim at [email protected].
For further information on this or any other computingtopic, please visit our Digital Library at http://www.computer.org/publications/dlib.
Exploring Geovisualization
54 July/August 2006
computer.org/e-News
Available
for FREE
to members.
Be alerted to
• articles and
special issues
• conference
news
• registration
deadlines
Sign Up Today for the IEEE
Computer Society’s
e-News
Sign Up Today for the IEEE
Computer Society’s
e-News