Advertising, Breadth of Ownership, and Liquiditygrullon/pub/RFS_2004.pdf2 Advertising, Breadth of...
35
Advertising, Breadth of Ownership, and Liquidity by Gustavo Grullon Rice University Jesse H. Jones Graduate School of Management 6100 Main Street Houston, Texas 77005-1892 Tel: (713) 348-6138 Fax: (713) 348-5251 [email protected] George Kanatas Rice University Tel: (713) 348-5383 Fax: (713) 348-5251 [email protected] and James P. Weston Rice University Tel: (713) 348-4480 Fax: (713) 348-5251 [email protected] Forthcoming in The Review of Financial Studies * We would like to thank Randy Batsell, Michael Brennan, Alex Butler, Wayne Ferson, Steve Foerster, Campbell Harvey (the editor), Gur Huberman, Pete Kyle, Erik Lie, Peter MacKay, Paul Sengmueller, and two anonymous referees for detailed comments as well as seminar participants at the 2003 American Finance Association meetings, Boston College, Duke University, Rice University, Southern Methodist University, and the 2002 Batten Conference at the College of William & Mary.
-
Upload
hoangkhuong -
Category
Documents
-
view
214 -
download
0
Transcript of Advertising, Breadth of Ownership, and Liquiditygrullon/pub/RFS_2004.pdf2 Advertising, Breadth of...

Advertising, Breadth of Ownership, and Liquidity
by
Gustavo Grullon Rice University
Jesse H. Jones Graduate School of Management 6100 Main Street
Houston, Texas 77005-1892 Tel: (713) 348-6138 Fax: (713) 348-5251 [email protected]
George Kanatas Rice University
Tel: (713) 348-5383 Fax: (713) 348-5251 [email protected]
and
James P. Weston
Rice University Tel: (713) 348-4480 Fax: (713) 348-5251 [email protected]
Forthcoming in The Review of Financial Studies
*We would like to thank Randy Batsell, Michael Brennan, Alex Butler, Wayne Ferson, Steve Foerster, Campbell Harvey (the editor), Gur Huberman, Pete Kyle, Erik Lie, Peter MacKay, Paul Sengmueller, and two anonymous referees for detailed comments as well as seminar participants at the 2003 American Finance Association meetings, Boston College, Duke University, Rice University, Southern Methodist University, and the 2002 Batten Conference at the College of William & Mary.

2
Advertising, Breadth of Ownership, and Liquidity
Abstract We provide empirical evidence that a firm’s overall visibility with investors, as measured
by its product market advertising, has important consequences for the stock market.
Specifically, we show that firms with greater advertising expenditures, ceteris paribus,
have a larger number of both individual and institutional investors, and better liquidity of
their common stock. Our findings are robust to a variety of methodological approaches
and to various measures of liquidity. These results suggest that investors’ degree of
familiarity with a firm affects its cost of capital and consequently its value.

3
1. Introduction
“Buy what you know,” advises Peter Lynch, the well-known former portfolio manager
of Fidelity’s Magellan Fund, while the celebrated investor Warren Buffet urges others to
buy “great brands.”1 Such comments may reflect the view of many investors, with
mounting evidence suggesting that people do indeed bias their portfolio investment
decisions in favor of the “familiar.”2 However, the documentation of such a bias leaves
unclear what effect, if any, it has on firms and on their common stock. This issue is the
focus of our study.
If investors buy a firm’s stock, at least in part because of their general familiarity
with the firm, we expect that this visibility among investors will generally lead to a larger
breadth of ownership of the firm’s stock. However, such investors would be relying on
information that is public (and not necessarily substantive), and as a result, such
purchases may be best characterized as uninformed trades and such investors as
uninformed traders. If greater visibility does indeed lead to a relative increase in
uninformed traders, then such an improvement in firm recognition would be expected to
have a beneficial impact on the stock’s liquidity.3 The aim of our paper is to test these
conjectures relating firm visibility to ownership breadth and stock market liquidity.
If investors favor more familiar firms, then we would expect some measure of
firm visibility to be related to this investment bias. We adopt firms’ product market
advertising expenditures as such a measure. As Bagwell writes in his survey of the
economics of advertising, “Consumers encounter advertising messages as they watch TV,
1 USA Today, June 30, 1998. 2 While there have been prior related studies (discussed below), Huberman (2001) is the first to explicitly tie investors’ “familiarity” with a company to their decisions to purchase its stock. 3 Most microstructure models view liquidity as an increasing function of the level of noise or uninformed trading relative to that of informed trading.
4
read magazines, listen to the radio, surf the internet, or simply walk down the street.”
(Bagwell [2001, page 1]). While such advertising is presumably aimed at increasing the
firm’s market share in the product market, at the minimum it should make the firm’s
name and products better known to both consumers and investors. Therefore, assessing a
firm’s visibility by its advertising expenditures has intuitive appeal and is in fact similar
to the practice of some marketing professionals of using advertising as a measure of a
product’s brand recognition. Brandweek’s list of “America’s Top Brands”, for example,
is constructed in this way. Therefore, with advertising as a good proxy for the overall
visibility of a firm, our results apply broadly to firms with national (or international)
brand identity.4
We test whether a firm’s product market advertising has a spillover effect on its
ownership structure and the liquidity of its common stock. While economists have long
debated the relative importance of the different ways in which advertising may affect
product market demand, there has been no apparent recognition, either by academic
researchers or business professionals, that the visibility that such advertising provides a
firm may have important effects in other markets (e.g., the stock market). Such an effect
need not be intentional --- in fact, the absence of any apparent general recognition of such
a spillover suggests that it is likely unintentional in most cases. However, in particular
cases, the nature of the firms’ advertising campaigns suggests that at least these
companies may be seeking recognition beyond the markets for their products. Generally,
such firms conduct advertising campaigns that leave their products, and often even the
nature of their businesses, unidentified. For example, BASF, a multinational chemical
firm engaged in business–to–business, advertises in consumer media and informs us only 4 Our study therefore complements and generalizes others, to be discussed, that document investors’ preference for geographic proximity.
5
that “We don’t make the products you buy --- we make the products you buy better.”
Another interesting example is NTT DoCoMo. This company has a full-page
advertisement in the September 1998 issue of the Economist asking readers: “Why is
NTT DoCoMo advertising in an American magazine?” Their answer: “Well, NTT
DoCoMo is the #1 Japanese mobile telecom company listed on the New York Stock
Exchange.”5
Such advertising is puzzling if one views it as meant to influence (solely) product
market demand. However, investors --- both individuals and institutions --- are exposed
to mass media and such advertising would at least make them aware of the firm. As
Merton (1987) notes, a potential investor must, at a minimum, know of a firm before
deciding whether to purchase its stock or even on whether to acquire additional
information.6
Our results indicate that firms that spend more on advertising, ceteris paribus,
have a larger number of both individual and institutional investors. Further, we find that
advertising has a stronger effect on individuals than institutions. This result is consistent
with recent evidence of a “home bias” among investors and suggests that advertising
helps to attract a disproportionate number of investors who, at least in part, make their
investment decisions based on familiarity rather than on more fundamental information.
As mentioned above, the public nature of advertising information suggests that the
investors attracted to a firm by such advertising are likely to be uninformed. If this
indeed is the case, we expect that greater advertising by a firm to decrease the adverse
selection costs, thereby improving market liquidity. Consistent with this prediction, we 5 Representatives of this company told us that the main objective of this advertising campaign is to attract new investors. 6 But note that even for these firms, we have no direct evidence that they are aware of any relation between advertising and the liquidity of their stocks.

6
do find a positive relation between advertising and stock market liquidity. Specifically,
we find that, ceteris paribus, firms that have greater advertising expenditures also have
common stocks with lower bid-ask spreads, smaller price impacts, and greater depth.
Our results on ownership complement those of other recent studies that imply that
investors are more likely to hold familiar stocks. For example, French and Poterba
(1991) document that investors overweight their portfolios with domestic stocks. Kadlec
and McConnell (1994) show that a firm’s listing on the NYSE, possibly making it better-
known to investors, is associated with an increase in the number of shareholders and with
a reduction in bid-ask spreads. Similarly, Foerster and Karolyi (2001) show that non-
U.S. firms that list on U.S. exchanges, possibly raising their visibility among investors,
realize abnormal returns around the listing period.7
Along a similar line, Coval and Moskowitz (1999, 2001) and Huberman (2001)
find that U.S. portfolio fund managers prefer investing in locally headquartered firms,
while Grinblatt and Keloharju (2001) find that investors in Finland prefer to invest in
local (familiar) companies. Furthermore, there is evidence that employees allocate a
large fraction of their retirement savings to their own company’s stock (see for example
Benartzi [2001]). The recurring theme in these studies is that investors apparently have a
home bias --- that is, as a preference for the familiar, as best characterized by Huberman
(2001). While we provide additional support for this bias, our paper’s main contribution
is that we show how these seemingly sub-optimal investor decisions can have a
significant effect on the firm and on the stock market.
7 Of course, we must be careful in attributing the observed effects solely to an increase in visibility. For example, the listing of a stock on a particular exchange may also involve other important elements, such as a difference in reporting requirements.

7
Our empirical study is also related to the basic idea in Merton (1987). Merton
develops a model that incorporates limited investor recognition of stocks and analyzes the
capital market equilibrium in this setting, including the implications for asset prices. He
shows that those firms that are relatively unfamiliar to investors should provide higher
expected stock market returns and exhibit lower liquidity. While our study does not
address the issue of expected returns, it does verify that more familiar stocks have larger
shareholder bases and better liquidity.
Our results also shed new light on the economics of advertising. For decades,
economists have studied how advertising conveys product market information [Stigler
(1961), Telser (1964), Nelson (1974), Bagwell and Ramey (1994), Grossman and Shapiro
(1984), Kihlstrom and Riordan (1984), and Milgrom and Roberts (1986)], how it creates
brand loyalty [Robinson (1933), and Tirole (1995)], and finally, how it serves as an input
in consumers’ utility functions [Stigler and Becker (1977), and Becker and Murphy
(1993)].8 These effects of advertising on the firm relate solely to product market
demand; therefore, our results propose a new unexplored capital market channel by
which product market advertising may affect firm value.
Finally, since a firm’s improved visibility may increase the breadth of its
ownership and improve the liquidity of its stock, it also may increase the firm’s value.
While our study does not present direct evidence on this issue, recent literature does
indeed identify a link between ownership or liquidity and value. For example, Benston
and Hagerman (1974), Amihud, Mendelson, and Uno (1999) and Chen, Hong, and Stein
(2002) find that firms may benefit from an increase in ownership breadth, while other
studies suggest that stock market liquidity may be positively priced in asset returns 8 For example, consumers may value the prestige attached to the purchase of a particular good that is highly advertised.

8
through a decrease in the cost of equity.9 Interestingly, our findings therefore suggest
that while the direct effect of advertising on profits is unclear --- see Bagwell (2001) ---
advertising may nevertheless increase shareholder value through this capital market
spillover effect.
The rest of the paper is organized as follows. The next section describes the
sample selection procedure, defines the variables, and provides summary statistics.
Section 3 examines the relation between advertising and breadth of ownership while
Section 4 examines the relation between advertising and several measures of stock
market liquidity. Section 5 checks the robustness of some of our results. Finally, Section
6 concludes with a discussion of the implications of our findings.
2. Sample Selection, Variable Definitions and Summary Statistics
2.1 Sample Selection
Our initial sample consists of all the companies that appear on the Industrial
COMPUSTAT files (Full-Coverage, Primary, Secondary, Tertiary, and Research Files)
for at least one year over the period 1993-1998. From this initial sample, we select those
firms that have available data on the Center for Research in Security Prices (CRSP) files
and the Trades and Quotes (TAQ) database. Since the focus of our paper is the effect of
firms’ advertising expenditures on breadth of ownership and stock liquidity, we include
only observations in our final sample that have data available (non-missing values) on
advertising expenditures. This filtering greatly reduces our sample size. However, we
cannot distinguish firms that do not report their advertising expenses from those that
simply have zero advertising. As a result, we report only our analysis of those firms that
9 See Amihud and Mendelson (1986), Reinganum (1990), Eleswarapu and Reinganum (1993), Brennan and Subrahmanyam (1995), Amihud, Mendelson, and Lauterbach (1997), Eleswarapu (1997), Brennan, Chordia, and Subrahmanyam (1998), and Easley, Hvidkjaer, and O'Hara (2002).

9
provide advertising expenses. However, all our results are found to be qualitatively
similar when we assume instead that all missing observations for advertising
expenditures are equal to zero.
To reduce the effect of outliers on the liquidity measures, we also exclude
observations that have an annual average turnover ratio greater than 500 percent and/or
an annual average quoted spread greater than $5. This process generates a final sample
of 5,776 firm-year observations over the period 1993-1999. Our sample starts in 1993,
the beginning of the TAQ database.
2.2 Variable Definitions
We obtain data on advertising expenditures (item # 45) from COMPUSTAT.
This variable is defined as the cost of advertising media (radio, television, newspapers,
periodicals, etc.) and promotional expenses. Data on total assets (item # 6), number of
shares outstanding (item # 25), share price (item # 24), operating income before
depreciation (item # 13), and number of common shareholders (item # 100) are also
obtained from COMPUSTAT. The market value of the equity is equal to the number of
shares outstanding multiplied by the share price. The return on assets is defined as the
operating income before depreciation scaled by total assets. The number of institutional
investors is collected from Compact Disclosure.10
Return volatility, firm age, average monthly stock return, average monthly share
volume, and share turnover are collected from CRSP. Return volatility is computed as
the standard deviation of daily returns over the year. Firm age is constructed as the
number of years the firm has existed on the CRSP database. Average monthly stock
return is the annual average of monthly stock returns. Average monthly share volume is 10 Anderson and Lee (1997) find this to be one of the most reliable sources of ownership information.

10
the annual average of monthly share volumes. Share turnover is the annual average of
total monthly trading volume divided by the number of shares outstanding.
Finally, quoted and relative bid-ask spreads, quoted depth, and relative price
impact are collected from the NYSE report of Trades and Quotes (TAQ) database. We
follow Weston (2000) in filtering the trade and quote data for errors.11 Average quoted
spreads for each stock-year are based on the difference between the inside ask and bid
price over all quotes on the firm’s primary exchange. Relative spreads are constructed as
the quoted spread divided by the midpoint of the bid and ask prices. Monthly spreads are
based on the equally weighted time-series average over all quotes for each firm-month.
Annual spreads are then based on the equally weighted time-series average over all
months. The quoted depth is constructed as the average number of shares quoted at the
inside bid and ask prices. We average this measure of the depth over all quotes on the
primary exchange for each stock-month.12 Annual figures are then constructed as the
average over all months in the year for each stock. The relative price impact measure,
tRelative Price Impact t tt
t
M M QM
τ+ −=
, (1)
is constructed as the percentage difference between the midpoint of the spread and the
midpoint of the spread that arises after the trade is executed, multiplied by a trade
indicator variable, Qt, which takes on values of 1 or –1 for buyer-initiated and seller-
11 This filtering process is very similar to the one develop by Huang and Stoll (1996). 12 It is important to note that the quoted depth on Nasdaq may be less informative than the quoted depth on the NYSE. This is due to the fact that the inside depth for Nasdaq stocks only represents the depth of the inside dealer, and not the aggregate market depth (as in NYSE or AMEX). Further, Nasdaq depth may have less variation due to the common practice of "auto-quoting" a depth 1,000 shares. While there is no reason to suspect any systematic bias from Nasdaq quoted depths, we replicate our results using quoted depth only for NYSE and Amex stocks and our results are robust and qualitatively similar.

11
initiated trades, respectively.13 The subscript τ is the time horizon after the trade is
executed. We estimate the price impact using a five-minute time horizon, recognizing
that our results are unlikely to be sensitive to the five-minute lag procedure since other
studies have found little difference in this measure when 5, 10, 15 or 30-minute lags are
used (see Huang and Stoll (1994) and Weston (2000)).
2.3 Summary Statistics
Panel A of Table 1 displays some descriptive statistics for our sample. A few
important points should be mentioned. First, the percentiles of the distribution of
advertising expenditures, firm age, market value, total assets, return on assets, average
monthly stock returns, and share price in this table show that our sample contains firms
having a wide range of characteristics. Second, this table also shows that there are
significant cross-sectional differences in the breadth of ownership and liquidity of the
sample firms. For example, the number of shareholders ranges from 100 (5th percentile)
to 42,000 (95th percentile) and the number of institutional investors ranges from 0 (5th
percentile) to 324 (95th percentile). Furthermore, the relative bid-ask spread ranges from
0.4 percent (5th percentile) to 13.7 percent (95th percentile) and the share turnover ranges
from 8.9 percent (5th percentile) to 182.6 percent (95th percentile). Comparing the means
and medians for many of our variables reveals the usual left-skewness found in cross-
sectional comparisons. As a result, we use log-transformations for most of the analysis
presented below.
Panel B of Table 1 presents a comparison of our sample firms with firms that
have missing values for advertising. Note that the firms in our sample have
approximately the same age, average monthly stock return, share price, and return 13 The trade indicator variable is constructed following the Lee and Ready (1991) algorithm with adjustments made for the Nasdaq market following Ellis, Michaely, and O’Hara (2000).

12
volatility as the firms with missing values for advertising. Interestingly, while the sample
firms have a larger market capitalization than the rest of the population, they are smaller
in terms of total assets.14 Overall, the evidence in Panel B suggests that even though we
include only firms that have available data on advertising expenditures, we have a
relatively unbiased sample from the population of COMPUSTAT firms.
3. The Effect of Advertising on the Breadth of Ownership
In this section, we examine if investors are more likely to buy stocks of
companies with high levels of advertising expenditures. We do this by testing whether
cross-sectional patterns in a firm’s advertising are related to the firm’s total number of
common shareholders and to the number of institutional owners. It is important to note
that we are using total advertising expenditures rather than a scaled measure such as the
ratio of advertising to sales or to assets because the various scaled measures do not gauge
the scope of advertising. For example, General Motors, one of the largest advertisers in
the United States, spent 3.7 billion dollars on advertising in 1998. While this amount
represented less than 3 percent of its sales, GM most likely gained considerable
recognition from its advertising campaign. On the other hand, Audible Inc. spent only
0.3 million dollars on advertising in 1998, but this amount represented more than 82% of
its sales. Since it is quite likely that an advertising campaign of 3.7 billion dollars will
reach a wider population of potential investors than an advertising campaign of 0.3
million dollars, we expect the dollar amount of advertising to be a better proxy for
investor visibility than the scaled measures.
3.1 Univariate Analysis
14 This is consistent with the view that advertising is an intangible asset.

13
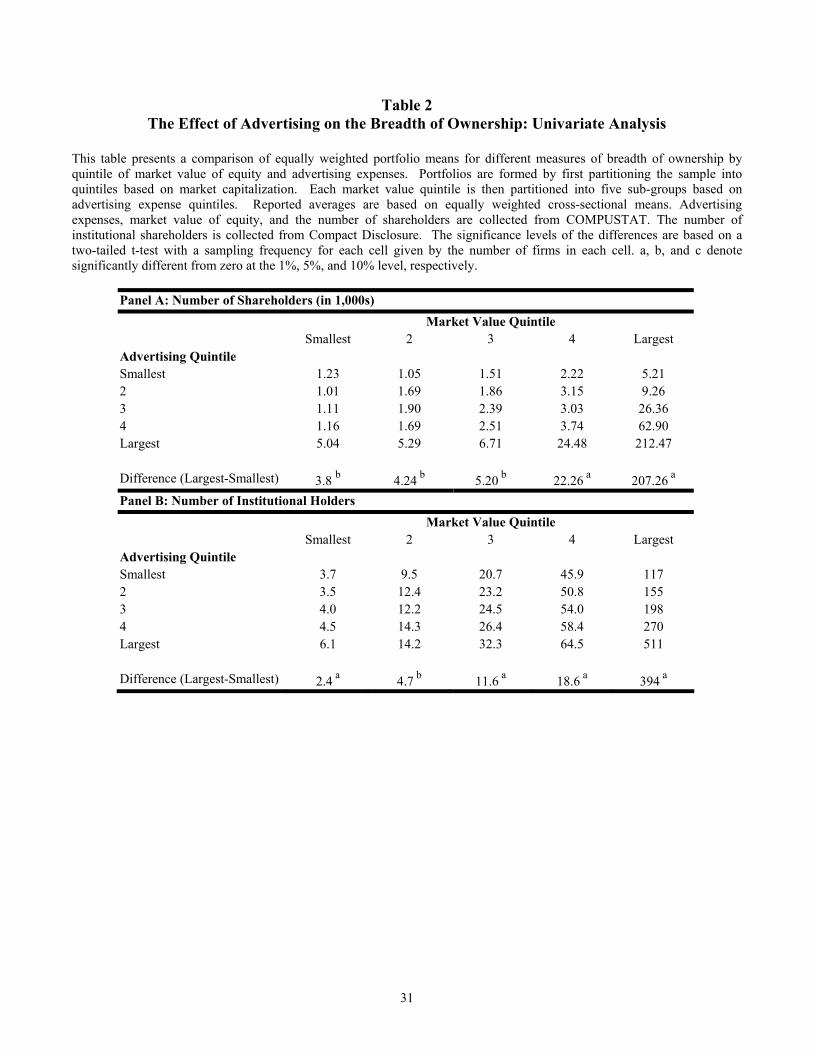
Table 2 presents a portfolio analysis of the relationship between advertising and
ownership breadth. In this analysis, we examine if the breadth of ownership increases
with advertising even after controlling for firm size. We form portfolios by first
partitioning the sample into quintiles based on market capitalization. Each market value
quintile is then partitioned into five sub-groups based on advertising expense quintiles.
Each cell in Table 2 represents the equally weighted portfolio mean of either the total
number of shareholders (Panel A) or the number of institutional owners (Panel B).
Panels A and B of Table 2 indicate that the larger the advertising expenditures,
controlling for size, the larger the total number of shareholders and the number of
institutional investors. Of particular interest is that the average number of shareholders
and institutional investors in the largest advertising quintiles is always greater than in the
smallest quintiles. These differences in means between the largest and smallest
advertising quintiles are economically and statistically significant in all the market value
quintiles. For the smallest market value quintile, Panel A (Panel B) shows that the
average difference in the number of shareholders (number of institutions) between the
firms in the largest and smallest advertising quintiles is approximately equal to 3,800
shareholders (2.4 institutions). For the largest market value quintile, Panel A (Panel B)
shows that the average difference in the number of shareholders (number of institutions)
between the firms in the largest and smallest advertising quintiles is approximately equal
to 207,260 shareholders (394 institutions). Since large firms tend to have much larger
advertising budgets than small firms do, it is not surprising that the relation between
advertising and breadth of ownership is stronger among large firms. Overall, the results

14
in Table 2 show that greater advertising does indeed relate to a larger shareholder base,
irrespective of firm size.15
3.2 Regression Analysis
In this sub-section we analyze in a multivariate regression framework the
contemporaneous relation between advertising expenditures and the number of
shareholders and institutions. To control for any confounding effects, we use a variety of
control variables in our multivariate regressions.
We expect the number of shareholders to be highly influenced by firm size
(capitalization). For example, not only are larger firms more likely to have greater analyst
coverage and more press coverage, they may simply have more shares available to buy.
Therefore, we include the market value of equity as a control variable to account for such
size effects.
Since transaction costs may motivate some investors to prefer stocks within
certain price ranges, we include the reciprocal of the share price as an additional control.
Also, more liquid stocks may be preferred by a larger group of investors and so we also
include share turnover. We also use return on assets (ROA) and stock price performance
(stock returns) as control variables since investors are likely to be attracted to firms that
are doing well.
Return volatility and firm age are employed as proxies for differences in total risk
across our sample. Finally, we include annual dummy variables to control for any
systematic change in our variables over time due to inflation or business cycle effects.
15 Note that the evidence in Table 2 suggests that the relationship between breadth of ownership and advertising may be non-linear. While there is no reason to suspect any bias from such a relation, we employ both log-transformations and fixed-effects estimation in our tests which mitigates the potential impact of outliers or non-linearity.

15
To reduce the potential impact of outliers and skewness in many of our control variables,
we use log transformations for all continuous variables.
It is important to note that many of our control variables may also proxy for
familiarity, visibility, or investor recognition. For example, large firms (size) that are
profitable (ROA), that have existed for a long time (age), and that are exchange listed
(NYSE dummy), are also likely to be better known to investors. Consequently, our tests
for the effect of advertising on shareholder breadth will bias our analysis against finding
any relation and understate advertising’s true economic effect.
Since we are using pooled cross-sectional time-series data in our estimations, the
assumptions of the OLS model are likely to be violated. Thus, we estimate two types of
panel data models to address this econometric issue. First, to address the concern that
observations from the same firm may not be independent, we estimate regressions
relating the intrafirm means of the dependent variable to the intrafirm means of the
independent variables. We label the estimates from this type of regression as “between-
firms” estimates. Second, to control for unknown firm-specific factors that may
influence the breadth of ownership or the liquidity, we estimate regressions that include
firm fixed-effects. We label the estimates from this type of regression as “within-firms”
estimates.
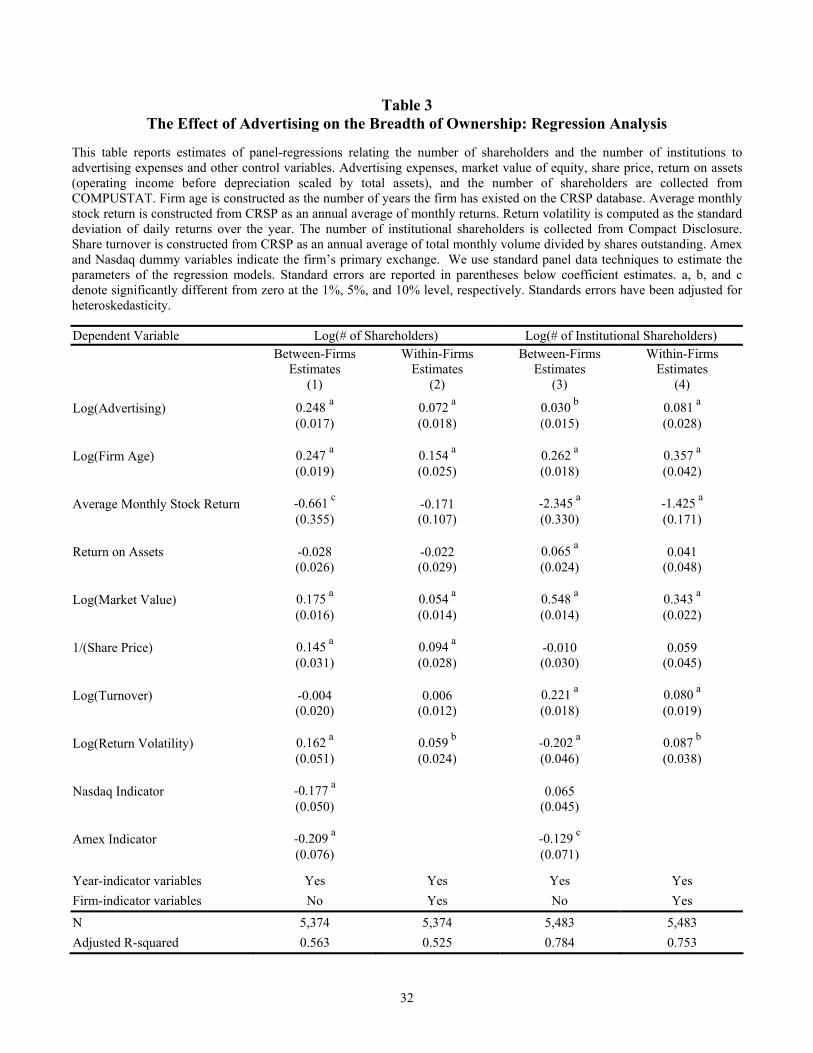
Table 3 presents the results from the multivariate analysis. Consistent with the
results in Table 2, we find a positive relation between advertising expenditures and both
the total number of shareholders and the number of institutional investors. The
coefficient of advertising expenditures is positive and significantly different from zero for
both types of panel data models.

16
These results are also economically significant. For example, an interpretation of
the coefficients on advertising expenditures from columns (1) and (3) of Table 3 suggests
that a change of one standard deviation in advertising expenditures would increase the
number of shareholders (institutions) by 98.7 percent (11.9 percent), independent of any
changes in firm size, profitability, trading activity, or risk. The fact that advertising has a
greater effect on common shareholders than on institutional investors suggests that
individual investors are more likely than professional investors to rely on such non-
financial criteria as familiarity to pick stocks.
We find some evidence that stock returns are negatively related to both the
number of common shareholders and the number of institutions investors. While this
result may seem counter-intuitive, the notion that poorly performing stocks have a larger
breadth of ownership, ceteris paribus, is consistent with recent evidence on the existence
of a “disposition effect” whereby investors hold past losers and sell past winners.16
4. The Effect of Advertising on Liquidity
In the previous section we show that top advertisers generally have a larger
number of both institutional investors and shareholders. These results suggest that
advertising attracts a disproportionate number of investors who make their investment
decisions based on familiarity rather than on more fundamental information. An
implication of this is that advertising may affect stock market liquidity through its effect
on the composition of traders. Thus, it is plausible that a firm’s advertising reduces
adverse selection costs by increasing the proportion of such uninformed traders in the
market for the firm’s stock. 16 Empirical evidence of the disposition effect (based on the prospect theory of Kahneman and Tversky (1979)) has been shown for experimental subjects (Camerer and Weber (1998)), individual investors (Odean (1998)), professional money managers (Shapira and Venezia (2001)) and even for professional futures traders (Locke and Mann (2001)).

17
Interestingly, such clustering is similar in spirit to the intertemporal clustering in
Admati and Pfleiderer (1988), where discretionary liquidity traders find it optimal in
equilibrium to strategically time their trades so as to hide among other uninformed
investors. In our setting, these liquidity traders could optimally and rationally cluster in
the cross-section (rather than inter-temporally). In these models, the uninformed know
they are uninformed. Our results may also be understood as uninformed investors
mistaking their knowledge of a firm --- because of its visibility --- with relevant
information. In other words, the uninformed may not realize they are uninformed. In this
case, they are clumping in high visibility stocks because those are the ones they are aware
of. Our empirical efforts obviously cannot distinguish between these theories, but in
either case there is an improvement in liquidity when more uninformed traders are in the
market.
Since several theoretical models argue that bid-ask spreads increase in the
presence of adverse selection costs (see, for example, Amihud and Mendelson (1986) and
Glosten and Milgrom (1985)), then we should expect bid-ask spreads to decline with
increases in advertising. Following the same reasoning, we should also expect the quoted
depth (relative price impact) to increase (decrease) with the level of advertising.
In this section, we investigate these predictions of the relation between advertising
expenditures, relative bid-ask spreads, quoted depth, and relative price impact. To check
the robustness of our results, we also examine in Section 5 the relation between
advertising expenditures and other liquidity measures.
4.1 Univariate Analysis
Table 4 presents a comparison by quintile of market value and advertising
expenses of equally weighted portfolio means for the relative spreads, quoted depth, and

18
relative price impact. Panel A shows that relative spreads (the cost per dollar invested)
decline with the level of advertising in all market value quintiles. The differences in the
average relative spread between the largest and smallest advertising quintiles are
economically and statistically significant.
Panel B in Table 4 shows that the quoted depth increases with advertising
expenses in all market value quintiles. Furthermore, Panel C shows that the relative price
impact declines with the level of advertising in the market value quintiles 4 and 5. In
general, the results in Table 4 show that the degree of adverse selection declines with our
measure of stock recognition.
4.2 Regression Analysis
In this sub-section, we analyze the relationship between advertising expenditures
and liquidity in a multivariate framework that controls for other factors that may affect
liquidity. We control for firm size with the market value of equity and the inverse of
share price. Since we expect stocks with a high trading activity to have lower spreads,
smaller price impact, and larger quoted depth, we include share turnover. We also
include return volatility and firm age to proxy for total risk. Finally, we include stock
exchange dummy variables to control for systematic market microstructure differences.
Table 5 presents results from the regressions relating relative spreads, quoted
depth, and relative price impact on advertising and other control variables. Consistent
with the results in the previous sub-section, we find that the relative spread and the
relative price impact are negatively correlated with advertising while the quoted depth is
positively correlated with advertising. All the coefficients on advertising expenditures
are significantly different from zero in all specifications.

19
As in the previous section, the results in Table 5 are economically significant.
The estimates of the coefficients on advertising in columns (1), (3), and (5) suggest that
an average firm that changes its advertising expenditures by one standard deviation
would experience a 4.5 percent decline in relative spreads, a 25.4 percent increase in the
quoted depth, and a 18.3 percent decline in the relative price impact, independent of any
changes in firm size, profitability, trading activity, or risk. Overall, the findings in this
section suggest that firms with greater advertising tend to have better stock liquidity.
5. Robustness
5. 1 Matched Sample Methodology
While the regression results presented above suggest a positive relation between
advertising expenses, breadth of ownership, and various measures of liquidity, these
results may be suspect if there is a nonlinear relation between ownership and our control
variables. That is, since the level of advertising expenses is highly correlated with firm
size, price, and volatility, it may be that this measure of investor recognition is simply a
proxy for some non-linearity in the relationship. To account for this potential
misspecification, we estimate the effect of advertising activity on breadth of ownership
and liquidity using a matched sample methodology. For each firm-year, we find another
firm-year in our sample that closely resembles that observation in price, size (market
value), and volatility (variance of returns).17
After matching the firms, we examine how the differences in advertising between
the sample and matching firms affect the differences in breadth of ownership and
liquidity between them. The advantage of this procedure is that we are comparing
observations in our sample that, ideally, differ only in their advertising expenses. As a 17 We also try alternative matching variables such as total assets, return on assets, average market return, and age, and the results are qualitatively the same.

20
result, inferences concerning differences in breadth of ownership and liquidity should be
independent of the functional relationship between these measures and size, price, or total
risk.
The results from this analysis (not reported) suggest that our results are not driven
by non-linearities. Consistent with our previous results, we find that more visible stocks
(measured by advertising) tend to have a wider shareholder base and better liquidity.
Further, the economic magnitude and statistical significance of our results from the
matched sample analysis are consistent with those from the regression analysis.
5.2 Alternative Specifications
To ensure that our results are truly due to advertising, we also examine the
sensitivity of the results reported in the previous sections to our choice of control
variables. Specifically, we re-estimate the regressions in Tables 3 and 5 using different
controls for size (total assets, total sales), balance sheet items (debt-to-equity ratio,
market-to-book ratio, lagged return on assets, dummy variable for firms that pay
dividends), and other factors (number of analysts following the stock, dummy variable
for firms that are part of the S&P 500 index, lagged stock returns). We find that our
previous results are not sensitive to these alternative specifications.
5.3 Controlling for the Status-Quo Bias
There is evidence that individuals tend to maintain their previous decisions
despite new information (see for example, Samuelson and Zeckhauser (1988), and
Hartman, Doane, and Woo (1991)). If investors also behave in a similar manner, they
may not change their position in a stock as frequently as they should. This suggests that
stocks may have a “core” shareholder base that in the short run is insensitive to factors
such as advertising expenditures, profitability, stock returns, etc. Given that we analyze

21
the contemporaneous relation between advertising and breadth of ownership, a status-quo
bias may raise econometric problems if this “core” shareholder base is spuriously
correlated with the level of advertising. However, since we find a positive and significant
relation between breadth of ownership and advertising in our fixed effect regressions
(which, theoretically, controls for any firm-specific heterogeneity like a status-quo bias),
we do not believe that the results in this paper are driven by a status-quo bias.
Nevertheless, to further investigate this issue, we also correct for the effects of a
status-quo bias by assuming that current levels of the dependent variable are also a
function of lagged dependent variables. The idea behind this specification is that if
investors tend to maintain their prior decisions, then the number of shareholders
(institutions) in the past should be a good predictor of the number of shareholders
(institutions) in the future. Although this seems to be a reasonable approach, including
lags of the dependent variable as regressors introduces further econometric
complications. To deal with these problems, we use methods developed by Anderson
and Hsiao (1981) and Arellano and Bond (1991) to estimate the parameters of a dynamic
panel regression model. Consistent with the results from fixed-effect analysis presented
in Table 3, we find (not reported) that changes in advertising are positively correlated
with changes in the number of shareholders and institutions. These results further
confirm that our findings are not driven by the status-quo bias.18
5.4 Alternative Measures of Liquidity
To ensure that our results regarding liquidity are not specific to our choice of
measures, we re-estimated the regressions in Table 5 using alternative estimates of
18 In addition to these tests, we test whether long-run percentage changes in advertising between 1993 and 1998 are determinants of ownership breadth and liquidity. The results from this analysis are also consistent with our main results.

22
liquidity. We replicated the analysis in Table 5 using the quoted spread, the effective
spread, the relative effective spread, the realized spread, and the relative realized spread.
The effective spread is equal to twice the difference of the transaction price and the
spread midpoint. Annual measures are computed in the same fashion as for relative
spreads. The relative effective spread is equal to the effective spread scaled by the
midpoint of the spread. The realized spread measures the revenue to the market maker
net of the price impact. The relative realized spread is equal to the realized spread scaled
by the quote midpoint.
Consistent with our previous results, we find that all these measures of liquidity
improve with the level of advertising. That is, firms that spend more money on
advertising, ceteris paribus, tend to have smaller quoted spreads, effective spreads,
relative effective spreads, realized spreads, and relative realized spreads.
The only measure of liquidity that appears to be only weakly correlated with
advertising expenditures is the turnover ratio. We do not find evidence that this variable
is positively correlated with advertising expenditures in the regression analysis.
However, we do find some evidence indicating that share turnover increases with
advertising expenditures in the matched-sample analysis. One potential reason for this
positive relation between advertising and turnover in the matched sample analysis but not
in the regression analysis is that the relation between these two variables may be non-
linear. Thus, even for the only measure of liquidity for which we have less supporting
evidence, we nevertheless find some evidence that it is positively correlated with
advertising expenditures.

23
While liquidity is certainly multidimensional, we find strong results for most
standard measures of liquidity, thereby confirming that our findings are not specific to
any particular measure.
6. Conclusion
There is mounting evidence that investors exhibit a home bias, tending to favor
investments in firms that are familiar to them either because of geographic proximity or
some other feature. Using a firm’s product market advertising as a measure of investors’
familiarity with the firm, we provide additional support for the existence of this bias.
Most importantly, however, we show that it has important implications for firms and for
the stock market. We document that greater product market advertising by firms is
associated with a larger shareholder base (for both total shareholders and institutions) and
with a significant improvement in the liquidity of their common stock. Our findings are
robust to a variety of methodological approaches and to various measures of liquidity ---
regardless of how we conduct the analysis, our qualitative results remain unchanged.
These results suggest a new capital market channel by which advertising may affect firm
value.
Our results, perhaps surprisingly, are quite strong. The simple, public information
that is conveyed by product market advertisements appears to be very important in
investor decisions. Of course, investors must at a minimum be aware of a firm before it
can be considered as a potential investment; a firm’s advertising, even if it accomplished
nothing else, would at least make people aware of its existence.19 In addition, if such
advertising actually promotes the sale of the firm’s products to new consumers, it may
also affect the demand for its stock. Investors may feel more confident in their ability to 19 Viewing advertising in this way, as simply informing investors, relates our analysis to that of Merton (1987). Of course, one wonders how such public information can be informative.

24
identify a firm as a good investment the more they know of the firm and of its business,
as Peter Lynch suggests. The “Beardstown Ladies,” one of the well-publicized
investment clubs, claims to “buy what it knows.” For example, the club members said
that they bought Hershey stock after having tasted the company’s products.20 If we view
such investors as gaining no private information from advertising, we can readily
understand the improvement in stock market liquidity. A firm’s advertising may attract
uninformed investors to its stock, resulting in a reduction in adverse selection costs and a
consequent increase in the liquidity of its common stock. The Beardstown Ladies most
likely had heard of Hershey’s, but decided to invest in the company only after being
convinced to sample one of its products. In this case, Hershey’s advertising campaign
may have motivated the sale of its product and subsequently also the purchase of its
stock.
20 New York Times, March 2, 1995.

25
References
Admati, A. and Pfleiderer, P., 1988, “A Theory of Intraday Patterns: Volume and Price Variability,” The Review of Financial Studies 1, 3-40. Anderson, T. W., and Hsiao, C., 1981, “Estimation of Dynamic Models with Error Components,” Journal of the American Statistical Association 76, 598-606. Anderson, R.C., and Lee, D.S., 1997, “Ownership Studies: The Data Source Does Matter,” Journal of Financial and Quantitative Analysis 32, 311-329. Amihud, Y., and Mendelson, H., 1986, “Asset pricing and the bid-ask spread,” Journal of Financial Economics 17, 223-249. Amihud, Y. and Mendelson, H., 1989, “The effects of beta, bid-ask spread, residual risk, and size on stock returns,” Journal of Finance 44, 479-486. Amihud, Y., Mendelson, H., and Lauterbach, B., 1997, “Market Microstructure and Securities Values: Evidence from Tel Aviv Stock Exchange” Journal of Financial Economics 45, 365-390. Amihud, Y., Mendelson, H., and Uno, J., 1999, “Number of Shareholders and Stock Prices: Evidence from Japan,” Journal of Finance 54, 1169-1184. Arellano, M., and Bond, S., 1991, “Some Tests of Specification for Panel Data: Monte Carlo Evidence and an Application to Employment Equations,” Review of Economic Studies 58, 277-297. Bagwell, K., 2001, “The Economic Analysis of Advertising,” in The Economics of Advertising, K. Bagwell (ed.), Edward Elgar Press, Cheltenham, UK. Bagwell, K. and Ramey, G., 1994, “Advertising and Coordination,” The Review of Economic Studies 61, 153-171. Becker, G. and Murphy, K., 1993, “A Simple Theory of Advertising as a Good or a Bad,” Quarterly Journal of Economics 108, 941-64. Benartzi, S., 2001, “Excessive Extrapolation and the Allocation of 401(k) Accounts to Company Stock?” Journal of Finance 56, 1747-1764. Benston, G. J., and Hagerman, R. L., “Determinants of Bid-Ask Spreads in the Over-the-Counter Market,” Journal of Financial Economics 1, 353-364.

26
Brennan, M. J., Chordia, T., and Subrahmanyam, A., 1998, “Alternative factor specifications, security characteristics, and the cross-section of expected stock returns,” Journal of Financial Economics 49, 354-373. Brennan, M. J., and Subrahmanyam, A., 1995, “Market Microstructure and Asset Pricing: On the Compensation for Illiquidity in Stock Returns,” Journal of Financial Economics 41, 441-64. Camerer, C. F. and Weber, M., 1998, “The Disposition Effect in Securities Trading: An Experimental Analysis,” Journal of Economic Behavior and Organization 33, 167-84. Chen J., Hong H.G., Stein, J.C, 2002, “Breadth of Ownership and Stock Returns,” Journal of Financial Economics, forthcoming. Coval, J.D., and Moskowitz. T.J., 1999, “Home Bias at Home: Local Equity Preference in Domestic Portfolios,” Journal of Finance 54, 2045-73.
Coval, J.D., and Moskowitz. T.J., 2001, “The Geography of Investment: Informed Trading and Asset Prices,” Journal of Political Economy 109, 811-41. Easley, D., Hvidkjaer, S., and O'Hara, M., 2002, “Is Information Risk a Determinant of Asset Returns?” Journal of Finance, forthcoming. Eleswarapu, V. R., 1997, “Cost of Transacting and Expected Returns in the Nasdaq Market,” Journal of Finance 52, 2113-27. Eleswarapu, V. R., and Reinganum, M. R., 1993, “The seasonal behavior of the liquidity premium in asset pricing,” Journal of Financial Economics 34, 373-86. Ellis, K., Michaely, R., and O’Hara, M., 2000, “The Accuracy of Trade Classification Rules: Evidence from Nasdaq,” Journal of Financial and Quantitative Analysis 35, 529-551. Foerster, S.R. and Karolyi, G.A., 2001, “The Effects of Market Segmentation and Investor Recognition on Asset Prices: Evidence from Foreign Stocks Listing in the U.S.,” Journal of Finance, forthcoming. French, K. R. and Poterba, J. M., 1991, “Investor Diversification and International Equity Markets,” American Economic Review 81, 222-26.
Glosten, L. R., and Milgrom, R., 1985, “Bid, ask, and transaction prices in a specialist market with heterogeneously informed traders,” Journal of Financial Economics 14, 71-100. Grossman, G.M. and Shapiro, C., 1984, “Informative Advertising with Differentiated Products,” Review of Economic Studies 51, 63-81.

27
Grinblatt, M. and Keloharju, M, 2001, “How Distance, Language, and Culture Influence Stockholdings and Trades,” Journal of Finance 56, 1053-73. Hartman, R., Doane, M., and Woo, C., 1991, “Consumer Rationality and the Status Quo,” Quarterly Journal of Economics 106, 141-162. Huang, R.D., and Stoll, H. R., 1994, “Market Microstructure and Stock Return Predictions,” The Review of Financial Studies 7, 179-213. Huang, R.D., and Stoll, H. R., 1996, “Dealer versus Auction Markets: A Paired Comparison of Execution Costs on NASDAQ and the NYSE,” Journal of Financial Economics 41, 313-57. Huberman, G., 2001, “Familarity Breeds Investment,” The Review of Financial Studies 14, 659-680. Kahneman, D., and Tversky, A., 1979, “Prospect Theory: An Analysis of Decision under Risk,” Econometrica 47, 263-91. Kadlec, G.B. and McConnell, J.J., 1994, “The Effect of Market Segmentation and Illiquidity on Asset Prices: Evidence from Exchange Listings,” Journal of Finance 51, 11-35. Kihlstrom, R. E., and Riordan, M.H., 1984, “Advertising as a Signal,” Journal of Political Economy 92, 427-450. Kyle, A.S, 1985, “Continuous Auctions and Insider Trading,” Econometrica 53, 1315-35. Lee, C., and Ready, M., 1991, “Inferring Trade Direction from Intraday Data,” Journal of Finance 46, 733-746. Locke, P. R., and Mann, S. C., 2001, “Do Professional Traders Exhibit Loss Realization Aversion?” Working Paper, Texas Christian University. Merton, R.C., 1987, “A Simple Model of Capital Market Equilibrium with Incomplete Information,” Journal of Finance 42, 483-510. Milgrom, P. and Roberts, J., 1986, “Price and Advertising Signals of Product Quality,” Journal of Political Economy 94, 796-821. Nelson, P., 1974, “Advertising as Information,” Journal of Political Economy 82, 729-54. Odean, T., 1998, “Are Investors Reluctant to Realize Their Losses?” Journal of Finance 53, 1775-98. O’Hara, M., 1995, Market Microstructure Theory, Oxford: Basil Blackwell, Ltd.

28
Reinganum, M. R., 1990, “Market microstructure and asset pricing: an empirical investigation of NYSE and Nasdaq securities,” Journal of Financial Economics 28, 127-47.
Robinson, J., 1933, “The Economics of Imperfect Competition,” London: Macmillan. Samuelson, W., and Zeckhauser, R., 1988, “Status Quo Bias in Decision Making” Journal of Risk and Uncertainty 1, 7-59. Shapira, Z. and Venezia, I., 2001, “Patterns of Behavior of Professionally Managed and Independent Investors,” Journal of Banking and Finance 25, 1573-87. Stoll, H.R., 2000, “Friction,” Journal of Finance 55, 1479-1514. Stigler, G.J, 1961, “The Economics of Information,” Journal of Political Economy 69, 213-25. Stigler, G. and Becker, G., 1977, “De Gustibus Non Est Disputandum,” The American Economic Review 67, 76-90. Telser, L., 1964, “Advertising and Competition,” Journal of Political Economy 72, 537-62. Tirole, J., 1995, The Theory of Industrial Organization, MIT Press, Cambridge Mass.
Weston, J.P., 2000, “Competition on the Nasdaq and the impact of recent market reforms,” Journal of Finance 55, 2565-98.

29
Table 1 Summary Statistics
This table reports summary statistics for our sample firms. To be included in the sample, the observation must satisfy the following criteria: the firm’s financial data is available on the Industrial COMPUSTAT files, the Center for Research in Security Prices (CRSP) files, and the Trades and Quotes (TAQ) database; the firm has data available (non-missing values) on advertising expenditures; the firm has an annual average turnover ratio of less than 500 percent and an annual average quoted spread of less than $5. Advertising expenses, market value of equity, total assets, share price, return on assets (operating income before depreciation scaled by total assets), and the number of shareholders are collected from COMPUSTAT. Firm age is constructed as the number of years the firm has existed on the CRSP database. Average monthly stock return is constructed from CRSP as an annual average of monthly returns. Return volatility is computed as the standard deviation of daily returns over the year. The number of institutional shareholders is collected from Compact Disclosure. Share turnover is constructed from CRSP as an annual average of total monthly volume divided by shares outstanding. Average monthly share volume is constructed from CRSP as the annual average of monthly share volumes. Relative and quoted bid–ask spreads are collected from the TAQ database. Quoted depth is constructed from TAQ as the average number of shares quoted at the inside bid and ask prices. Relative price impact is constructed from TAQ as the percentage difference between the midpoint of the spread and the midpoint of the spread that arises after a trade is executed, multiplied by a trade indicator variable, Qt, which takes on values of 1 or –1 for buyer-initiated and seller-initiated trades, respectively.
Panel A: Sample Description Firm Characteristics Mean Std. Dev. 5th Percentile Median 95th Percentile N Obs. Advertising Expenses (Million $) 71.79 285.3 0.07 3.27 337.6 5,776 Firm Age (Years) 10.91 8.93 1 8 27 5,776 Market Value of Equity (Million $) 1,953 9,067 7 105 7,441 5,776 Total Assets (Million $) 2,592 14,005 6 118 10,464 5,776 Return on Assets 0.057 0.463 -0.38 0.119 0.292 5,765 Average Monthly Stock Return 0.009 0.056 -0.073 0.009 0.094 5,776 Share Price ($) 18.53 21.06 1.38 11.88 56.79 5,776 Return Volatility 0.043 0.031 0.014 0.036 0.097 5,776 Breadth of Ownership Number of Shareholders (1,000s) 15.61 105.1 0.1 1.34 42 5,497 Number of Institutional Shareholders 70.11 130.42 0 23 324 5,608 Liquidity Measures
Quoted Bid-Ask Spread 0.318 0.28 0.104 0.229 0.716 5,776Relative Bid-Ask Spread 0.044 0.053 0.004 0.027 0.137 5,776Quoted Depth (100s) 29.58 51.11 5.59 10.57 110.46 5,685Relative Price Impact (%) 0.157 0.174 0.026 0.114 0.463 5,495Share Turnover 67.01 57.71 8.87 50.39 182.59 5,654Average Monthly Share Volume (Millions of Shares) 3.561 11.4 0.031
0.582 15.326 5,776

30
Table 1 (Continued)
Panel B: Comparison of the Sample Firms with Firms with Missing Values for Advertising
Sample Firms Firms with
Missing Values for Advertising Firm Characteristics Mean Median N Obs. Mean Median N Obs. Advertising Expenses (Million $) 71.79 3.27 5,776 - - - Firm Age (Years) 10.91 8 5,776 10.69 8 28,608 Market Value of Equity (Million $) 1,953 105 5,776 968 103 28,608 Total Assets (Million $) 2,592 118 5,776 3,155 161 26,633 Return on Assets 0.057 0.119 5,765 0.022 0.089 26,220 Average Monthly Stock Return 0.009 0.009 5,776 0.010 0.012 28,608 Share Price ($) 18.53 11.88 5,776 18.16 13.57 28,608 Return Volatility 0.043 0.036 5,776 0.042 0.033 28,608 Breadth of Ownership
Number of Shareholders (1,000s) 15.61 1.34 5,497 10.55 1.34 22,596Number of Institutional Shareholders 70.11 23 5,608 50.88 19 27,940
Liquidity Measures
Quoted Bid-Ask Spread 0.318 0.229 5,776 0.362 0.239 28,608Relative Bid-Ask Spread 0.044 0.027 5,776 0.045 0.027 28,608Quoted Depth (100s of Shares) 29.58 10.57 5,685 28.07 10.36 28,138Share Turnover 67.01 50.39 5,654 58.25 43.17 28,163Average Monthly Share Volume (Millions of Shares) 3.561 0.582 5,776
2.023 0.447 28,608
31
Table 2 The Effect of Advertising on the Breadth of Ownership: Univariate Analysis
This table presents a comparison of equally weighted portfolio means for different measures of breadth of ownership by quintile of market value of equity and advertising expenses. Portfolios are formed by first partitioning the sample into quintiles based on market capitalization. Each market value quintile is then partitioned into five sub-groups based on advertising expense quintiles. Reported averages are based on equally weighted cross-sectional means. Advertising expenses, market value of equity, and the number of shareholders are collected from COMPUSTAT. The number of institutional shareholders is collected from Compact Disclosure. The significance levels of the differences are based on a two-tailed t-test with a sampling frequency for each cell given by the number of firms in each cell. a, b, and c denote significantly different from zero at the 1%, 5%, and 10% level, respectively.
Panel A: Number of Shareholders (in 1,000s) Market Value Quintile Smallest 2 3 4 Largest Advertising Quintile Smallest 1.23 1.05 1.51 2.22 5.21 2 1.01 1.69 1.86 3.15 9.26 3 1.11 1.90 2.39 3.03 26.36 4 1.16 1.69 2.51 3.74 62.90 Largest 5.04 5.29 6.71 24.48 212.47 Difference (Largest-Smallest) 3.8 b 4.24 b 5.20 b 22.26 a 207.26 a Panel B: Number of Institutional Holders Market Value Quintile Smallest 2 3 4 Largest Advertising Quintile Smallest 3.7 9.5 20.7 45.9 117 2 3.5 12.4 23.2 50.8 155 3 4.0 12.2 24.5 54.0 198 4 4.5 14.3 26.4 58.4 270 Largest 6.1 14.2 32.3 64.5 511 Difference (Largest-Smallest) 2.4 a 4.7 b 11.6 a 18.6 a 394 a
32
Table 3 The Effect of Advertising on the Breadth of Ownership: Regression Analysis
This table reports estimates of panel-regressions relating the number of shareholders and the number of institutions to advertising expenses and other control variables. Advertising expenses, market value of equity, share price, return on assets (operating income before depreciation scaled by total assets), and the number of shareholders are collected from COMPUSTAT. Firm age is constructed as the number of years the firm has existed on the CRSP database. Average monthly stock return is constructed from CRSP as an annual average of monthly returns. Return volatility is computed as the standard deviation of daily returns over the year. The number of institutional shareholders is collected from Compact Disclosure. Share turnover is constructed from CRSP as an annual average of total monthly volume divided by shares outstanding. Amex and Nasdaq dummy variables indicate the firm’s primary exchange. We use standard panel data techniques to estimate the parameters of the regression models. Standard errors are reported in parentheses below coefficient estimates. a, b, and c denote significantly different from zero at the 1%, 5%, and 10% level, respectively. Standards errors have been adjusted for heteroskedasticity. Dependent Variable Log(# of Shareholders) Log(# of Institutional Shareholders)
Between-Firms Estimates
(1)
Within-Firms Estimates
(2)
Between-Firms Estimates
(3)
Within-Firms Estimates
(4)
Log(Advertising) 0.248 a 0.072 a 0.030 b 0.081 a (0.017) (0.018) (0.015) (0.028)
Log(Firm Age) 0.247 a 0.154 a 0.262 a 0.357 a (0.019) (0.025) (0.018) (0.042)
Average Monthly Stock Return -0.661 c -0.171 -2.345 a -1.425 a
(0.355) (0.107) (0.330) (0.171)
Return on Assets -0.028 -0.022 0.065 a 0.041 (0.026) (0.029) (0.024) (0.048)
Log(Market Value) 0.175 a 0.054 a 0.548 a 0.343 a (0.016) (0.014) (0.014) (0.022)
1/(Share Price) 0.145 a 0.094 a -0.010 0.059 (0.031) (0.028) (0.030) (0.045)
Log(Turnover) -0.004 0.006 0.221 a 0.080 a (0.020) (0.012) (0.018) (0.019)
Log(Return Volatility) 0.162 a 0.059 b -0.202 a 0.087 b (0.051) (0.024) (0.046) (0.038)
Nasdaq Indicator -0.177 a 0.065 (0.050) (0.045)
Amex Indicator -0.209 a -0.129 c (0.076) (0.071) Year-indicator variables Yes Yes Yes Yes Firm-indicator variables No Yes No Yes
N 5,374 5,374 5,483 5,483 Adjusted R-squared 0.563 0.525 0.784 0.753

33
Table 4 The Effect of Advertising on Liquidity: Univariate Analysis
This table presents a comparison of equally weighted portfolio means for different measures of liquidity by quintile of market value of equity and advertising expenses. Portfolios are formed by first partitioning the sample into quintiles based on market capitalization. Each market value quintile is then partitioned into five sub-groups based on advertising expense quintiles. Reported averages are based on equally weighted cross-sectional means. Advertising expenses and market value of equity are collected from COMPUSTAT. Relative bid–ask spreads are collected from the TAQ database. Quoted depth is constructed from TAQ as the average number of shares quoted at the inside bid and ask prices. Relative price impact is constructed from TAQ as the percentage difference between the midpoint of the spread and the midpoint of the spread that arises after a trade is executed multiplied by a trade indicator variable, Qt, which takes on values of 1 or –1 for buyer-initiated and seller-initiated trades, respectively. The significance levels of the differences are based on a two-tailed t-test with a sampling frequency for each cell given by the number of distinct firms in each cell. a, b, and c denote significantly different from zero at the 1%, 5%, and 10% level, respectively.
Panel A: Relative Bid-Ask Spreads (%) Market Value Quintile Smallest 2 3 4 Largest Advertising Quintile Smallest 12.56 5.85 3.62 2.01 0.88 2 11.13 5.52 3.34 1.79 0.70 3 10.34 5.52 3.32 1.65 0.58 4 10.97 4.86 3.25 1.58 0.48 Largest 9.21 4.59 2.80 1.26 0.35 Difference (Largest-Smallest) -3.35 a -1.26 a -0.82 a -0.75 a -0.53 a Panel B: Quoted Depth (100s of Shares) Market Value Quintile Smallest 2 3 4 Largest Advertising Quintile Smallest 10.88 11.55 15.65 17.67 31.29 2 13.25 12.30 19.14 21.70 48.56 3 12.09 16.24 16.22 21.00 65.63 4 13.56 14.39 21.24 32.64 68.99 Largest 18.15 26.81 44.92 51.20 114.72 Difference (Largest-Smallest) 7.27 b 15.26 a 29.27 a 33.53 a 83.43 a Panel C: Relative Price Impact (%) Market Value Quintile Smallest 2 3 4 Largest Advertising Quintile Smallest 0.27 0.18 0.14 0.12 0.09 2 0.27 0.20 0.14 0.12 0.07 3 0.27 0.19 0.14 0.11 0.07 4 0.32 0.19 0.14 0.11 0.06 Largest 0.29 0.20 0.15 0.09 0.04 Difference (Largest-Smallest) 0.02 0.02 0.01 -0.03 a -0.05 a
34
Table 5 The Effect of Advertising on Liquidity Measures: Regression Analysis
This table reports estimates of panel-regressions relating liquidity measures on advertising expenses and other control variables. Advertising expenses, market value of equity, share price, and return on assets (operating income before depreciation scaled by total assets) are collected from COMPUSTAT. Firm age is constructed as the number of years the firm has existed on the CRSP database. Return volatility is computed as the standard deviation of daily returns over the year. Share turnover is constructed from CRSP as an annual average of total monthly volume divided by shares outstanding. Relative bid–ask spreads are collected from the TAQ database. Quoted depth is constructed from TAQ as the average number of shares quoted at the inside bid and ask prices. Relative price impact is constructed from TAQ as the percentage difference between the midpoint of the spread and the midpoint of the spread that arises after a trade is executed multiplied by a trade indicator variable, Qt, which takes on values of 1 or –1 for buyer-initiated and seller-initiated trades, respectively. Amex and Nasdaq dummy variables indicate the firm’s primary exchange. We use standard panel data techniques to estimate the parameters of the regression models. Standard errors are reported in parentheses below coefficient estimates. a, b, and c denote significantly different from zero at the 1%, 5%, and 10% level, respectively. Standards errors have been adjusted for heteroskedasticity.

35
Table 5 (continued)
Dependent Variable Log(Relative Bid-Ask Spread) Log(Quoted Depth) Log(Relative Price Impact)
Between-Firms Estimates
(1)
Within-Firms Estimates
(2)
Between-Firms Estimates
(3)
Within-Firms Estimates
(4)
Between-Firms Estimates
(5)
Within-Firms Estimates
(6)
Log(Advertising) -0.011 b -0.047 a 0.064 a 0.051 a -0.046 a -0.080 a (0.005) (0.011) (0.009) (0.017) (0.011) (0.029)
Log(Firm Age) -0.030 a -0.070 a 0.036 a 0.173 a 0.007 0.227 a (0.006) (0.015) (0.011) (0.024) (0.013) (0.039)
Return on Assets -0.004 -0.007 0.001 -0.116 a -0.008 -0.031 (0.009) (0.018) (0.015) (0.028) (0.038) (0.065)
Log(Market value) -0.278 a -0.347 a 0.108 a -0.183 a -0.130 a -0.260 a (0.005) (0.008) (0.009) (0.013) (0.010) (0.022)
1/(SharePrice) 0.022 b 0.027 0.066 a 0.265 a -0.165 a -0.030 (0.011) (0.017) (0.019) (0.027) (0.040) (0.046)
Log(Turnover) -0.261 a -0.209 a 0.122 a 0.130 a -0.085 a -0.032 (0.007) (0.007) (0.012) (0.011) (0.014) (0.020)
Log(Return Volatility) 0.674 a 0.567 a 0.430 a -0.082 a 0.570 a 0.275 a (0.017) (0.015) (0.029) (0.023) (0.037) (0.039)
Nasdaq Indicator 0.271 a -1.324 a -0.276 a
(0.017) (0.029) (0.033)
Amex Indicator -0.073 a -0.405 a 0.270 a
(0.026) (0.045) (0.052)
Year-indicator variables Yes Yes Yes Yes Yes Yes
Firm-indicator variables No Yes No Yes No Yes
N 5,643 5,643 5,554 5,554 5,266 5,266
Adjusted R-squared 0.942 0.924 0.685 0.045 0.554 0.484