profile, adversity quotient®, and multifactor leadership ...
ADVERSITY QUOTIENT AND PERSONAL CHARACTERISTICS AS CORRELATES OF THE PERSONALITY-TEMPERAMENT TRAITS
OF EDUCATORS IN SELECTED PUBLIC AND PRIVATE EDUCATIONAL INSTITUTIONS
_______________
A Dissertation Presented to
The Faculty of the School of Graduate Studies Manuel L. Quezon University, Manila
_______________
In Partial Fulfillment of the Requirements for the Degree
Doctor of Education Major in Educational Management and Planning
_______________
By
ROWEL G. OLILA
2012
2
CHAPTER 1
THE PROBLEM AND ITS BACKGROUND
Introduction
Leadership is an inherently moral endeavor because it involves
a relationship of influence and power between a leader and followers.
A leader’s personality plays an important role in his or her leadership
activities and effectiveness. Obviously, leader would lead people in
accordance with his or her personality characteristics and traits. This
is highlighted in the trait leadership theory defined by Zacarro, Kemp
and Bader (2004) as an integrated pattern of personal characteristics
that reflect a range of individual differences and foster consistent
leader effectiveness across a variety of group and organizational
situations.
Studies have established that individual characteristics, such as
demographics, skills and abilities, and personality traits, predict
leadership effectiveness (Eagly, Karau and Makhijani, 1995; Judge
3
Bono, Ilies and Gerhardt, 2002; Judge, Colbert, and Ilies, 2004;
Mumford, Campion, and Morgeson, 2007 ).
Research has also demonstrated that successful leaders differ
from other person and possess certain core personality traits that
significantly contribute to their success. Understanding the
importance of these core personality traits that predict leader
effectiveness can help organizations with their leader selection,
training, and development practices ( DeRue, Nahrgang, Wellman,
and Humprey, 2011).
Psychologically, personality includes both character and
temperament (American Psychiatric Association, 1994; Leonard,
1997; Sperry, 1997). Temperament includes the perceptual
organization of information related to the self that is acted upon
unconsciously. As such, this is the realm of impulses in response to
some internal or external stimuli. On the other hand, character
involves an individual’s abstract conceptualization of personal,
interpersonal, and transpersonal identity that is utilized to consciously
alter interactions with the environment (Cloninger, Svrakic, and
Pryzbeck, 1993).
4
Kiersey (1998) further cited that temperament is a
predisposition to behave in certain ways and was first outlined by
Hippocrates about 370 B. C. and was further refined by the Roman
physician Galen around 190 A. D. Over the years, temperaments
have been given a lot of names, including sanguine, melancholic,
choleric, and phlegmatic. Allport in 1937 asserted that temperament is
the raw material from which personality is fashioned.
Temperament is the behavior style or how of behavior as
contrasted with the abilities, or what of behavior, and the motivations,
or why of behavior. It is n-dimensional. Temperament is the
characteristic phenomenon of an individual’s emotional nature,
including his susceptibility to emotional stimulation, his customary
strength and speed of response, the quality of his prevailing mood,
and all the peculiarities of fluctuation and intensity of mood. It
determines and is the result of unique combinations of personality
preference. It can denote a moderation or unification of otherwise
disparate forces, a tempering or concession of opposing influences,
an overall coloration or tuning a kind of thematization of the whole, a
5
uniformity of the diverse (Chesss and Thomas, 1991; Talwar, Nitz and
Lemer, 1991; Zarghani, 1998).
But what are the factors that can influence the personality
temperament of an individual? According to Limpingco and Tria
(1991), the origins of personality include genetics, socio-cultural
factors, learning, existential humanistic consideration, and
unconscious mechanism. Oni (2001) also noted that genetics, self-
image, experiences in life, attitude and choices about those
experiences, and friends have significant effect on personality. Within
these factors, this study specifically focuses on the influence of
personal characteristics and Adversity Quotients ® on the personality
temperament traits of educators.
Background of the study
No one can deny that in the different stages of life, people
encounter or face different hardships, difficulties, challenges,
adversities, sorrows, or great losses, which are difficult to bridge.
However, people do not respond in the same way to identical
situations. There are some people who, despite of seemingly
6
insurmountable odds somehow keep going, while others are pounded
down by an incessant avalanche of change. These individuals are
able to consistently rise up and break through being more skilled and
empowered as they go. All this reflects one’s self concept, confidence
in one’s abilities and courage to face adverse situations. This means,
that there is some measurement to determine the ability of an
individual to handle adversities, which is known as Adversity
Quotient®
Adversity Quotient® (AQ) is the science of human resilience
(Stoltz, 2000). Resilience in psychology refers to the idea of an
individual’s tendency to cope with stress and adversity. This coping
may result in the individual “bouncing back” to a previous state of
normal functioning, or simply not showing negative effects according
Masten (2009). Resilience is a dynamic process whereby individuals
exhibit positive behavioral adaptation when they encounter significant
adversity (Luthar, Cicchetti, and Becker, 2000)
According to Stoltz (2000), Adversity Quotient measures one’s
ability to prevail in the face of adversity . It explains how one responds
to adverse situations, and how one rises above adversity. Stoltz
7
(2000) said that life is like mountain climbing and that people are born
with a core human drive to ascend. Ascending means moving toward
one’s purpose no matter what are the goals. AQ is the underlying
factor that determines one’s ability to ascend.
Stoltz (2000) further indicated that “people who successfully
apply AQ perform optimally in the face of adversity – the challenges,
big and small, that confront us each day. In fact, they not only learn
from these challenges, but they also respond to them better and
faster. For businesses and other organizations, a high Adversity
Quotient workforce translates to increased capacity, productivity, and
innovation as well as lower attrition and higher morale.”
Stotlz (1997) further indicates that one’s Adversity Quotient, the
ability to prevail in the face of adversity, is comprised of four
interrelated constructs CORE. These CORE include perceived control
over the adversity; perceived ownership of the outcome of the
adversity (regardless of its cause); perceived range or scope of the
adversity (i.e.,) how far the adversity “bleeds” into other areas of one’s
life); and finally perceived endurance of the adversity (i.e., how long
the adversity lasts).
8
Several factors are found to modify the negative effects of
adverse life situations. Many studies show that the primary factor is to
have relationship that provide care and support, create love and trust,
and offer encouragement, both within and outside the family.
Additional factors are also associated with resilience, like the capacity
to make realistic plans, having self-confidence and a positive self-
image, developing communication skills, and the capacity to manage
strong feelings and impulses (Apahelpcenter.org).
Another protective factor is related to moderating the negative
effects of environmental hazards or a stressful situation in order to
direct vulnerable individuals to optimistic paths, such as external
social support. More specifically, Werner (1995) distinguished three
contexts for protective factors: (1) personal attributes, including
outgoing, bright, and positive self-concepts; (2) the family, such as
having close bonds with at least one family member or an emotionally
stable parents; and (3) the community, like receiving support or
counsel from peers.
Research has also been devoted to discovering the individual
differences in resilience. Self-esteem, ego-control, and ego-resiliency
9
are related to behavioral adaptation (Cicchetti, Rogosch, Lynch, and
Holt, 1993). Demographic information (e.g., gender) and resources
(e.g., social support) are also used to predict resilience.
The ability of individuals to be resilient is important in the field
of education as the constantly changing environment provides many
challenges and adversities for administrators to overcome.
Education today is operating in a constantly changing
environment. Advances in technology, changes in educational policy,
financial limitations, changes in student demographics, and the
increased call for accountability are just some of the factors that have
required the field of education to respond in a manner it has never
had to before ( Del Facero, 2005; Lucas, 2000).
To overcome the challenges of an ever-changing environment,
it then becomes important for school administrators to be effective in
operating within such an environment and have the skills necessary
to be successful despite adversities. An educational leaders’ adversity
response plays a crucial role in the development of successful school
climates and student achievement (Rosenholtz, 1989; Stoltz, 2000).
Therefore, failure of school administrators to face the challenges in
10
life may result to more serious problems that can have detrimental
effects on the success of students, teachers, parents, other
stakeholders and even the whole educational institution. Adversities
faced by school administrators can be a barrier to their efficient
performance and the fulfillment of personal and organizational goals.
Therefore, it is important for school administrators to be well-
equipped and effective at rising above and beyond adversities and for
them to exhibit these characteristics in such a manner that other
members of the organization reflect similar behavior.
It is within this context that this capacity of the school
administrators to rise quickly from defeats, frequent frustrations,
stress and setbacks as they perform their duties and responsibilities.
In particular, this study aims to establish the interrelationship among
adversity quotient, personal characteristics and personality-
temperament traits of educators in selected private and public
educational institutions in the province of Aurora.
11
Theoretical Framework
The theoretical framework for this study is primarily anchored
on the leader-trait paradigm, on the concept of Adversity Quotient,
and on theories of temperament/personality.
In terms of Trait Theories of Leadership, Bass (1990) proposed
two questions: (a) Which traits distinguish leaders from other people,
and (b) what is the magnitude of those differences? Leadership
scholars have generally examined leader traits related to
demographics (e.g., gender, age, education), task competence (e.g.,
intelligence, Conscientiousness), or interpersonal attributes (e.g.,
Agreeableness, Extraversion) Bass and Bass, 2008). Understanding
the relative validity of leader traits is important because traits might
not be independent. For example, there are biological and socio-
cultural reasons for why men and women score differently on
personality and intelligence (Feingold, 1994; Halpern.1997). The
Biological Model posits that gender differences are a function of
innate differences between sexes, whereas the Socio-cultural Model
posits that social and cultural factors directly produce differences.
12
Research suggests that leader traits related to task
competence and interpersonal attributes are important predictors of
leadership effectiveness ( DeRue et al., 2011). Task competence is a
general category of leader traits that relate to how individuals
approach the execution and performance of tasks according to Bass
and Bass (2008). Although a variety of task-related personality traits
have been studied, leadership scholars most often describe task
competence in terms of four traits: intelligence, conscientiousness,
openness to experience, and emotional stability. Intelligence reflects
a general factor of cognitive abilities related to individuals’ verbal,
spatial, numerical, and reasoning abilities, and has been established
as a consistent predictor of task performance (Hunter and hunter,
1984).
Beyond intelligence, conscientiousness, openness to
experience, and emotional stability are often used to describe how
one approaches and reacts to task work (Barrick and Mount, 1991).
Conscientiousness reflects the extent to which a person is
dependable, dutiful, and achievement-oriented, and is often
associated with deliberate planning and structure. Openness to
13
experience is commonly associated with being imaginative, curious
and open minded to new and different ways of working. Emotional
stability refers to a person’s ability to remain calm and not be easily
upset when faced with challenging tasks.
Interpersonal attributes is a general category of leader traits
that relate to how individuals approach social interactions (Bass and
Bass, 2008). These traits include the interpersonal plane of
personality (i.e., extraversion, agreeableness) (Costa and McCrae,
1992), as well as skills and abilities related to social functioning (e.g.,
communication skills) (Klimoski and Hayes, 1980).
This study is also anchored on the concept of Adversity
Quotient as one leadership trait that could define emotional stability.
The concept of Adversity Quotient® (AQ) was discovered by Stoltz
(2000), who defined AQ as the capacity of the person to deal and
respond with the adversities of life such as stress, difficulty and
problem. Adversity Quotient® encompasses four dimensions which
exactly measures the AQ of an individual. They are control, origin and
ownership, reach and endurance embodied in the acronym CO2RE
(Canivel, 2010).
14
The “C” in CO2RE stands for “control”. According to Stoltz
(2000), “control” is the extent to which someone perceives they can
influence whatever happens next. It determines resilience, health, and
tenacity. It asks the question: “How much control do you perceive that
you have over an adverse events?” Actual control in a given situation
is nearly impossible to measure. Perceived control is much more
important. From day one, nothing happens without perception of
control. People who respond to adversity as temporary, external and
limited have optimistic explanatory styles and tend to enjoy life’s
benefits. With perceived control, hope and action are turned to reality
or learned helplessness shall pass. (Canivel, 2010) . The difference
between lower and higher AQ® responses on this dimension are
therefore, quite dramatic. Those with higher AQ’s simply perceive
greater control over life’s events than do those with lower AQ’s. As a
result, they take action, which in turn results in more control (Stoltz,
2010).
The first “O” in CO2RE stands for “origin”. According to Canivel
(2010), it has something to do with blame. Blame has two functions
which help one to learn from and adjust behavior causing
15
improvement. This blame leads to guilt obliging one to search own
soul and weigh the way one might have hurt others. The feeling of
guilt is a powerful motivator when used properly for it can help heal
real, perceived or potential damaged to an important relationship. Too
much blame can be demoralizing and destructive which can destroy
one’s energy, hope, self-worth and immune system leading one to
decide to quit. It is indicative of the level to which one or an external
entity is the origin of the events, and to what degree one owns the
outcomes. Those with lower AQ scores to blame themselves. Higher
scores tend to properly place responsibility, and therefore also have
high self-worth. An individual having low blame oneself for bad
events, but with higher AQ®, an individual learn one’s behavior to
become smarter, better and more effective the next time similar
situation is encountered.
The second “O” in CO2Re stands for “ownership”. According to
Stoltz (2000), “ownership” is the likelihood that someone will actually
do anything to improve the situation, regardless of their formal
responsibilities. It determines accountability, responsibility, action,
and engagement. It asks the question: “To what degree do I own the
16
outcome of the adversity?” The higher an ownership score, the more
there is ownership for outcomes, regardless of their cause. The lower
an ownership score, the more a person disowns the outcomes,
regardless of their cause. According to Canivel (2010), high AQ®
people enhance their accountability to control, empower and motivate
action; while low AQ® people disown the problem causing failure to
act, give-up, point fingers, reduced performance and angers at other
and many more negative actions. Owning the outcome reflects
accountability for achieving a specific result in response to a problem.
People act with great responsibility and accountability if they believe
they own a piece of the result ( Stoltz, 2000).
The “R” in CO2RE stands for “reach”. According to Stoltz
(2000), “reach” is the extent to which someone perceives an adversity
will “reach into” and affect other aspects of the situation or beyond. It
determines burden, stress, energy, and effort; it tends to have
cumulative effect. It asks the question: “how far will the adversity
reach into other areas of my life?” Lower AQ® response allow the
adversity to affect other aspect of one’s life leading to financial panic,
sleeplessness, bitterness, distancing self from others and poor
17
decision making. The lower your R score, the more likely you are to
catastrophize bad events, allowing them to spread. On the other
hand, the higher your R score, the more you may limit the reach of
the problem to the event at hands (Stoltz, 2000).
The “E” in CO2RE stands for “endurance”. According to Stoltz
(2011), “endurance” is the length of time the individual perceives the
situation/ adversity will last, or endure. It determines hope, optimism,
and willingness to persevere. It asks two related questions: “How long
wills the adversity last?” and, “How long will the cause of adversity
last?”. The lower your E score, the more likely you are to perceive
adversity and/or its causes lasting a long time (Stoltz, 2000). People
who see their ability than people who attribute failure to their effort (a
temporary cause) (Canivel,2010).
Stoltz (1997) postulates that there are four simple steps
involved in raising a person’s AQ, which are listen, explore, analyze
and do something.
This study also finds supports on the four types of temperament
according to LaHaye (1984), which described temperament as a
proto-psychological interpretation of the ancient medical concept
18
humorism and suggests that four bodily fluids affect human
personality traits and behaviors. The temperaments are sanguine
(pleasure-seeking and sociable), choleric (ambitious and leader-like),
melancholic (introverted and thoughtful), and phlegmatic (relaxed and
quiet). Each of the four types of humours corresponded in ancient
times to a different personality type. The sanguine temperament is
fundamentally impulsive and pleasure-seeking; sanguine people are
sociable and charismatic. They tend to enjoy social gatherings,
making new friends and tend to be boisterous. They are usually quite
creative and often daydream.
However, some alone time is crucial for those of this
temperament. Sanguine can also mean sensitive, compassionate and
romantic. Sanguine personalities generally struggle with following
tasks all the way through, are chronically late, and tend to be forgetful
and sometimes a little sarcastic. Often, when they pursue a new
hobby, they lose interest as soon as it ceases to be engaging or fun.
They are very much people persons. They are talkative and not shy.
Sanguines generally have an almost shameless nature, certain that
what they are doing is right. They have no lack of confidence.
19
The choleric temperament is fundamentally ambitious and
leader-like. They have a lot of aggression, energy and/or passion, and
try to instill it in others. They can dominate people of other
temperaments, especially phlegmatic types. Many great charismatic
military and political figures were choleric. They like to be in charge of
everything. However, cholerics also tend to be either highly
disorganized or highly organized. They do not have in-between
setups; not only one extreme to another. As well as being leader-like
and assertive, cholerics also fall into deep and sudden depression.
Essentially, they are very much prone to mood swings.
The melancholics temperament is fundamentally introverted
and thoughtful. Melancholic people often were perceived as very (or
overly) pondering and considerate, getting rather worried when they
could not be on time for events. Melancholics can be highly creative
in activities such as poetry and art and can become preoccupied with
the tragedy and cruelty in the world. Often they are perfectionists.
They are self-reliant and independent; one negative part of being a
melancholic is that they can get so involved in what they are doing
they forget to think of others.
20
The phlegmatic temperament is fundamentally relaxed and
quiet, ranging from warmly attentive to lazily sluggish. Phlegmatics
tend to be contented with themselves and are kind. They are
accepting and affectionate. They may be receptive and shy and often
prefer stability to uncertainty and change. They are consistent,
relaxed, calm, rational, curious, and observant, qualities that make
them good administrators. They can also be passive-aggressive.
Every individual is a combination of the four temperaments,
which means that a person may find out his or her temperament
blend by assessing his or her primary and secondary temperaments.
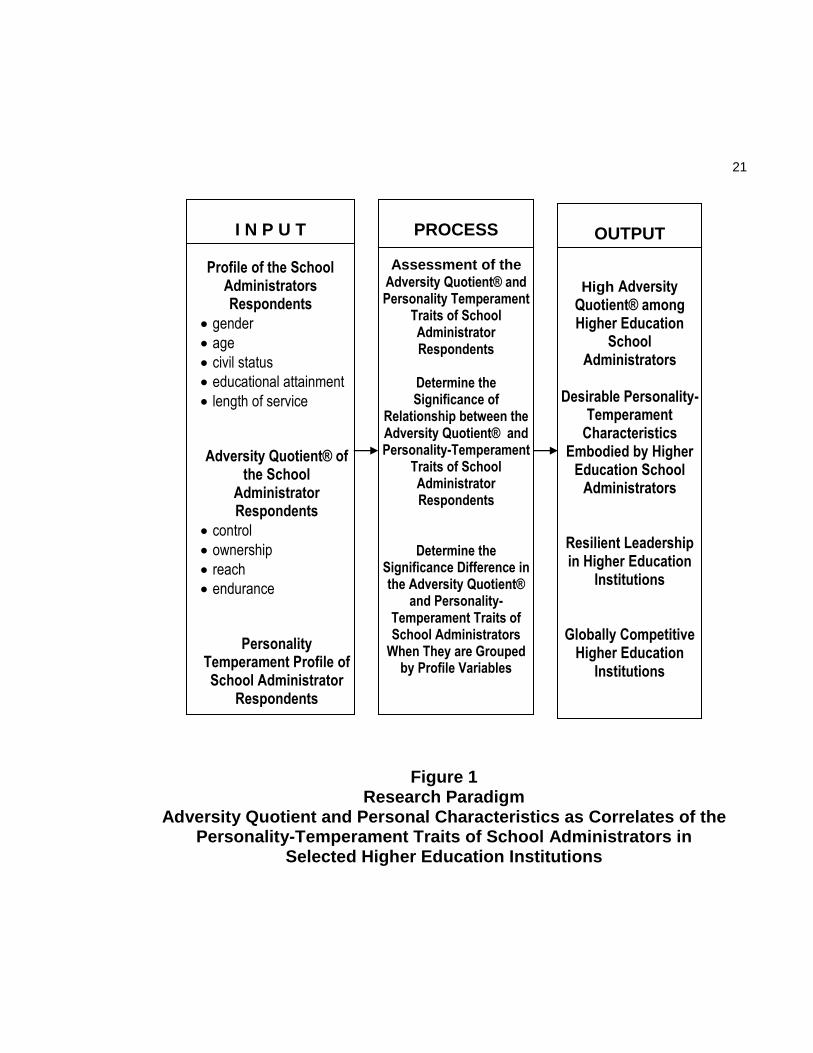
Research Paradigm
The research paradigm of the study is illustrated in Figure 1.
The inputs of the study included the profile, adversity quotient,
and personality-temperament profile of the educator respondents.
Their profile was described in terms of gender, age, civil status,
educational attainment, and length of service. The Adversity
Quotient® of the school administrator respondents was assessed in
terms of the following dimensions, control, ownership, reach, and
21
I N P U T
Profile of the School Administrators Respondents
gender
age
civil status
educational attainment
length of service Adversity Quotient® of
the School Administrator Respondents
control
ownership
reach
endurance
Personality Temperament Profile of School Administrator
Respondents
PROCESS
Assessment of the
Adversity Quotient® and Personality Temperament
Traits of School Administrator Respondents
Determine the Significance of
Relationship between the Adversity Quotient® and Personality-Temperament
Traits of School Administrator Respondents
Determine the Significance Difference in the Adversity Quotient®
and Personality-Temperament Traits of School Administrators
When They are Grouped by Profile Variables
Figure 1 Research Paradigm
Adversity Quotient and Personal Characteristics as Correlates of the Personality-Temperament Traits of School Administrators in
Selected Higher Education Institutions
OUTPUT
High Adversity Quotient® among Higher Education
School Administrators
Desirable Personality-
Temperament Characteristics
Embodied by Higher Education School
Administrators
Resilient Leadership in Higher Education
Institutions
Globally Competitive Higher Education
Institutions
22
endurance. The personality temperament profile of the school
administrators was determined based on the following four
temperaments: sanguine, choleric, melancholic, and phlegmatic.
This study carried out the following processes: assessment of
the Adversity Quotient® and personality temperament traits of school
administrator respondents; to determine the significance of
relationship between the Adversity Quotient® and personality-
temperament traits of school administrator respondents; and to
determine the significance difference in the Adversity Quotient® and
personality-temperament traits of school administrators when they are
grouped by profile variables.
A self-assessment of the educator’s Adversity Quotient® will
allow them to discover their strengths and weaknesses leading to
self-improvement towards having a high AQ®. With high Adversity
Quotient®, school administrators can apply desirable personality-
temperament traits to be more resilient in responding to challenges
faced by educayors in order that these institutions will be able to
accomplish its goal of becoming globally competitive.
23
Statement of the Problem
The major purpose of this study is to examine the
interrelationships among the Adversity Quotient®, personal
characteristics and personality-temperament traits of educators in
selected private and public educational institutions.
Specifically, answers to the following questions were sought:
1. What is the profile of the school administrator respondents
in terms of the following:
1.1 gender;
1.2 age;
1.3 civil status;
1.4 educational attainment; and
1.5 length of service?
2. What is the Adversity Quotient® of the respondents as
measured by the following dimensions:
2.1 control;
2.2 ownership;
2.3 reach; and
2.4 endurance?
24
3. What is the personality temperament profile of the
respondents?
4. How significant is the relationship between the Adversity
Quotient® and personality-temperament traits of the respondents?
5. How significant is the difference in the Adversity Quotient®
of the respondents when they are grouped by their profile variables?
6. How significant is the difference in the personality-
temperament traits of the respondents when they are grouped by their
profile variables?
Hypotheses
The following hypotheses were tested in this study at .05 level
of significance:
1. There is no significant relationship between the Adversity
Quotient® and personality-temperament traits of the educayor
respondents.
2. There is no significant difference in the Adversity Quotient®
of the educator respondents when they are grouped according to their
profile variables.
25
3. There is no significant difference in the personality-
temperament traits of the educator respondents when they are
grouped by their profile variables.
Significance of the Study
This study is relevant since according to Stoltz (1997),
individual adversity response is learned; and therefore, can be
changed and improved. Hence, findings of this study will primarily
help increase knowledge about Adversity Quotient® which can help
school administrators, teachers and other educational stakeholders to
be more resilient in facing challenges. In particular, the result of the
study would benefit the following:
School Administrators. This study will provide valuable and
deeper understanding and insights for school
administrators/principals in understanding their capacity to stay strong
and be focused and resilient amidst adversities, challenging tasks,
and responsibilities of being a leader. This will lead to self-
improvement for them to respond effectively to any adversity and thus
26
will help create a more relaxed and more productive institutional
climate.
Curriculum Developers. Findings of this study will provide
curriculum developer with valuable inputs to include and consider
such as findings on Adversity Quotient® and personality-
temperament traits of leaders in developing the curriculum.
Department of Education Officials. Results of this study will
provide an opportunity for educators and DepEd officials in
understanding the Adversity Quotient® of an individual and some
aspects of the personality-temperament traits of school administrators
which may require attention or enrichment and can serve as basis in
planning and designing new training programs integrating the
concepts of resiliency, creativity, drive and perseverance in dealing
with adversity in the workplace.
Policymakers. Policymakers can obtain data from the study
that can be codified for use in the formulation of policies relative to the
organization and operation of the schools.
Classroom Teachers/Academic Heads and Staff. This study
will also encourage academic heads, classroom teachers and staff to
27
reflect on their Adversity Quotient® and personality-temperament
traits as bases for self-improvement in helping them develop their
potential and leadership skills.
Students. Students will be given more opportunities to be the
center of an improved teaching-learning process through a school
administrator/educator with higher Adversity Quotient® and desirable
personality-temperament traits.
Other Researchers. This study may provide other researchers
with basis and future reference in undertaking further studies along
this line.
Scope and Delimitation of the Study
The scope of this study was limited to the Adversity Quotient®
and personal characteristics as correlates of the personality
temperament traits of educators in selected public and private
educational institutions in the Province of Aurora.
The Adversity Quotient® profile of educators was measured
through the AQ®P instrument of Dr. Paul G. Stoltz (2009).
28
The personality-temperament traits of educators were
categorized according to the four temperaments discussed by
LaHaye (1984), which are: sanguine, choleric, melancholic, and
phlegmatic.
Differentiating factors of the Adversity Quotient® and
personality-temperament traits of educators were their personal
characteristics of gender, age, civil status, educational attainment and
length of service.
The study was conducted during Academic Year 2012-2013.
Definition of Terms
To facilitate a better understanding of this study, the following
terms were conceptually and operationally defined:
Adversity. This term refers to any difficulty or hardship that an
individual encounters arising from the workplace which is the school.
Adversity Quotient®. This term refers to the total score
obtained on the Adversity Quotient Profile developed by Dr. Paul
Stoltz version 8.1 (2009) as a measure on how one handles adversity.
29
Adversity Quotient® Profile. This term refers to a self-rating
questionnaire on-line designed by Dr. Paul Stoltz (2009) to measure
an individual’s style of responding to unfavorable situations and
consisted of four dimensions.
Choleric Temperament. This is one of the four temperaments
considered in this study, which is described as fundamentally
ambitious and leader-like. Choleric people have a lot of aggression,
energy, and/or passion, and try to instill it in others.
Control. This is a dimension of the Adversity Quotient® Profile
which measures the degree of control one has over a difficult event.
Endurance. This is a dimension of the Adversity Quotient®
Profile which measures the length of time over which good and bad
events and their consequences will last.
Melancholic Temperament. This is one of the four
temperaments considered in this study, which is described as
fundamentally introverted and thoughtful. Melancholic people often
were perceived as very (or overly) pondering and considerate, getting
rather worried when they could not be on time for events.
30
Ownership. This is a dimension of the Adversity Quotient®
Profile which measures the extent of origin and ownership of the
difficult situations, ones responsibility and accountability for improving
the situations.
Phlegmatic Temperament. This is one of the four
temperaments considered in this study, which is described as
fundamentally relaxed and quiet, ranging from warmly attentive to
lazily sluggish. Phlegmatics tend to be content with themselves and
are kind. They are accepting and affectionate.
Reach. This is a dimension of the Adversity Quotient® Profile
which measures the degree on how good and bad events get in touch
into other areas of life.
Sanguine Temperament. This is one of the four temperaments
considered in this study, which is described as fundamentally
impulsive and pleasure-seeking; sanguine people are sociable and
charismatic.
Temperament. This refers to the characteristic phenomena of
an individual’s emotional nature, including his susceptibility to
emotional stimulations, his customary strength and speed of
31
response, the quality of his prevailing mood, and all peculiarities of
fluctuation and intensity in mood (Allport, cited in Strelau, 1998).
32
CHAPTER 2
REVIEW OF RELATED LITERATURE AND STUDIES
This chapter presents a review of foreign and local literature
and studies which are related to the present study. These reviewed
materials served to strengthen the theoretical frame of reference on
which this study was premised.
Related Literature
Foreign
The terms temperament and personality are often used
interchangeably by theorists and laypersons alike. The understanding
of temperament/personality has evolved greatly over time. As far back
as the ancient Greeks, taxonomies and temperaments were
employed to describe the character of the individual. Plato (4th century
B.C.) described characteristics such as anxiety and impulsivity.
Hippocrates (4th century B.C.) and Galen (2nd century A.D.) attempted
to explain individual characteristics as the embodiment of
33
Empedocles’ (5th century B.C.) doctrine of the four elements (earth,
air, fire and water). In particular, Hippocrates and Galen are credited
with describing individual differences based on the bodily balance of
the four humors (choler or yellow bile, melancholy or black bile,
phlegm, and blood) (Fruehstorfer, 2010).
Allport (1961) succinctly articulated the position held by
many temperament theorists ad defined temperament as:
“the characteristic phenomena of an individual’s emotional nature, including his susceptibility to emotional stimulations, his customary strength and speed of response, the quality of his prevailing mood, and all peculiarities of fluctuation and intensity in mood; these phenomena being regarded as dependent upon constitutional make-up, and therefore largely hereditary in origin (cited in Strelau, 1998, pg. 29).
Newberry, Clark, Strelau, Angleitner, Hollinger-Jones and
Eliasz (1997) stated that temperament is at least partly distinct from
personality and that temperament variables appear to concern the
“how” of behavior, whereas personality describes the “what” of
behavior. Yet, even Eysenck (1991) and Gray (1991), who are
considered by many to be icons in the area of temperament, often
34
considered the terms personality and temperament to mean the same
thing.
Kagan and Snidman (2004) suggested that temperament is a
precursor to personality – comprising individual differences before life
experience build a retaining wall around the young child’s biology.
Strelau (1983) provided this differentiation between
temperament and personality features:
1. Temperament is to a very great degree a result of biological
evolution, while personality is a product of temperament and socio-
historical circumstances.
2. Temperament characterizes animals as well as humans,
while personality is a specifically human mental phenomenon.
3. Constitutional anatomical-physiological structures form the
basis of temperament. Therefore, an individual possesses definite
temperamental features at birth. Personality is formed through
activity, via interactions between the person and his/her environment.
Thus, an individual does not have a personality at the earliest stages
of development.
35
4. Temperament includes formal behavioral traits only,
manifested in all kinds of reactions and actions independent of
content. Personality, then, primarily provides for the content of
behavior, expressing the relation of a person to the world and to
himself or herself.
5. Temperament traits are not subject to moral evaluation (i.e.,
different temperamental types are equally “good” from the standpoint
of ethics or virtue). An individual’s personality, in contrast, may be
evaluated by comparing it with moral values, which in turn depend on
the norms accepted in a society.
In discussing Adversity Quotient®, this is grounded on the three
main foundations, which are psychoneuroimmunology, neuro-
physiology, and cognitive psychology. Psychoneuroimmunology is a
field of investigation on how emotions and thoughts might affect body
and health. While neurophysiology is all about studies on how the
brain functions and learns during formation of habits. Lastly, cognitive
psychology is a big aspect of psychology which focusing on
relationships between thoughts and feelings associated with
healthiness of mental. This field can be further divided into several
36
subjects, for instance, learned helplessness theory, hardiness,
resilience, attribution, self-efficacy and many more (Stoltz, 1997).
Stoltz (1997) discovered Adversity Quotient® (AQ) to be a
better indicator in achieving success rather than Intelligence Quotient
(IQ), education or even social skills. Hundreds of studies supported
the role of AQ® in determining one’s ability to withstand adversity and
to triumph over it.
As indicated by Stoltz (2000), Adversity Quotient® (AQ) is the
science of human resilience. Resilience is most commonly
understood as a process, and not a trait of an individual. It is
sometimes referred to as ‘posttraumatic growth’ or ‘steeling effects’
where is the experience adversity leads to better functioning (much
like an inoculation gives on the capacity to cope well with future
exposure to disease) (Rutter, 2008).
Leaders are under mounting pressure to measure and
substantiate their investments and efforts. Whereas, it was once good
enough to provide business-relevant training, a person must now
demonstrate the impact the training has upon the enterprise. The
37
same mandates apply to investments in new hiring methods or
organization-wide initiatives (Stoltz, 2000).
Adversity Quotient® can influence all facets of human
endeavor. It can be validly and reliably measured, tell a person how
well he or she withstands adversity and measures ability to surmount
any crisis, can be permanently rewired and improved. It also
determines the value people receive from training, can be a valid
predictor of sales, performance, agility, problem solving and long term
success, and can also be used to reduce turnover and improve hiring,
predict who will quit and who will climb, and plays a powerful role in all
relationships.
Resilience is best understood as a process. It is often
mistakenly assumed to be a trait of the individual, an idea more
typically referred to as “resiliency” (Masten, 1994). Most research now
shows that resilience is the result of individuals being able to interact
with their environments and the processes that either promote well-
being or protect them against the overwhelming influence of risk
factors (Zautra, Hall, and Murray, 2010). These processes can be
individual coping strategies, or may be helped along by good families,

38
schools, communities, and social policies that make resilience more
likely to occur (Leadbeater, Dogen and Solarz, 2005). In this sense
“resilience” occurs when there are cumulative “protective factors”.
These factors are likely to play a more and more important role the
greater the individual’s exposure to cumulative “risk factors.”
Local
Since this study is focused on leadership of selected private
tertiary educational institutions, a brief overview of higher education in
the Philippines is presented.
Philippine higher education is uniquely characterized by the
presence of a big number of private higher education institutions and
a small number of publicly-funded universities and colleges. Although
higher education is not free and compulsory, it is still very extensive
enrolling about 2.5 million students in more than 10,000 academic
programs and 1,718 higher education institutions all over the country.
The private higher education sector in the Philippines is composed of
sectarian and non-sectarian institutions. Sectarian institutions are run
by religious organizations generally either Catholic or Protestant.
39
Because about 85% of the population is Catholic, there are more
Catholic private institutions of higher learning than those established
by the other religious groups combined. Catholic private higher
education institutions are also perceived to be performing very well.
Non-sectarian institutions are those, which are owned by private
corporations.
Philippine higher education institutions offer a wide variety of
degree programs, associate, diploma, baccalaureate, graduate
degree courses at the master’s and doctoral levels. The length of
study for baccalaureate degree is for four (4) years except for
engineering (5 years), dentistry and veterinary medicine for six (6)
years, law (8 years) and medicine (8 years). An undergraduate
degree is required for admission to law and medicine.
The Philippine academic year begins in June and ends the
following March. Most universities and colleges conduct schools for
two semesters. A few universities conduct classes in trimester and
quarter system basis. Students enjoy English instructions both at the
undergraduate and graduate levels (Valenzuela, 2005).
40
Leadership plays an important part in any human group
undertaking in the higher education sector. Aquino (2000) broadly
defined leadership as the relationship between an individual and a
group built around some common interest wherein the group behaves
in a manner directed or determined by the leader. The leader, thus,
becomes the interpreter of the interests and objectives of the group,
as the group in turn recognizes and accepts the interpreter as its
spokesperson.
Endriga (2008) emphasized that current and future leaders
must recognize that the major trends in globalization, technology,
trade and geopolitical alignments have caused profound changes in
economic activity, consumer behavior and lifestyles, industry
structures, the nature of management and relationships among
nations. Te mindset of change, transparency, reform and
transformation must replace outdated thinking that leaders can
survive with patronage, dependency and apathy.
A leader is one who influences and directs others. He assumes
responsibilities to motivate his workers, encourages them, inspires
them, communicates with them, and helps them attain their goals.
41
Components of leadership are morale, discipline and proficiency
(Avelino and Sanchez, 1996).
Corrales (2007) stressed that the ability to build strong
relationships is the universal prerequisite for becoming a great leader.
Without that ability, no personal trait would consistently lead to great
leadership. Not one trait can explain great leadership, not even
empathy. A trait is a personal quality; while leadership is an
interpersonal ability. It includes the personal, but transcends it.
Effective leadership requires influence. To have influence, one
needs to have a strong relationship. Therefore, the relationship
component of leadership is its core feature. Leaders who see
relationship building as the “soft” stuff of organizational building will
neglect the most important ingredient of their craft. They will relegate
the relationship to the level of a “necessary nuisance.” These leaders
will always encounter leadership puzzles they cannot understand.
They are so goal-focused they will miss the “water” in which live. Like
fish, the will not realize that people require healthy water to draw life-
giving oxygen. The relationship is the water. This relationship is the
most single important factor in promoting productivity.
42
The personality-temperament of a leader defines how he leads.
According to Avelino and Sanchez (1996), personality is the
conglomeration of the following components of the individual: physical
self, intelligence, character traits, attributes, habits, interest, personal
discipline, moral values, principles and philosophies in life, as well as
his idiosyncrasies. Simply, it refers to the total person in his overt and
covert behavior that includes the many factors of his being, his social,
mental, emotional, intellectual and physical aspects. It is also the
reflection of the inner self of an individual, and therefore, it strongly
influences through his behaviors and his interrelationships with other
individuals.
On the other hand, personality traits is a dimension of
personality that is used to categorize individuals according to the
degree to which it manifest its functioning to a high degree of
consistency in an individual’s behavior (Avelino and Sanchez, 1996).
Kahayon and Aquino (1999) the term personality is taken from
the Latin term Persona meaning “mask” which were first used in
Greek drama, and latter adopted by Roman players. While it originally
referred to masks used in comedy or tragedy to distinguish the roles
43
of Roman players and therefore, to the external and superficial
aspects of the individual, it has now come to refer more to the central
and enduring aspects of the individual.
Kahayon and Aquino (1999) effective personalities are not
developed in a night, so to speak. Each person desiring to improve
his personality, must strive to equip himself with a program of self-
improvement and must stick to it no matter what. Through patient
application and effort, one can develop characteristics that we have
judged as attractive or unattractive in others and which we can adapt
in our own behavior patters. Some of the positive steps to take if we
wish to improve ourselves are the following:
1. Self-appraisal. Begins by listing down and evaluating your
physical, intellectual, social and emotional traits in terms of
effectiveness, ineffectiveness or partial effectiveness.
2. Effective regulation of emotional life. One must develop a
high degree control over one’s emotions and not allowing one’s
emotions to control you. Negative or unpleasant emotions like fear,
envy, pride, etc. should be checked or sublimated; the positive
emotions like joy, love, reverence, etc. should be developed.
44
3. Social relations. One should be capable of social intimacy –
forming friendships and participating in social relations that are
deeper than mere acquaintances. Social competence consists of
being able to actualize one’s own needs.
4. Work. One must be committed to some form of work that is
satisfying as well as economically good. Keep busy and indulge in
worthwhile hobbies.
5. Love and sex. One must be able to forego personal
gratification, even sexual gratification, to satisfy the loved one. Love
consists of thinking more of other people rather than one’s own self.
6. Self. One must have a positive regard of one’s self as a
distinguished part of the world he lives. One should have a well-
developed ego identity and should know who he is, where he is going
and should have an inner assurance that he will be recognized and
accepted by those who count.
7. Philosophy of Life. One should live by philosophy of life that
should give direction to one’s actuations. One good philosophy is to
do well, to do good and to be liked.
45
Related Studies
Foreign
The purpose of Wu’s (2009) study was to discuss the
situations, differences and related situations of adversity quotient and
campus crisis management for the educators in elementary schools.
In order to complete this study, the study starts with literature
analysis, questionnaire survey, and collection and analysis of data.
The questionnaire was performed on 400 elementary school
educators in 39 elementary schools in Kaohsiung Country. The
software SPSS v.12 was used to statistically analyze data using t-test,
one-way ANOVA, product-moment correlation and multiple regression
analysis.
The results of analyzed data revealed that the adversity
quotient of elementary school educators in Kaohsiung Country is in
the medium high range. However, it is easily effected other part of life
due to the distress. The elementary school educators in Kaohsiung
Country need to establish the conceptions of guidance and
assistance for campus crisis management. The elementary school
educators in Kaohsiung Country who are males, serve over 11 years,
46
graduated from graduate school, administrative staffs, home-room
teachers and had experience for handling crisis have higher adversity
quotient. The elementary school educators in Kaohsiung County who
are males, serve over 6 years, graduated from graduate school,
administrative staffs, home-room teachers and had experience for
handling crisis perform much better in campus crisis management.
There is close relation between the level of adversity quotient and
campus crisis management. Adversity quotient can be the reference
for projecting the ability of campus crisis management.
The study of Dai (2009) aimed to explore the high tech industry
employees in terms of the following: (1) the relationship among
adversity quotient, job stress, perceived organizational support and
role performance. (2) the adversity quotient as a mediator between
the job stress and role performance.(3) the moderating effect of
perceived organizational support to job stress and role performance.
For the purposes of the study, the questionnaire survey was
conducted for the employees in the south high tech industry. A total of
111 supervisor questionnaires and 333 staff questionnaires were
distributed to 44 high tech firms, where the role performance
47
questionnaires were designed for pairs of supervisor and employees.
One hundred ten (110) supervisor questionnaires and 330 staff
questionnaires were returned and, after 2 supervisors’ and 12 invalid
staffs’ questionnaires were eliminated, a total of 108 supervisor and
318 staff valid sets of questionnaires have been collected in this
study. The response rate of the valid questionnaires is 96.36%.
The study adopted the following statistical analysis techniques:
the confirmatory factor analysis(CFA), the reliability analysis, the
descriptive statistics, the independent t-test, the one-way ANOVA, the
structural equation, modeling (SEM), the correlation analysis , and the
hierarchical regression analysis.
The primary findings of the study showed that adversity
quotient has significantly negative effect on job stress. Adversity
quotient has significantly positive effect on role performance. Job
stress significantly negative effect on role performance. Job stress
has mediating effect on the relationship between adversity quotient
and role performance. 5. Perceived organizational support does not
have significantly moderate effect between the job stress and role
performance. This study concludes by discussing for the implications
48
of major findings, which would be a reference to the academy and
industries, and make suggestions for further studies.
Haller (2005) conducted a hermeneutic phenomenological
study to investigate the possible relationship or impact that adversity,
obstacles, and challenges had on the shaping and development of
prominent leaders. The sixteen research participants were two
currents U.S. Senators, a retired U.S. Army Special Forces Major
General, a president of a large educational foundation who previously
was chancellor of one large university and president of another,
several well-known authors and motivational speakers, two
Billionaires, and the Chairman and Chief Executive Officers of six
major companies.
The nine primary participants, prior to becoming prominent
leaders, experienced various degrees of adversity in their youth and
adult lives. These difficult experiences included being a Holocaust
victim and being interned in a Nazi concentration camp at age 7;
seeing his mother killed in front of him at age 14; two tours of duty in
U.S Special Forces in Vietnam; losing a right arm in battle in World
War II; the premature death of a parent; discrimination including
49
racial, gender ,or age; death of a business partner; going broke in
businesses; take-over attempts of his business; losing an election;
personal relationship strife or divorce; coping with dysfunctional and
deceitful regulators; being investigated by regulatory and legislatures
who had their own political agendas; extreme poverty; and other
adversities.
Several themes became apparent during the interviews and in
the explication of the data, including the following: (a) early adversity
in their youth, while important, was not the important of seminal event
in their lives; (b) obstacles and adversity were perceived as
challenges which could be turned into opportunities; (c) facing
adversity and successfully overcoming obstacles was important in
their progression and growth as leaders; (d) having mentors to help
guide, motivate, and inspire them was very important; (e) being a
Servant-Leader, serving people, and being humble were essential ; (f)
having a strong religious faith and or strong family ties, or both , was
important and helpful; and (g) their concepts and ideas about the
nature of leadership influenced their experiences heavily. This study
50
is significant as it demonstrates the qualities of a successful leader
with respect to AQ.
A study conducted by Johnson (2005) determined the
relationship between Explanatory Style and AQ and examined the
existence of correlations between each of the constructs and
performance in a high-adversity occupation, sales. The study involved
112 western area sales region of a leading Fortune 500 company in
the computer hardware industry. The findings revealed that there was
a significant relationship between AQ and performance for short-term
employees.
The study of Williams (2003) examined the relationship
between a principal’s response to adversity and student achievement,
the relationship between principal and teacher’s response to
adversity, and principals’ perceptions of adversity in education. Using
an ex post facto non-experimental research design, principal (n=17)
and teachers (n=79) from the Flagstaff Unified School District of
Arizona were asked to complete an Adversity Quotient (AQ) measure
(Stoltz,1997). AQ scores were compared to standardized student
51
achievement data from the past two years. Additional qualitative data
were gathered through five principal interviews.
The results of this study showed that students attained higher
achievement scores in schools with higher AQ principals. The study
also found that teachers’ perceived control over their work
environment may influence principal/teacher relationships and student
achievement. These findings suggest that principal response to
adversity may influence school climate, teacher self-efficacy, and
student achievement. The interview data supports the quantitative
findings, and adds a rich description of the manner in which the
principals view educational adversity and their response to it.
The purpose of the study conducted by Low (2010) was to
determine the resilience levels of university administrators, specifically
academic deans and department chairs, within a state university
system. This quantitative study utilized the survey method to
determine the resilience levels of academic deans and department
chairs within a state university system. Responses were received
from 35 deans and 123 chairs, each of whom completed the Personal
Resilience Questionnaire, a survey developed by Conner Partners
52
that measures individuals’ resilience and addresses how the
respondent acts, feels, or thinks given various situations. Results are
provided for each of the seven characteristics of resilience: Positive
:The World , Positive : Self,Focused, Flexible: Thoughs,
Flexible:Social, Organized and Proactive.
The results of the surveys illustrated the levels of resilience for
both deans and chairs and compared their results against the more
than 64,000 other individuals who have completed the instrument.
The Partial Least Squares (PLS) regression method was then utilized
in determining an individual’s resilience. The researcher was thus
able to identify that academic deans, on the average, exhibited higher
levels of resilience than did department chairs, and subsequently that
female administrators, on the average, were more resilient than
males.
It was also discovered that when compared against individuals
from other industries and professions that academic administrators
exhibited above-average levels of resilience on almost every
resilience characteristic. Furthermore, it was shown that gender,
institutional type, experience, size of the college/department
53
supervised, parental influence, formal training and incentive were
influential in determining resilience levels.
Local
The study of Canivel (2010) was conducted to investigate the
association between the adversity quotient, leadership style,
performance and practices among the principals in private schools in
the province of Rizal. Specifically, the study sought answering the
following: the adversity quotient® profile of the principals; the
leadership styles of the principals that emerged; the effect of AQ®P to
performance and practices; the relationship between the principals’
adversity quotient® with the principals’ leadership styles; and
relationship between the principals’ adversity quotient® and
leadership styles with the principals’ demographic profiles.
The researcher designed three instruments and made use of an
electronic AQ®P questionnaire to gather quantitative and qualitative
data. Descriptive and inferential statistics were applied in the analysis
of data and statistical software, SPSS version 10.0 was used.
54
The findings of the study were: The principals’ AQ®P in private
schools in Rizal has an average score which is within the AQ®P of
the standard provided; among the four dimensions of AQ which are
control, ownership, reach and endurance (CORE), it was ownership
that pulls down to below average score and all the rest got average
scores; participating leadership style emerged as best and rank
number 1, followed by selling leadership style, delegating leadership
style, and telling leadership style; both performance and practices
have positive response to adversity quotient; that there was no
correlation between the principals’ adversity quotient® and the
principals’ leadership styles; and lastly the adversity quotient® and
leadership styles of the Principals’ responses has no significant
correlation with demographic profiles.
Lugtu’s (2010) study established the significant relationship of
Adversity Quotient® and Personality-Temperament Traits of the
Special Weapons and Tactics (SWAT) Police of Manila. The study
used the correlation analysis method of research. The whole
population of the Special Weapons and Tactics Unit (SWAT) of
Manila Police District which is 92 were the respondents of the study.
55
The Adversity Quotient® Profile version 8.1 was utilized in
determining the level of AQ® or resilience of the respondents. The
findings of the study revealed that the respondents have an average
level of Adversity Quotient® characterized by being able to
significantly navigate life, and thus, may suffer unnecessarily due to
life’s frustrations and challenges. Moreover, the SWAT respondents
were found to have average level in the four dimension of AQ®
namely: control, origin and ownership, reach, and endurance. These
signify that most of the SWAT Police are competent and unbiased
enough to do their respective jobs.
The study further found that majority of the SWAT respondents
had a fairly non-discriminatory and unbiased personality patters as
revealed by the Guilford-Zimmerman Temperament Survey. Most of
them manifest an average level of sociability, emotional stability,
thoughtfulness and masculinity. In addition, the respondents were
found to have an above average level of general activity, restraint,
ascendance, objectivity, friendliness and personal relations. The
levels of Adversity Quotient® and personality-temperament traits
56
were not significantly related to the demographic characteristics of the
respondents.
The main purpose of Ferrer’s (2009) study was to determine
the relationship of personal characteristics, leadership styles, and job
satisfaction to the adversity quotient® of the academic heads of
selected state colleges and universities in the National Capital
Region. The researcher utilized the descriptive method using the
Adversity Response Profile® (ARP) by Dr. Paul Stoltz, Leadership
Style Survey by Dan Clark, and Job Satisfaction Questionnaire by
Alita Roxas. These questionnaires were distributed to 121 academic
heads during school year 2008-2009 in the selected State Colleges
and Universities in the National Capital Region. The percentages and
weighted mean were computer for the profile of the respondents in
terms of personal characteristics (age, civil status, gender,
educational attainment, and number of years of service), leadership
style (participative, delegative and autocratic and job satisfaction
level. In testing the hypothesis, the chi-square was used.
Results of the study showed that majority of the academic head
respondents belong to middle range of Adversity Quotient® Control,
57
Ownership, Reach and Endurance dimensions. In terms of overall
Adversity Quotient® level, respondents belong to average range.
Majority of the respondents possess a participative style of
leadership. In terms of job satisfaction, respondents are satisfied with
their present job conditions. On the assessment of significant
relationship between personal characteristics (age, gender, civil
status, educational attainment and number of years of service) and
overall Adversity Quotient® level and Control, Ownership, Endurance
dimension, the study showed that there is no significant relationship,
except for educational attainment and AQ® Reach dimension and of
the respondents which are significantly related. The study also
revealed that there is no significant relationship between leadership
style and overall Adversity Quotient® level and AQ® Control
dimensions which are significantly related. Moreover, the study also
found out that job satisfaction and overall Adversity Quotient® and
Control, Ownership, Reach and Endurance dimension are not
significantly related.
Lazaro (2003) conducted a study that focused on the
relationship between adversity quotient® and performance level
58
measured by the 360 degree feedback system among the 10 selected
middle managers in the different departments of the City of Manila.
The study employed descriptive, correlational-survey method and two
types of instruments – Adversity Response Profile®, an adversity
quotient test, and the performance evaluation instrument in obtaining
information. Findings revealed that respondents have an average
level or control over events that affect their lives circumstances and
see adversities as temporary – rather than enduring – setbacks.
Respondents sensed greater ownership regarding the outcome of
adversity and they do not allow such adversity to influence other
areas of their lives. The study also found out that the demographic
profile variables included in this study were not significantly related to
the adversity quotient® similarly to the performance level of
respondents. However, there was a high correlation between
adversity quotient® and performance revealed by the 360-degree
feedback system. The researcher recommended that adversity
quotient® be included as part of modifying the qualifications in
recruiting and promoting employees. This study can also lead to
include the practice of adversity quotient® in employees’ training and
59
development to instill awareness not only of personal adversity but
also of adversity which is inherent in their jobs.
Local studies which focused on personality traits are reviewed
in this section.
One such study was conducted by Roxas (2007) which
examined the influence of the administrators’ personality traits on the
teaching performance of the University of the Cordilleras. Findings
revealed that the physical, social and emotional traits of the
administrators influenced much the teaching performance of the
faculty. Overall, the personality traits of the administrators are
perceived to have much influence on the teaching performance of the
faculty of the University of the Cordilleras. Only the moderator
variable of gender and educational attainment of teachers affect their
perception on the influence of their administrators’ personality traits.
The study of Gadong (2009) was conducted to empirically
establish whether or not the personality traits of public secondary
school teacher influenced their efficiency in classroom management.
Specifically, the investigation aimed to determine the level of
desirability of personality traits, level of efficiency in classroom
60
management, the significant differences and influence in the 2nd
Congressional District of Capiz for the School Year 2008-2009. A
researcher-made, appropriately validated and pre-tested
questionnaire was used to elicit data from a total of 244 randomly
selected teacher respondents after proper formal requests for the
survey was approved.
The research disclosed that the classroom management
efficiency level of most of the 244 public secondary school teachers
were described as “efficient” and this efficiency did not significantly
vary between categories of variables gender, civil status, age, length
of teaching experience and educational attainment except in the
variable location of their school. In terms of their desirability in
personality traits, the 244 teacher-respondents were found to have
“desirable” personality traits; however, this desirability did not
significantly vary with their gender, civil status, age, length of teaching
experience, educational attainment and location of their school. The
desirability of personality traits of public secondary school teachers
was significantly related with their classroom management efficiency
levels.
61
Torres (2005) embarked a study in finding out the dominant
personality traits of police officers in manila. The descriptive method
was utilized by the researcher. The main tools in generating the
responses are the GZTS, a standardized personality test,
questionnaire and interview. The researcher used the survey
questionnaire to know the problems being experiences by the Manila
police officers. By convenience sampling, the research was
conducted among police officers in Manila with a targeted number of
135 police officers. Out of this targeted number, only 93 were
generated. The remaining 42 respondents had incomplete data while
others declines to participate because they were afraid that if the
results of their personality would not be positive it may affect their
promotion.
Based on the summary of findings of this study, it can be
concluded that married police officers and those who have children,
are more restrained. Notwithstanding their duties, which are often
very stressful, having their family in mind guides them in their
decision-making. Police officers with a college degree provide more
quality service because they become better communicators and more
62
effective decision makers thus, greatly minimizing the impact and
number of organizational and operational stressors. Senior police
officers have low restraint. Being in the position empowers them with
greater responsibilities, which entails greater temptations as well. As
a consequential result, they become more authoritative,
individualistic, prejudiced and dogmatic. Huge responsibilities that
result to stress and frustration make the police officer impulsive in
making decisions and enforcing actions. Low salary ranked first
among the common problems of the police officers as compared to
the amount of work they have. Police officers with low salary tend to
be less productive and demonstrate absenteeism.
The study of Pinto (2003) was undertaken to determine what
psychological needs were associated with the personality traits of the
selected Augustinian Senior Sisters in the Philippines. Forty (40)
Augustinian Senior Sisters with ages ranging form 35 to 80 years
were selected as respondents of the study. In terms of the number of
years in religious life, the range was 3 to 52 years. For the
quantitative analysis, two standardized psychological tests, Gordon
Personality Profile (GPP) and Edwards Personal Preference
63
Schedule (EPPS) were administered to the respondents. A written
questionnaire and a structured interview questionnaire were designed
by the researcher to assess their experiences on perceived and
addressed needs. Qualitative data were gathered through the conduct
of one-on-one interviews of 12 respondents from among the 40
respondents, selected based on high scores on each of the
Personality Traits (GPP).
The findings of the study are as follows: there is a significant
positive correlation between Responsibility and Nurturance;
Responsibility and Endurance; Emotional Stability, Sociability and
Nurturance. On the other hand, there is a significant negative
correlation between Ascendancy and Endurance; Sociability and
Nurturance. The respondents’ perceived needs such as “greater
religious commitment.” “faithfulness to the congregation” and “service”
were all associated with Nurturance and Endurance. The respondents
try to address their perceived needs by: Renewed Service and
Ministry, Prayer Life, Community Support and Commitment to
Religious Life.
64
The descriptive, comparative and correlation study of
Rajendram (2001) was conducted among major seminarians in Metro
Manila who were composed of two groups: the philosophers (n = 59)
who were in the early stage of priestly formation and the theologians
(n = 39) who were in the late stage of formation. It investigated
whether there was any significant difference between the two groups
in terms of religious motivation and anger management style and if
there was any correlation between religious motivation and the
following three variables; age, stages of formation, anger
management style. The study showed that the theologians were
significantly higher in the level of religious motivation than
philosophers. No significant difference was noted in anger
management style between the theologians and the philosophers. In
terms of temperament, most of the philosophers and theologians
were extroverted and Sensing Judging (SJ) individuals. All the four
temperaments (sensing judging, sensing perceiving, intuitive feeling
and intuitive thinking) had high-level religious motivation and there
was no particular temperament that had high-level religious
motivation. No correlation was found between religious motivation
65
and anger management style; however, there was positive correlation
found among religious motivation, stages of formation and age. The
findings have practical relevance for seminarians, formators, and
counselors.
Tan (2000) conducted a study at Notre Dame University,
Cotabato City during the school year 1999-2000. It is descriptive-
correlational research on the relationship between the temperament
scale and teaching efficiency of the NDU faculty. A census of 82 full-
time faculty members who have met the qualifications set were taken
as respondents.
The findings of this study are summarized as follows: There
was a comparable number of younger and older faculty members
whose length of teaching experience varied. Emotional stability and
Restraint were the most favorable traits of the respondents. The least
favorable was Friendliness. The respondents generally manifest
satisfactory level of teaching efficiency. There was no significant
relationship between each of the GZTS variables and teaching
efficiency in general except for Restraint, which shows significant
relation to efficiency in teaching. Restraint along with age, educational
66
attainment and teaching experience are statistically significant to
teaching efficiency.
Cajilig (2000) conducted an investigation on the Personality
Traits of Public Secondary School Teachers in the First
Congressional District of Iloilo and Their Influence on Classroom
Management. Findings of her study disclosed that most of the 210
public secondary school teacher-respondents were found to have
“highly desirable” personality traits. Furthermore, among the four
dimensions/aspects of classroom management, most of the teacher-
respondents were found “highly efficient” in the dimension, guidance
and directions of the learning process. Generally, however, the
respondents found some degree of difficulty in the classroom
management dimensions.
Synthesis of the Reviewed Studies
The reviewed studies tried to explain and discover the role and
the significance of the Adversity Quotient® in human performance,
particularly on leadership. The reviewed studies discussed above
reflect some semblance and differences with the current study but
67
altogether provided useful insights to the researcher about concepts
of Adversity Quotient®, personality-temperament traits, and
leadership behavior.
The studies of Wu (2009), Haller (2005), Johnson (2005),
William (2003) and Low (2010) al dealt on topics relating to Adversity
Quotient® in terms of foreign studies.
As to the local setting, the studies of Canivel (2010), Lugtu
(2010), Ferrer (2009), lazaro (2003), Roxas (2007), Gadong (2009),
Torres (2005), Pinto (2003), Tan (2000) and Cajilig (2000) were the
most related studies.
Although the reviewed studies may share the same views and
findings regarding the factors, effects or other variables considered in
the current study, they were found different from the present
undertaking in terms of other variables considered, research locale,
methodology and respondents.
Thus, this study can be considered first of its kind as regards
the combined concepts of adversity quotient, personality traits and
leadership styles in the research locale.
68
CHAPTER 3
METHOD AND PROCEDURES
This chapter presents a discussion of the method of research,
respondents of the study, sampling procedure, techniques and
instruments, validation of the instrument, data gathering procedures,
and the statistical treatment of data.
Research Method
The study utilized the descriptive research method with the
use of the questionnaire/checklist as the major instrument for
gathering data. This particular method is chosen because of its
appropriateness to the problem. Descriptive method allows
quantitative and qualitative description of current status, traits, nature
and characteristics of the subjects.
Best (1998) discussed that the descriptive method typically
employs a survey or an assessment approach for its purpose is to
collect information that permits one to discuss the characteristics of
69
persons and their perceptions. It presents facts concerning nature
and status of the study. It is concerned with conditions or
relationships that exist, processes that are going on and effects that
are felt and trends that are developing.
Respondents of the Study
The respondents of the study were educators composed of, college
deans, school principals, school heads, academic heads and classroom
teachers of selected private and public educational institutions in the
Province of Aurora who agreed to participate by accomplishinh the on-line
questionnaires needed for this study. The researcher is truly grateful to all
who extended their cooperation for the success of gathering needed data.
Sampling Procedure
A complete enumeration of the one hundred forty-one (141)
educators from the selected public and private educational institution in the
Province of Aurora was requested to participate in the study. All one
hundred forty-one respondents accomplished the personality-temperament
survey form. However, only 139 respondents were able to answer the
AQ®P instrument. Two (2) of them did not give their e-mail addresses.
70
Instruments and Techniques
This research made use of the following instrument and
techniques:
Questionnaire. The major tool in the gathering of data is the
questionnaire which is designed according to the specific problems of
the study. Additional information was obtained using unstructured
interviews.
The questionnaire is divided into three parts.
The first part aims to gather information on the profile of the
school administrators in terms of gender, age, civil status, educational
attainment; and length of service.
Part II aims to assess the personality-temperament profile of
school administrators in terms of the four temperaments, as follows:
sanguine, choleric, melancholic and phlegmatic. In scoring the
personality-temperament scale, all the 1 or 2 answers were canceled
out since these scores are so low such that these do not really apply
to the overall scoring in each Section. Then all the 3's, 4's, & 5's in
each Section were add up and the totals were written at the bottom of
71
each appropriate section. The section with the highest score is the
primary temperament of the respondents; and the section with the
second highest score is their secondary temperament. This study
considered the primary temperament of the school administrators.
The third part is the electronic version of the Adversity Quotient
Profile instrument of Dr. Paul G. Stoltz (2009) in his latest AQ®P
online version 8.1. Respondents answered the survey using the
internet, in which basic information were provided and the
respondents have to enter his/her email addresses for them to access
the unique URL provided by PEAK Learning for this research study.
AQ®P online version 8.1 is a self rating instrument that measures an
individual’s style of responding to adverse situation and measure
ones adversity level. The AQ®P presents 14 scenarios or events,
each of which is followed by four questions to be responded to on a 5-
point Likert scale. In scoring the AQ®P scores, the following are the
descriptive interpretations:
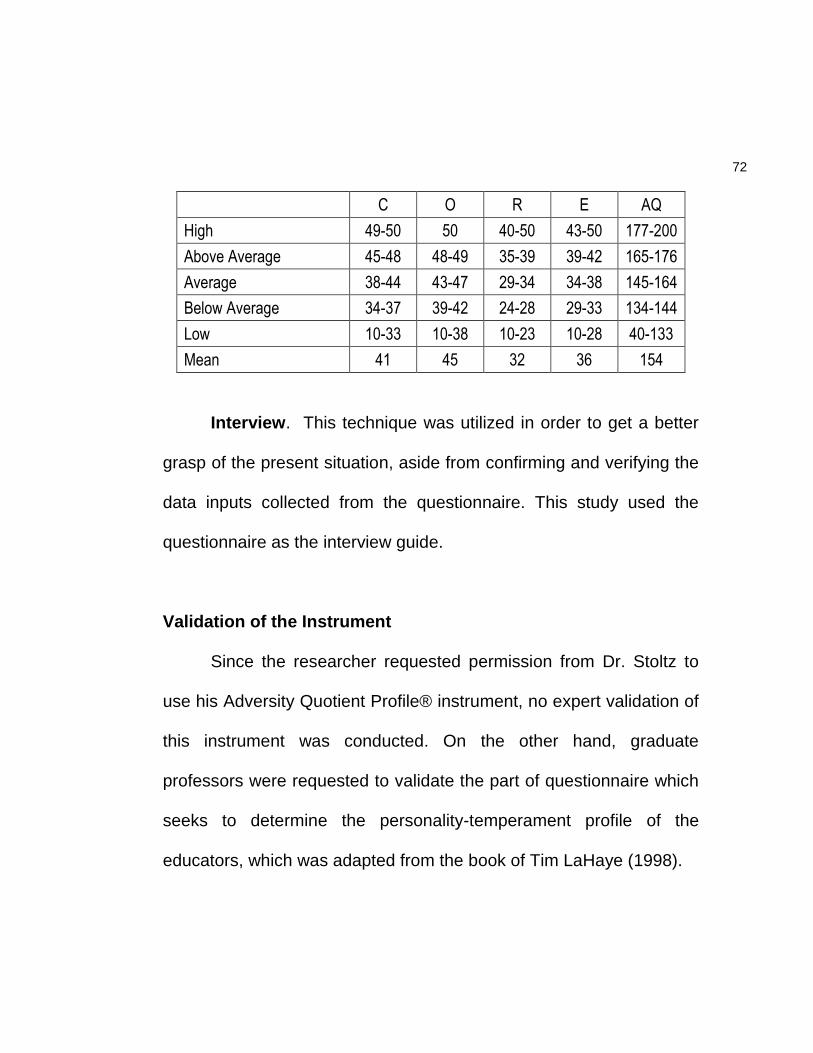
72
C O R E AQ
High 49-50 50 40-50 43-50 177-200
Above Average 45-48 48-49 35-39 39-42 165-176
Average 38-44 43-47 29-34 34-38 145-164
Below Average 34-37 39-42 24-28 29-33 134-144
Low 10-33 10-38 10-23 10-28 40-133
Mean 41 45 32 36 154
Interview. This technique was utilized in order to get a better
grasp of the present situation, aside from confirming and verifying the
data inputs collected from the questionnaire. This study used the
questionnaire as the interview guide.
Validation of the Instrument
Since the researcher requested permission from Dr. Stoltz to
use his Adversity Quotient Profile® instrument, no expert validation of
this instrument was conducted. On the other hand, graduate
professors were requested to validate the part of questionnaire which
seeks to determine the personality-temperament profile of the
educators, which was adapted from the book of Tim LaHaye (1998).
73
All comments and suggestions of the graduate professors were
incorporated in the final copy of the questionnaire. Then, the revised
questionnaire was reproduced and distributed to target respondents
of the study.
Data Gathering Procedures
Prior to the conduct of the study, the researcher secured the
permission of Dr. Paul Stoltz to use the Adversity Response Profile®
in measuring the Adversity Quotient® level of the respondents. After
approval of the request, the signing the Terms of Agreement was
done. The researcher prepared the letters of request for concerned
school administrators of the selected public and private institutions
seeking permission to conduct the study in the selected schools.
After approval of the request, the researcher personally
administered and retrieved the questionnaires from the target
respondents.
For the on-line survey (Adversity Quotient Profile®) a unique
URL given by PEAK Learning was provided to the respondents for
them to access the survey.
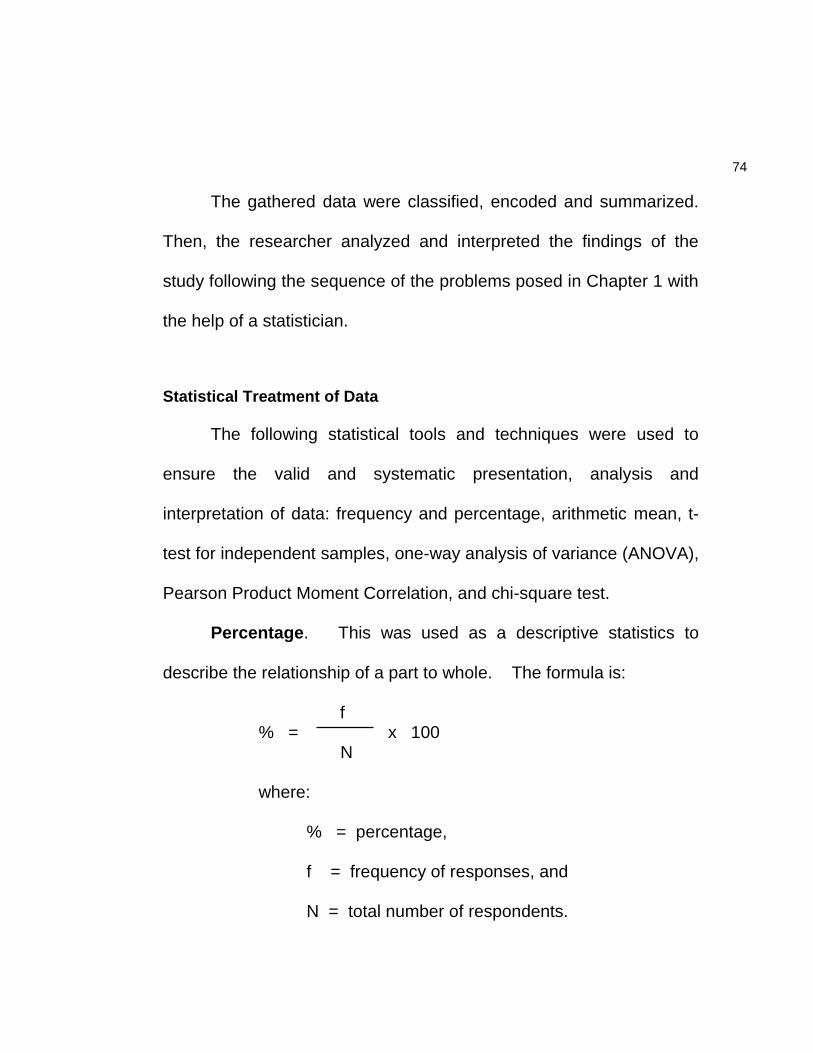
74
The gathered data were classified, encoded and summarized.
Then, the researcher analyzed and interpreted the findings of the
study following the sequence of the problems posed in Chapter 1 with
the help of a statistician.
Statistical Treatment of Data
The following statistical tools and techniques were used to
ensure the valid and systematic presentation, analysis and
interpretation of data: frequency and percentage, arithmetic mean, t-
test for independent samples, one-way analysis of variance (ANOVA),
Pearson Product Moment Correlation, and chi-square test.
Percentage. This was used as a descriptive statistics to
describe the relationship of a part to whole. The formula is:
f % = x 100 N where:
% = percentage,
f = frequency of responses, and
N = total number of respondents.
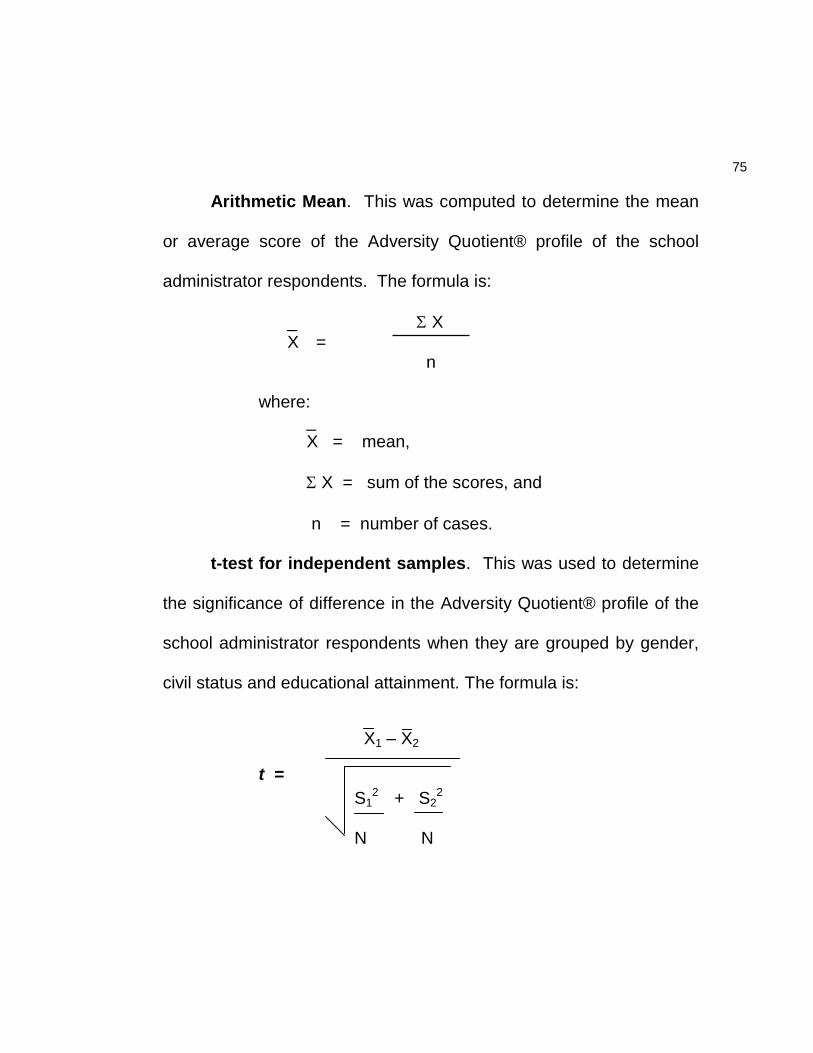
75
Arithmetic Mean. This was computed to determine the mean
or average score of the Adversity Quotient® profile of the school
administrator respondents. The formula is:
_ X X =
n
where: _ X = mean,
X = sum of the scores, and
n = number of cases.
t-test for independent samples. This was used to determine
the significance of difference in the Adversity Quotient® profile of the
school administrator respondents when they are grouped by gender,
civil status and educational attainment. The formula is:
X1 – X2
t =
S12 + S2
2 N N
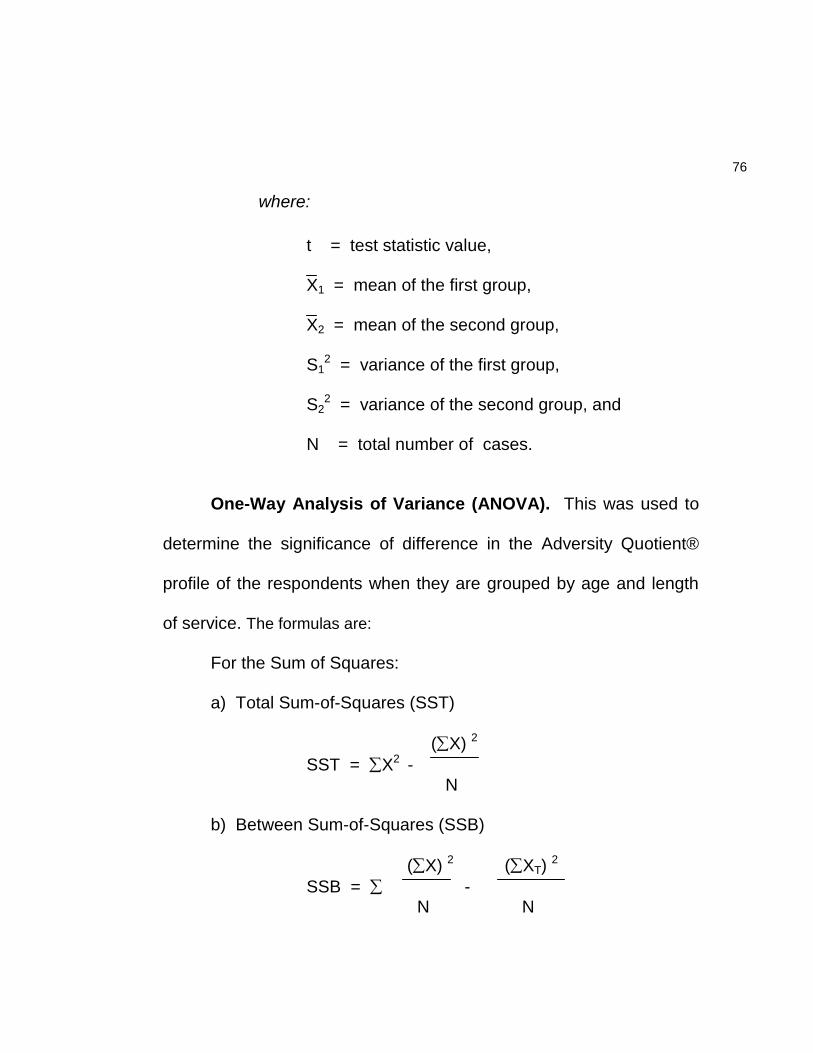
76
where:
t = test statistic value,
X1 = mean of the first group,
X2 = mean of the second group,
S12 = variance of the first group,
S22 = variance of the second group, and
N = total number of cases.
One-Way Analysis of Variance (ANOVA). This was used to
determine the significance of difference in the Adversity Quotient®
profile of the respondents when they are grouped by age and length
of service. The formulas are:
For the Sum of Squares:
a) Total Sum-of-Squares (SST)
(X) 2
SST = X2 - N b) Between Sum-of-Squares (SSB)
(X) 2 (XT) 2
SSB = - N N
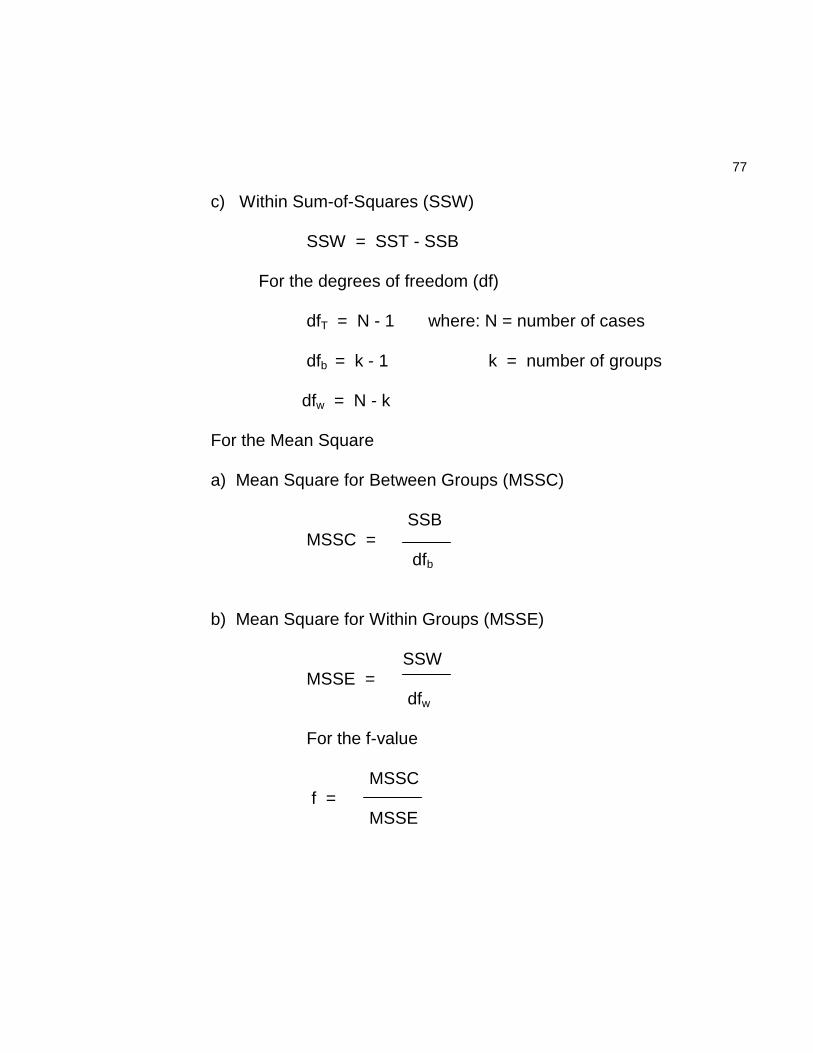
77
c) Within Sum-of-Squares (SSW)
SSW = SST - SSB
For the degrees of freedom (df)
dfT = N - 1 where: N = number of cases
dfb = k - 1 k = number of groups
dfw = N - k
For the Mean Square
a) Mean Square for Between Groups (MSSC)
SSB MSSC = dfb b) Mean Square for Within Groups (MSSE)
SSW MSSE = dfw For the f-value MSSC f = MSSE
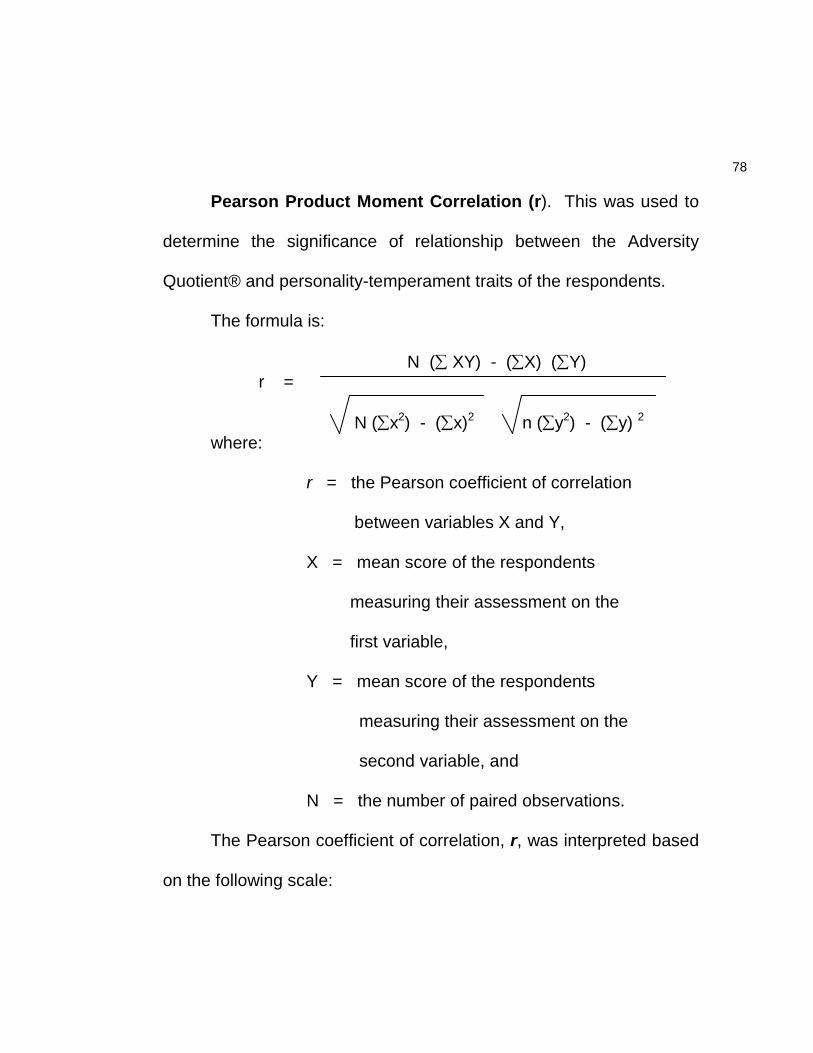
78
Pearson Product Moment Correlation (r). This was used to
determine the significance of relationship between the Adversity
Quotient® and personality-temperament traits of the respondents.
The formula is:
N ( XY) - (X) (Y) r =
N (x2) - (x)2 n (y2) - (y) 2 where:
r = the Pearson coefficient of correlation
between variables X and Y,
X = mean score of the respondents
measuring their assessment on the
first variable,
Y = mean score of the respondents
measuring their assessment on the
second variable, and
N = the number of paired observations.
The Pearson coefficient of correlation, r, was interpreted based
on the following scale:
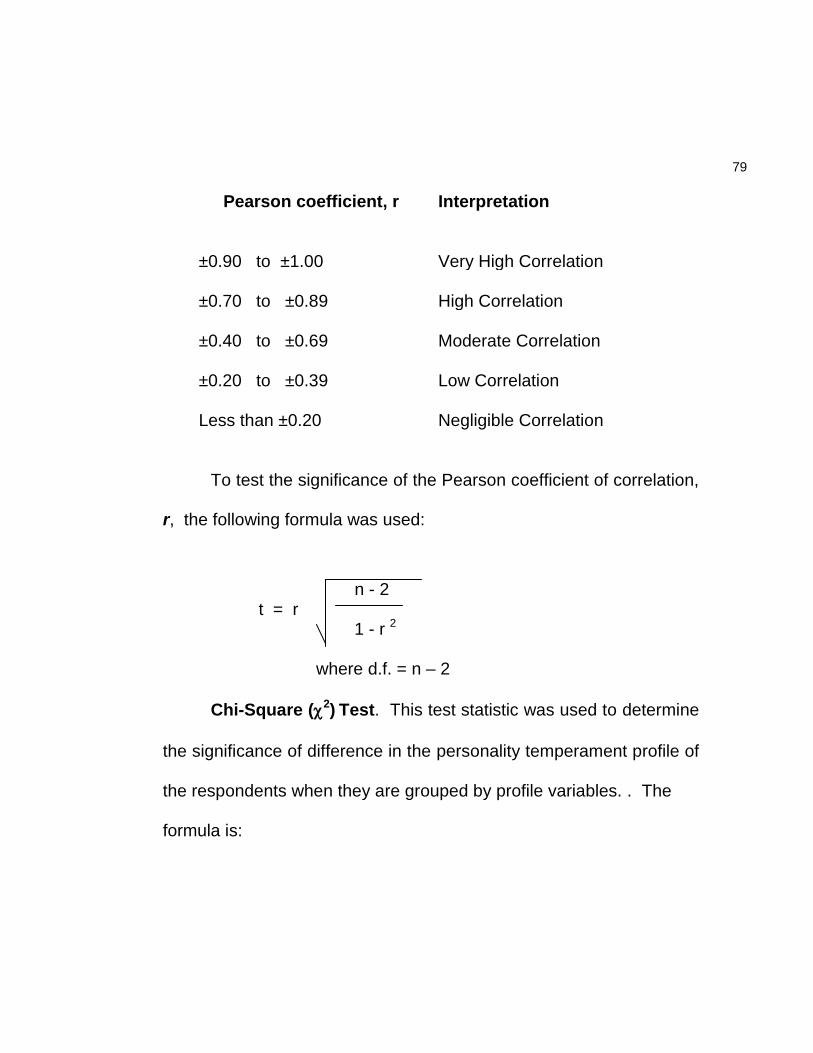
79
Pearson coefficient, r Interpretation
±0.90 to ±1.00
Very High Correlation
±0.70 to ±0.89
High Correlation
±0.40 to ±0.69
Moderate Correlation
±0.20 to ±0.39
Low Correlation
Less than ±0.20
Negligible Correlation
To test the significance of the Pearson coefficient of correlation,
r, the following formula was used:
n - 2 t = r 1 - r 2
where d.f. = n – 2
Chi-Square (2) Test. This test statistic was used to determine
the significance of difference in the personality temperament profile of
the respondents when they are grouped by profile variables. . The
formula is:
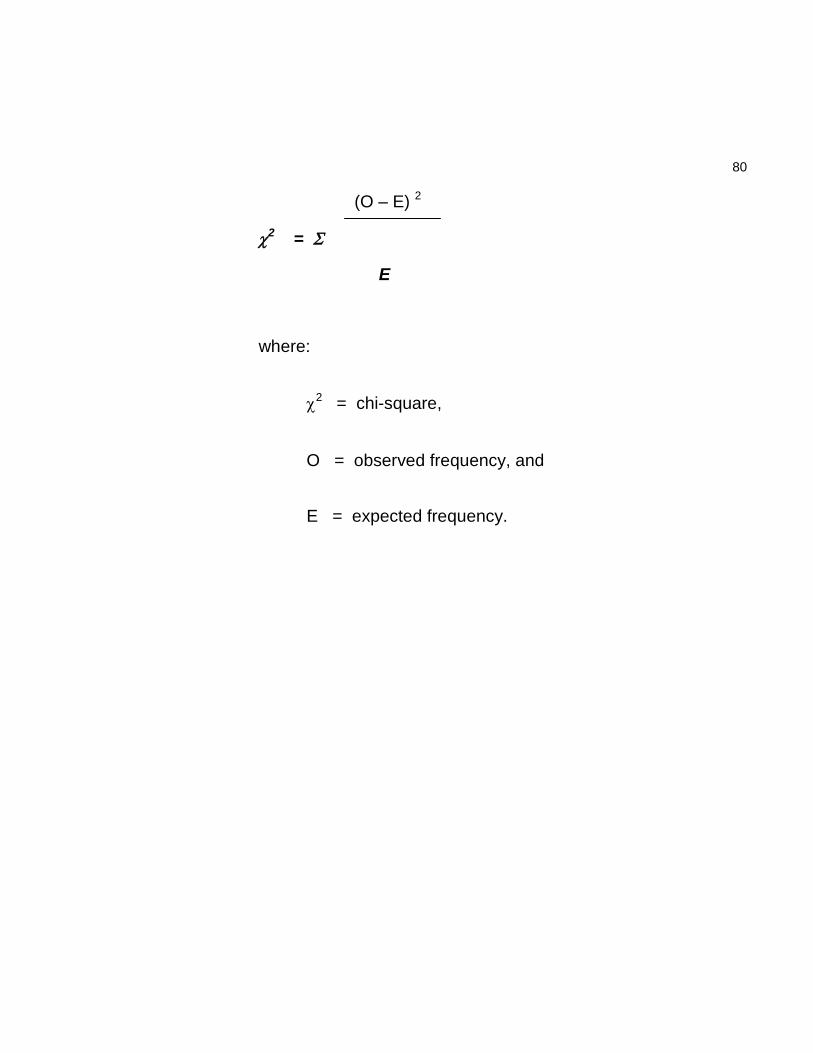
80
(O – E) 2
2 =
E
where:
2 = chi-square,
O = observed frequency, and
E = expected frequency.
81
CHAPTER 4
PRESENTATION, ANALYSIS AND INTERPRETATION OF DATA
This chapter presents, analyzes, and interprets the data
gathered from the survey questionnaire which focused on the
interrelationship among the Adversity Quotient®, personal
characteristics and personality-temperament traits of educators in
selected public and private educational institutions. The findings of
the study are organized into six parts.
The first part shows the profile of the educator respondents in
terms of gender, age, civil status, educational attainment and length
of service.
Part two describes the Adversity Quotient® Profile of the
educator respondents as measured by the following dimensions:
control, ownership, reach, and endurance. The third part depicts the
personality temperament profile of the educator respondents.
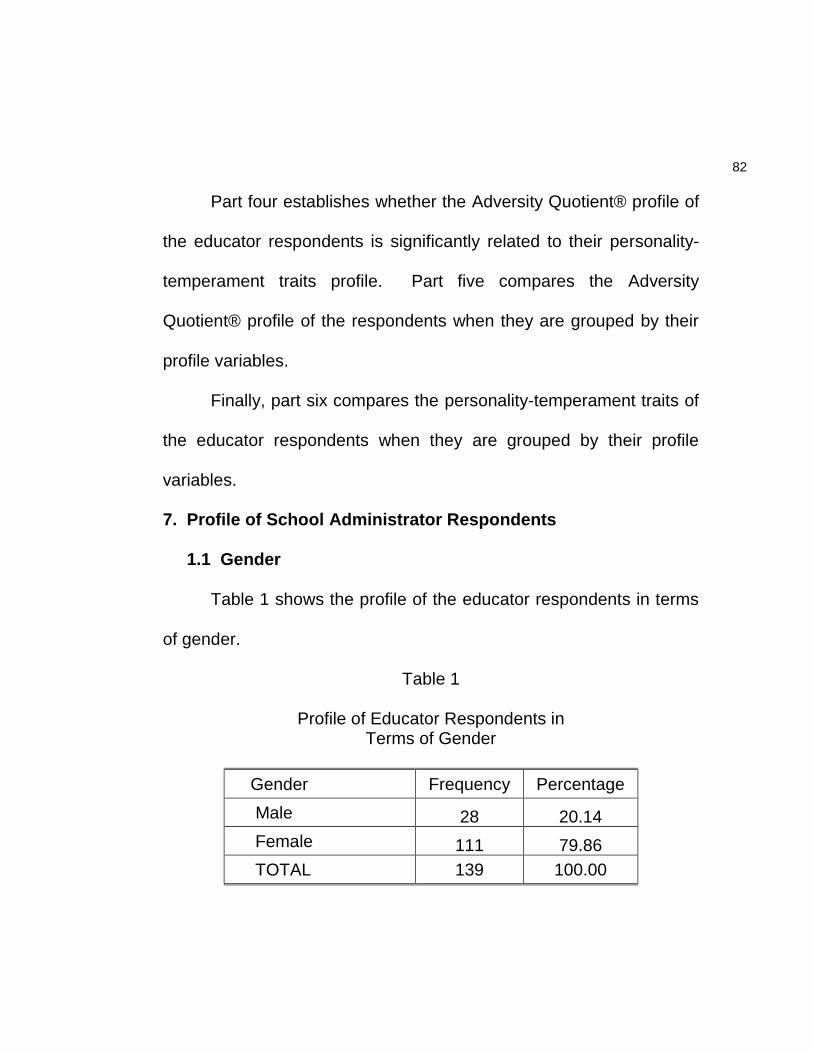
82
Part four establishes whether the Adversity Quotient® profile of
the educator respondents is significantly related to their personality-
temperament traits profile. Part five compares the Adversity
Quotient® profile of the respondents when they are grouped by their
profile variables.
Finally, part six compares the personality-temperament traits of
the educator respondents when they are grouped by their profile
variables.
7. Profile of School Administrator Respondents
1.1 Gender
Table 1 shows the profile of the educator respondents in terms
of gender.
Table 1
Profile of Educator Respondents in Terms of Gender
Gender Frequency Percentage
Male 28 20.14
Female 111 79.86
TOTAL 139 100.00
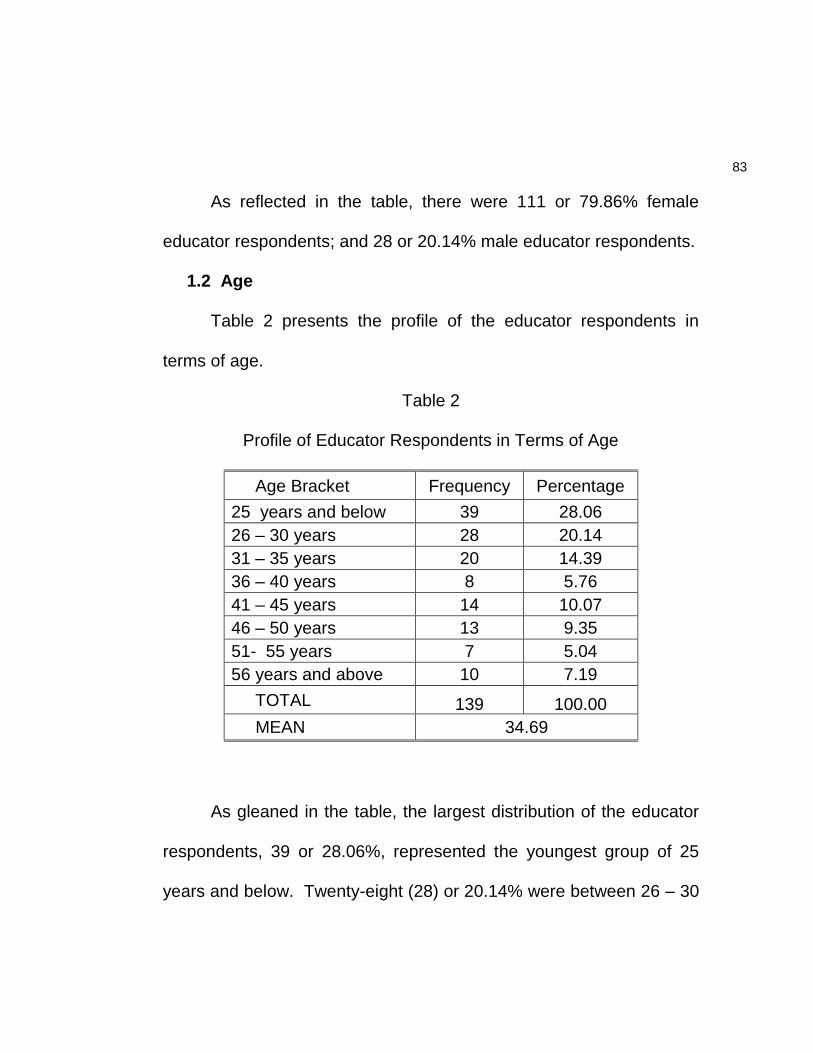
83
As reflected in the table, there were 111 or 79.86% female
educator respondents; and 28 or 20.14% male educator respondents.
1.2 Age
Table 2 presents the profile of the educator respondents in
terms of age.
Table 2
Profile of Educator Respondents in Terms of Age
Age Bracket Frequency Percentage
25 years and below 39 28.06
26 – 30 years 28 20.14
31 – 35 years 20 14.39
36 – 40 years 8 5.76
41 – 45 years 14 10.07
46 – 50 years 13 9.35
51- 55 years 7 5.04
56 years and above 10 7.19
TOTAL 139 100.00
MEAN 34.69
As gleaned in the table, the largest distribution of the educator
respondents, 39 or 28.06%, represented the youngest group of 25
years and below. Twenty-eight (28) or 20.14% were between 26 – 30
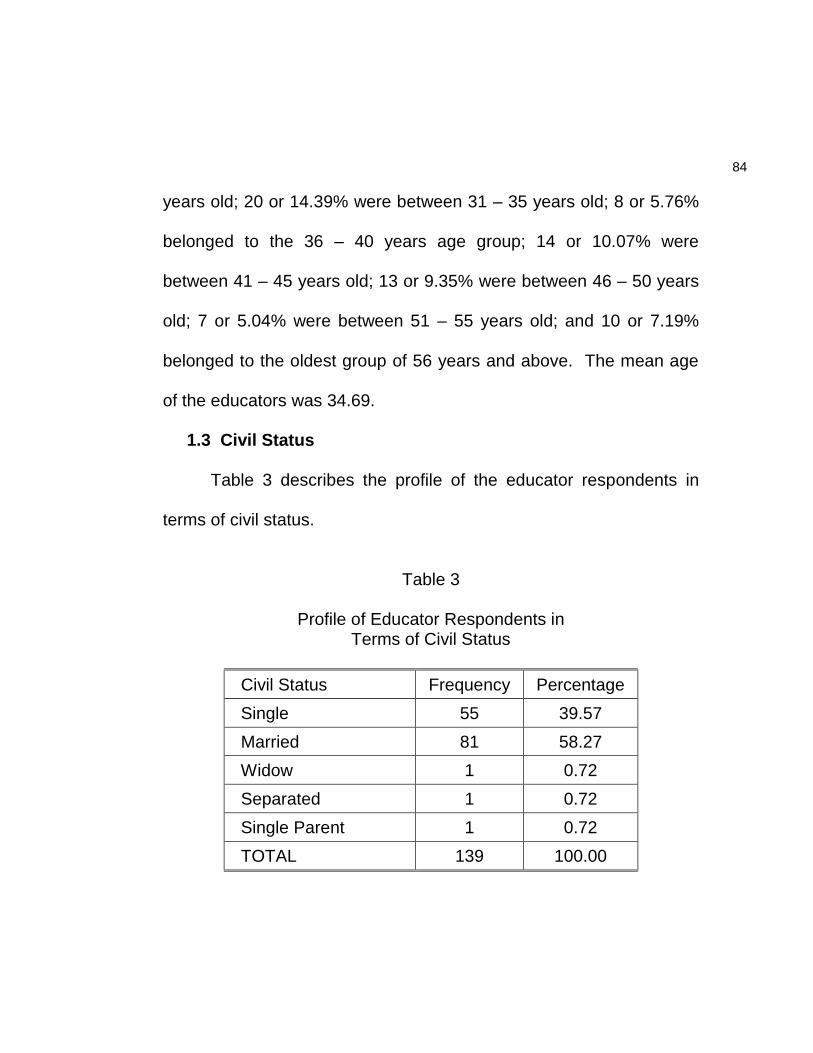
84
years old; 20 or 14.39% were between 31 – 35 years old; 8 or 5.76%
belonged to the 36 – 40 years age group; 14 or 10.07% were
between 41 – 45 years old; 13 or 9.35% were between 46 – 50 years
old; 7 or 5.04% were between 51 – 55 years old; and 10 or 7.19%
belonged to the oldest group of 56 years and above. The mean age
of the educators was 34.69.
1.3 Civil Status
Table 3 describes the profile of the educator respondents in
terms of civil status.
Table 3
Profile of Educator Respondents in
Terms of Civil Status
Civil Status Frequency Percentage
Single 55 39.57
Married 81 58.27
Widow 1 0.72
Separated 1 0.72
Single Parent 1 0.72
TOTAL 139 100.00
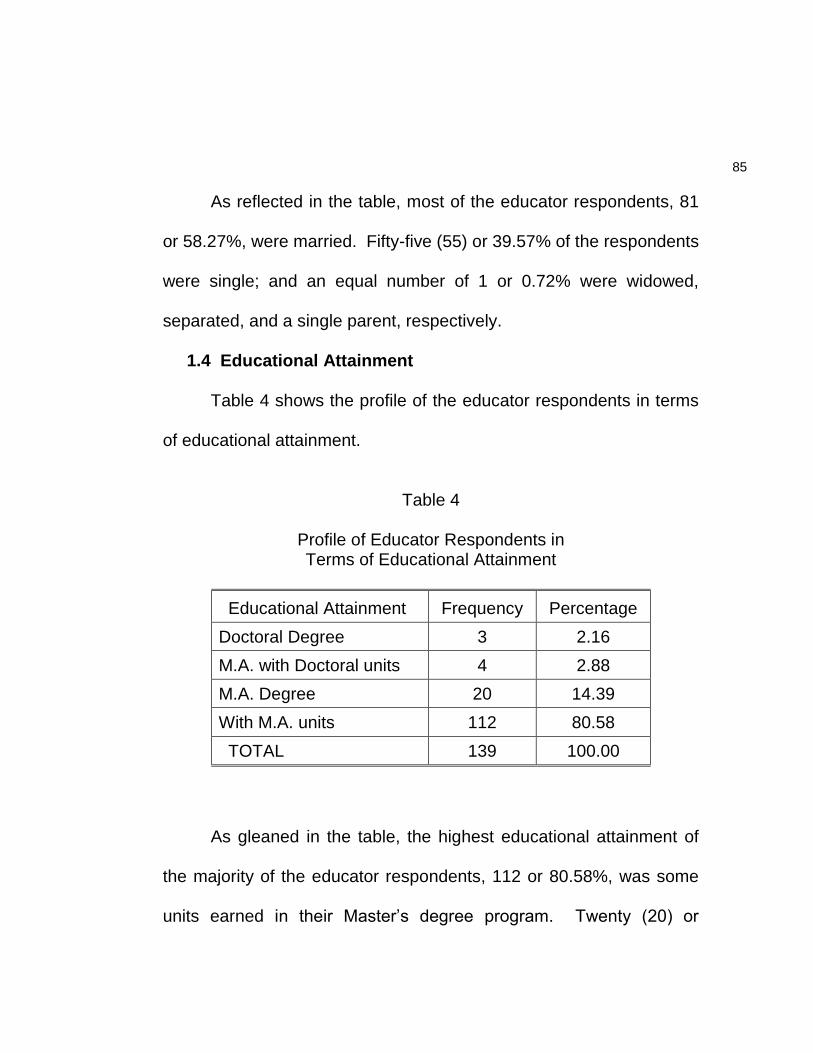
85
As reflected in the table, most of the educator respondents, 81
or 58.27%, were married. Fifty-five (55) or 39.57% of the respondents
were single; and an equal number of 1 or 0.72% were widowed,
separated, and a single parent, respectively.
1.4 Educational Attainment
Table 4 shows the profile of the educator respondents in terms
of educational attainment.
Table 4
Profile of Educator Respondents in Terms of Educational Attainment
Educational Attainment Frequency Percentage
Doctoral Degree 3 2.16
M.A. with Doctoral units 4 2.88
M.A. Degree 20 14.39
With M.A. units 112 80.58
TOTAL 139 100.00
As gleaned in the table, the highest educational attainment of
the majority of the educator respondents, 112 or 80.58%, was some
units earned in their Master’s degree program. Twenty (20) or
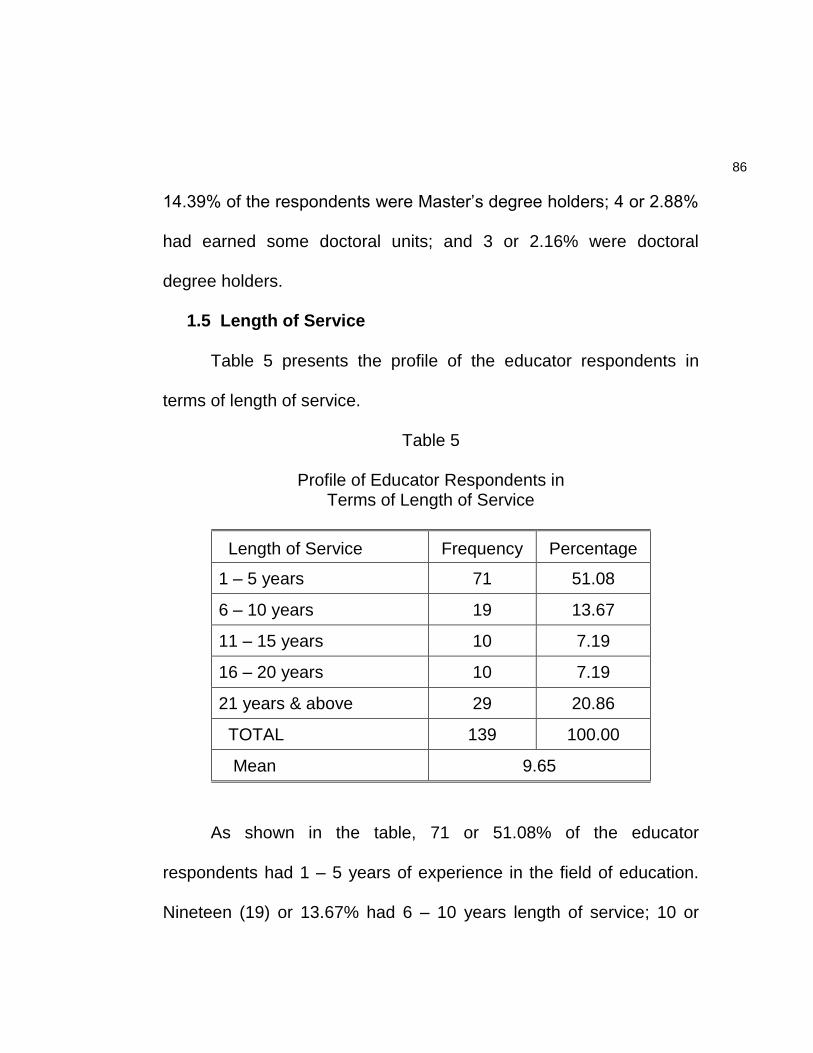
86
14.39% of the respondents were Master’s degree holders; 4 or 2.88%
had earned some doctoral units; and 3 or 2.16% were doctoral
degree holders.
1.5 Length of Service
Table 5 presents the profile of the educator respondents in
terms of length of service.
Table 5
Profile of Educator Respondents in Terms of Length of Service
Length of Service Frequency Percentage
1 – 5 years 71 51.08
6 – 10 years 19 13.67
11 – 15 years 10 7.19
16 – 20 years 10 7.19
21 years & above 29 20.86
TOTAL 139 100.00
Mean 9.65
As shown in the table, 71 or 51.08% of the educator
respondents had 1 – 5 years of experience in the field of education.
Nineteen (19) or 13.67% had 6 – 10 years length of service; 10 or
87
7.19% had 11 – 15 years length of service; and another 10 or 7.19%
had 16 – 20 years length of service. School administrators with the
longest years of service of 21 years and above numbered 29 or
20.86%. The mean length of service of the school administrators was
9.65 years.
Based on the findings in Tables 1 to 5, the educator
respondents can be described as mostly female, in their mid-thirties,
and married. They have pursued post-graduate studies and most
have around ten years of work experience in the field of education.
8. Adversity Quotient of Respondents
8.1 Control
Table 6 shows the Adversity Quotient® profile of the educator
respondents in terms of the control dimension.
As reflected in the table, 6 or 4.32% of the educator
respondents scored “above average” and 47 or 33.81% scored
“average in the control dimension. However, the larger distribution of
the respondents scored below average with 48 or 34.53% educator. A
considerable number, 38 or 27.34%, scored low in this dimension.
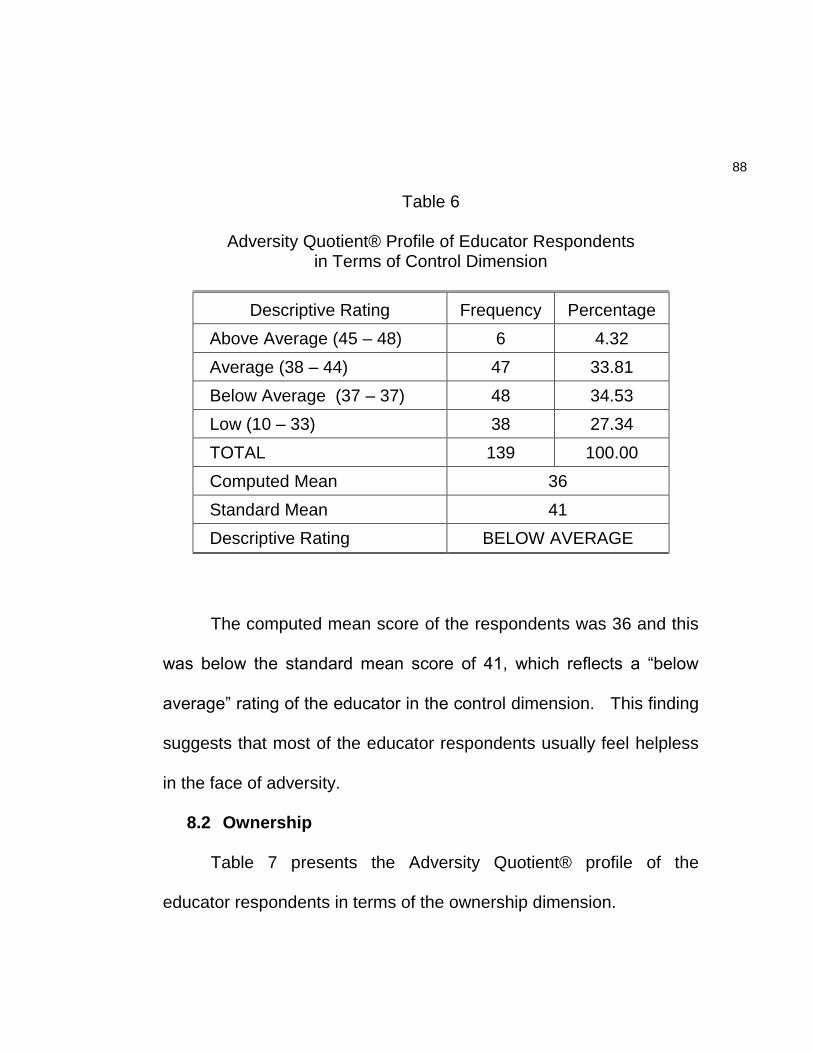
88
Table 6
Adversity Quotient® Profile of Educator Respondents in Terms of Control Dimension
Descriptive Rating Frequency Percentage
Above Average (45 – 48) 6 4.32
Average (38 – 44) 47 33.81
Below Average (37 – 37) 48 34.53
Low (10 – 33) 38 27.34
TOTAL 139 100.00
Computed Mean 36
Standard Mean 41
Descriptive Rating BELOW AVERAGE
The computed mean score of the respondents was 36 and this
was below the standard mean score of 41, which reflects a “below
average” rating of the educator in the control dimension. This finding
suggests that most of the educator respondents usually feel helpless
in the face of adversity.
8.2 Ownership
Table 7 presents the Adversity Quotient® profile of the
educator respondents in terms of the ownership dimension.
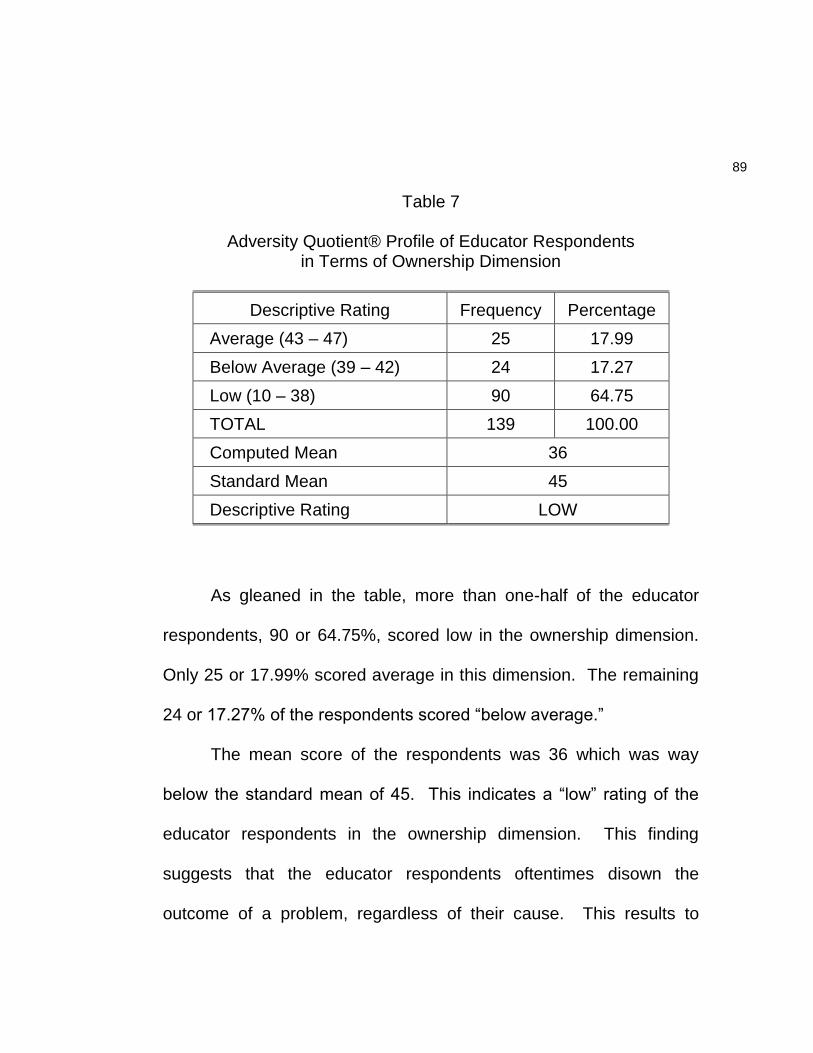
89
Table 7
Adversity Quotient® Profile of Educator Respondents in Terms of Ownership Dimension
Descriptive Rating Frequency Percentage
Average (43 – 47) 25 17.99
Below Average (39 – 42) 24 17.27
Low (10 – 38) 90 64.75
TOTAL 139 100.00
Computed Mean 36
Standard Mean 45
Descriptive Rating LOW
As gleaned in the table, more than one-half of the educator
respondents, 90 or 64.75%, scored low in the ownership dimension.
Only 25 or 17.99% scored average in this dimension. The remaining
24 or 17.27% of the respondents scored “below average.”
The mean score of the respondents was 36 which was way
below the standard mean of 45. This indicates a “low” rating of the
educator respondents in the ownership dimension. This finding
suggests that the educator respondents oftentimes disown the
outcome of a problem, regardless of their cause. This results to
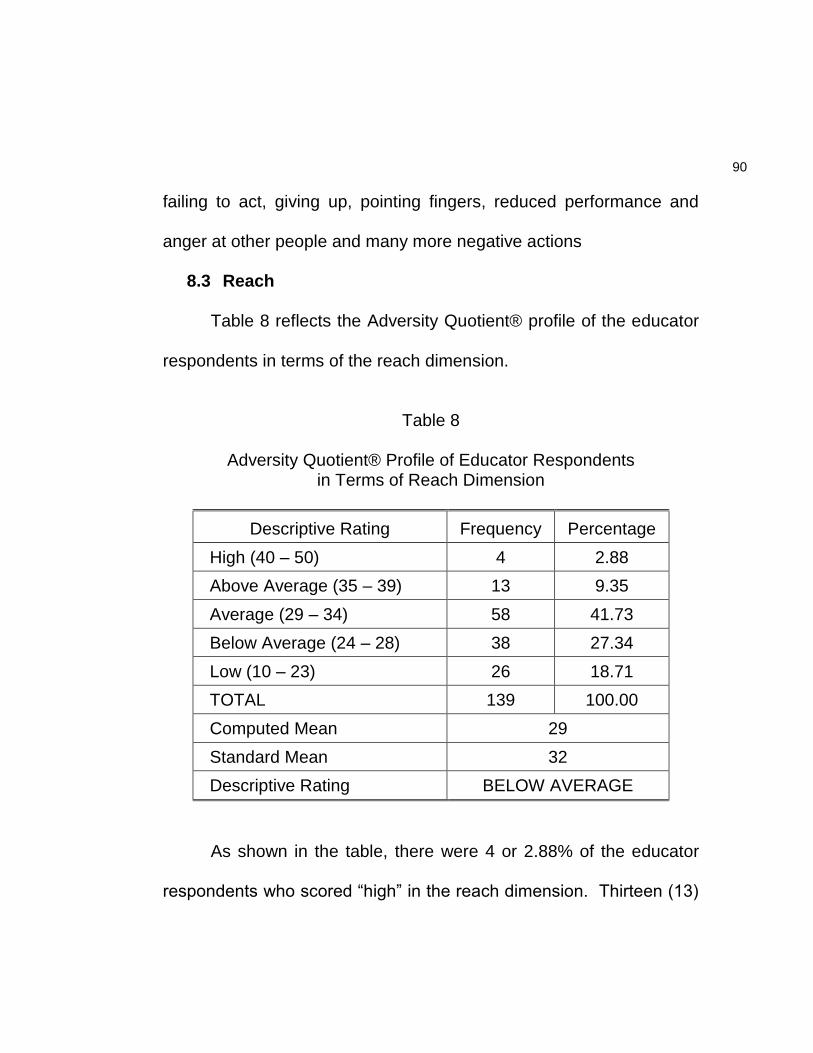
90
failing to act, giving up, pointing fingers, reduced performance and
anger at other people and many more negative actions
8.3 Reach
Table 8 reflects the Adversity Quotient® profile of the educator
respondents in terms of the reach dimension.
Table 8
Adversity Quotient® Profile of Educator Respondents in Terms of Reach Dimension
Descriptive Rating Frequency Percentage
High (40 – 50) 4 2.88
Above Average (35 – 39) 13 9.35
Average (29 – 34) 58 41.73
Below Average (24 – 28) 38 27.34
Low (10 – 23) 26 18.71
TOTAL 139 100.00
Computed Mean 29
Standard Mean 32
Descriptive Rating BELOW AVERAGE
As shown in the table, there were 4 or 2.88% of the educator
respondents who scored “high” in the reach dimension. Thirteen (13)
91
or 9.35% scored “above average” and 58 or 41.73% scored
“average.” On the other hand, 38 or 27.34% of the respondents
scored “below average” and 26 or 18.71% scored “low.”
The mean score of the educator respondents was 29 and this
was below the standard mean of 32. This denotes a “below average”
rating of the respondents in the reach dimension, which infer that
most of the educator respondents often allow problems/adversities
they face to affect other aspects of their lives often leading to panic
and poor decision-making.
8.4 Endurance
Table 9 shows the Adversity Quotient® profile of the educator
respondents in terms of the endurance dimension.
The scores of 11 or 7.91% of the educator in the endurance
dimension had a “high” descriptive rating. Fifteen (15) or 10.795 of
the respondents scored “above average”; and 43 or 30.94% scored
“average” in this dimension.
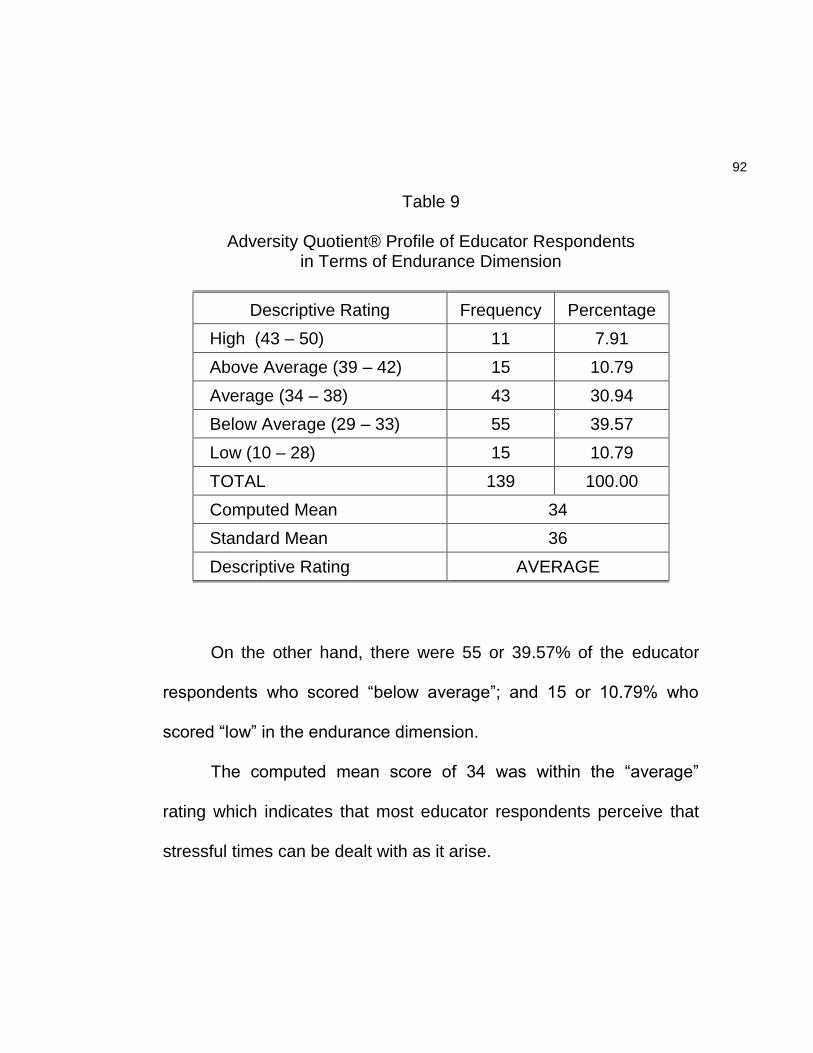
92
Table 9
Adversity Quotient® Profile of Educator Respondents in Terms of Endurance Dimension
Descriptive Rating Frequency Percentage
High (43 – 50) 11 7.91
Above Average (39 – 42) 15 10.79
Average (34 – 38) 43 30.94
Below Average (29 – 33) 55 39.57
Low (10 – 28) 15 10.79
TOTAL 139 100.00
Computed Mean 34
Standard Mean 36
Descriptive Rating AVERAGE
On the other hand, there were 55 or 39.57% of the educator
respondents who scored “below average”; and 15 or 10.79% who
scored “low” in the endurance dimension.
The computed mean score of 34 was within the “average”
rating which indicates that most educator respondents perceive that
stressful times can be dealt with as it arise.
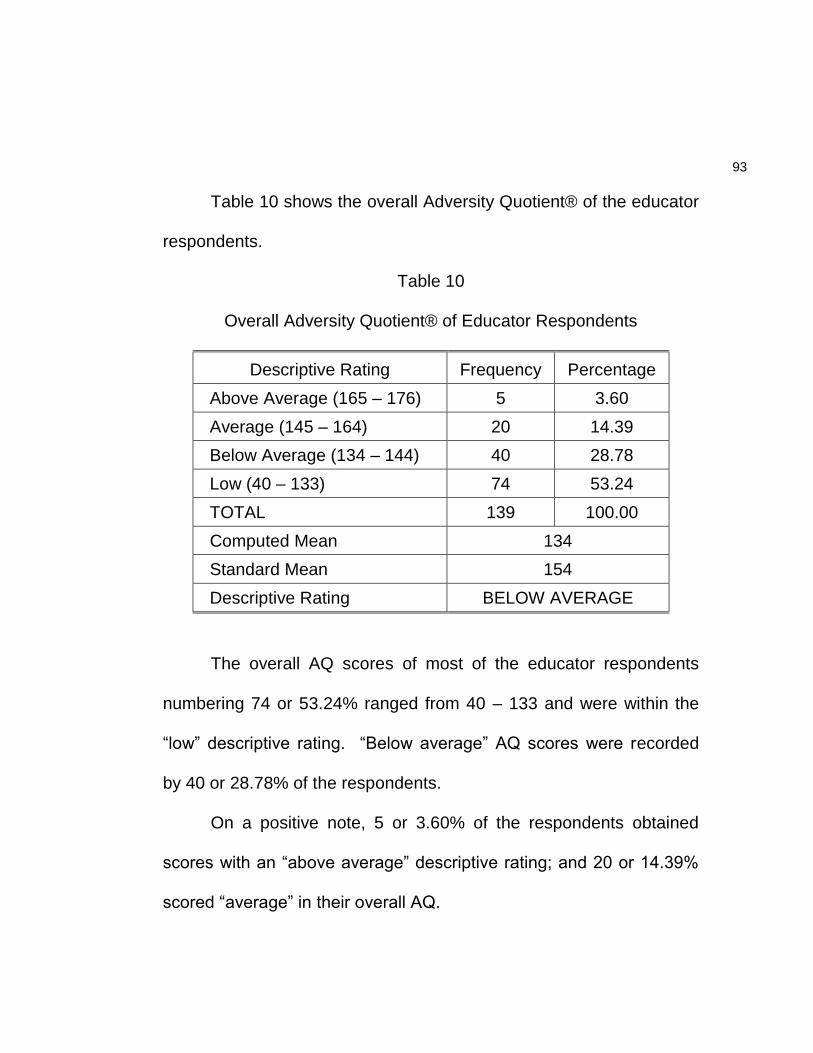
93
Table 10 shows the overall Adversity Quotient® of the educator
respondents.
Table 10
Overall Adversity Quotient® of Educator Respondents
Descriptive Rating Frequency Percentage
Above Average (165 – 176) 5 3.60
Average (145 – 164) 20 14.39
Below Average (134 – 144) 40 28.78
Low (40 – 133) 74 53.24
TOTAL 139 100.00
Computed Mean 134
Standard Mean 154
Descriptive Rating BELOW AVERAGE
The overall AQ scores of most of the educator respondents
numbering 74 or 53.24% ranged from 40 – 133 and were within the
“low” descriptive rating. “Below average” AQ scores were recorded
by 40 or 28.78% of the respondents.
On a positive note, 5 or 3.60% of the respondents obtained
scores with an “above average” descriptive rating; and 20 or 14.39%
scored “average” in their overall AQ.
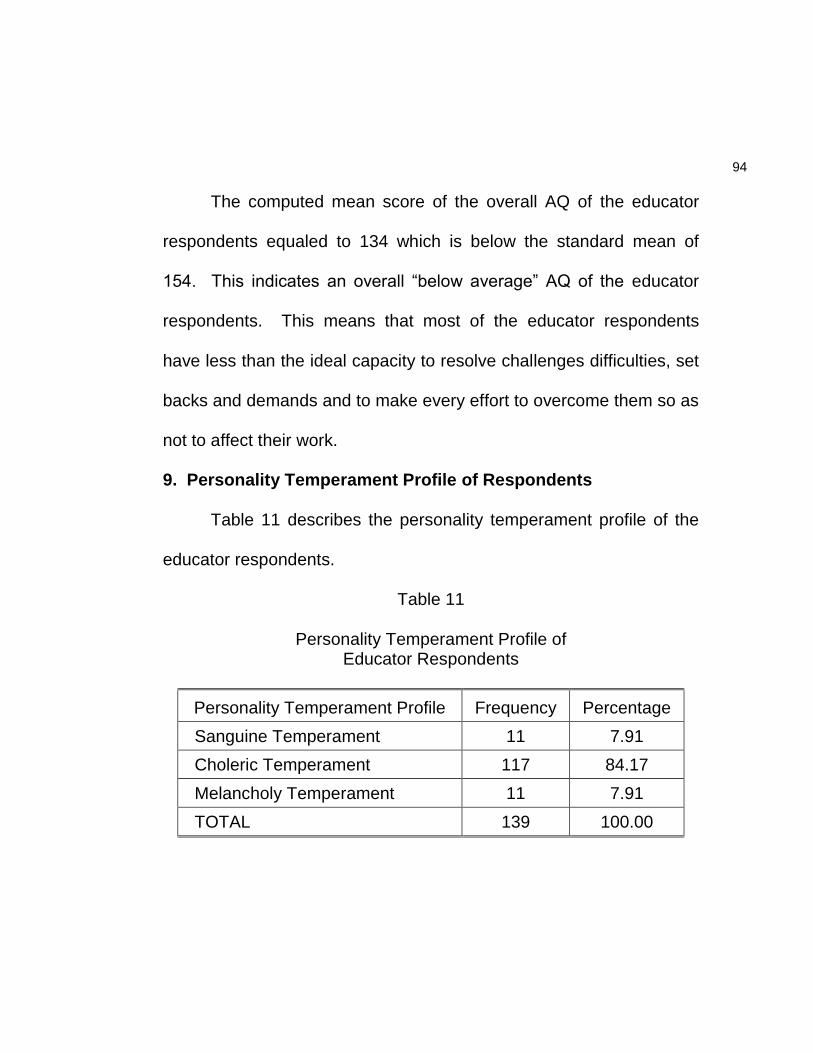
94
The computed mean score of the overall AQ of the educator
respondents equaled to 134 which is below the standard mean of
154. This indicates an overall “below average” AQ of the educator
respondents. This means that most of the educator respondents
have less than the ideal capacity to resolve challenges difficulties, set
backs and demands and to make every effort to overcome them so as
not to affect their work.
9. Personality Temperament Profile of Respondents
Table 11 describes the personality temperament profile of the
educator respondents.
Table 11
Personality Temperament Profile of Educator Respondents
Personality Temperament Profile Frequency Percentage
Sanguine Temperament 11 7.91
Choleric Temperament 117 84.17
Melancholy Temperament 11 7.91
TOTAL 139 100.00
95
As shown in the table, the educator respondents demonstrated
only three primary personality temperaments. Most of the educator,
117 or 84.17%, had a choleric temperament.
Eleven (11) or 7.91% had a sanguine temperament; and
another 11 or 7.91% had a melancholy temperament.
It can be deduced that most of the educator respondents are
fundamentally ambitious and leader-like, which are distinguishing
traits of cholerics.
10. Relationship Between Adversity Quotient and
Personality-Temperament Traits of Respondents
Table 12 shows the results in correlating the adversity quotient
and personality temperament traits of educator respondents with
sanguine temperament.
In correlating the AQ and personality-temperament traits of the
11 educator respondents with sanguine temperament, the r –values
of 0.065, 0.120 and 0.180 were computed in terms of the control,
reach and endurance dimensions, respectively. These data denote
negligible correlations which were supported by the corresponding
computed t-values of 0.196, 0.362 and 0.546,
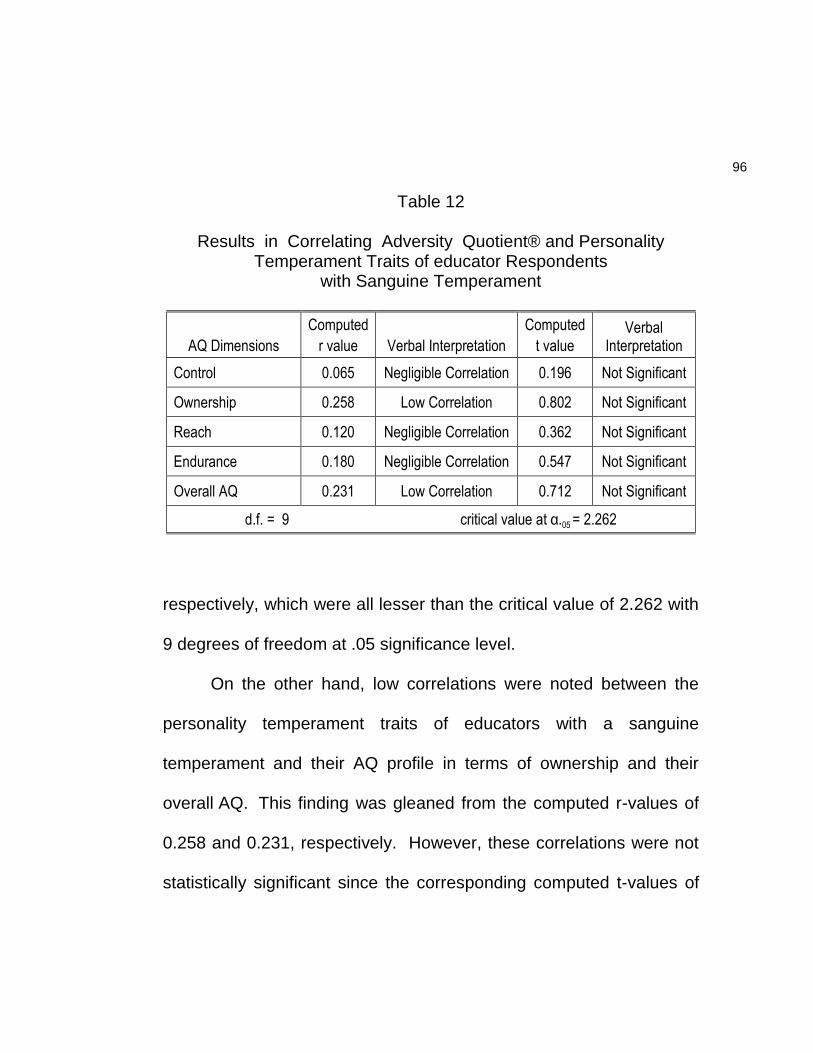
96
Table 12
Results in Correlating Adversity Quotient® and Personality Temperament Traits of educator Respondents
with Sanguine Temperament
AQ Dimensions
Computed
r value Verbal Interpretation
Computed
t value Verbal
Interpretation
Control 0.065 Negligible Correlation 0.196 Not Significant
Ownership 0.258 Low Correlation 0.802 Not Significant
Reach 0.120 Negligible Correlation 0.362 Not Significant
Endurance 0.180 Negligible Correlation 0.547 Not Significant
Overall AQ 0.231 Low Correlation 0.712 Not Significant
d.f. = 9 critical value at α.05 = 2.262
respectively, which were all lesser than the critical value of 2.262 with
9 degrees of freedom at .05 significance level.
On the other hand, low correlations were noted between the
personality temperament traits of educators with a sanguine
temperament and their AQ profile in terms of ownership and their
overall AQ. This finding was gleaned from the computed r-values of
0.258 and 0.231, respectively. However, these correlations were not
statistically significant since the corresponding computed t-values of
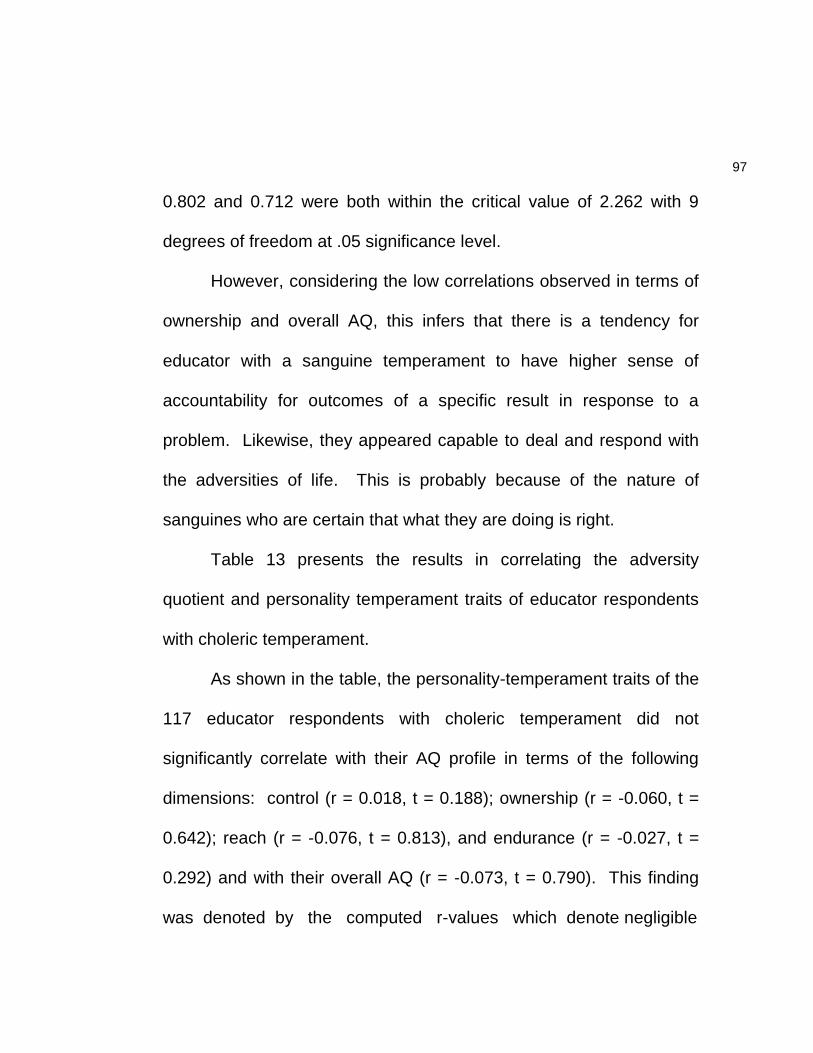
97
0.802 and 0.712 were both within the critical value of 2.262 with 9
degrees of freedom at .05 significance level.
However, considering the low correlations observed in terms of
ownership and overall AQ, this infers that there is a tendency for
educator with a sanguine temperament to have higher sense of
accountability for outcomes of a specific result in response to a
problem. Likewise, they appeared capable to deal and respond with
the adversities of life. This is probably because of the nature of
sanguines who are certain that what they are doing is right.
Table 13 presents the results in correlating the adversity
quotient and personality temperament traits of educator respondents
with choleric temperament.
As shown in the table, the personality-temperament traits of the
117 educator respondents with choleric temperament did not
significantly correlate with their AQ profile in terms of the following
dimensions: control (r = 0.018, t = 0.188); ownership (r = -0.060, t =
0.642); reach (r = -0.076, t = 0.813), and endurance (r = -0.027, t =
0.292) and with their overall AQ (r = -0.073, t = 0.790). This finding
was denoted by the computed r-values which denote negligible
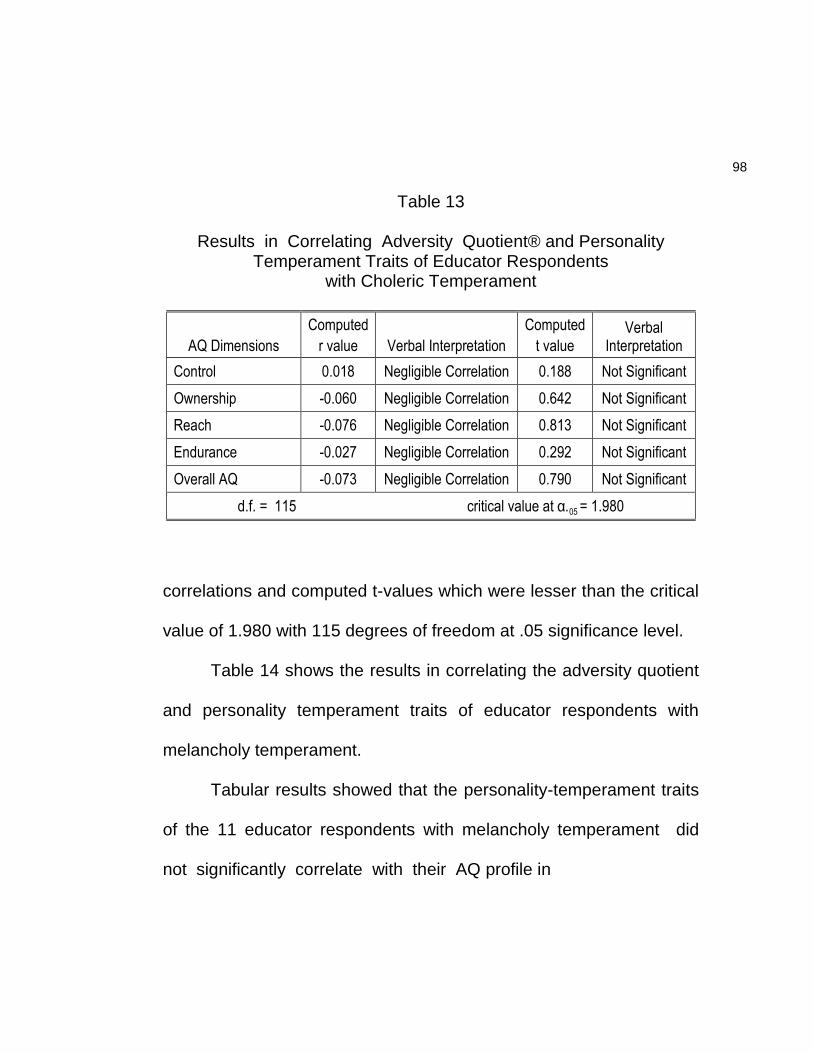
98
Table 13
Results in Correlating Adversity Quotient® and Personality Temperament Traits of Educator Respondents
with Choleric Temperament
AQ Dimensions
Computed
r value Verbal Interpretation
Computed
t value Verbal
Interpretation
Control 0.018 Negligible Correlation 0.188 Not Significant
Ownership -0.060 Negligible Correlation 0.642 Not Significant
Reach -0.076 Negligible Correlation 0.813 Not Significant
Endurance -0.027 Negligible Correlation 0.292 Not Significant
Overall AQ -0.073 Negligible Correlation 0.790 Not Significant
d.f. = 115 critical value at α.05 = 1.980
correlations and computed t-values which were lesser than the critical
value of 1.980 with 115 degrees of freedom at .05 significance level.
Table 14 shows the results in correlating the adversity quotient
and personality temperament traits of educator respondents with
melancholy temperament.
Tabular results showed that the personality-temperament traits
of the 11 educator respondents with melancholy temperament did
not significantly correlate with their AQ profile in
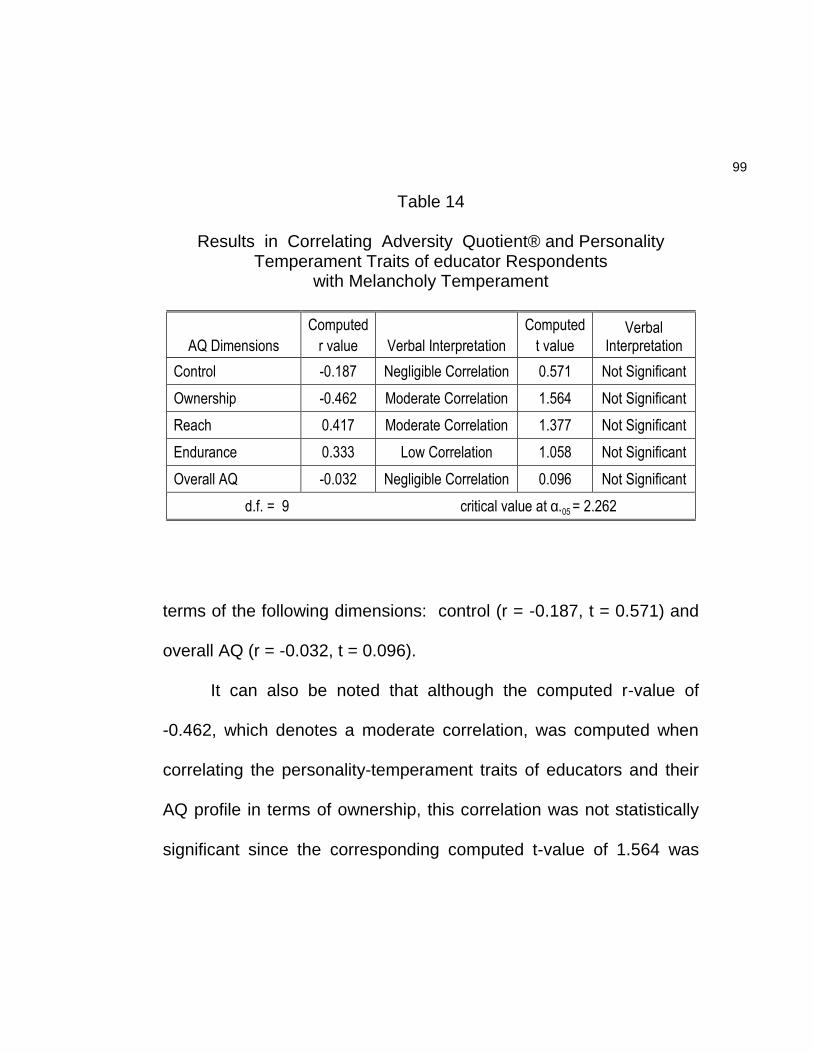
99
Table 14
Results in Correlating Adversity Quotient® and Personality Temperament Traits of educator Respondents
with Melancholy Temperament
AQ Dimensions
Computed
r value Verbal Interpretation
Computed
t value Verbal
Interpretation
Control -0.187 Negligible Correlation 0.571 Not Significant
Ownership -0.462 Moderate Correlation 1.564 Not Significant
Reach 0.417 Moderate Correlation 1.377 Not Significant
Endurance 0.333 Low Correlation 1.058 Not Significant
Overall AQ -0.032 Negligible Correlation 0.096 Not Significant
d.f. = 9 critical value at α.05 = 2.262
terms of the following dimensions: control (r = -0.187, t = 0.571) and
overall AQ (r = -0.032, t = 0.096).
It can also be noted that although the computed r-value of
-0.462, which denotes a moderate correlation, was computed when
correlating the personality-temperament traits of educators and their
AQ profile in terms of ownership, this correlation was not statistically
significant since the corresponding computed t-value of 1.564 was
100
lesser than the critical value of 2.262 with 9 degrees of freedom at .05
significance level.
A moderate correlation was also observed between the
personality-temperament traits of educators with melancholy
temperament and their AQ profile in terms of reach based on the
computed r-value of 0.417. However, this correlation was not
statistically significant since the corresponding computed t-value of
1.377 was lesser than the critical value of 2.262 with 9 degrees of
freedom at .05 significance level.
The same with correlating the personality-temperament traits of
educators with melancholy temperament and their AQ profile in terms
of endurance, a low correlation coefficient of 0.333 was computed,
but this was not statistically significant since the corresponding
computed t-value of 1.058 was lesser than the critical value of 2.262
with 9 degrees of freedom at .05 significance level.
Considering the strength of the correlations observed in the
findings, it can be inferred that there is tendency that educators who
are highly melancholic are more likely to disown the outcomes of an
adversity. On the other hand, these school administrators are more
101
capable to limit the reach of the problem to the event at hand and
tend to be quicker in perceiving and responding to adversities.
Based on the findings in Tables 12 to 14 wherein the
correlations observed were not statistically significant, the null
hypothesis of no significant relationship between the Adversity
Quotient® and personality-temperament traits of the respondents was
accepted. By and large, this infers that the personality-temperament
traits of school administrators who have a sanguine, choleric, and
melancholy temperaments did not significantly influence their AQ
profile and vice-versa.
11. Comparison of Adversity Quotient® Profile of
Respondents When They are Grouped by Profile Variables
Table 15 presents the t-test results in comparing the Adversity
Quotient® Profile of the educator respondents when they are grouped
by gender.
As shown in the table, no significant difference was observed in
the AQ profile of the educator respondents when they were grouped
by gender in terms of the following dimensions: control
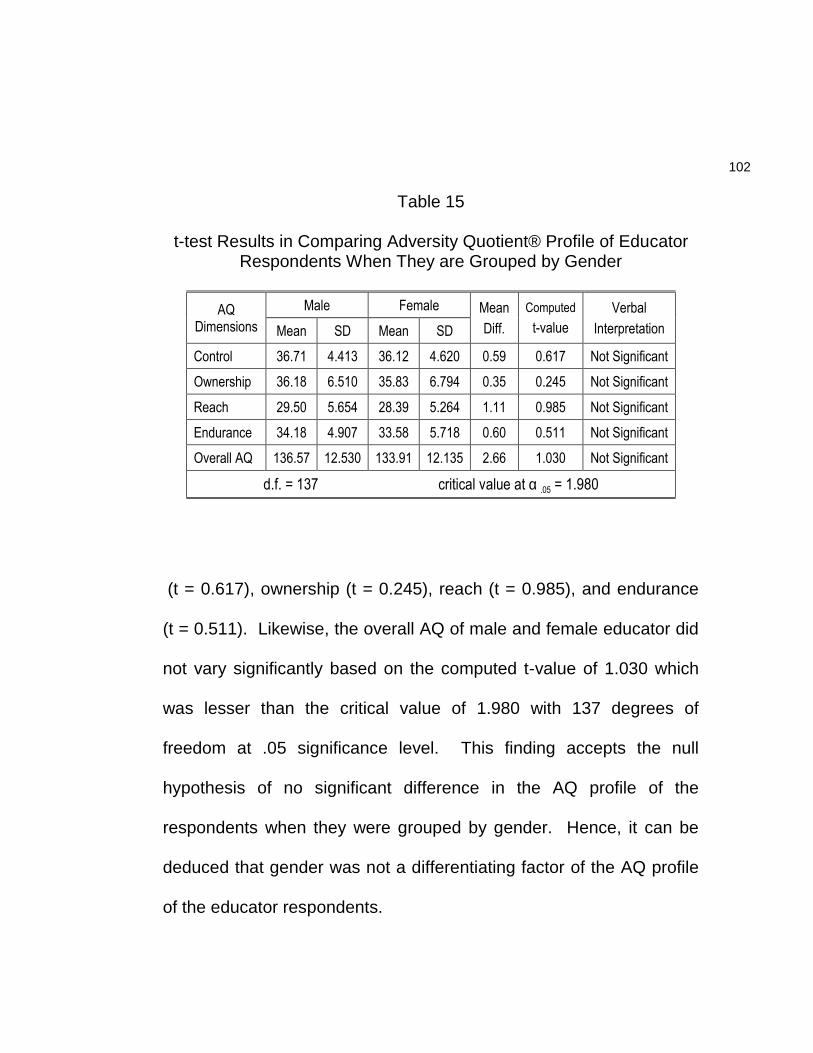
102
Table 15
t-test Results in Comparing Adversity Quotient® Profile of Educator Respondents When They are Grouped by Gender
AQ Dimensions
Male Female Mean
Diff.
Computed
t-value
Verbal
Interpretation Mean SD Mean SD
Control 36.71 4.413 36.12 4.620 0.59 0.617 Not Significant
Ownership 36.18 6.510 35.83 6.794 0.35 0.245 Not Significant
Reach 29.50 5.654 28.39 5.264 1.11 0.985 Not Significant
Endurance 34.18 4.907 33.58 5.718 0.60 0.511 Not Significant
Overall AQ 136.57 12.530 133.91 12.135 2.66 1.030 Not Significant
d.f. = 137 critical value at α .05 = 1.980
(t = 0.617), ownership (t = 0.245), reach (t = 0.985), and endurance
(t = 0.511). Likewise, the overall AQ of male and female educator did
not vary significantly based on the computed t-value of 1.030 which
was lesser than the critical value of 1.980 with 137 degrees of
freedom at .05 significance level. This finding accepts the null
hypothesis of no significant difference in the AQ profile of the
respondents when they were grouped by gender. Hence, it can be
deduced that gender was not a differentiating factor of the AQ profile
of the educator respondents.
103
Table 16 presents the ANOVA results in comparing the
Adversity Quotient® Profile of the educator respondents when they
are grouped by age.
Tabular results showed that the AQ profile of the educator did
not vary significantly when they were grouped by age. This finding
was denoted by the following computed F values which were within
the critical value of 3.06 with 2, 136 degrees of freedom: control (F =
0.705), ownership (F = 1.138), reach (F = 1.085), endurance (F =
0.710), and overall AQ (F = 0.588).
Based on the above finding, the null hypothesis of no significant
difference in the AQ profile of the respondents when they were
grouped by age was accepted. This finding implies that age was not
a differentiating factor of the AQ profile of the educator respondents.
Thus, regardless of age, educator have below average Adversity
Quotient®, which means that most often than not, they find it hard to
deal and respond with the adversities of life such as stress, difficulty
and problems.
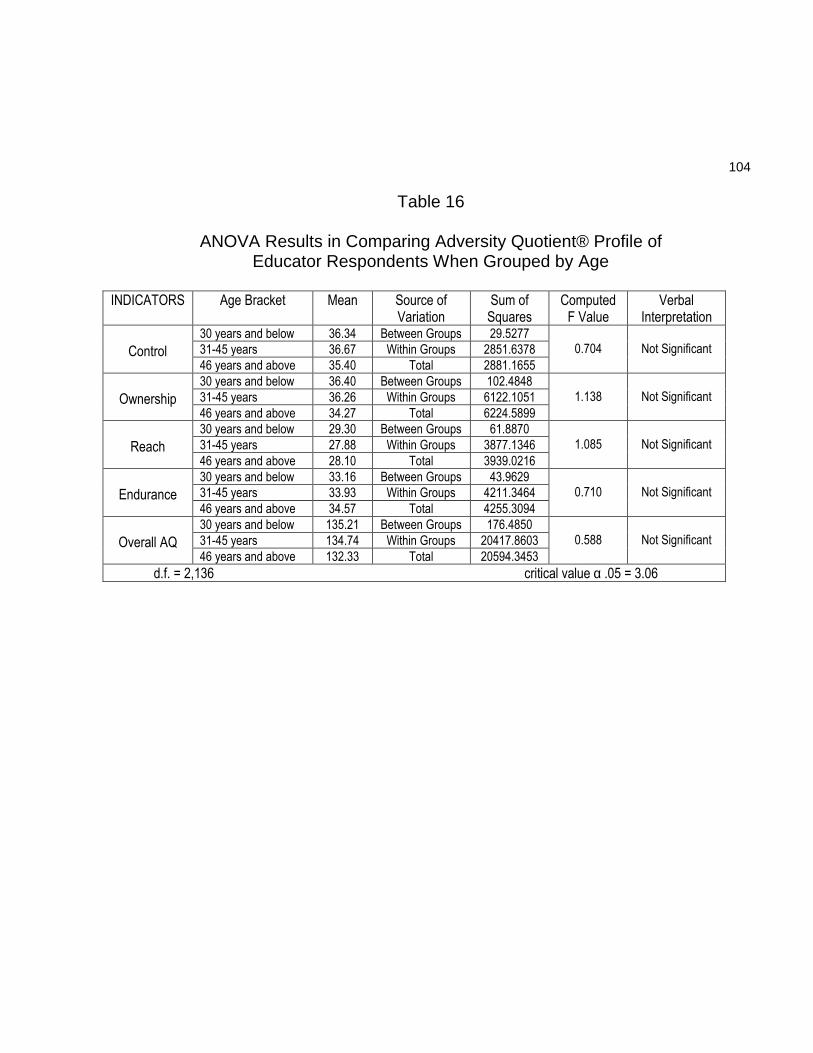
104
Table 16
ANOVA Results in Comparing Adversity Quotient® Profile of Educator Respondents When Grouped by Age
INDICATORS Age Bracket Mean Source of
Variation Sum of
Squares Computed
F Value Verbal
Interpretation
Control
30 years and below 36.34 Between Groups 29.5277 0.704
Not Significant 31-45 years 36.67 Within Groups 2851.6378
46 years and above 35.40 Total 2881.1655
Ownership
30 years and below 36.40 Between Groups 102.4848 1.138
Not Significant 31-45 years 36.26 Within Groups 6122.1051
46 years and above 34.27 Total 6224.5899
Reach
30 years and below 29.30 Between Groups 61.8870 1.085
Not Significant 31-45 years 27.88 Within Groups 3877.1346
46 years and above 28.10 Total 3939.0216
Endurance
30 years and below 33.16 Between Groups 43.9629 0.710
Not Significant 31-45 years 33.93 Within Groups 4211.3464
46 years and above 34.57 Total 4255.3094
Overall AQ
30 years and below 135.21 Between Groups 176.4850 0.588
Not Significant 31-45 years 134.74 Within Groups 20417.8603
46 years and above 132.33 Total 20594.3453
d.f. = 2,136 critical value α .05 = 3.06
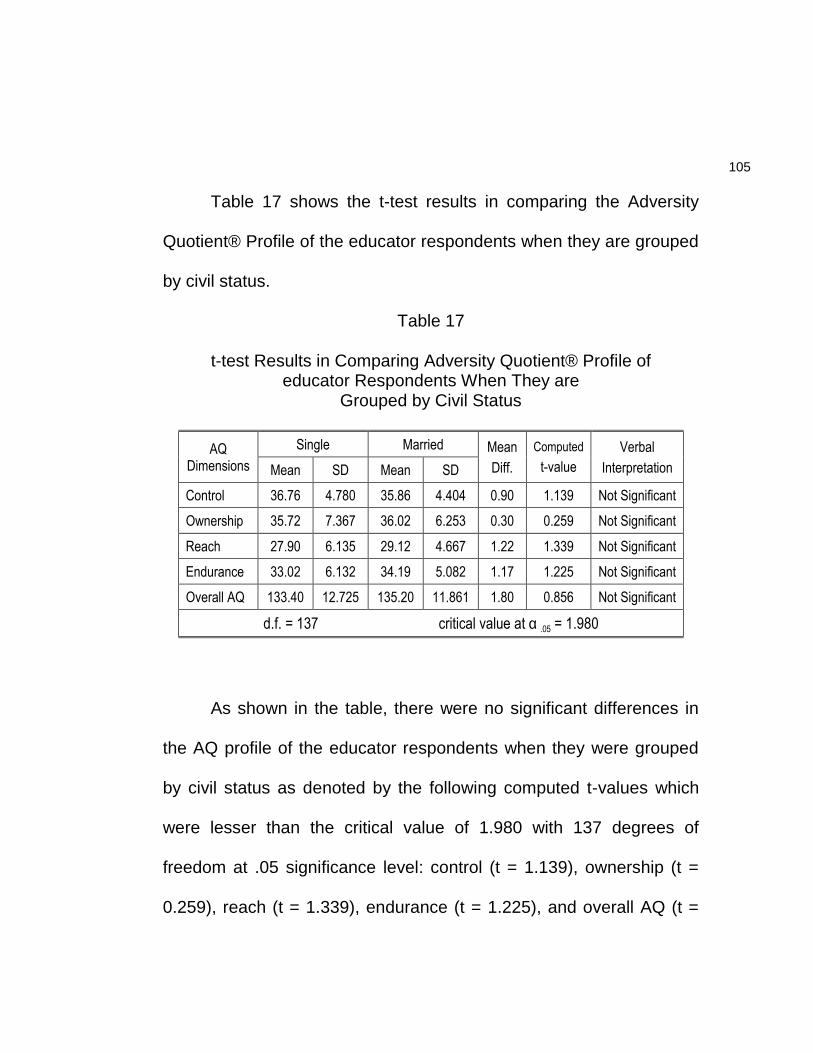
105
Table 17 shows the t-test results in comparing the Adversity
Quotient® Profile of the educator respondents when they are grouped
by civil status.
Table 17
t-test Results in Comparing Adversity Quotient® Profile of educator Respondents When They are
Grouped by Civil Status
AQ Dimensions
Single Married Mean
Diff.
Computed
t-value
Verbal
Interpretation Mean SD Mean SD
Control 36.76 4.780 35.86 4.404 0.90 1.139 Not Significant
Ownership 35.72 7.367 36.02 6.253 0.30 0.259 Not Significant
Reach 27.90 6.135 29.12 4.667 1.22 1.339 Not Significant
Endurance 33.02 6.132 34.19 5.082 1.17 1.225 Not Significant
Overall AQ 133.40 12.725 135.20 11.861 1.80 0.856 Not Significant
d.f. = 137 critical value at α .05 = 1.980
As shown in the table, there were no significant differences in
the AQ profile of the educator respondents when they were grouped
by civil status as denoted by the following computed t-values which
were lesser than the critical value of 1.980 with 137 degrees of
freedom at .05 significance level: control (t = 1.139), ownership (t =
0.259), reach (t = 1.339), endurance (t = 1.225), and overall AQ (t =
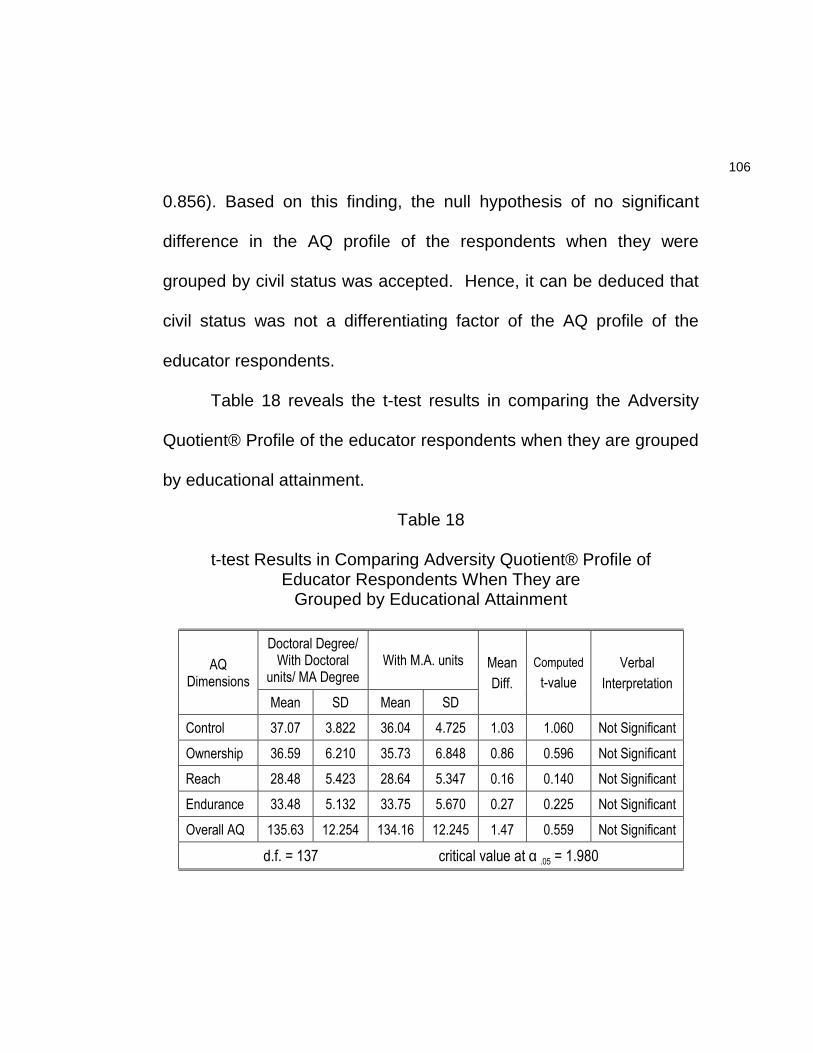
106
0.856). Based on this finding, the null hypothesis of no significant
difference in the AQ profile of the respondents when they were
grouped by civil status was accepted. Hence, it can be deduced that
civil status was not a differentiating factor of the AQ profile of the
educator respondents.
Table 18 reveals the t-test results in comparing the Adversity
Quotient® Profile of the educator respondents when they are grouped
by educational attainment.
Table 18
t-test Results in Comparing Adversity Quotient® Profile of Educator Respondents When They are
Grouped by Educational Attainment
AQ Dimensions
Doctoral Degree/ With Doctoral
units/ MA Degree With M.A. units Mean
Diff.
Computed
t-value
Verbal
Interpretation
Mean SD Mean SD
Control 37.07 3.822 36.04 4.725 1.03 1.060 Not Significant
Ownership 36.59 6.210 35.73 6.848 0.86 0.596 Not Significant
Reach 28.48 5.423 28.64 5.347 0.16 0.140 Not Significant
Endurance 33.48 5.132 33.75 5.670 0.27 0.225 Not Significant
Overall AQ 135.63 12.254 134.16 12.245 1.47 0.559 Not Significant
d.f. = 137 critical value at α .05 = 1.980
107
As seen in the tabular results, the AQ profile of the educator
respondents did not vary significantly when they were grouped by
educational attainment. This finding was supported by the following
computed t-values which were lesser than the critical value of 1.980
with 137 degrees of freedom at .05 significance level: control (t =
1.060), ownership (t = 0.596), reach (t = 0.140), endurance (t =
0.225), and overall AQ (t = 0.559).
Based on the foregoing finding, the null hypothesis of no
significant difference in the AQ profile of the respondents when they
were grouped by educational attainment was accepted. This implies
that educational attainment was not a differentiating factor of the AQ
profile of the educator respondents.
Table 19 shows the ANOVA results in comparing the Adversity
Quotient® Profile of the educator respondents when they are grouped
by length of service.
As reflected in the results, the AQ profile of the educator did not
vary significantly when they were grouped by length of service. This
finding was denoted by the following computed F values which were
within the critical value of 2.67 with 3, 135 degrees of freedom:
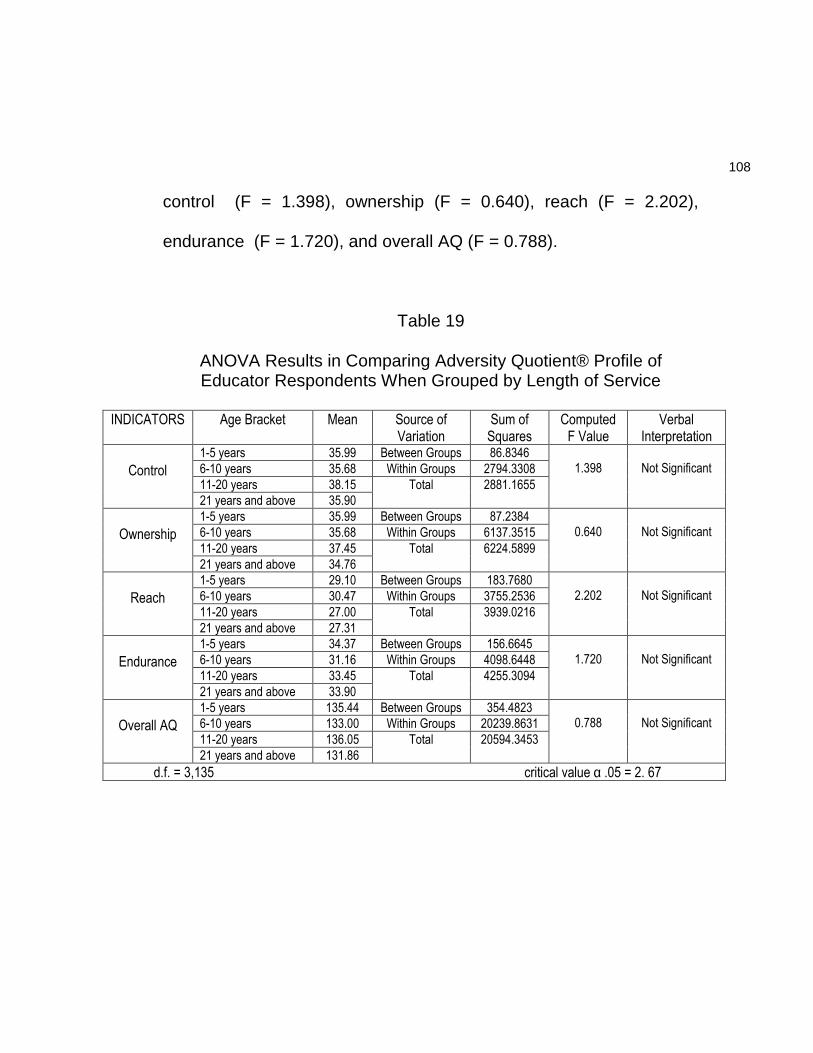
108
control (F = 1.398), ownership (F = 0.640), reach (F = 2.202),
endurance (F = 1.720), and overall AQ (F = 0.788).
Table 19
ANOVA Results in Comparing Adversity Quotient® Profile of Educator Respondents When Grouped by Length of Service
INDICATORS Age Bracket Mean Source of
Variation Sum of
Squares Computed
F Value Verbal
Interpretation
Control
1-5 years 35.99 Between Groups 86.8346 1.398
Not Significant 6-10 years 35.68 Within Groups 2794.3308
11-20 years 38.15 Total 2881.1655
21 years and above 35.90
Ownership
1-5 years 35.99 Between Groups 87.2384 0.640
Not Significant 6-10 years 35.68 Within Groups 6137.3515
11-20 years 37.45 Total 6224.5899
21 years and above 34.76
Reach
1-5 years 29.10 Between Groups 183.7680 2.202
Not Significant 6-10 years 30.47 Within Groups 3755.2536
11-20 years 27.00 Total 3939.0216
21 years and above 27.31
Endurance
1-5 years 34.37 Between Groups 156.6645 1.720
Not Significant 6-10 years 31.16 Within Groups 4098.6448
11-20 years 33.45 Total 4255.3094
21 years and above 33.90
Overall AQ
1-5 years 135.44 Between Groups 354.4823 0.788
Not Significant 6-10 years 133.00 Within Groups 20239.8631
11-20 years 136.05 Total 20594.3453
21 years and above 131.86
d.f. = 3,135 critical value α .05 = 2. 67
109
Based on the above finding, the null hypothesis of no significant
difference in the AQ profile of the respondents when they were
grouped by length of service was accepted. This finding implies that
length of service was not a differentiating factor of the AQ profile of
the educator respondents.
12. Comparison of Personality-Temperament Traits of
Respondents When They are Grouped by Profile Variables
Table 20 shows the results of the chi-square test in comparing
the personality-temperament traits of the educator respondents when
they are grouped by profile variables.
As gleaned in the table, the personality-temperament traits of
the educator varied significantly when they were grouped by gender.
This finding was supported by the computed 2 value of 48.674 which
was greater than the critical value of 5.991 with 2 degrees of freedom.
Likewise, when grouped according to civil status and educational
attainment, the computed 2 values of 15.047 and
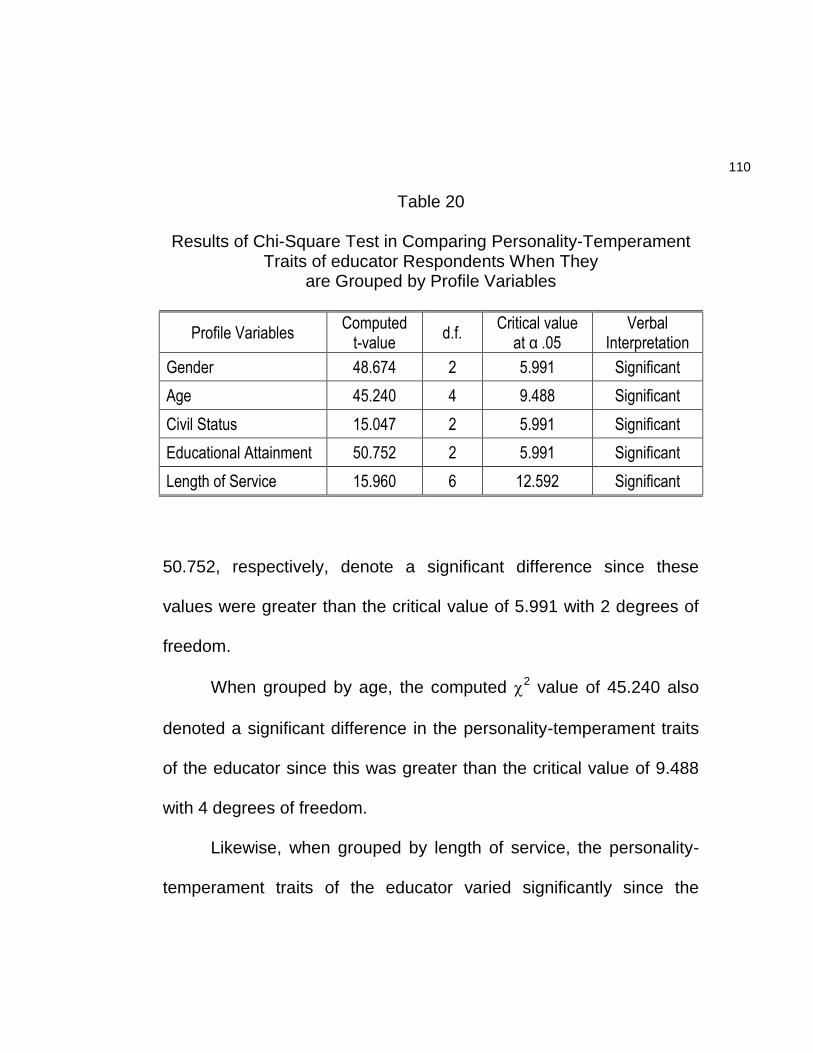
110
Table 20
Results of Chi-Square Test in Comparing Personality-Temperament Traits of educator Respondents When They
are Grouped by Profile Variables
Profile Variables Computed
t-value d.f.
Critical value at α .05
Verbal Interpretation
Gender 48.674 2 5.991 Significant
Age 45.240 4 9.488 Significant
Civil Status 15.047 2 5.991 Significant
Educational Attainment 50.752 2 5.991 Significant
Length of Service 15.960 6 12.592 Significant
50.752, respectively, denote a significant difference since these
values were greater than the critical value of 5.991 with 2 degrees of
freedom.
When grouped by age, the computed 2 value of 45.240 also
denoted a significant difference in the personality-temperament traits
of the educator since this was greater than the critical value of 9.488
with 4 degrees of freedom.
Likewise, when grouped by length of service, the personality-
temperament traits of the educator varied significantly since the
111
computed 2 value of 15.960 was greater than the critical value of
12.592 with 6 degrees of freedom.
Based on the above findings, the null hypothesis of no
significant difference in the personality-temperament traits of the
educator respondents when they were grouped by profile variables
was rejected. This indicates that gender, age, civil status, educational
attainment and length of service were significant factors in
differentiating the personality-temperament traits of the educator
respondents.
With reference to the results of the chi-square computations, it
can be deduced that male educator tend to have choleric and
sanguine temperaments; while female educator are more likely to
manifest choleric and melancholy temperaments.
In terms of age, it can be observed that younger educator tend
to manifest choleric and sanguine temperaments; while the choleric
and melancholy temperaments are more evident among older
educators.
112
With respect to civil status, single educators are dominantly
cholerics; while some married educators are cholerics and some also
manifest sanguine and melancholy temperaments.
In terms of educational attainment, educator with higher
educational attainment tended to be cholerics and sanguines; while
those with lower educational attainment tended to be cholerics and
melancholics.
Finally, in terms of length of service, educator with longer years
of experience tended have a dominant a choleric temperament; while
some educator who are new in the service are cholerics and some
are sanguines and melancholics.
113
CHAPTER 5
SUMMARY OF FINDINGS, CONCLUSIONS AND
RECOMMENDATIONS
This chapter gives a general overview of the study, and
presents the significant findings, conclusions and recommendations
offered.
The major purpose of this study is to examine the
interrelationship among the Adversity Quotient®, personal
characteristics and personality-temperament traits of educators in
selected public and private educational institutions.
Specifically, answers to the following questions were sought:
1. What is the profile of the educator respondents in terms of
the following:
1.1 gender;
1.2 age;
1.3 civil status;
114
1.4 educational attainment; and
1.5 length of service?
1. What is the Adversity Quotient of the educator respondents
as measured by the following dimensions:
1.1 control;
1.2 ownership;
1.3 reach; and
1.4 endurance?
2. What is the personality temperament profile of the
respondents?
3. How significant is the relationship between the Adversity
Quotient and personality-temperament traits of the educator
respondents?
4. How significant is the difference in the Adversity Quotient®
of the educator respondents when they are grouped by their profile
variables?
5. How significant is the difference in the personality-
temperament traits of the educator respondents when they are
grouped by their profile variables?
115
The study utilized the descriptive research method with the use
of the questionnaire/checklist as the major instrument for gathering
data. The personality-temperament profile scale adapted from the
book of Tim LaHaye (1998) was used and the written format of the
electronic form of Adversity Quotient® Profile instrument of Dr. Paul
G. Stoltz (2009) in his latest AQ®P online version 8.1.
The respondents of the study were educators composed of
college deans, school principals, school heads, academic heads and
classroom teachers of selected public and private educational
institutions in the Province of Aurora
The following statistical tools and techniques were used to
ensure the valid and systematic presentation, analysis and
interpretation of data: frequency and percentage, arithmetic mean, t-
test for independent samples, one-way analysis of variance (ANOVA),
Pearson Product Moment Correlation, and chi-square test.
Summary of Findings
The significant findings of the study are discussed below:
1. Profile of School Administrator Respondents
116
1.1 Gender. One hundred eleven (111) or 79.86% of the
educators are female; and 28 or 20.14% are male.
1.2 Age. Thirty-nine (39) or 28.06% of the educators were 25
years and below; 28 or 20.14% were between 26 – 30 years old; 20
or 14.39% were between 31 – 35 years old; 8 or 5.76% belonged to
the 36 – 40 years age group; 14 or 10.07% were between 41 – 45
years old; 13 or 9.35% were between 46 – 50 years old; 7 or 5.04%
were between 51 – 55 years old; and 10 or 7.19% were 56 years and
above. The mean age of the educator respondents was 34.69.
1.3 Civil Status. Eighty-one (81) or 58.27% of the educators
were married; 55 or 39.57% were single; and an equal number of 1 or
0.72% were widowed, separated, and a single parent, respectively.
1.4 Educational Attainment. The highest educational
attainment of 112 or 80.58% of the educator respondents was some
units earned in their Master’s degree program; 20 or 14.39% of the
respondents were Master’s degree holders; 4 or 2.88% had earned
some doctoral units; and 3 or 2.16% were doctoral degree holders.
1.5 Length of Service. Seventy-one (71) or 51.08% of the
educator respondents had 1 – 5 years of experience in the field of
117
education; 19 or 13.67% had 6 – 10 years length of service; 10 or
7.19% had 11 – 15 years length of service; and another 10 or 7.19%
had 16 – 20 years length of service. School administrators with the
longest years of service of 21 years and above numbered 29 or
20.86%. The mean length of service of the educator respondents
was 9.65 years.
2. Adversity Quotient of Respondents
2.1 Control. The computed mean score of the educator
respondents was 36 and this was below the standard mean score of
41, which reflects a “below average” rating of the school
administrators in the control dimension. This finding suggests that
most of the educator respondents usually feel helpless in the face of
adversity.
2.2 Ownership. The mean score of the respondents was 36
which was way below the standard mean of 45. This indicates a “low”
rating of the educator respondents in the ownership dimension. This
finding suggests that the educator respondents oftentimes disown the
outcome of a problem, regardless of their cause. This results to
118
failing to act, giving up, pointing fingers, reduced performance and
anger at other people and many more negative actions
2.3 Reach. The mean score of the educator respondents was
29 and this was below the standard mean of 32. This denotes a
“below average” rating of the respondents in the reach dimension,
which infer that most of the educator respondents often allow
problems/adversities they face to affect other aspects of their lives
often leading to panic and poor decision-making.
2.4 Endurance. The computed mean score of 34 was within
the “average” rating which indicates that most educator respondents
perceive that stressful times can be dealt with as it arise.
Overall AQ. The computed mean score of the overall AQ of the
educator respondents equaled to 134 which is below the standard
mean of 154. This indicates an overall “below average” AQ of the
educator respondents.
3. Personality Temperament Profile of Respondents
Most of the educator, 117 or 84.17%, had a choleric
temperament; 11 or 7.91% had a sanguine temperament; and
another 11 or 7.91% had a melancholy temperament.
119
4. Relationship Between Adversity Quotient and Personality-
Temperament Traits of Respondents
4.1 Sanguine Temperament. No significant relationships
were observed between the personality-temperament traits of the 11
educator respondents with sanguine temperament and their AQ
profile in terms of the control (r = 0.065, t = 0.196), reach (r = 0.120, t
= 0.362) and endurance (r = 0.180, t = 0.546).
On the other hand, low but not statistically significant
correlations were noted between the personality temperament traits of
educator with a sanguine temperament and their AQ profile in terms
of ownership (r = 0.258, t = 0.802) and their overall AQ (r = 0.231, t =
0.712). This finding was based on the computed t-values which
were within the critical value of 2.262 with 9 degrees of freedom at .05
significance level.
4.2 Choleric Temperament. The personality-temperament
traits of the 117 educator respondents with choleric temperament did
not significantly correlate with their AQ profile in terms of the following
dimensions: control (r = 0.018, t = 0.188); ownership (r = -0.060, t =
0.642); reach (r = -0.076, t = 0.813), and endurance (r = -0.027, t =
120
0.292) and with their overall AQ (r = -0.073, t = 0.790). This
finding was supported by the computed t-values which were lesser
than the critical value of 1.980 with 115 degrees of freedom at .05
significance level.
4.3 Melancholy Temperament. The personality-temperament
traits of the 11 educator respondents with melancholy temperament
did not significantly correlate with their AQ profile in terms of the
following dimensions: control (r = -0.187, t = 0.571) and overall AQ (r
= -0.032, t = 0.096).
There were moderate but statistically not significant correlations
between the personality-temperament traits of educator and their AQ
profile in terms of ownership (r = -0.462, t = 1.564) and reach (r =
0.417, t = 1.377). A low but not statistically significant correlation was
also observed between the personality-temperament traits of
educator with melancholy temperament and their AQ profile in terms
of endurance (r = 0.333, t 1.058). These findings were supported by
the computed t-values which were lesser than the critical value of
2.262 with 9 degrees of freedom at .05 significance level.
121
5. Comparison of Adversity Quotient® Profile of Respondents
When They are Grouped by Profile Variables
5.1 When Grouped by Gender. No significant difference was
observed in the AQ profile of the educator respondents when they
were grouped by gender in terms of the following dimensions: control
t = 0.617), ownership (t = 0.245), reach (t = 0.985), endurance (t =
0.511), and overall AQ (t = 1.030). The computed t-values were lesser
than the critical value of 1.980 with 137 degrees of freedom at .05
significance level
5.2 When Grouped by Age. The AQ profile of the educator
did not vary significantly when they were grouped by age as denoted
by the following computed F values which were within the critical
value of 3.06 with 2, 136 degrees of freedom: control (F = 0.705),
ownership (F = 1.138), reach (F = 1.085), endurance (F = 0.710),
and overall AQ (F = 0.588).
5.3 Civil Status. There were no significant differences in the
AQ profile of the educator respondents when they were grouped by
civil status as denoted by the following computed t-values which were
lesser than the critical value of 1.980 with 137 degrees of freedom at
122
.05 significance level: control (t = 1.139), ownership (t = 0.259), reach
(t = 1.339), endurance (t = 1.225), and overall AQ (t = 0.856).
5.4 Educational Attainment. The AQ profile of the educator
respondents did not vary significantly when they were grouped by
educational attainment as supported by the following computed t-
values which were lesser than the critical value of 1.980 with 137
degrees of freedom at .05 significance level: control (t = 1.060),
ownership (t = 0.596), reach (t = 0.140), endurance (t = 0.225), and
overall AQ (t = 0.559).
5.5 Length of Service. The AQ profile of the educator did not
vary significantly when they were grouped by length of service as
denoted by the following computed F values which were within the
critical value of 2.67 with 3, 135 degrees of freedom: control (F =
1.398), ownership (F = 0.640), reach (F = 2.202), endurance (F =
1.720), and overall AQ (F = 0.788).
6. Comparison of Personality-Temperament Traits of
Respondents When They are Grouped by Profile Variables
The personality-temperament traits of the educator varied
significantly when they were grouped by gender (2 = 48.674), age (2
123
= 45.240), civil status (2 = 15.047), educational attainment (2 =
50.752), and length of service (2 = 15.960).
6.1 When Grouped by Gender. Male educators have choleric
and sanguine temperaments; while female educatora are more likely
to manifest choleric and melancholy temperaments.
6.2 When Grouped by Age. Younger educators tend to
manifest choleric and sanguine temperaments; while the choleric and
melancholy temperaments are more evident among older educators.
6.3 When Grouped by Civil Status. Single educators are
dominantly cholerics; while some married educators are cholerics and
some also manifest sanguine and melancholy temperaments.
6.3 When Grouped by Educational Attainment. Educators
with higher educational attainment are dominantly cholerics and
sanguines; while those with lower educational attainment tended to
be cholerics and melancholics.
6.4 When Grouped by Length of Service. Educators with
longer years of experience tended have a dominant a choleric
temperament; while some school administrators who are new in the
service are cholerics and some are sanguines and melancholics.
124
Conclusions
The significant findings of the study provided bases for the
following conclusions:
1. The educator respondents are mostly female, in their mid-
thirties, and married. They have pursued post-graduate studies and
most of them have around ten years of work experience in the field of
education.
2. The educator respondents have below average AQ which
indicates that they have less than the ideal capacity to resolve
challenges difficulties, set backs and demands and to make every
effort to overcome them so as not to affect their work.
3. Most of the educator respondents are fundamentally
ambitious and leader-like, which are distinguishing traits of individuals
with a choleric temperament.
4. The personality-temperament traits of educator who have a
sanguine, choleric, and melancholy temperaments do not significantly
influence their AQ® profile in the same way that their AQ® profile
does not significantly affect their personality-temperament traits.
125
5. Gender, age, civil status, educational attainment, and length
of service are not significant factors in differentiating the AQ® profile
of the educator respondents.
6. Gender, age, civil status, educational attainment and length
of service are significant factors in differentiating the personality-
temperament traits of the educator respondents.
Recommendations
In the light of the significant findings and conclusions of the
study, the following recommendations are offered:
1. Higher management of the selected educational institutions
in the Division of Aurora should review their selection process in
recruiting and promoting educators and look into the possibility of
integrating adversity quotient as one of the qualifications criteria in the
hiring and promotion process.
2. Educators in the research locale should enhance their
Adversity Quotient® through self-improvement activities such as
reading of self-improvement/self-help books and attending self-
126
transformation seminars which specifically focus on how to handle
adversities.
3. Educators should continuously engage in self-reflective
practice to assess and be more aware of their personality-
temperament profile in terms of their potential strengths and
weaknesses, productive tendencies as well as their self-destructive
tendencies. In the process, Educators can improve their leadership
practices which can significantly impact their institution’s performance.
4. Further studies should be conducted covering a larger
sample size to take into account the effect of personality-
temperament traits on AQ® and vice-versa in order to arrive at more
accurate conclusions.
5. The subject educational institutions in the Province of
Aurora, should incorporate the theory and practice of adversity
quotient in their staff development and training programs to instill
individual adversity awareness in order that educators, faculty and
non-teaching personnel may be more capable to deal with adversity
inherent in their jobs.
127
6. The results of this study may be shared with other higher
education institutions for possible or follow-up studies.
128
BIBLIOGRAPHY
A. Books Aquino, Gaudencio V. Educational Management Principles,
Functions, Concepts. Manila: Rex Book Store, 2000. American Psychiatric Association. Diagnostic and Statistical Manual
of Mental Disorders. 4th ed. Washington, DC: Author, 1994. Avelino, Soledad E. and Custodiosa A. Sanchez. Personality
Development and Human Relations. Manila: Rex Book Store, 1996.
Bass, B.M. Bass and Stogdill’s Handbook of Leadership. 3rd ed. New
York, NY: Free Press, 1990. Bass B., Bass R. The Bass Handbook of Leadership: Theory,
Research, and Managerial Applications. New York, NJ: Free Press, 2008.
Best, J. W., and Kahn, J. V. Research in Education. 9th Edition.
Boston: Allyn and Bacon, 2003. Chess, S., and Thomas, A. “Temperament and the Concept of
Goodness of Fit.” In J. Strelau, A. Angleitner (Eds.), Explorations in Temperament: International Perspectives on Theory and Measurement. (pp. 15-28). New York, NY, US: Plenum Press, 1991.
Corrales, Ramon G. The Leadership Relationship. Quezon City,
Metro Manila: Katha Publishing Co., Inc., 2007.
129
Costa, P.T., McCrae R.R. Revised NEO Personality Inventory. Odessa, FL: Psychological Assessment Resources, 1992.
Endriga, Baltazar “Postscript: The Leadership Challenges of the
Future.” In V. Magdaraog and N.K Dy-Liacco (Eds.) Extraordinary : Stories for Aspiring Leaders (p.222) Pasig City, Metro Manila: Anvil Publishing, Inc., 2008
LaHaye, T. Your Temperament: Discover Its Potential. Carol Stream:
IL: Tyndale Publishing,1984. LaHaye,T. Why You Act The Way You Do. Carol Stream: IL: Tyndale
Publishing,1988. Kagan, J., and Snidman, N. The Long Shadow of Temperament.
Cambridge, MA, US: Belknap Press/Harvard University Press,2004.
Leadbeater, B., Dodgen, D.and Solarz,A. “The Resilience Revolution:
A Paradigm Shift for Research and Policy.” In R.D. Peters, B. Leadbeater and R.J. McMahon (Eds), Resilience in Children, Families, and Communities: Linking Context to Prcatice and Policy,47-63. New York: Kluwer,2005.
Limpigco,D.A and Tia, G.E. Personality.2nd ed. Quezon City,
Philippines : Ken Inc., 1999 Lucas, A.F. Leading Academic Change: Essential Roles for
Department Chairs. San Francisco: Jossey-Bass,2000. Masten, A.S. “Resilience in Individual Development: Successful
Adaptation Despite Risk and Adversity.” In M. Wang and E. Gordon (Eds.), Risk and Resilience in Inner City America: Challenges and Prospects (pp.2-25). NJ: Erlbaum,1994.
Ruffer, M. “Developing Concepts in Developmental
Psychopathology.” In J.J. Hudziak (ed.), Developmental
130
Psychopathology and Wellness: Genetic and Environmental Influences (pp.3-22). Washington,DC: American Psychiatric Publishing,2008.
Stoltz, P.G. Adversity Quotient: Turning Obstacles inyo
Opportunities. New York: John Wiley and Sons,1997. Stoltz, P.G. Adversity Quotient@Work. New York: Morrow,2000. Zaccaro, S.J. Kemp, C., and Bader, P. “Leader Traits and Attributes.”
In J. Antnakis, A. T. Cianciolo, and R.J. Sternberg (Eds.), The Nature of Leadership (pp. 101-124). Thousand Oaks, CA: Sage,2004
Zaustra,A.J., Hall. J.S. and Murray, K.E. “Resilience: A New Definition
of Health for People and Communities.” In J.W. Reich, A.J. Zautra and J.S. Hall (Eds.), Handbook of Adult Resilience (pp.3-34). New York: Guilford, 2010.
B. Journals and Periodicals Barrick, M.R.and Mount, M.K. “The Big Five Personality Dimensions
and Job performance: A Meta-Analysis.” Personnel Psychology,44, 1-26,1991
Cicchetti, D.; Rogosch, F.A.; Lynch, M,; Holt,K.D. “Resilience
Maltreated Children : Processes Leading to Adaptive Outcome”. Development and Psychopathology5 (04): 629-647,1993.
Cloninger, R., Svrakic, D., and Pryzbeck, T. “A Psychobiological
Model of Temperament and Character.” Archives of General Psychiatry,50, 975-990,1993.
131
Del Favero, M. “The Social Dimension of Academic Discipline as a Discriminator of Academic Deans’ Administrative Behaviors.” The Review of Higher Education, 29(1), 69-96,2005.
DeRue, D.S,. Nahrgang, J.D,. Wellman, N, and Humprey, S.E. “Trait
and Behavioral Theories of leadership: an Integration and Meta-Analytic Test of Their Relative Validity.” Personnel Psychology,64,7-52,2011
Eagly, A.H, Karau, S,J, and Makhijani, M.G. “Gender and the
Effectiveness of Leaders: A Meta-Analysis.” Psychological Bulletin, 117, 125-145, 1995
Feingold, A. “Gender Differences in Personality: A Meta-Analysis.”
Psyhological Bulletin, 116, 429-456,1994. Halpern D. F. “ Sex Differences in Intelligence : Implications for
Education.” American Psychologist, 52, 1091-1101,1997. Hunter J.E. and Hunter, R.F. “Validity and Utility of Alternative
Predictors of Job Performance.” Psychological Bulletin, 96, 72-98, 1984.
Judge, T.A., Bono, J.E., Ilies, R. and Gerhardt, M.W. “Personality and
Leadership: A Qualitative and Quantitative Review.” Journal of Applied Psychology,87, 765-780.2002.
Klimoski,R.J. and Hayes, N.J. “Leader-Behavior and Subordinate
Motivation.” Personnel Psychology,33,543-555, 1980. Leonard, H.S. “The Many Faces of Character.” Consulting Psychology
Journal: Practice and Research, 49(4), 235-245,1997. Luthar, S.S., Cicchetti, D. and Becker, B. “The Construct of
Resilience: A critical Evaluation and Guidelines for Future Work.” Child Development71(3): 543-562,2000.
132
Masten, A.S. “Ordinary Magic: Lesson from Research on Resilience in Human Development.” Education Canada,49(3): 28-32,2009.
Mumford,T.V., Campioon, M.A., and Morgeson, F.P. “The Leadership
Skills Strataplex: Leadership Skill Requirements Across Organizational Levels.” Leadership Quartely,18, 154-166, 2007.
Sperry, L. “Leadership Dynamics: Character and Character Structure
in Executives.” Consulting Psychology Journal: Practice and Research,49(4),268-280,1997
Werner, E.E. “Resilience in Development.” Current Directions in
Psychological Science 4 (3): 81-85,1995.
C. Unpublished Materials Cajilig, A.S. “Personality Traits of Public Secondary School Teachers
in the First Congressional District of Iloilo and Their Influence on Classroom Management, Unpublished Master’s Thesis, University of Ilioilo, 2000.
Canivel, L.d. “Principals’ Adversity Quotient: Styles, Performance and
Practices.” Unpublished Thesis, University of the Philippines, Diliman, Quezon City, 2010
Dai, C.-H. “A Study on the Employees’ Adversity Quotient, Job Stress
and Role Performance in High Technology Industry: Perceived Organizational Support as a Moderator.” Unpublished Thesis, National Sun Yat-Sen University, 2009
Ferrer, M.B. “Relationship of Personal Characteristics, Leadership
Styles, and Job Satisfaction to Adversity Quotient of Academic Heads of Selected State Colleges and Universities in The National Capital Region.” Unpublished Dissertation, Polytechnic University of The Philippines, Sta. Mesa, Manila, 2009
133
Gadong, C.D. “Secondary School Teachers’ personality Traits: Its influence on Their Classroom Management.” Unpublished Thesis, University of Iloilo, 2009.
Haller, H.E. “Adversity and Obstacles in the Shaping of Prominent
Leaders: A Hermeneutic Phenomenological Inquiry.” Doctoral Dissertation, The Leadership Success Institute and Gonzaga University, 2005
Johnson,M.B. “Optimism , Adversity, And Performance : Comparing
Explanatory Style and AQ.” Unpublished Thesis, San Jose State University, 2005.
Lazaro, A.R. “Adversity Quotient and the Performance Level of
Selected Middle Managers of the Different Departments of the City of the Manila as Revealed by the 360-Degree Feedback System.” Unpublished Thesis, Pamantasan ng Lungsod ng Maynila, 2003.
Low,J. “Resilience in Academic Administration: Leading Higher
Education in Times Of Change.” Unpublished Dissertation, The Florida State University, 2010.
Lugtu, V.E. “Adversity Quotient as Correlates to Personality-
Temperaments Traits among the Special Weapons and Tactics (SWAT) Police: Basis for a proposed Recruitment and Selection.” Unpublished Thesis, Pamantasan g Lungsod ng Maynila, 2010.
Pinto, J. “Personality Traits and Psychological Needs of Senior
Augustinian Sisters: A Pluralistic Analysis.” Unpublished Thesis, De La Salle University, 2003.
Rajendram, S.G. “Religious Motivation, Anger Management Style,
and Temperament of Two Groups of Seminarians.” Unpublished Thesis, De La Salle University, 2001.
134
Roxas, C.C. “Influences of Administrators’ Personality Traits on Teaching Performance Of Faculty of the University of the Cordilleras.” Unpublished Master’s Thesis. University of the Cordilleras, 2007.
Tan,A.L. “The Relationship Between the Temperament Scale and
Teaching Efficiency of the Notre Dame University Faculty.” Unpublished Thesis, Notre Dame University, 2000.
Torres, B.B. “Dominant personality Traits in Correlation to
Performance Evaluation of Selected Police Officers in Manila.” Unpublished Master’s Thesis, Pamantasan ng Lungsod ng Maynila, 2005.
Williams,M.W. “ The Relationship between Principal Response to
Adversity and Student Achievement.” Unpublished Dissertation, Cardinal Stritch University, 2003.
Wu, C.-H. “ The Study of The Relationship Between Adversity
Quotient And Campus Crisis Management in Elementary Schools.” Unpublished Thesis, National Sun Yat-Sen University, 2009.
D. Internet Source “APA – Resilience Factors and Strategies”. Apahelpcenter.org.
Retrieved 2010-09-16. Stoltz, P.G. (2000). Creating Sustainable Optimism. Based on a
Presentation by Executive Forum Series Speaker p.5.Retrieved from www.executive forum.net (accessed 15 July 2008).