Adverse Incentives in...
47
Adverse Incentives in Crowdfunding Thomas Hildebrand, † Manju Puri, ‡ and Jörg Rocholl § October 2014 This paper analyses the substantially growing markets for crowdfunding, in which retail investors lend to borrowers without financial intermediaries. Critics suggest these markets allow sophisticated investors to take advantage of unsophisticated investors. The growth and viability of these markets critically depends on the underlying incentives. We provide evidence of perverse incentives in crowdfunding that are not fully recognized by the market. In particular we look at group leader bids in the presence of origination fees and find that these bids are (wrongly) perceived as a signal of good loan quality, resulting in lower interest rates. Yet these loans actually have higher default rates. These adverse incentives are overcome only with sufficient skin in the game and when there are no origination fees. The results provide important implications for crowdfunding, its structure and regulation. We thank Tim Adam, Arnoud Boot, Christian Ehm, Masami Imai, Michael Koetter, Benjamin Klaus, Nagpurnanand R. Prabhala, Enrichetta Ravina, Yishay Yafeh, and seminar participants at the American Economic Association (AEA) meetings, Western Finance Association (WFA) meetings, 11 th Annual Bank of Finland/CEPR Conference, German Finance Association (DGF) meetings, European Finance Association (EFA) meetings, Financial Management Association (FMA) meetings, 21 st Annual Conference on Financial Economics and Accounting (CFEA) at the University of Maryland, DIW Berlin Finance Conference, London School of Economics, Tilburg University, BI Oslo, Duke University, ESMT Berlin, Humboldt University Berlin, University of Karlsruhe, University of Tübingen, University of Mannheim, and University of Maastricht. † ESMT European School of Management and Technology. Email: [email protected]. Tel: +49 30 21231-5612. ‡ Duke University and NBER. Email: [email protected]. Tel: (919) 660-7657. § ESMT European School of Management and Technology. Email: [email protected]. Tel: +49 30 21231-1292.
Transcript of Adverse Incentives in...
Adverse Incentives in Crowdfunding
Thomas Hildebrand,† Manju Puri,‡ and Jörg Rocholl§
October 2014
This paper analyses the substantially growing markets for crowdfunding, in which retail investors lend to borrowers without financial intermediaries. Critics suggest these markets allow sophisticated investors to take advantage of unsophisticated investors. The growth and viability of these markets critically depends on the underlying incentives. We provide evidence of perverse incentives in crowdfunding that are not fully recognized by the market. In particular we look at group leader bids in the presence of origination fees and find that these bids are (wrongly) perceived as a signal of good loan quality, resulting in lower interest rates. Yet these loans actually have higher default rates. These adverse incentives are overcome only with sufficient skin in the game and when there are no origination fees. The results provide important implications for crowdfunding, its structure and regulation.
We thank Tim Adam, Arnoud Boot, Christian Ehm, Masami Imai, Michael Koetter, Benjamin Klaus, Nagpurnanand R. Prabhala, Enrichetta Ravina, Yishay Yafeh, and seminar participants at the American Economic Association (AEA) meetings, Western Finance Association (WFA) meetings, 11th Annual Bank of Finland/CEPR Conference, German Finance Association (DGF) meetings, European Finance Association (EFA) meetings, Financial Management Association (FMA) meetings, 21st Annual Conference on Financial Economics and Accounting (CFEA) at the University of Maryland, DIW Berlin Finance Conference, London School of Economics, Tilburg University, BI Oslo, Duke University, ESMT Berlin, Humboldt University Berlin, University of Karlsruhe, University of Tübingen, University of Mannheim, and University of Maastricht.
† ESMT European School of Management and Technology. Email: [email protected]. Tel: +49 30 21231-5612. ‡ Duke University and NBER. Email: [email protected]. Tel: (919) 660-7657. § ESMT European School of Management and Technology. Email: [email protected]. Tel: +49 30 21231-1292.
2
Introduction
Markets for crowdfunding, barely known to a broader public until recently, have rapidly and significantly
grown into a multi-billion-dollar industry worldwide, covering loan markets as well as other types of
financing and securities. In these booming markets, individuals can directly finance other individuals or
companies without financial intermediation, making use of the growing availability and verifiability of
information on these individuals and companies. According to an industry study, there were more than
450 active crowdfunding platforms worldwide in 2012, most of them based in North America and
Western Europe, which represents an increase of more than 350% compared to 2007.1 Crowdfunding
markets raised 2.7 billion USD in 2012 – compared to 1.5 billion USD in 2011, which corresponds to a
growth rate of 81%.2
As a consequence, crowdfunding, with its applicability to various areas and its significant pool of capital,
has also received strong bipartisan support as a means to alleviate constraints for the financing of
individuals and small business and thus of economic growth.3 Accordingly, President Obama signed the
“Jumpstart Our Business Startups (JOBS) Act” on April 5, 2012, legalizing crowdfunding by authorizing
SEC-approved portals for companies to seek funding from anyone. Crowdfunding has attracted
significant attention in particular in the form of online lending in peer-to-peer transactions, which,
according to the Consumer Financial Protection Bureau (CFPB), “could have significant implications for
consumers seeking alternative sources of credit.”4 While crowdfunding is thus commonly viewed as a
means to fundamentally change the investment and financing process as well as providing more
1 Crowdsourcing.org, 2012. 2 Crowdsourcing.org, 2013. 3 See for example, “Pennies from Many“, New York Times, September 25, 2011. 4 GAO Report to Congressional Committees, Person to Person Lending, July 2011, Page 56.

3
transparency, the potential of investors being taken advantage of by unscrupulous lenders has been
expounded by a large number of regulators and academicians.5
Despite the growing importance of crowdfunding markets and their perception as markets of the future,
our understanding of their functioning is still quite limited. Clearly, they differ from traditional markets,
in particular, because there is no formal intermediary. Is the absence of formal intermediaries made up by
the endogenous creation of groups and certification by group leaders? What are the incentives of players?
Are sophisticated investors taking advantage of unsophisticated investors whose learning process might
be too slow to cope with other investors’ opportunistic behavior? What are the implications for the kinds
of loans originated as well as their interest and default rates? The answer to such questions would be a
first step towards understanding these markets and discussing the appropriate regulatory framework for
them.
In this paper we study the incentives of the players. In particular, we examine different modes of
origination and the related incentives. We do this by examining the impact of the existence of origination
fees for group leaders in the form of group leader rewards on the online social lending platform
Prosper.com, on which lenders can give their money directly to borrowers without the intermediation of a
financial institution.6 Success rates of listings are higher in groups suggesting that groups are important.
However, what are the group leader incentives? We are able to examine incentive effects for group
leaders and how these change with and without the presence of origination fees. We analyze how these
group leaders bid when rewards exist and how their bidding then affects the listing success, interest rates,
and default rates of loans in their groups. We compare this effect to the corresponding evidence for the
5 The creation of the CFPB in the 2010 Dodd-Frank Act aims to protect consumers by regulating and enforcing consumer financial laws and thus restricting unfair treatment. 6 It is important that origination fees in the context of this paper exclusively refer to the rewards that group leaders receive. These origination fees have thus to be distinguished from the fees that Prosper.com charges for providing the lending platform.

4
same group leaders when rewards in their groups do not exist anymore as well as for the counter-factual –
groups in which the group leaders do not get a reward. Our results suggest the presence of perverse
incentives in crowdfunding that are not fully recognized in the market. These perverse incentives have
highly economically significant implications for lenders and borrowers, with the potential to induce these
markets to collapse. The implications are noticeable even after a substantial period of time in which
investors have the chance to learn and adjust their behavior accordingly. We show that learning indeed
plays an important role, but that it is too slow to affect the overall outcomes.
We find a marked difference in group leaders’ behavior before and after the elimination of rewards, in the
number and kind of loans being originated, the interest rates of these loans, and their performance. When
group leaders can earn rewards, they bid actively and promote listings, thus increasing the success
probability of these listings. After the elimination of the rewards, group leaders bid on and thus promote
far fewer listings, with the result that also far fewer listings become successful. Furthermore, we find that
the default rates of loans on which group leaders bid substantially decrease once group leaders are not
allowed any more to charge rewards.
This change in group leader behavior with the resulting decrease in loan volume and improvement in loan
performance is consistent with the notion that group leaders promote questionable loans in order to earn
substantial and significant rewards. A more benign explanation is that as group leaders do not receive
compensation any more, they are no longer willing to undergo costly verification work and to screen
opaque borrowers of marginal creditworthiness. So more risky, marginal loans are not promoted. Perhaps
the best place to see whether group leaders behave strategically to maximize their rewards is to examine
their bidding behavior and this is where the bulk of our analysis is conducted.

5
We find that default rates are substantially higher for the listings that group leaders bid on when they earn
rewards, yet the interest rates for these loans are substantially lower. Group leader bids thus enhance the
credibility of loans and are perceived as a signal of higher quality. However, these loans have ex-post
higher default rates (suggesting they are of lower quality). The evidence suggests the existence of adverse
incentives for the group leaders that are not fully recognized by other lenders with group leaders using
bidding as a strategic tool to induce other lenders to come in. These perverse incentives are overcome
when the group leader has sufficient skin in the game, i.e. when he bids on and contributes a substantial
fraction of the requested loan amount and is thus severely hurt by losing money when a borrower defaults.
We find in this case that the default rates are significantly lower than for other loans and almost identical
to those for loans after the elimination of group leader rewards.
Furthermore, the adverse incentives do not exist in these groups when the same group leaders earn no
rewards anymore and in groups in which group leaders never earn a reward. Here, both default and
interest rates are significantly lower for the listings that group leaders bid on. In sum, this evidence
suggests that group leaders forgo strategic bidding only when they have skin in the game resulting in their
screening listings carefully. This result has important implications for the booming crowdfunding markets
for lending, but it provides evidence also for the design of crowdfunding markets for other types of
securities in which information asymmetries and thus the potential for opportunistic behavior might be
even more prevalent.
To the best of our knowledge, ours is the first paper to analyze the incentives of players in the rapidly
growing arena of crowdfunding and furthermore to provide evidence on adverse incentives that do not
appear to be fully recognized by the markets. Our paper is related to a number of different literatures.

6
First, it relates to the growing literature on irresponsible advice and lending by financial intermediaries
and the resulting need for regulatory intervention and consumer protection, such as for example Bolton,
Freixas, and Shapiro (2007), Bergstresser, Chalmers, and Tufano (2009), and Inderst and Ottaviani
(2009).
Second, it is related to the classic literature that theorizes how incentives shape behavior to draw
implications for financial markets. In theory, there are a host of papers that look at how information
asymmetry can result in agency problems and the mechanisms needed to overcome them e.g., Holmstrom
and Tirole (1997); Gorton and Pennacchi (1995) model the importance of skin in the game i.e., of the
informed lender or monitor taking enough of a financial interest in the firm to reassure investors that the
classic problems of adverse selection and moral hazard are overcome. Empirical work documenting how
theorized effects translate into reality have lagged behind, largely because there are few natural
experiments or settings where one can directly test for incentive effects. There are a few notable
exceptions, e.g. Muralidharan and Sundararaman (2011) examine an experiment testing incentive effects
in a teacher pay performance program. By examining a setting where there is a change in rules that
disallow origination fees we can see if for the same lenders there is a distinct change in behavior that
would correspond to theory.
Third, it relates to the literature on the use of technological innovations and their effect on bank
organization and lending processes. Examples comprise Ferrari, Verboven, and Degryse (2010), Degryse,
Laeven, and Ongena (2009) as well as Berger and Udell (2002). The use of new technologies is also
relevant in the context of the differentiation between hard and soft information, along the lines in Stein
(2002) and Berger, Miller, Petersen, Rajan, and Stein (2005).

7
Finally, there are a growing number of papers that analyze online peer to peer lending. Hulme and
Wright (2006) provide an overview of the historical origins and contemporary social trends of online
social lending. Ravina (2012) and Pope and Sydnor (2009) analyze whether there is discrimination on
Prosper.com in terms of socio-demographic variables such as race and gender. These characteristics are
taken care of by the difference-in-difference methodology employed in this paper. Iyer, Khwaja, Luttmer,
and Shue (2010) investigate whether lenders can infer soft information in Prosper. Lin, Prabhala, and
Viswanathan (2013) test which role social networks and in particular “the company that borrowers keep”,
i.e. the borrowers’ friends, play for the lending outcome. Duarte, Siegel, and Young (2012) show that
loans of borrowers who appear more trustworthy are funded with a higher probability, compared to loans
of borrowers who appear less trustworthy. Michels (2012) investigates whether unverifiable disclosures
are associated with increased funding probabilities and/or reduced interest rates of loans. Unlike these
papers, we look at the incentives of various players in crowdfunding and the implications for loan
origination and performance, which have important implications for the sustainability and growth of
crowdfunding markets.
I. Institutional Setting and Data
A. The market for crowdfunding on Prosper.com
The market for crowdfunding on Prosper.com brings together potential borrowers and potential lenders.7
After registering on the platform, potential borrowers can post a listing in which they ask for money and
provide different types of information so that potential lenders can better assess their creditworthiness.
7 Institutions are not allowed on Prosper.com during the sample period, so only private persons may serve as borrowers or lenders.

8
Until today, 172,274 loans have been originated out of more than 1.8 million listings on Prosper.com. The
total amount funded exceeds $1.7 billion.
Borrowers indicate the requested amount, which – during our sample period between 02/13/2007 and
04/15/2008 – is between $1,000 and $25,000, as well as the maximum interest rate they are willing to
pay.8 In our sample period, we observe a total of 153,541 listings. The left-hand side of Panel A of Table I
shows that potential borrowers ask for an average amount of $8,164 and are willing to pay an average
interest rate of 17.97%.9 Panel B shows that 8% of the listings are successful, i.e. they become loans.
Listings are bid on in 53% of the cases and receive on average 16.86 bids.
<INSERT TABLE I ABOUT HERE>
Prosper.com assigns a unique identification number to each borrower and requires him to provide his
social security and driver’s license number so that Prosper.com can verify his identity and obtain his
Experian Scorex PLUSSM credit report. Credit grades range from AA for the best to HR for the worst
customers and are based on the Experian credit score. Panel C of Table I shows the distribution of
potential borrowers by credit grade. The largest number of potential borrowers has the worst credit grade
of HR, but there is also a substantial number of potential borrowers with the best credit grades of AA/A
and B. The borrower can provide additional information of which only some is verified, e.g. borrower
state or house ownership.10 Panel D of Table I shows that potential borrowers have an average debt-to-
income ratio of 65%, and 34% of them own a house. They have been in their current job for 36 months.
8 In some states, there are interest rate caps, while in other states the maximum interest rate may go up to 35% – an interest rate cap set by Prosper.com. 9 Definitions for all variables in the tables of the paper are given in Table XII. 10 Additionally, the borrower has the possibility to post one or more photos, e.g. of herself or the object that she wants to finance with the loan.

9
Lenders can screen the listings and place one or several bids of at least $50 at any interest rate below or
equal to the borrower’s maximum rate. Bids cannot be canceled or withdrawn. The bidding is performed
as an open uniform-price auction in which everybody can observe each other’s actions. As long as the
aggregate supply on a listing does not exceed the borrower’s demand, bidders can see the amount, but not
the interest rates of the other bids. Once the aggregate supply exceeds the borrower’s demand, bidders can
also see the marginal interest rate. Lenders who offer the highest interest rates are outbid and the resulting
interest rate is bid down until the duration of the listing expires and the listing becomes a loan.
Alternatively, borrowers can choose that the listing is closed as soon as the total amount bid reaches the
amount requested. All winning bidders receive the marginal interest rate. In case the total amount bid
does not reach the amount requested, the listing expires and no transaction takes place. In our sample
period, all loans on Prosper.com are 36-months annuity loans, which can be paid back in advance. The
platform charges fees to borrowers and lenders once a listing becomes a loan. Borrowers pay a one-time
fee of between 1% and 5% of the loan amount depending on their credit grade, which is subtracted from
the gross loan amount. Lenders pay a 1% annual servicing fee.
The right-hand side of Panel A of Table I shows that the average amount of these loans is $7,097. While
borrowers indicate in their listings that they are willing to pay on average 20.01%, they end up paying
17.29%, as can be seen in Panel B. Successful listings receive a substantially higher number of bids,
which amounts to more than 161. The distribution of loans across credit grades is substantially different
from the distribution of listings, and most loans are given to customers with the credit grade of AA/A.
Finally, Panel D shows that borrowers with successful listings have a lower debt-to-income ratio and are
more likely to be home owners. A borrower who defaults on his loan is reported to credit bureaus.
Prosper.com uses collection agencies to recover the outstanding balances, and their fees are borne by the
lenders. Loans are unsecured with no second market unless they become overdue.

10
B. The Group System
Platform members can organize themselves in groups. Each user can form a group by defining the group
purpose as well as the nature and interests of its members and thus become a group leader. Each user can
be member and thus group leader of at most one group. The group leader administers her group and can
also act as a lender/borrower. Furthermore, the group leader has the right to grant or deny users access to
her group and ask for verification of the information they provide. Many group leaders request additional
information from potential borrowers, a process referred to as vetting. Furthermore, some group leaders
request to review every listing before it is posted in the group and explicitly offer help to potential
borrowers in writing and designing the listing.
The group leader can exploit her informational advantage and the fact that everybody can observe each
other’s actions to promote listings in her group. In particular, she can place a bid on the respective listing,
thereby signaling a financial commitment to the trustworthiness of the borrower. Furthermore, the group
leader can write an endorsement for the potential borrower, i.e. a short text in which she describes why
this respective borrower is particularly trustworthy. We concentrate on the analysis of bids as the most
credible commitment by the group leaders, who are more active than other group members and the key
facilitators in their groups.
Group leaders may either provide their service for free, for example because of the interest they earn on
loans or the benefits from social interaction, or charge a fee on loans closed in their group.11 We
distinguish between no-reward groups and reward groups and define a group as a reward group if the
11 The group leader obtains a one-time reward (“match reward”, 0.5% of the loan amount except for E-loans and HR-loans) once the listing is completely funded and a monthly payment (“payment reward”, 1% p.a. for AA-loans and A-loans, 2% p.a. for B-loans, C-loans and D-loans, 4% p.a. for E-loans and HR-loans.). Alternatively, the group leader can also choose to only partly capture this reward.

11
group leader requires a group leader reward at least for one listing in her group. Otherwise, the group is
defined as a no-reward group.
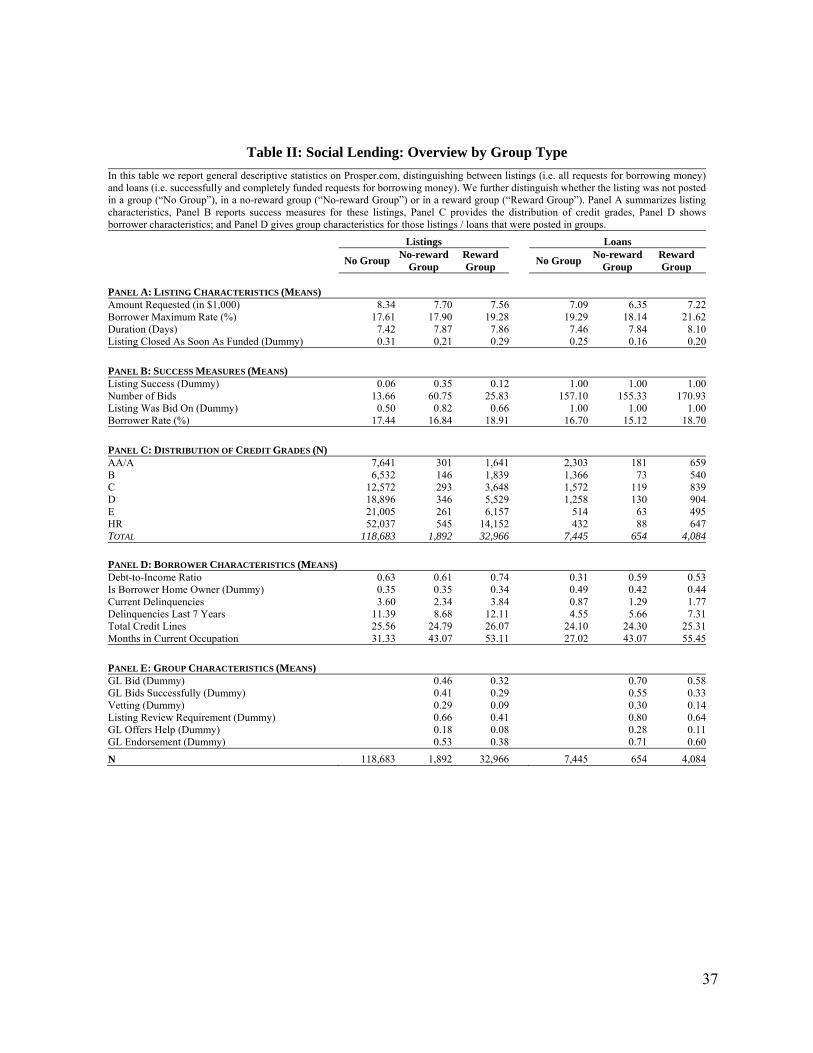
Table II provides an overview of listings and loans across reward groups, no-reward groups, and outside
groups. The left-hand side of Panel B shows that the success probability is highest for listings in no-
reward groups, followed by those in reward groups and outside groups. This observation is mirrored by
the different number of bids and the different probabilities with which there was bidding at all across
these different groups. Panel C shows that most listings are posted either outside a group (118,683) or in a
reward group (32,966); much fewer listings are posted in no-reward groups (1,892). Panel D presents the
borrower characteristics for the different types of groups and shows that the debt-to-income ratio, current
and past delinquencies are lowest for potential borrowers in no-reward groups. Finally, Panel E shows the
information on group-specific characteristics. Group leaders are most active in no-reward groups in terms
of bidding on listings. The share of listings with at least one group leader bid is here (46%) considerably
higher than in reward groups (32%).
<INSERT TABLE II ABOUT HERE>
C. The Existence and Elimination of Rewards
Prosper.com officially started its business in 2006. Since then, there have been several policy changes on
the platform, which are summarized in Figure 1.
<INSERT FIGURE 1 ABOUT HERE>

12
We focus in our analysis on group leader rewards, which exist since the beginning of our sample period
on 02/13/2007 and are eliminated in the summer of 2007. As early as on 06/14/2007, first rumors on their
elimination appear in online platforms.12 The official policy change then takes place on 09/12/2007.13 As
the first rumors may already change group leader’s behavior, we choose the midpoint between the
occurrence of the first rumors and the official change as the relevant date, which is the week of
07/30/2007. Prosper.com motivates the elimination of group leader rewards in its announcement by
“(t)he original philosophy … to enable borrowers in close-knit communities to leverage the reputation
and peer pressure of their group…, where compensation is not the dominant motivation for the group
leader’s services.” This event imposes a change on reward group leaders and systematically changes their
incentives in the loan granting process. It thus represents an ideal setting to analyze how group leaders bid
when rewards exist and what this means for loan outcomes. It also allows us to analyze how group
leaders’ bidding behavior and loan outcomes react to this sudden change in incentives. To exclude
possible influences of other significant policy changes, we restrict our analysis to the loans originated
between 02/13/2007 and 04/15/2008 in which no other significant policy change occurs and follow their
performance until 03/01/2010.14 The policy change of interest in our study is thus well centered in the
sample period.
II. Empirical Analysis and Results
A. Univariate Analysis
12 See http://www.getrichslowly.org/forum/viewtopic.php?f=2&t=399&sid=80594d9d8a970cf51dc7e011ddaf325c (accessed 08/27/2014). 13 Prosper.com abolishes this group leader reward on 09/12/2007, following an announcement on 09/05/2007. 14 During the sample period, there are two minor policy changes: On 10/30/2007, Prosper.com changes the lender servicing fee from 0.5% to 1% for A-loans and from 0.5% to 0% for AA-loans. Moreover, from this date on Prosper.com allows borrowers who already have a current loan to create a new listing in order to obtain a second loan. Second loans are allowed only for borrowers whose first loan has been active for some time and whose two loans together do not exceed the maximum amount of $25,000. To control for this latter policy change, we remove from the analysis the corresponding listings in which borrowers apply for second loans. On 01/04/2008, Prosper.com changes the borrower closing fees from 1% to 2% for the credit grades A and B, from 1% to 3% for the credit grades C and D, and from 2% to 3% for the credit grades E and HR. We provide further evidence for the robustness of our results to these additional changes in the robustness section.

13
A.1. Group Leader Bids
Group leaders can use bids as an important mechanism to promote listings in their groups. However, the
existence of rewards for group leaders may create adverse incentives for these group leaders. Rewards for
successful listings may induce them to use bids to persuade other lenders to bid even on weak listings, by
making other lenders believe that these listings are creditworthy. Thus, in the first step, it is important to
understand how bids are used in no-reward and reward groups and which outcomes are associated with
them. In the observed period, group leaders bid on 32.7% of the listings and these bids tend to be
successful: among all first group leader bids on a listing, only 13% are outbid. Mostly, these bids
constitute small amounts – very often $50 or $100 – so that the median amount of the first group leader
bid is $70. Usually, these bids are placed very fast. If a group leader bids, her first bid is typically also the
first overall bid on the respective listing.
Table III analyzes for no-reward and reward groups the listing success, interest rates, and loan
performance based on whether the group leaders bids on a listing.
<INSERT TABLE III ABOUT HERE>
Panel A of Table III shows how success rates of listings are related to group leader bids. In no-reward
groups, success rates for listings with (55.7%) are much higher than for those without a group leader bid
(22.7%). This is true for all credit grades, which shows that group leader bids increase the probability of
funding regardless of the riskiness of the listing. The analysis of reward groups draws a similar picture:
here, only 15.0% of the listings without a group leader bid are funded, while the listing success is
significantly increased by group leader bids (29.5%). From Panel B of Table III we observe that in no-
reward groups, group leader bids do not significantly influence the interest the borrower has to pay,

14
except for slightly lower interest rates for credit grades B, D, and HR. The effect is more pronounced for
reward groups. The analysis by credit grade reveals that loans with a group leader bid are associated with
significantly smaller interest rates, in particular for the riskier credit grades. For example, borrowers with
a loan in the credit grade HR pay on average 26.2% if the listing has no group leader bid, but only 24.2%
if the group leader bids on the listing. From Panel C of Table III we see that in no-reward groups, loans of
the riskier credit grades E and HR have lower failure rates if they have a group leader bid. By sharp
contrast, loans in reward groups with a group leader bid in general have significantly higher failure rates
than loans without a group leader bid. This is the case for almost all credit grades. Apparently, group
leader bids do not work as credible signals in reward groups, as they lead to loans with higher default
rates, yet lower interest rates.
Taken together, in both group types the success rates of listings with group leader bids are much higher
than for listings without these bids. Yet, while in no-reward groups this mechanism is associated with
listings of good quality despite their bad credit grade E or HR, in reward groups failure rates are
systematically increased for listings with a group leader bid, while interest rates are decreased. Group
leader bids thus lead to adverse outcomes in reward groups. If this is due to adverse incentives for group
leaders, then we should expect to see a different pattern in their behavior before and after the change in
reward structure. Our subsequent analysis thus focuses on group leader bidding behavior in reward groups
before and after the elimination of rewards.
A.2. Group Leader Bidding Before and After the Elimination of Group Leader Rewards
We thus analyze next how the existence of rewards affects the group leader bidding behavior. Figure 2
shows the weekly share of listings with at least one group leader bid in no-reward and reward groups. In
no-reward groups, this share does not show any remarkable trend over the sample period. By sharp

15
contrast, in reward groups the share decreases dramatically from about 40% to less than 10% once group
leader rewards are eliminated.15
<INSERT FIGURE 2 ABOUT HERE>
Group leaders of reward groups thus significantly lower the effort they put into listings and in particular
risky listings after the elimination of rewards – as opposed to group leaders of no-reward groups who do
not change their behavior.
The bidding behavior and outcome patterns are analyzed in more detail in Table IV. In particular, Table
IV distinguishes between the time period before and after the elimination of rewards and analyzes the
effect of group leader bids on the different outcomes before and after this change. Panel A of Table IV
shows that the listing success increases with a group leader bid both before and after the elimination of
rewards. This pattern holds for each credit grade and is both statistically and economically highly
significant. The results suggest that group leader bids are perceived as a credible signal for loan quality
and help to induce other lenders to contribute to a loan. They also show that the impact of a group leader
bid tends to be even more important after the elimination of rewards. While the listing success without a
group leader bid is very similar before and after the change, it is much higher for group leader bids after
the change than for group leader bids before the change. For example, for credit grades AA/A, while
before the change the listing success increases from 33.9% without a group leader bid to 48.0% with a
group leader bid, the corresponding increase after the change is from 32.6% to 67.6%.
<INSERT TABLE IV ABOUT HERE>
15 The decrease of group leader bids in reward groups is significant for all credit grades, and it is most distinct for riskier credit grades. For example, it decreases from 34.7% to 3.9% for credit grade HR.

16
Panel B shows the results for the analysis of the interest rates. The pattern is again very similar before and
after the elimination of the rewards.16 Interest rates are significantly lower for loans with group leader
bids than for loans without group leader bids, and this pattern holds in particular before the change. Group
leader bids are thus again perceived as a credible signal for the quality of borrower listings and induce
other lenders to charge lower interest rates for the resulting loans.
Finally, Panel C analyzes the performance of loans before and after the elimination of group leader
rewards dependent on whether the group leader bids on them. In strict contrast to the results in Panel A
and Panel B, the patterns here are completely different before and after the change. Before the change,
loans with a group leader bid exhibit significantly higher default rates than loans without a group leader
bid. This means that other lenders trust the group leader bid, as they are willing to participate in these
loans at lower interest rates, but they are significantly hurt by the weaker performance of these loans.
While group leader bids are perceived as a signal for loans of higher quality, they are in fact associated
with loans of lower quality. These bids lead other lenders to participate in loans in which they should not
participate, at least not at the given interest rates.
After the change however, loans with a group leader bid exhibit significantly lower default rates than
loans without a group leader bid and thus show the same pattern as the results for the no-reward groups.
The striking result in Table III that group leader bids in reward groups are associated with lower interest
rates and yet higher default rates is thus only due to the pattern in the time when rewards exist. Without
rewards, the patterns in these groups are very similar to those in no-reward groups.
16 As Panel B of Table IV also shows, out of the 601 loans in reward-groups after the elimination of group leader rewards, 160 have a group leader bid which we analyze further.

17
Group leader bids thus do not work when group leader rewards exist, while they work properly when no
such rewards exist. The results suggest that group leaders much more carefully screen and choose the
listings that are funded when they have skin in the game. An open question is why – when group leader
rewards exist – other lenders are willing to contribute to loans with group leader bids at lower interest
rates and yet higher default rates. This suggests that co-lenders do not fully foresee and adjust their
behavior to the consequences of the adverse incentives created by upfront rewards, most likely because of
the short period between the creation of the webpage and the point of time when these lenders have to
make their decisions.17 In the subsequent analyses, we control for the possibility of learning by taking into
account the level of experience that lenders in specific loan listings have.
B. Multivariate Analysis
In order to determine the driving factors behind the results described above and to control for the joint
influences, we now turn to the multivariate analysis. First, we only consider listings and loans in reward
groups, conducting an event study in a traditional regression framework. Second, we use no-reward
groups as the reference group for the evaluation of the developments in the reward groups, employing a
difference-in-difference approach.
B.1. Traditional regression framework
B.1.1. Listing Success
17 Lenders do not possess the full information that is used in this paper, as their decisions are made within the sample period, while the data for this paper cover the whole sample period.
18
Table V shows odds ratios of logistic regressions of listing success. In specification (1), we evaluate the
influence that different listing characteristics and borrower characteristics have on listing success,
abstracting from group characteristics and group leader bids. Listing success is decreasing in credit grade
risk, debt-to-income ratio, and the number of historical and current records in the credit report; it is
increasing in homeownership and in income. As suggested by Lin, Prabhala, and Viswanathan (2013) –
and using the definition that they adopt in their paper – we also control for the number of friends that the
borrower has on Prosper.com and find that friends increase the likelihood of listing success.18 We also
find that listings with on average more experienced lenders have a higher listing success.
<INSERT TABLE V ABOUT HERE>
In addition to these general listing characteristics and borrower characteristics, in specifications (2) and
(3) we also evaluate the influence of different group characteristics. The probability that the listing is
funded increases significantly if the group leader requires the listing to be reviewed before it is posted in
the group (Listing Review Requirement), if the group leader offers help in designing the listing (GL Offers
Help), or if the group leader writes an endorsement (GL Endorsement). Larger groups exhibit a lower
listing success (Number Of Members In Group). Likewise, better groups tend to have a lower listing
success (Group Ratings: 1 Star, …, 5 Stars). Most importantly for the purpose of our study, group leader
bids are highly important for the success of a listing, as can be seen at the top of specifications (2) and (3).
In specification (2), we include a dummy variable for group leader bids into the regression (GL Bid).
18 Lin, Prabhala, and Viswanathan (2013) propose and test several alternative definitions of friendship on Prosper.com. At one extreme (“level 0”), one may consider “friends who have registered on Prosper.com” (Lin et al., 2013, p. 18). Alternatively, at the other extreme (“level 5”), they consider as friends “lender-friends who […] bid and win on the listing […]”, Lin et al., 2013, p. 18. In our regressions, we adopt the former definition, i.e. our corresponding variable captures the number of friends at level 0. However, we have also tested alternative specifications, replacing this variable with a corresponding friend “level 5” variable. We find that this systematically makes the estimated effect of the friend variable stronger – not only for listing success, but also for interest rates and defaults – suggesting that stronger friend ties (level 5) are more effective than the weaker ties (level 0). Most importantly, however, this does not affect our main results, i.e. the importance of group leader bids).

19
Listings with a GL Bid exhibit particularly high funding probabilities; GL Bid is thus perceived as a signal
of high quality, inducing other lenders to contribute to the loan amount. In specification (3), we analyze to
what extent the influence of this GL Bid on listing success in reward groups is different before and after
the elimination of group leader rewards. The specification shows that the influence of a group leader bid
on listing success in reward groups is significant both before and after the change, while it is higher after
the change. Both results are consistent with the evidence from the univariate analysis and indicate that –
after the elimination of group leader rewards – potential lenders trust more than before the correctness of
the group leader’s signal that comes from his bid. This suggests that after this change, lenders might be
less concerned about the group leader behaving opportunistically and promoting listings only for their
own benefit.
B.1.2. Interest Rates of Loans
In order to determine the influence of the different variables on the interest rates that borrowers have to
pay to the lenders if their listing is funded, we run Tobit regressions of this interest rate (in percent) on the
same independent variables as in the regressions in Table V. Table VI reports the results, where the
dependent variable is truncated at left at 0% and at right at 35%, which is the maximum interest rate
possible on Prosper.com.19 Naturally, the sample is restricted to those listings that are completely funded
and therefore become loans.
<INSERT TABLE VI ABOUT HERE>
The interest rate of loans in the reference group, which are AA/A-loans, is about 7%. The borrower’s
credit grade is by far the most important factor for the interest rate charged to the borrower. Apart from
19 OLS regression results differ only marginally and are therefore not reported here.

20
that, the interest rate is increasing in the debt-to-income ratio and in the number of historical and current
records in the credit report. Furthermore, a higher amount requested typically increases the interest rate.
Furthermore, the more friends the borrower has on Prosper.com, the lower is the interest rate of the loan.
Finally, loans with on average more experienced lenders have a smaller interest rate.
Specification (2) shows that loans originated from listings with a GL Bid benefit from particularly low
interest rates. Consistent with the earlier evidence, GL Bid is thus perceived as a credible signal for the
quality of a loan and induces other lenders to ask for lower interest rates. We also find that the interest
rate of the loan is significantly lower if the group leader claims to verify additional information from the
borrower (Vetting) or if the group leader offers help in designing the listing (GL Offers Help). Finally,
from specification (3) we deduce that a group leader bid is associated with lower interest rates before and
after the elimination of rewards. Other lenders thus trust the group leader bid as a credible signal
throughout the sample period, independently of whether the group leader earns a reward or not. However,
after the elimination of group leader rewards, the interest rate of loans with a GL Bid in reward groups is
about 0.7 percentage points smaller than before. This result indicates that group leader bids have a
significant influence on the resulting interest rate in this group type, while the signal is more credible after
the elimination of group leader rewards than before.
B.1.3. Loan Performance
In order to analyze the determinants of loan performance in reward groups, we specify Cox proportional
hazards models with the same independent variables as before.20 The underlying assumption of the
20 As an alternative specification, we have also analyzed the ultimate outcome of the loan by considering whether it is repaid or not. The main results of the corresponding logistic regressions on the influence of group leader bidding confirm the corresponding results obtained from the Cox proportional hazard models reported in this paper. As another variation, we have also analyzed the share of the loan that is paid back by the borrowers to the lenders. The corresponding Tobit regressions again confirm the main results obtained from the Cox proportional hazard models.

21
models is that the coefficients are not time-varying, i.e. the importance of a variable for the probability of
defaulting or being late is constant over time.21 Loans are exposed to the process from the time they are
originated until they are either completely paid back, they default, or their data runs out. The results are
reported in Table VII.
<INSERT TABLE VII ABOUT HERE>
Specification (1) of Table VII shows that hazard rates are increasing in the credit grade risk and the debt-
to-income ratio. Hazard rates are decreasing in income, whereas borrowers who are unemployed or retired
have higher hazard rates. Furthermore, if the listing has a short duration or if it is closed as soon as it is
funded, the corresponding loan is potentially exposed to a higher hazard rate. Together, this suggests that
borrowers in urgent need of money exhibit higher hazard rates. Furthermore, hazard rates are decreasing
in the number of the borrower’s friends. We also find that listings with on average more experienced
lenders have a lower likelihood to default. This result implies that learning has an important positive
effect on defaults, significantly reducing their occurrence. The results in specifications (2) to (4) suggest
that hazard rates are reduced if the group leader verifies the information provided (Vetting). Better rated
groups and smaller groups tend to have lower defaults.
Most importantly for the purpose of this study, specification (2) shows that a GL Bid increases failure
rates. This result is again consistent with the evidence from the univariate analysis as they show that
group leader bids in reward groups do not work properly as a signal of good listing quality. They are
wrongly viewed as loans with high quality, as their default rates are higher, yet their interest rates are
lower than those for loans without a GL Bid. One may wonder whether before the elimination of group
21 If e.g. a loan with credit grade HR is more susceptible to have a failure than a loan of the reference group AA/A, the strength of this relationship does not depend on time. Thus, for example, the HR-loan does not become more susceptible to fail over time, compared to the AA/A-loan.

22
leader rewards it is profitable for the group leaders of reward groups to promote listings in their groups by
placing a group leader bid on them. Further analysis shows that in this time period the group leader
rewards more than compensate for the slightly higher failure rates in these groups.
Most importantly, the influence of the elimination of group leader rewards on loan performance in reward
groups can be deduced from specification (3): while before this policy change a GL Bid is associated with
a ceteris paribus higher hazard rate (coefficient of 1.023), after this event the hazard rate is significantly
smaller not only than before the change but also than the benchmark of 1 (coefficient of 0.853). In line
with the evidence from the univariate analysis, the overall higher default rates for loans with group leader
bids are thus due only to the time period when rewards exist. In contrast, group leader bids work properly
as a quality signal after the elimination. Consequently, the results suggest that – before the elimination of
group leader rewards – leaders in these groups overpromote bad listings with the help of their bids, which
leads to higher failure rates for these loans. In contrast, after the policy change, the mechanism works
properly as the group leader has now no incentive any more to bid strategically.
The evidence so far suggests that rewards give group leaders an incentive to promote bad listings by
bidding on them as these rewards more than offset the losses due to the higher likelihood of failure. This
behavior is different when the same group leaders can earn no rewards anymore. An alternative way to
align incentives, i.e. to make group leaders screen listings very carefully, is that group leaders participate
to a large fraction in the loan and thus have substantial skin in the game even when they earn rewards.
The threshold for this large fraction of the loan is determined as follows: A listing yields a negative
payoff to a regular bidder under the following simplified condition: –α + α I (1 – p) + α (1 – p) < 0, with α
= share of the loan amount supplied by this bidder, I = interest rate obtained, p = probability of default.
The recovery rate is assumed to be zero. This can be simplified to –α (I p + p – I) < 0, so that α > 0
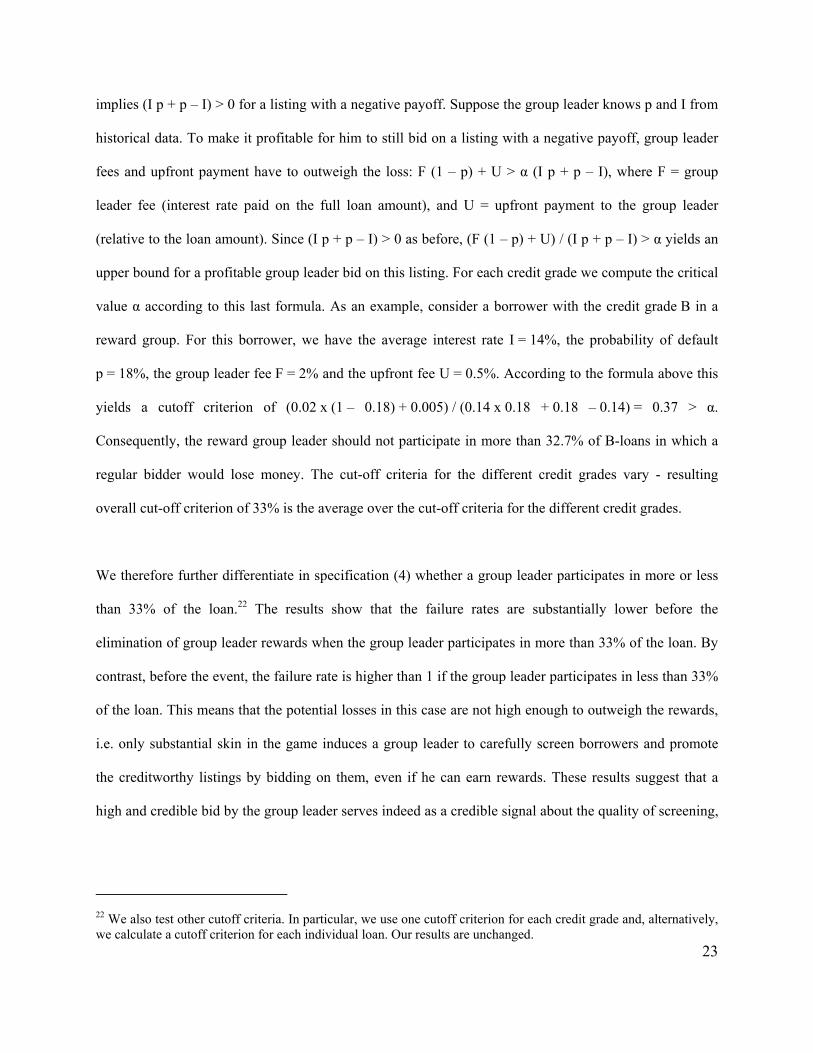
23
implies (I p + p – I) > 0 for a listing with a negative payoff. Suppose the group leader knows p and I from
historical data. To make it profitable for him to still bid on a listing with a negative payoff, group leader
fees and upfront payment have to outweigh the loss: F (1 – p) + U > α (I p + p – I), where F = group
leader fee (interest rate paid on the full loan amount), and U = upfront payment to the group leader
(relative to the loan amount). Since (I p + p – I) > 0 as before, (F (1 – p) + U) / (I p + p – I) > α yields an
upper bound for a profitable group leader bid on this listing. For each credit grade we compute the critical
value α according to this last formula. As an example, consider a borrower with the credit grade B in a
reward group. For this borrower, we have the average interest rate I = 14%, the probability of default
p = 18%, the group leader fee F = 2% and the upfront fee U = 0.5%. According to the formula above this
yields a cutoff criterion of (0.02 x (1 – 0.18) + 0.005) / (0.14 x 0.18 + 0.18 – 0.14) = 0.37 > α.
Consequently, the reward group leader should not participate in more than 32.7% of B-loans in which a
regular bidder would lose money. The cut-off criteria for the different credit grades vary - resulting
overall cut-off criterion of 33% is the average over the cut-off criteria for the different credit grades.
We therefore further differentiate in specification (4) whether a group leader participates in more or less
than 33% of the loan.22 The results show that the failure rates are substantially lower before the
elimination of group leader rewards when the group leader participates in more than 33% of the loan. By
contrast, before the event, the failure rate is higher than 1 if the group leader participates in less than 33%
of the loan. This means that the potential losses in this case are not high enough to outweigh the rewards,
i.e. only substantial skin in the game induces a group leader to carefully screen borrowers and promote
the creditworthy listings by bidding on them, even if he can earn rewards. These results suggest that a
high and credible bid by the group leader serves indeed as a credible signal about the quality of screening,
22 We also test other cutoff criteria. In particular, we use one cutoff criterion for each credit grade and, alternatively, we calculate a cutoff criterion for each individual loan. Our results are unchanged.
24
as the other lenders correctly assume that a higher participation by the group leader leads to skin in the
game and thus more careful screening.
B.2. Difference-in-difference approach
An alternative approach to the traditional regression framework discussed so far is to use the no-reward
groups as a reference group and to carry out a difference-in-difference analysis. The crucial assumptions
for this analysis are that the elimination of group leader rewards only affects reward group leaders and
that all other trends affect both group types in the same way, i.e. are uncorrelated with the group type.23
We now present the corresponding results.
B.2.1. Listing success
Table VIII shows odds ratios of logistic regressions of listing success, similar to Table V. The difference
between Table V and Table VIII is that in the latter we do not only consider reward groups, but also no-
reward groups and – in specification (1) – also listings posted outside groups. Specification (1) shows that
listings that are not posted in a group (No Group) or that are posted in a reward group (Reward Group)
have significantly lower funding probabilities than those posted in no-reward groups. More importantly
for our study, specifications (2) to (4) of Table VIII show that the results obtained in the event study with
23 Following Roberts and Whited (2012), we empirically test the assumption of parallel pre-trends of our main variables of interest. We first calculate the weekly average listing success for (i) listings in no-reward with a group leader bid, (ii) listings in no-reward groups without a group leader bid, (iii) listings in reward groups with a group leader bid, and (iv) listings in reward groups without a group leader bid. Based on this, we calculate the relative listing success (i.e. with vs. without group leader bid) for both no-reward groups and reward groups. We then test whether – before the elimination of group leader rewards – the average of the implied weekly growth rates of this variable is statistically different between no-reward groups and reward groups. We find that the null hypothesis of equal growth rates is not rejected, indicating that the assumption of parallel pre-trends is indeed met. We also conduct a similar analysis for both the average borrower rate of loans and the average number of defaults of loans that were originated in a given week. Again, the average of the corresponding growth rates before the elimination of group leader rewards is not statistically different between no-reward groups and reward groups, suggesting that also here the assumption of parallel pre-trends is met.

25
respect to listing success continue to hold and are specific to the reward groups, thus induced by the
elimination of group leader rewards.
<INSERT TABLE VIII ABOUT HERE>
Specification (3) breaks down the influence of group leader bids for reward and no-reward groups. The
results show that a GL Bid works in the same way and is thus perceived as a signal of a high quality of
loans in both groups, while the effect is stronger for no-reward than for reward groups. Specification (4)
constitutes the key part of our difference-in-difference analysis with two sources of identifying variation:
(i) the time before and after the removal of rewards, (ii) the distinction between listings inside and outside
reward groups. Our inference is based on evaluating whether reward groups perform differently after the
elimination of rewards. The specification shows that after this event the influence of a group leader bid in
the reward groups is significantly higher than before.
B.2.2. Interest Rates of Loans
Table IX reports the estimation results of Tobit regressions of interest rates in the difference-in-difference
setting. Specification (1) shows that interest rates of loans funded outside groups (No Group) or in reward
groups (Reward Group) are higher than those of loans in no-reward groups.
<INSERT TABLE IX ABOUT HERE>
As in the event study, specification (2) shows that a GL Bid as a signal of perceived high quality
decreases the interest rate. Specification (3) further distinguishes this effect of a GL Bid in no-reward and
reward groups. Finally, specification (4) again employs the difference-in-difference approach. In

26
particular, a GL Bid reduces interest rates before and after the elimination of rewards, while this effect is
more pronounced afterwards. Altogether, the results are again fully consistent with those for the
traditional regression framework (Table VI).
B.2.3. Loan Performance
Table X presents the results for loan performance. Specification (1) shows that the group type
significantly influences hazard rates even after controlling for other factors. Loans in reward groups
(Reward Group) and loans resulting from listings posted outside groups (No Group) exhibit higher hazard
rates than loans in no-reward groups as the reference group. The other results remain stable when
compared to those obtained in Table VII. Additionally, from specification (3) of Table X we see again
that the adverse effect of GL Bid only applies to reward groups, whereas in no-reward groups GL Bid
significantly lowers the hazard rate of the loan.
<INSERT TABLE X ABOUT HERE>
Overall, we find that the results from the difference-in-difference approach strongly support those
obtained from the earlier analysis. This evidence assures that the effects described above are indeed
driven by the existence and elimination of group leader rewards and not by any other event or trend that
hits all group listings (i.e. those of both reward and no-reward groups) in the same way.
C. Economic significance
To assess the economic significance of the results, we consider both the borrower’s and the lender’s
perspective. First, for the borrowers, we calculate the amount left on the table by considering percentages
(IRRs) and dollar amounts. For the percentages, we analyze the difference between the IRR that the

27
borrowers effectively pay and the IRR that the borrowers would pay if there was no reward system in
place. The results show that this difference amounts to about 1 percentage point for each credit grade and
is statistically significant. For the dollar amounts, these are a function of the amount borrowed and the
difference between the IRR that borrowers effectively pay and the IRR that the borrowers would pay if no
reward system was in place. The results provide evidence that the values range between 30 and 100 USD,
depending on the credit grade.
Second, for the group leaders, we calculate the average gain from a loan before the elimination of
rewards, by providing a breakdown into the losses on the loans these group leaders bid on and the rewards
they receive. The results show for no-reward groups that the group leader’s investment pays off on
average, except for loans of the credit grade HR – despite the fact that the group leader does not receive a
reward. For the reward groups, however, we find that had there been no reward, the group leaders in fact
would have made a loss, i.e. it is only the reward that makes their loan granting profitable. This fact
underlines the substantial economic significance of rewards for the group leader. The difference between
the group leaders’ actual gain and their hypothetical (negative) gain without rewards amounts to 90 USD
on average and is highly statistically significant for all credit grades. Depending on the credit grade, this
amounts to 0.9% to 1.4% of the average amount funded.24
III. Robustness
In this section, we provide several analyses on the robustness of our results. In particular, we show that
our results are not due to other policy changes during our sample period. We also investigate the choice of
the timespan used for the analysis of the loan performance.
24 More detailed results for each credit grade as well as borrowers and lenders are available upon request.

28
A. Second Loans
Prosper.com allows borrowers with an existing loan to demand a second loan after 10/30/2007. In our
previous analyses, we control for this fact by removing second loans from the sample. We further test the
robustness of our results with respect to this policy change by completely removing from the sample all
members with more than one loan – i.e. not only their second loans but also their first ones as well as the
corresponding listings. Our results do not change.
One may argue that the possibility to obtain a second loan may not only play a role for lenders who
request a second loan, but also for lenders who do not do so (but may have considered doing so). In order
to control for this, in a separate analysis we only consider those observations between the elimination of
group leader rewards and 10/30/2007, when the possibility to request a second loan is introduced. The
condensed Table XI shows the coefficients of group leader bids for listing success (Panel A), interest
rates (Panel B) and loan performance (Panel C).25 Compared to the corresponding numbers in Tables V,
VI, and VII, the results do not change materially, showing that the possibility to obtain a second loan does
not drive our results.
<INSERT TABLE XI ABOUT HERE>
B. Fee Changes During the Sample Period
We also test whether the two fee changes after the elimination of group leader rewards – i.e. the change of
lender fees on 10/30/2007 and the change of borrower fees on 01/04/2008 – influence our results. This
25 To economize space, only these core results on group leader bids are reported. The results on listing characteristics, borrower characteristics, and the remaining group characteristics do not change substantially, either. The full tables are available upon request.

29
can also be controlled by limiting the analysis to the time period before 10/30/2007, when the first of the
two fee changes takes place. Therefore, we again refer the reader to Table XI, which show that our results
are not driven by either of the two fee changes, but indeed by the elimination of group leader rewards.26,27
C. Stability of groups
As described before, borrowers can choose which group they would like to belong to and group leaders
may then grant or deny access to their groups. We thus analyze the stability of the groups, in particular
the likelihood of a transition between the three types of groups: reward groups, no-reward groups, and no
groups. We find that the likelihood is very high that a borrower applies for a loan in the same type of
group as where he applies for his previous listing, i.e. the likelihood of switching to other types of groups
is low, amounting to significantly less than 10% of all the cases. Furthermore, this likelihood of switching
does not materially change between before and after the elimination of group leader rewards.
We also compare various borrower characteristics as well as the borrowers’ distribution in terms of credit
grades before and after the elimination of group leader rewards. We find that the distribution of
borrowers’ credit grades does not improve in reward groups after the elimination of group leader
rewards, but it rather deteriorates. However, while the borrower pool may deteriorate, this is
accompanied by an adequate change in the behavior of the group leaders.
26 We conduct a similar robustness check for the difference-in-difference approach. Again, the corresponding results show that our findings are robust with respect to the two fee changes described above. The corresponding tables are available from the authors upon request. 27 As an alternative robustness test to the temporal restrictions, we also explicitly control for the fee changes. We do so by adding (i) a variable for the percentage point change in the borrower fees and (ii) a variable for the percentage point change in the lender fees. We find that (i) neither of these fee changes is relevant for listing success, (ii) both of these fee changes slightly increase the interest rate to be paid by the borrower (suggesting that the increase in the lender fees is passed through), and (iii) the fee changes may slightly increase default. However, explicitly controlling for these fee changes does not change our main results of interest on the impact of the group leader bids.

30
This evidence suggests that our results are not driven by a change in the borrower portfolio, but
rather that the worse quality of borrowers afterwards is more than offset by the better incentives
that are in place then.
IV. Conclusion
The rapidly and significantly growing markets for crowdfunding, in which individuals directly finance
other individuals or companies without financial intermediation, are applied to various types of financing
worldwide and provide a significant potential pool of capital. This insight has led politicians across the
spectrum to alleviate the constraints for this type of financing for companies; as well as to carefully watch
online lending in peer-to-peer transactions across individuals. Proponents thus view crowdfunding as a
way to fundamentally change the investment and financing process as well as the role of financial
intermediation. However, a large number of regulators and academicians are concerned about the
potential of investors being taken advantage of by unscrupulous lenders. These markets, despite having
developed into a multi-billion-dollar industry, have received relatively little attention with respect to its
appropriate regulation and not much is known about the involved agents’ actions.
We find, in the presence of rewards, group leader bids result in lower interest rates but higher default
rates. Thus, while group leader bids enhance the credibility of an issue and the perception of higher
quality, these issues do not appear to be of higher quality as evidenced ex-post by higher default rates
suggesting that group leaders behave strategically. It is only when group leaders have sufficient skin in
the game that we see default rates reduce along with a decrease in interest rates. The results suggest there
are perverse incentives of the group leaders that are not fully recognized by the market. While learning

31
takes place, the process is too slow to avoid the described economic outcomes. We do not see similar
perverse incentives in groups where the leaders do not get rewards. Interestingly, in the same groups,
once the rewards are eliminated this perverse behavior disappears, instead now when group leaders bid
we see lower interest rates along with lower default rates.
The results shed light on the functioning of the growing markets for crowdfunding and the incentives of
the agents in these markets, including the slow learning process by market participants. They also provide
some insight on the ongoing debate about the proper regulatory framework for consumer lending. While
the results cannot be simply generalized to other financial markets in which consumer protection is also of
vital interest, our results provide evidence from a clean experiment that shows that proper incentives are
crucial for giving borrowers access to credit and to induce lenders to carefully screen loan applicants. Our
results suggest the importance of further research on the necessary incentives to improve consumer
protection in the markets for crowdfunding particularly and in the finance and lending industry more
generally.

32
References
Berger, Allen N., Nathan H. Miller, Mitchell A. Petersen, Raghuram G. Rajan, and Jeremy C. Stein, 2005, Does function follow organizational form? Evidence from the lending practices of large and small banks, Journal of Financial Economics, 76(2), 237-269. Berger, Allen N., and Gregory F. Udell, 2002, Small business credit availability and relationship lending: the importance of bank organizational structure, The Economic Journal, 112(477), F32-F53. Bergstresser, Daniel, John M.R. Chalmers, and Peter Tufano, 2009, Assessing the costs and benefits of brokers in the mutual fund industry, Review of Financial Studies, 22(10), 4129-4156. Bolton, Patrick, Xavier Freixas, and Joel Shapiro, 2007, Conflicts of interest, information provision, and competition in the financial services industry, Journal of Financial Economics, 85(2), 297-330. Bolton, Patrick, and David S. Scharfstein, 1996, Optimal debt structure and the number of creditors, Journal of Political Economy, 104(1), 1-25. Crowdsourcing.org, 2012, Crowdfunding Industry Report. Market Trends, Composition and Crowdfunding Platforms, Research Report. Crowdsourcing.org. 2013. 2013CF – The crowdfunding industry report. Research Report. Degryse, Hans, Luc Laeven, and Steven Ongena, 2009, The Impact of Organizational Structure and Lending Technology on Banking Competition, Review of Finance 13, 225-259. Duarte, Jefferson, Stephan Siegel, and Lance Young, 2012, Trust and Credit: The Role of Appearance in Peer-to-peer Lending. Review of Financial Studies, 25(8), 2455-2483. Ferrari, Stijn, Frank Verboven, and Hans Degryse, 2010, Investment and Usage of New Technologies: Evidence from a Shared ATM Network, American Economic Review, 100(3), 1046-1079. Gorton, Gary B., and George G. Pennacchi, 1995, Banks and loan sales: Marketing nonmarketable assets, Journal of Monetary Economics, 35(3), 389-411. Holmstrom, Bengt, 1979, Moral hazard and observability, Bell Journal of Economics, 10(1), 74-91. Holmstrom, Bengt, and Jean Tirole, 1997, Financial intermediation, loanable funds, and the real sector, Quarterly Journal of Economics, 112(3), 663-691. Hulme, Michael K., and Collette Wright, 2006, Internet based social lending: Past, present and future, Working paper. Inderst, Roman, and Marco Ottaviani, 2009, Misselling through agents, American Economic Review, 99(3), 883-908. Iyer, Rajkamal, Asim Ijaz Khwaja, Erzo F. P. Luttmer, and Kelly Shue, 2010, Inferring Asset Quality: Determining Borrower Creditworthiness in Peer-to-Peer Lending Markets, Working paper.

33
Lin, Mingfeng, Nagpurnanand R. Prabhala, and Siva Viswanathan, 2013, Judging Borrowers by the Company They Keep: Friendship Networks and Information Asymmetry in Online Peer-to-Peer Lending, Management Science, 59(1), 17-35. Muralidharan, Karthik, and Venkatesh Sundararaman, 2011, Teacher Performance Pay: Experimental Evidence from India. Journal of Political Economy, 119(1), 39-77. Michels, Jeremy, 2012, Do Unverifiable Disclosures Matter? Evidence from Peer-to-Peer Lending, Accounting Review, 87(4), 1385-1413. Pope, Devin G., and Justin R. Sydnor, 2011, What’s in a picture? Evidence of discrimination from Prosper.com, Journal of Human Resources, 46(1), 53-92. Ravina, Enrichetta, 2012, Love & loans: The effect of beauty and personal characteristics in credit markets, Working paper. Roberts, Michael R. and Toni M. Whited, 2012, Endogeneity in Empirical Corporate Finance, Working Paper. Stein, Jeremy C., 2002, Information Production and Capital Allocation: Decentralized versus Hierarchical Firms, Journal of Finance, 57(5), 1891-1921. Sufi, Amir, 2007, Information Asymmetry and Financing Arrangements: Evidence from Syndicated Loans, Journal of Finance, 62(2), 629-668. United States Government Accountability Office, 2011, Person-to-Person Lending: New Regulatory Challenges Could Emerge as the Industry Grows, Report to Congressional Committees.
34
Figure 1: Timeline of Policy Changes on Prosper.com
05/30/2006
Added: Delinquency
Variables
08/16/2006
Added: Group Leader Endorsements
10/19/2006
Added: Group Ratings
09/12/2007
Eliminated: Group Leader
Rewards (information leakage since 6/14/2007)
10/30/2007
Added: 2nd Loans Changed:
Lender Fees
01/04/2008
Changed: Borrower Fees
02/12/2007
Added: Friend
Endorsements Changed:
Credit Grades Borrower Fees,
Lender Fees
04/19/2006
Added: Homeowner
Status Verified Bank
Account
Sample Period 04/15/2008
Changed: Lender Fees
Time
02/13/2006
Official Start
11/09/2005
Start of Test Period
35
Figure 2: Group Leader Bids
Cre
dit
Gra
de
Ch
an
ge
, Bo
rro
we
r &
Le
nd
er
Fe
e C
ha
ng
e
Le
aka
ge
Th
at G
rou
p L
ea
de
r R
ew
ard
s M
igh
t Be
Elim
ina
ted
2n
d L
oa
ns,
Le
nd
er
Fe
e C
ha
ng
e
Bo
rro
we
r F
ee
Ch
an
ge
Le
nd
er
Fe
e C
ha
ng
e
0%
20%
40%
60%
80%
100%
Sha
re o
f Lis
tings
with
aG
roup
Lea
der
Bid
2007w7 2007w22 2007w37 2007w52 2008w15Week
No-Reward Groups Reward Groups
In this figure we report – by group type – the weekly share of listings (i.e. of requests for borrowing money) with at least one group leader bid.
36
Table I: Social Lending Overview
In this table we report general descriptive statistics on Prosper.com, distinguishing between listings (i.e. all requests for borrowing money) and loans (i.e. successfully and completely funded requests for borrowing money). Panel A summarizes listing characteristics, Panel B reports success measures for these listings, Panel C provides the distribution of credit grades, and Panel D shows borrower characteristics.
Listings Loans N Mean S.D. N Mean S.D. PANEL A: LISTING CHARACTERISTICS Amount Requested (in $1,000) 153,541 8.16 6.49 12,183 7.10 6.01Borrower Maximum Rate (%) 153,541 17.97 7.62 12,183 20.01 6.92Duration (Days) 153,541 7.52 2.11 12,183 7.70 2.12Listing Closed As Soon As Funded (Dummy) 153,541 0.31 0.46 12,183 0.23 0.42
PANEL B: SUCCESS MEASURES Listing Success (Dummy) 153,541 0.08 0.27 12,183 1.00 0.00Number of Bids 153,541 16.86 63.29 12,183 161.64 152.67Listing Was Bid On (Dummy) 153,541 0.53 0.50 12,183 1.00 0.00Borrower Rate (%) 153,541 17.75 7.57 12,183 17.29 6.62
PANEL C: DISTRIBUTION OF CREDIT
GRADES AA/A 9,583 3,143B 8,517 1,979C 16,513 2,530D 24,771 2,292E 27,423 1,072HR 66,734 1,167TOTAL 153,541 12,183
PANEL D: BORROWER CHARACTERISTICS Debt-to-Income Ratio 153,541 0.65 1.65 12,183 0.40 1.18Is Borrower Home Owner (Dummy) 153,541 0.34 0.48 12,183 0.47 0.50Current Delinquencies 153,541 3.63 4.95 12,183 1.19 2.90Delinquencies Last 7 Years 153,541 11.51 16.82 12,183 5.53 11.99Total Credit Lines 153,541 25.66 14.30 12,183 24.51 14.16Months in Current Occupation 153,541 36.15 64.16 12,183 37.41 65.08
37
Table II: Social Lending: Overview by Group Type
In this table we report general descriptive statistics on Prosper.com, distinguishing between listings (i.e. all requests for borrowing money) and loans (i.e. successfully and completely funded requests for borrowing money). We further distinguish whether the listing was not posted in a group (“No Group”), in a no-reward group (“No-reward Group”) or in a reward group (“Reward Group”). Panel A summarizes listingcharacteristics, Panel B reports success measures for these listings, Panel C provides the distribution of credit grades, Panel D shows borrower characteristics; and Panel D gives group characteristics for those listings / loans that were posted in groups.
Listings Loans
No Group
No-reward Group
Reward Group
No Group No-reward
Group Reward Group
PANEL A: LISTING CHARACTERISTICS (MEANS) Amount Requested (in $1,000) 8.34 7.70 7.56 7.09 6.35 7.22Borrower Maximum Rate (%) 17.61 17.90 19.28 19.29 18.14 21.62Duration (Days) 7.42 7.87 7.86 7.46 7.84 8.10Listing Closed As Soon As Funded (Dummy) 0.31 0.21 0.29 0.25 0.16 0.20
PANEL B: SUCCESS MEASURES (MEANS) Listing Success (Dummy) 0.06 0.35 0.12 1.00 1.00 1.00Number of Bids 13.66 60.75 25.83 157.10 155.33 170.93Listing Was Bid On (Dummy) 0.50 0.82 0.66 1.00 1.00 1.00Borrower Rate (%) 17.44 16.84 18.91 16.70 15.12 18.70
PANEL C: DISTRIBUTION OF CREDIT GRADES (N) AA/A 7,641 301 1,641 2,303 181 659B 6,532 146 1,839 1,366 73 540C 12,572 293 3,648 1,572 119 839D 18,896 346 5,529 1,258 130 904E 21,005 261 6,157 514 63 495HR 52,037 545 14,152 432 88 647TOTAL 118,683 1,892 32,966 7,445 654 4,084
PANEL D: BORROWER CHARACTERISTICS (MEANS)Debt-to-Income Ratio 0.63 0.61 0.74 0.31 0.59 0.53Is Borrower Home Owner (Dummy) 0.35 0.35 0.34 0.49 0.42 0.44Current Delinquencies 3.60 2.34 3.84 0.87 1.29 1.77Delinquencies Last 7 Years 11.39 8.68 12.11 4.55 5.66 7.31Total Credit Lines 25.56 24.79 26.07 24.10 24.30 25.31Months in Current Occupation 31.33 43.07 53.11 27.02 43.07 55.45
PANEL E: GROUP CHARACTERISTICS (MEANS) GL Bid (Dummy) 0.46 0.32 0.70 0.58GL Bids Successfully (Dummy) 0.41 0.29 0.55 0.33Vetting (Dummy) 0.29 0.09 0.30 0.14Listing Review Requirement (Dummy) 0.66 0.41 0.80 0.64GL Offers Help (Dummy) 0.18 0.08 0.28 0.11GL Endorsement (Dummy) 0.53 0.38 0.71 0.60
N 118,683 1,892 32,966 7,445 654 4,084
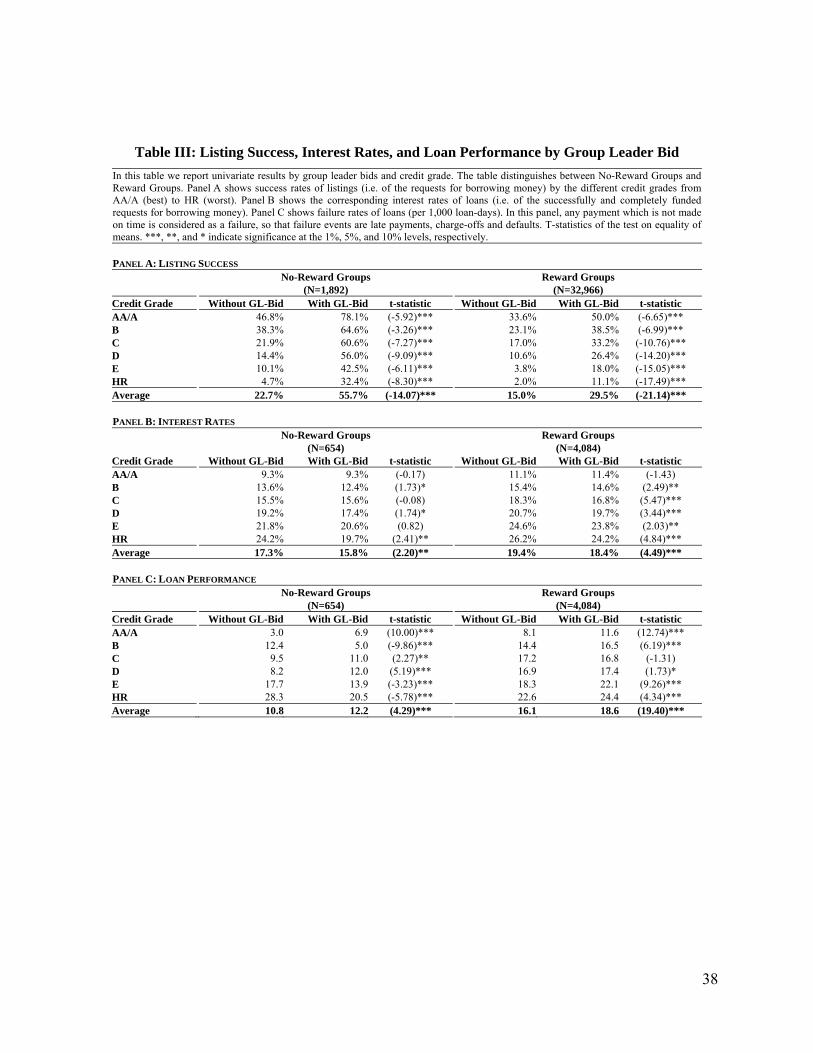
38
Table III: Listing Success, Interest Rates, and Loan Performance by Group Leader Bid
In this table we report univariate results by group leader bids and credit grade. The table distinguishes between No-Reward Groups and Reward Groups. Panel A shows success rates of listings (i.e. of the requests for borrowing money) by the different credit grades from AA/A (best) to HR (worst). Panel B shows the corresponding interest rates of loans (i.e. of the successfully and completely funded requests for borrowing money). Panel C shows failure rates of loans (per 1,000 loan-days). In this panel, any payment which is not made on time is considered as a failure, so that failure events are late payments, charge-offs and defaults. T-statistics of the test on equality of means. ***, **, and * indicate significance at the 1%, 5%, and 10% levels, respectively.
PANEL A: LISTING SUCCESS
No-Reward Groups Reward Groups (N=1,892) (N=32,966)
Credit Grade Without GL-Bid With GL-Bid t-statistic Without GL-Bid With GL-Bid t-statistic AA/A 46.8% 78.1% (-5.92)*** 33.6% 50.0% (-6.65)*** B 38.3% 64.6% (-3.26)*** 23.1% 38.5% (-6.99)*** C 21.9% 60.6% (-7.27)*** 17.0% 33.2% (-10.76)*** D 14.4% 56.0% (-9.09)*** 10.6% 26.4% (-14.20)*** E 10.1% 42.5% (-6.11)*** 3.8% 18.0% (-15.05)*** HR 4.7% 32.4% (-8.30)*** 2.0% 11.1% (-17.49)*** Average 22.7% 55.7% (-14.07)*** 15.0% 29.5% (-21.14)***
PANEL B: INTEREST RATES
No-Reward Groups Reward Groups (N=654) (N=4,084)
Credit Grade Without GL-Bid With GL-Bid t-statistic Without GL-Bid With GL-Bid t-statistic AA/A 9.3% 9.3% (-0.17) 11.1% 11.4% (-1.43) B 13.6% 12.4% (1.73)* 15.4% 14.6% (2.49)** C 15.5% 15.6% (-0.08) 18.3% 16.8% (5.47)*** D 19.2% 17.4% (1.74)* 20.7% 19.7% (3.44)*** E 21.8% 20.6% (0.82) 24.6% 23.8% (2.03)** HR 24.2% 19.7% (2.41)** 26.2% 24.2% (4.84)*** Average 17.3% 15.8% (2.20)** 19.4% 18.4% (4.49)***
PANEL C: LOAN PERFORMANCE
No-Reward Groups Reward Groups (N=654) (N=4,084)
Credit Grade Without GL-Bid With GL-Bid t-statistic Without GL-Bid With GL-Bid t-statistic AA/A 3.0 6.9 (10.00)*** 8.1 11.6 (12.74)*** B 12.4 5.0 (-9.86)*** 14.4 16.5 (6.19)*** C 9.5 11.0 (2.27)** 17.2 16.8 (-1.31) D 8.2 12.0 (5.19)*** 16.9 17.4 (1.73)* E 17.7 13.9 (-3.23)*** 18.3 22.1 (9.26)*** HR 28.3 20.5 (-5.78)*** 22.6 24.4 (4.34)*** Average 10.8 12.2 (4.29)*** 16.1 18.6 (19.40)***
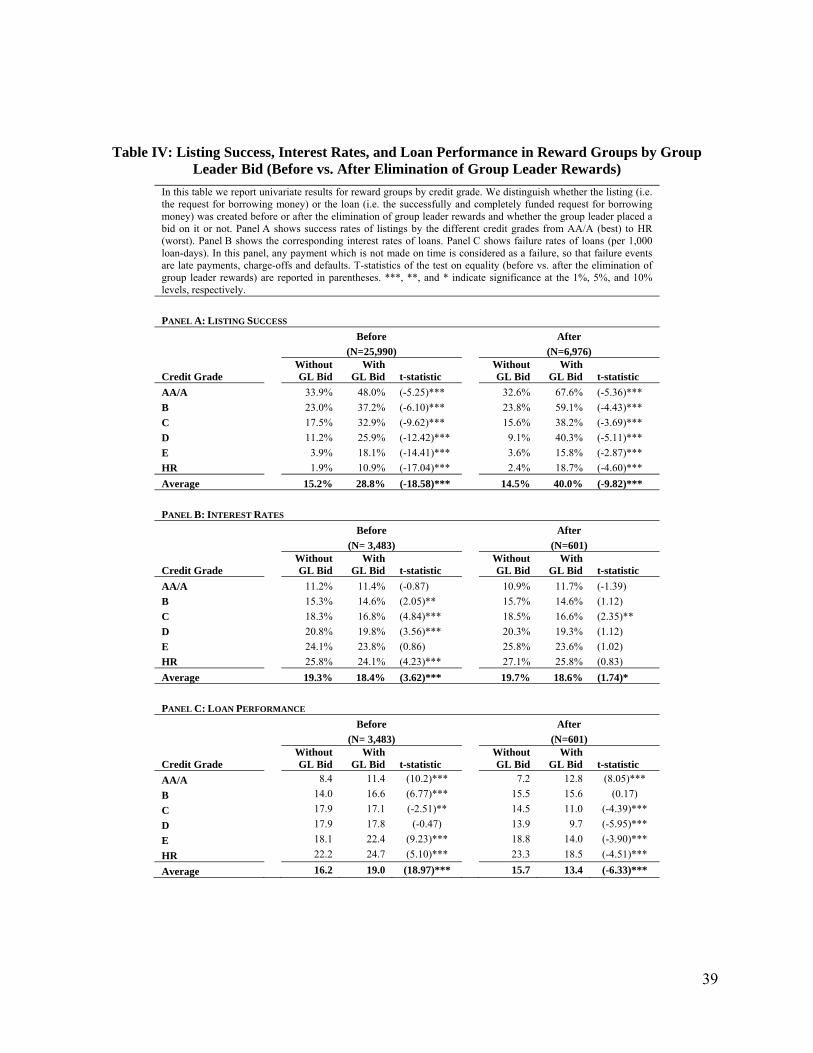
39
Table IV: Listing Success, Interest Rates, and Loan Performance in Reward Groups by Group Leader Bid (Before vs. After Elimination of Group Leader Rewards)
In this table we report univariate results for reward groups by credit grade. We distinguish whether the listing (i.e. the request for borrowing money) or the loan (i.e. the successfully and completely funded request for borrowing money) was created before or after the elimination of group leader rewards and whether the group leader placed a bid on it or not. Panel A shows success rates of listings by the different credit grades from AA/A (best) to HR (worst). Panel B shows the corresponding interest rates of loans. Panel C shows failure rates of loans (per 1,000 loan-days). In this panel, any payment which is not made on time is considered as a failure, so that failure events are late payments, charge-offs and defaults. T-statistics of the test on equality (before vs. after the elimination of group leader rewards) are reported in parentheses. ***, **, and * indicate significance at the 1%, 5%, and 10% levels, respectively.
PANEL A: LISTING SUCCESS
Before After
(N=25,990) (N=6,976)
Credit Grade Without GL Bid
With GL Bid t-statistic
Without GL Bid
With GL Bid t-statistic
AA/A 33.9% 48.0% (-5.25)*** 32.6% 67.6% (-5.36)***
B 23.0% 37.2% (-6.10)*** 23.8% 59.1% (-4.43)***
C 17.5% 32.9% (-9.62)*** 15.6% 38.2% (-3.69)***
D 11.2% 25.9% (-12.42)*** 9.1% 40.3% (-5.11)***
E 3.9% 18.1% (-14.41)*** 3.6% 15.8% (-2.87)***
HR 1.9% 10.9% (-17.04)*** 2.4% 18.7% (-4.60)***
Average 15.2% 28.8% (-18.58)*** 14.5% 40.0% (-9.82)***
PANEL B: INTEREST RATES
Before After
(N= 3,483) (N=601)
Credit Grade Without GL Bid
With GL Bid t-statistic
Without GL Bid
With GL Bid t-statistic
AA/A 11.2% 11.4% (-0.87) 10.9% 11.7% (-1.39)
B 15.3% 14.6% (2.05)** 15.7% 14.6% (1.12)
C 18.3% 16.8% (4.84)*** 18.5% 16.6% (2.35)**
D 20.8% 19.8% (3.56)*** 20.3% 19.3% (1.12)
E 24.1% 23.8% (0.86) 25.8% 23.6% (1.02)
HR 25.8% 24.1% (4.23)*** 27.1% 25.8% (0.83)
Average 19.3% 18.4% (3.62)*** 19.7% 18.6% (1.74)*
PANEL C: LOAN PERFORMANCE
Before After
(N= 3,483) (N=601)
Credit Grade Without GL Bid
With GL Bid t-statistic
Without GL Bid
With GL Bid t-statistic
AA/A 8.4 11.4 (10.2)*** 7.2 12.8 (8.05)***
B 14.0 16.6 (6.77)*** 15.5 15.6 (0.17)
C 17.9 17.1 (-2.51)** 14.5 11.0 (-4.39)***
D 17.9 17.8 (-0.47) 13.9 9.7 (-5.95)***
E 18.1 22.4 (9.23)*** 18.8 14.0 (-3.90)***
HR 22.2 24.7 (5.10)*** 23.3 18.5 (-4.51)***
Average 16.2 19.0 (18.97)*** 15.7 13.4 (-6.33)***
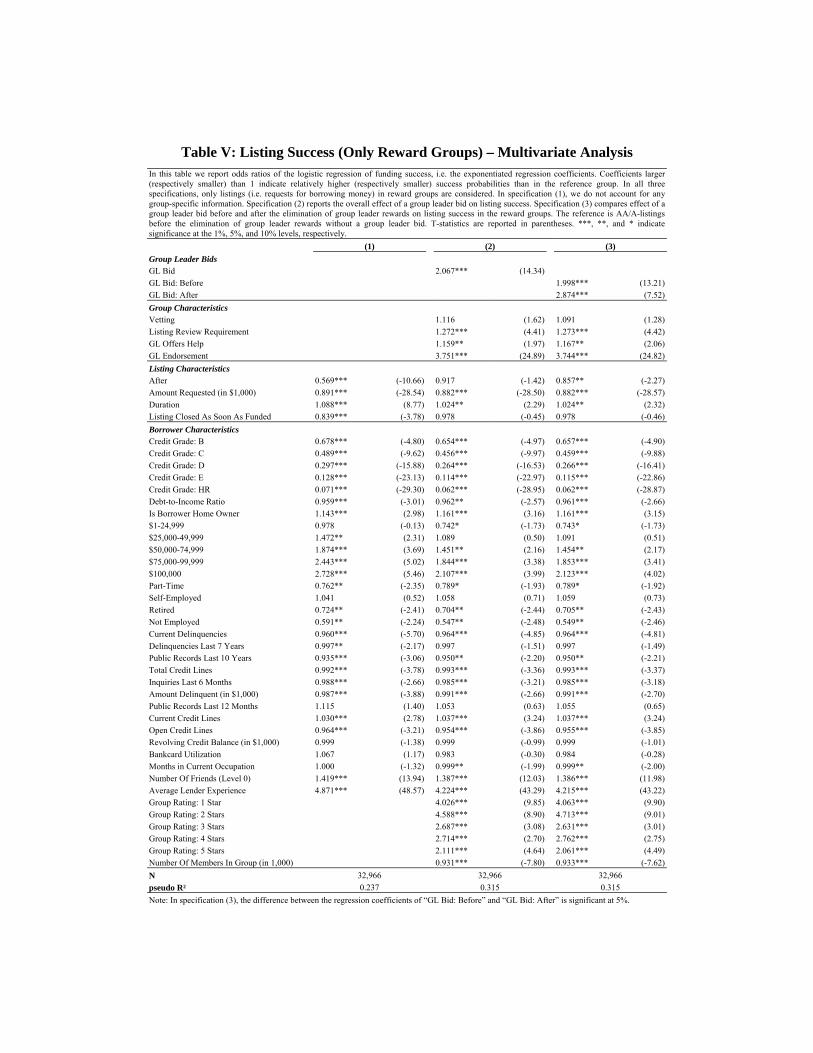
Table V: Listing Success (Only Reward Groups) – Multivariate Analysis In this table we report odds ratios of the logistic regression of funding success, i.e. the exponentiated regression coefficients. Coefficients larger (respectively smaller) than 1 indicate relatively higher (respectively smaller) success probabilities than in the reference group. In all three specifications, only listings (i.e. requests for borrowing money) in reward groups are considered. In specification (1), we do not account for any group-specific information. Specification (2) reports the overall effect of a group leader bid on listing success. Specification (3) compares effect of a group leader bid before and after the elimination of group leader rewards on listing success in the reward groups. The reference is AA/A-listings before the elimination of group leader rewards without a group leader bid. T-statistics are reported in parentheses. ***, **, and * indicate significance at the 1%, 5%, and 10% levels, respectively.
(1) (2) (3)
Group Leader Bids
GL Bid 2.067*** (14.34)
GL Bid: Before 1.998*** (13.21)
GL Bid: After 2.874*** (7.52)
Group Characteristics
Vetting 1.116 (1.62) 1.091 (1.28)
Listing Review Requirement 1.272*** (4.41) 1.273*** (4.42)
GL Offers Help 1.159** (1.97) 1.167** (2.06)
GL Endorsement 3.751*** (24.89) 3.744*** (24.82)
Listing Characteristics
After 0.569*** (-10.66) 0.917 (-1.42) 0.857** (-2.27)
Amount Requested (in $1,000) 0.891*** (-28.54) 0.882*** (-28.50) 0.882*** (-28.57)
Duration 1.088*** (8.77) 1.024** (2.29) 1.024** (2.32)
Listing Closed As Soon As Funded 0.839*** (-3.78) 0.978 (-0.45) 0.978 (-0.46)
Borrower Characteristics
Credit Grade: B 0.678*** (-4.80) 0.654*** (-4.97) 0.657*** (-4.90)
Credit Grade: C 0.489*** (-9.62) 0.456*** (-9.97) 0.459*** (-9.88)
Credit Grade: D 0.297*** (-15.88) 0.264*** (-16.53) 0.266*** (-16.41)
Credit Grade: E 0.128*** (-23.13) 0.114*** (-22.97) 0.115*** (-22.86)
Credit Grade: HR 0.071*** (-29.30) 0.062*** (-28.95) 0.062*** (-28.87)
Debt-to-Income Ratio 0.959*** (-3.01) 0.962** (-2.57) 0.961*** (-2.66)
Is Borrower Home Owner 1.143*** (2.98) 1.161*** (3.16) 1.161*** (3.15)
$1-24,999 0.978 (-0.13) 0.742* (-1.73) 0.743* (-1.73)
$25,000-49,999 1.472** (2.31) 1.089 (0.50) 1.091 (0.51)
$50,000-74,999 1.874*** (3.69) 1.451** (2.16) 1.454** (2.17)
$75,000-99,999 2.443*** (5.02) 1.844*** (3.38) 1.853*** (3.41)
$100,000 2.728*** (5.46) 2.107*** (3.99) 2.123*** (4.02)
Part-Time 0.762** (-2.35) 0.789* (-1.93) 0.789* (-1.92)
Self-Employed 1.041 (0.52) 1.058 (0.71) 1.059 (0.73)
Retired 0.724** (-2.41) 0.704** (-2.44) 0.705** (-2.43)
Not Employed 0.591** (-2.24) 0.547** (-2.48) 0.549** (-2.46)
Current Delinquencies 0.960*** (-5.70) 0.964*** (-4.85) 0.964*** (-4.81)
Delinquencies Last 7 Years 0.997** (-2.17) 0.997 (-1.51) 0.997 (-1.49)
Public Records Last 10 Years 0.935*** (-3.06) 0.950** (-2.20) 0.950** (-2.21)
Total Credit Lines 0.992*** (-3.78) 0.993*** (-3.36) 0.993*** (-3.37)
Inquiries Last 6 Months 0.988*** (-2.66) 0.985*** (-3.21) 0.985*** (-3.18)
Amount Delinquent (in $1,000) 0.987*** (-3.88) 0.991*** (-2.66) 0.991*** (-2.70)
Public Records Last 12 Months 1.115 (1.40) 1.053 (0.63) 1.055 (0.65)
Current Credit Lines 1.030*** (2.78) 1.037*** (3.24) 1.037*** (3.24)
Open Credit Lines 0.964*** (-3.21) 0.954*** (-3.86) 0.955*** (-3.85)
Revolving Credit Balance (in $1,000) 0.999 (-1.38) 0.999 (-0.99) 0.999 (-1.01)
Bankcard Utilization 1.067 (1.17) 0.983 (-0.30) 0.984 (-0.28)
Months in Current Occupation 1.000 (-1.32) 0.999** (-1.99) 0.999** (-2.00)
Number Of Friends (Level 0) 1.419*** (13.94) 1.387*** (12.03) 1.386*** (11.98)
Average Lender Experience 4.871*** (48.57) 4.224*** (43.29) 4.215*** (43.22)
Group Rating: 1 Star 4.026*** (9.85) 4.063*** (9.90)
Group Rating: 2 Stars 4.588*** (8.90) 4.713*** (9.01)
Group Rating: 3 Stars 2.687*** (3.08) 2.631*** (3.01)
Group Rating: 4 Stars 2.714*** (2.70) 2.762*** (2.75)
Group Rating: 5 Stars 2.111*** (4.64) 2.061*** (4.49)
Number Of Members In Group (in 1,000) 0.931*** (-7.80) 0.933*** (-7.62)
N 32,966 32,966 32,966
pseudo R² 0.237 0.315 0.315
Note: In specification (3), the difference between the regression coefficients of “GL Bid: Before” and “GL Bid: After” is significant at 5%.
41
Table VI: Interest Rates (Only Reward Groups) – Multivariate Analysis In this table we report the regression coefficients from Tobit regressions of the lender interest rate of loans (i.e. of successfully and completely funded requests for borrowing money). In all three specifications, only loans in reward groups are considered. In specification (1), we do not account for any group-specific information. Specification (2) reports the overall effect of a group leader bid on the interest rate. Specification (3) compares the effect of a group leader bid before and after the elimination of group leader rewards on the interest rate in the reward groups. The reference is AA/A-loans before the elimination of group leader rewards without a group leader bid. T-statistics are reported in parentheses. ***, **, and * indicate significance at the 1%, 5%, and 10% levels, respectively.
(1) (2) (3)
Group Leader Bids
GL Bid -0.737*** (-5.69)
GL Bid: Before -0.666*** (-4.97)
GL Bid: After -1.351*** (-4.12)
Group Characteristics
Vetting -0.606*** (-3.71) -0.546*** (-3.29)
Listing Review Requirement 0.214 (1.50) 0.217 (1.52)
GL Offers Help -0.313* (-1.76) -0.329* (-1.85)
GL Endorsement -0.194 (-1.52) -0.175 (-1.38)
Listing Characteristics
After 1.722*** (11.52) 1.524*** (9.43) 1.731*** (9.06)
Amount Requested (in $1,000) 0.289*** (27.47) 0.295*** (27.95) 0.297*** (28.03)
Duration -0.033 (-1.27) -0.005 (-0.19) -0.005 (-0.21)
Listing Closed As Soon As Funded 3.321*** (24.89) 3.125*** (23.08) 3.130*** (23.12)
Borrower Characteristics
Credit Grade: B 2.992*** (15.24) 2.972*** (15.26) 2.959*** (15.20)
Credit Grade: C 5.803*** (31.72) 5.781*** (31.78) 5.764*** (31.68)
Credit Grade: D 8.637*** (44.79) 8.668*** (45.19) 8.651*** (45.08)
Credit Grade: E 12.231*** (51.94) 12.354*** (52.48) 12.333*** (52.37)
Credit Grade: HR 12.990*** (53.77) 13.187*** (54.48) 13.168*** (54.39)
Debt-to-Income Ratio 0.150*** (3.84) 0.168*** (4.33) 0.171*** (4.40)
Is Borrower Home Owner -0.518*** (-4.29) -0.542*** (-4.53) -0.546*** (-4.56)
$1-24,999 0.966** (2.09) 1.082** (2.36) 1.072** (2.33)
$25,000-49,999 0.331 (0.73) 0.430 (0.95) 0.423 (0.94)
$50,000-74,999 0.015 (0.03) 0.130 (0.28) 0.123 (0.27)
$75,000-99,999 -0.274 (-0.57) -0.189 (-0.40) -0.198 (-0.42)
$100,000 -0.726 (-1.48) -0.675 (-1.38) -0.690 (-1.42)
Part-Time 0.179 (0.57) 0.189 (0.60) 0.179 (0.57)
Self-Employed 0.093 (0.47) 0.041 (0.21) 0.043 (0.22)
Retired -0.360 (-0.97) -0.368 (-1.00) -0.361 (-0.98)
Not Employed 1.799*** (2.67) 1.695** (2.55) 1.687** (2.53)
Current Delinquencies 0.082*** (3.83) 0.081*** (3.80) 0.080*** (3.77)
Delinquencies Last 7 Years 0.017*** (3.57) 0.016*** (3.46) 0.016*** (3.46)
Public Records Last 10 Years 0.156** (2.49) 0.166*** (2.69) 0.172*** (2.78)
Total Credit Lines 0.013** (2.29) 0.013** (2.32) 0.013** (2.33)
Inquiries Last 6 Months 0.075*** (5.93) 0.076*** (6.08) 0.076*** (6.04)
Amount Delinquent (in $1,000) 0.020** (2.01) 0.016 (1.63) 0.016* (1.67)
Public Records Last 12 Months 0.177 (0.79) 0.140 (0.63) 0.132 (0.59)
Current Credit Lines -0.049* (-1.72) -0.050* (-1.76) -0.050* (-1.76)
Open Credit Lines 0.043 (1.39) 0.045 (1.46) 0.044 (1.45)
Revolving Credit Balance (in $1,000) 0.006*** (2.71) 0.006*** (2.85) 0.006*** (2.81)
Bankcard Utilization 0.426*** (2.82) 0.409*** (2.73) 0.408*** (2.73)
Months in Current Occupation 0.000 (0.26) 0.000 (0.55) 0.000 (0.56)
Number Of Friends (Level 0) -0.138** (-2.35) -0.133** (-2.29) -0.131** (-2.26)
Average Lender Experience -0.098*** (-2.72) -0.097*** (-2.72) -0.095*** (-2.68)
Group Rating: 1 Star 0.595 (1.56) 0.582 (1.52)
Group Rating: 2 Stars 1.084** (2.33) 1.014** (2.17)
Group Rating: 3 Stars 1.215 (1.50) 1.208 (1.49)
Group Rating: 4 Stars 1.081 (1.26) 1.052 (1.23)
Group Rating: 5 Stars 0.524 (1.21) 0.550 (1.27)
Number Of Members In Group (in 1,000) -0.032 (-1.27) -0.033 (-1.32)
Constant 7.129*** (13.74) 6.704*** (10.67) 6.673*** (10.62)
4,084 4,084 4,084
0.182 0.185 0.185
Note: In specification (3), the difference between the regression coefficients of “GL Bid: Before” and “GL Bid: After” is significant at 5%.
42
Table VII: Loan Performance (Only Reward Groups) – Multivariate Analysis In this table we report the exponentiated regression coefficients obtained from a Cox Proportional Hazards Model. Any payment which is not made on time is considered as a failure, so that failure events are late payments, charge-offs and defaults. In all three specifications, only loans (i.e. successfully and completely funded requests for borrowing money) in reward groups are considered. In specification (1), we do not account for any group-specific information. Specification (2) reports the overall effect of a group leader bid on the failure probability of loans. Specification (3) compares the effect of a group leader bid before and after the elimination of group leader rewards on the failure probability of loans in the reward groups. Finally, specification (4) analyzes whether before the elimination of group leader rewards, the group leader participates with more than 33% of the loan amount in the loan, if she places a bid on the listing (i.e. whether she “has skin in the game”). The reference is AA/A-loans before the elimination of group leader rewards without a group leader bid. T-statistics are reported in parentheses. ***, **, and * indicate significance at the 1%, 5%, and 10% levels, respectively. (1) (2) (3) (4) Group Leader Bids GL Bid 1.006 (0.61) GL Bid: Before 1.023** (2.19) GL Bid: After 0.853*** (-5.72) GL Bid: Before, Participation ≤ 33% 1.025** (2.37)GL Bid: Before, Participation > 33% 0.939** (-2.04)GL Bid: After, Participation ≤ 33% 0.871*** (-5.00)GL Bid: After, Participation > 33% 0.249*** (-5.87)Group Characteristics Vetting 0.946*** (-4.35) 0.962*** (-3.01) 0.964*** (-2.79)Listing Review Requirement 1.074*** (6.48) 1.073*** (6.40) 1.072*** (6.34)GL Offers Help 1.025* (1.78) 1.021 (1.52) 1.019 (1.33)GL Endorsement 1.070*** (7.28) 1.074*** (7.60) 1.074*** (7.61)Listing Characteristics After 0.967*** (-2.82) 1.063*** (4.71) 1.118*** (7.41) 1.117*** (7.38)Amount Requested (in $1,000) 1.042*** (53.04) 1.041*** (50.91) 1.042*** (51.25) 1.042*** (51.05)Duration 0.992*** (-4.24) 0.990*** (-5.14) 0.990*** (-5.15) 0.990*** (-5.16)Listing Closed As Soon As Funded 1.116*** (12.07) 1.139*** (13.77) 1.140*** (13.87) 1.138*** (13.65)Borrower Characteristics Credit Grade: B 1.522*** (23.39) 1.492*** (22.26) 1.487*** (22.07) 1.484*** (21.96)Credit Grade: C 1.722*** (32.37) 1.678*** (30.74) 1.669*** (30.36) 1.667*** (30.31)Credit Grade: D 1.888*** (36.52) 1.855*** (35.31) 1.846*** (34.99) 1.845*** (34.95)Credit Grade: E 2.420*** (45.34) 2.392*** (44.17) 2.377*** (43.81) 2.378*** (43.83)Credit Grade: HR 2.765*** (51.11) 2.748*** (50.01) 2.727*** (49.54) 2.730*** (49.59)Debt-to-Income Ratio 1.006** (2.33) 1.006** (2.21) 1.006** (2.32) 1.007** (2.55)Is Borrower Home Owner 1.074*** (8.06) 1.088*** (9.51) 1.088*** (9.52) 1.087*** (9.45)$1-24,999 1.296*** (6.21) 1.254*** (5.41) 1.252*** (5.36) 1.253*** (5.37)$25,000-49,999 1.172*** (3.83) 1.125*** (2.84) 1.124*** (2.81) 1.124*** (2.81)$50,000-74,999 1.103** (2.35) 1.066 (1.51) 1.064 (1.47) 1.064 (1.48)$75,000-99,999 1.120*** (2.65) 1.089** (1.99) 1.086* (1.92) 1.087* (1.93)$100,000 1.005 (0.12) 0.971 (-0.68) 0.965 (-0.81) 0.967 (-0.77)Part-Time 1.084*** (3.42) 1.066*** (2.72) 1.067*** (2.75) 1.066*** (2.72)Self-Employed 0.998 (-0.17) 0.993 (-0.49) 0.994 (-0.42) 0.995 (-0.32)Retired 1.205*** (7.86) 1.208*** (7.96) 1.211*** (8.07) 1.219*** (8.32)Not Employed 1.466*** (7.20) 1.422*** (6.61) 1.421*** (6.60) 1.421*** (6.59)Current Delinquencies 1.017*** (14.04) 1.016*** (12.69) 1.015*** (12.59) 1.015*** (12.62)Delinquencies Last 7 Years 0.999*** (-3.92) 0.999*** (-3.51) 0.999*** (-3.50) 0.999*** (-3.48)Public Records Last 10 Years 1.046*** (12.03) 1.049*** (12.72) 1.050*** (13.11) 1.050*** (13.13)Total Credit Lines 1.003*** (6.82) 1.002*** (6.42) 1.003*** (6.54) 1.003*** (6.56)Inquiries Last 6 Months 1.026*** (35.42) 1.025*** (34.14) 1.025*** (33.96) 1.025*** (34.05)Amount Delinquent (in $1,000) 1.001 (1.47) 1.001 (1.04) 1.001 (1.18) 1.001 (1.15)Public Records Last 12 Months 0.980 (-1.38) 0.978 (-1.51) 0.976 (-1.64) 0.977 (-1.61)Current Credit Lines 1.004** (2.02) 1.005** (2.21) 1.005** (2.16) 1.004** (2.06)Open Credit Lines 0.992*** (-3.55) 0.992*** (-3.61) 0.992*** (-3.59) 0.992*** (-3.46)Revolving Credit Balance (in $1,000) 1.000*** (3.17) 1.000*** (3.08) 1.000*** (2.99) 1.000*** (2.91)Bankcard Utilization 0.976** (-2.29) 0.968*** (-3.11) 0.969*** (-3.05) 0.969*** (-2.99)Months in Current Occupation 1.000** (-2.13) 1.000*** (-3.03) 1.000*** (-2.95) 1.000*** (-2.97)Number Of Friends (Level 0) 0.969*** (-6.26) 0.973*** (-5.55) 0.973*** (-5.50) 0.973*** (-5.50)Average Lender Experience 0.987*** (-4.66) 0.986*** (-4.90) 0.986*** (-4.84) 0.986*** (-4.98)Group Rating: 1 Star 2.143*** (16.54) 2.138*** (16.49) 2.101*** (15.97)Group Rating: 2 Stars 2.045*** (14.24) 2.016*** (13.94) 1.977*** (13.43)Group Rating: 3 Stars 1.176** (2.23) 1.176** (2.22) 1.151* (1.92)Group Rating: 4 Stars 1.733*** (7.10) 1.716*** (6.97) 1.687*** (6.73)Group Rating: 5 Stars 1.138** (2.49) 1.151*** (2.71) 1.146*** (2.62)Number Of Members In Group (in 1,000) 1.011*** (5.65) 1.010*** (5.52) 1.010*** (5.49)N 180,300 180,300 180,300 180,300 Note: In specification (3), the difference between the regression coefficients of “GL Bid: Before” and “GL Bid: After” is significant at 1%.
43
Table VIII: Listing Success (Difference-in-Difference) – Multivariate Analysis
In this table we report odds ratios of the logistic regression of funding success, i.e. the exponentiated regression coefficients. Coefficients larger (respectively smaller) than 1 indicate relatively higher (respectively smaller) success probabilities than in the reference group. In specification (1) all listings (i.e. all requests for borrowing money) are considered, in specifications (2) to (4) only group listings are analyzed. Specification (2) reports the overall effect of a group leader bid on listing success. Specification (3) additionally distinguishes whether the group leader bid occurs in a listing in a no-reward group or in a reward group. Specification (4) compares the effect of a group leader bid before and after the elimination of group leader rewards on listing success in the reward groups. The reference is AA/A-listings before the elimination of group leader rewards in no-reward groups without a group leader bid. T-statistics are reported in parentheses. ***, **, and * indicate significance at the 1%, 5%, and 10% levels, respectively. All Listings Only Listings in Groups (1) (2) (3) (4) Group Leader Bids GL Bid 2.167*** (16.20) GL Bid: No-Reward 3.265*** (8.89) 3.241*** (8.84)GL Bid: Reward 2.074*** (14.75) GL Bid: Reward, Before 2.024*** (13.81)GL Bid: Reward, After 2.663*** (7.14)Group Characteristics No Group 0.187*** (-29.32) Reward Group 0.425*** (-14.78) 0.472*** (-10.18) 0.611*** (-4.64) 0.602*** (-4.77)Vetting 1.130** (1.99) 1.143** (2.18) 1.128* (1.96)Listing Review Requirement 1.224*** (3.95) 1.220*** (3.88) 1.220*** (3.89)GL Offers Help 1.252*** (3.32) 1.219*** (2.90) 1.221*** (2.93)GL Endorsement 3.783*** (26.62) 3.788*** (26.63) 3.784*** (26.59)Listing Characteristics After 0.927*** (-2.82) 0.930 (-1.30) 0.920 (-1.51) 0.880** (-2.09)Amount Requested (in $1,000) 0.876*** (-59.41) 0.881*** (-30.69) 0.881*** (-30.68) 0.880*** (-30.72)Duration 1.052*** (9.64) 1.023** (2.29) 1.024** (2.43) 1.024** (2.44)Listing Closed As Soon As Funded 1.188*** (6.58) 0.991 (-0.20) 0.989 (-0.24) 0.988 (-0.25)Borrower Characteristics Credit Grade: B 0.652*** (-11.09) 0.695*** (-4.51) 0.689*** (-4.62) 0.692*** (-4.57)Credit Grade: C 0.338*** (-28.97) 0.459*** (-10.55) 0.454*** (-10.65) 0.456*** (-10.57)Credit Grade: D 0.176*** (-42.73) 0.266*** (-17.36) 0.263*** (-17.47) 0.265*** (-17.37)Credit Grade: E 0.070*** (-52.28) 0.119*** (-23.81) 0.118*** (-23.89) 0.119*** (-23.80)Credit Grade: HR 0.032*** (-65.36) 0.064*** (-30.21) 0.063*** (-30.30) 0.063*** (-30.23)Debt-to-Income Ratio 0.901*** (-10.39) 0.968** (-2.29) 0.967** (-2.31) 0.967** (-2.37)Is Borrower Home Owner 1.161*** (5.75) 1.169*** (3.47) 1.171*** (3.51) 1.171*** (3.50)$1-24,999 1.353*** (2.96) 0.816 (-1.27) 0.823 (-1.21) 0.824 (-1.21)$25,000-49,999 1.895*** (6.35) 1.186 (1.08) 1.190 (1.09) 1.192 (1.11)$50,000-74,999 2.361*** (8.42) 1.567*** (2.79) 1.570*** (2.80) 1.574*** (2.81)$75,000-99,999 2.949*** (10.24) 1.932*** (3.89) 1.942*** (3.92) 1.950*** (3.94)$100,000 3.360*** (11.28) 2.249*** (4.64) 2.259*** (4.66) 2.273*** (4.69)Part-Time 1.005 (0.08) 0.853 (-1.42) 0.845 (-1.51) 0.846 (-1.50)Self-Employed 0.865*** (-3.27) 1.015 (0.19) 1.017 (0.22) 1.018 (0.24)Retired 0.632*** (-5.69) 0.686*** (-2.69) 0.684*** (-2.71) 0.685*** (-2.70)Not Employed 0.648*** (-2.92) 0.610** (-2.16) 0.607** (-2.18) 0.610** (-2.16)Current Delinquencies 0.921*** (-17.12) 0.964*** (-5.03) 0.964*** (-5.04) 0.964*** (-5.01)Delinquencies Last 7 Years 0.995*** (-5.28) 0.997 (-1.61) 0.997 (-1.60) 0.997 (-1.59)Public Records Last 10 Years 0.970** (-2.42) 0.955** (-2.11) 0.954** (-2.12) 0.954** (-2.13)Total Credit Lines 0.994*** (-5.20) 0.993*** (-3.38) 0.993*** (-3.45) 0.993*** (-3.46)Inquiries Last 6 Months 0.975*** (-8.66) 0.985*** (-3.42) 0.985*** (-3.35) 0.985*** (-3.32)Amount Delinquent (in $1,000) 0.994*** (-3.75) 0.991*** (-2.62) 0.991*** (-2.62) 0.991*** (-2.66)Public Records Last 12 Months 1.105** (2.20) 1.055 (0.67) 1.058 (0.71) 1.059 (0.73)Current Credit Lines 1.005 (0.85) 1.036*** (3.34) 1.036*** (3.31) 1.036*** (3.31)Open Credit Lines 0.973*** (-3.98) 0.955*** (-3.98) 0.955*** (-3.94) 0.955*** (-3.93)Revolving Credit Balance (in $1,000) 1.001* (1.67) 1.000 (-0.59) 1.000 (-0.67) 1.000 (-0.67)Bankcard Utilization 1.098*** (2.78) 1.004 (0.07) 1.005 (0.10) 1.006 (0.10)Months in Current Occupation 1.000* (-1.85) 0.999* (-1.93) 0.999* (-1.90) 0.999* (-1.91)Number Of Friends (Level 0) 1.471*** (39.21) 1.395*** (12.92) 1.394*** (12.87) 1.393*** (12.85)Average Lender Experience 5.454*** (80.83) 4.105*** (43.94) 4.110*** (43.97) 4.106*** (43.93)Group Rating: 1 Star 3.833*** (11.91) 3.909*** (12.04) 3.910*** (12.04)Group Rating: 2 Stars 3.802*** (9.42) 3.792*** (9.41) 3.833*** (9.48)Group Rating: 3 Stars 2.474*** (2.92) 2.583*** (3.06) 2.529*** (2.99)Group Rating: 4 Stars 4.263*** (6.04) 4.692*** (6.33) 4.698*** (6.33)Group Rating: 5 Stars 2.209*** (6.46) 2.292*** (6.71) 2.254*** (6.56)Number Of Members In Group (in 1,000) 0.930*** (-8.15) 0.931*** (-8.09) 0.932*** (-7.93)N 153,541 34,795 34,795 34,795 pseudo R² 0.308 0.331 0.331 0.331 Note: In specification (4), the difference between the regression coefficients of “GL Bid: Reward, Before” and “GL Bid: Reward, After” is significant at 5%.
44
Table IX: Interest Rates (Difference-in-Difference) – Multivariate Analysis
In this table we report the regression coefficients from Tobit regressions of the lender interest rate of loans (i.e. of successfully and completely funded requests for borrowing money). In specification (1) all loans are considered, in specifications (2) to (4) only group loans are analyzed. Specification (2) reports the overall effect of a group leader bid on the interest rate. Specification (3) additionally distinguishes whether the group leader bid occurs in a loan in a no-reward group or in a reward group. Specification (4) compares the effect of a group leader bid before and after the elimination of group leader rewards on the interest rate of loans in the reward groups. The reference is AA/A-loans before the elimination of group leader rewards in no-reward groups without a group leader bid. T-statistics are reported in parentheses. ***, **, and * indicate significance at the 1%, 5%, and 10% levels, respectively. All Loans Only Loans in Groups (1) (2) (3) (4) Group Leader Bids GL Bid -0.753*** (-6.06) GL Bid: No-Reward -1.039*** (-3.42) -1.027*** (-3.38)GL Bid: Reward -0.715*** (-5.52) GL Bid: Reward, Before -0.660*** (-4.97)GL Bid: Reward, After -1.231*** (-3.83)Group Characteristics No Group 1.990*** (12.31) Reward Group 1.291*** (7.82) 1.099*** (6.58) 0.874*** (3.19) 0.913*** (3.32)Vetting -0.481*** (-3.29) -0.486*** (-3.33) -0.449*** (-3.04)Listing Review Requirement -0.041 (-0.30) -0.035 (-0.25) -0.035 (-0.26)GL Offers Help -0.785*** (-5.06) -0.761*** (-4.86) -0.765*** (-4.88)GL Endorsement -0.103 (-0.86) -0.104 (-0.86) -0.091 (-0.75)Listing Characteristics After 1.313*** (15.06) 1.473*** (10.17) 1.480*** (10.21) 1.613*** (9.86)Amount Requested (in $1,000) 0.256*** (36.92) 0.290*** (28.91) 0.290*** (28.93) 0.291*** (28.99)Duration -0.003 (-0.17) 0.013 (0.51) 0.011 (0.45) 0.012 (0.46)Listing Closed As Soon As Funded 3.245*** (36.57) 2.901*** (22.30) 2.908*** (22.32) 2.911*** (22.35)Borrower Characteristics Credit Grade: B 3.618*** (31.25) 2.872*** (15.58) 2.876*** (15.60) 2.865*** (15.54)Credit Grade: C 6.278*** (54.39) 5.670*** (33.06) 5.678*** (33.08) 5.662*** (32.95)Credit Grade: D 9.569*** (74.30) 8.565*** (47.01) 8.574*** (47.01) 8.558*** (46.88)Credit Grade: E 13.560*** (80.38) 12.177*** (54.19) 12.178*** (54.21) 12.160*** (54.08)Credit Grade: HR 13.419*** (75.79) 12.853*** (55.47) 12.856*** (55.49) 12.843*** (55.42)Debt-to-Income Ratio 0.160*** (4.82) 0.162*** (4.47) 0.162*** (4.47) 0.165*** (4.54)Is Borrower Home Owner -0.148* (-1.78) -0.496*** (-4.33) -0.497*** (-4.34) -0.501*** (-4.37)$1-24,999 0.236 (0.68) 0.968** (2.27) 0.957** (2.24) 0.946** (2.21)$25,000-49,999 -0.315 (-0.93) 0.442 (1.05) 0.434 (1.03) 0.425 (1.01)$50,000-74,999 -0.454 (-1.33) 0.216 (0.51) 0.208 (0.49) 0.200 (0.47)$75,000-99,999 -0.717** (-2.04) -0.180 (-0.41) -0.189 (-0.43) -0.200 (-0.45)$100,000 -1.115*** (-3.11) -0.567 (-1.25) -0.581 (-1.28) -0.596 (-1.31)Part-Time -0.426** (-2.21) -0.059 (-0.21) -0.058 (-0.21) -0.067 (-0.24)Self-Employed 0.250* (1.76) 0.178 (0.93) 0.174 (0.91) 0.172 (0.90)Retired 0.133 (0.50) -0.249 (-0.69) -0.246 (-0.69) -0.243 (-0.68)Not Employed 0.608 (1.19) 1.089* (1.76) 1.088* (1.76) 1.068* (1.72)Current Delinquencies 0.072*** (4.17) 0.068*** (3.25) 0.068*** (3.25) 0.067*** (3.23)Delinquencies Last 7 Years 0.025*** (7.03) 0.020*** (4.50) 0.020*** (4.49) 0.020*** (4.49)Public Records Last 10 Years 0.204*** (4.72) 0.224*** (3.70) 0.223*** (3.70) 0.228*** (3.78)Total Credit Lines 0.019*** (4.80) 0.013** (2.42) 0.013** (2.45) 0.013** (2.46)Inquiries Last 6 Months 0.142*** (14.27) 0.076*** (6.18) 0.076*** (6.16) 0.076*** (6.11)Amount Delinquent (in $1,000) 0.018*** (3.17) 0.016 (1.61) 0.016 (1.63) 0.016* (1.66)Public Records Last 12 Months 0.436*** (2.77) 0.150 (0.70) 0.147 (0.68) 0.138 (0.64)Current Credit Lines -0.053** (-2.55) -0.028 (-1.04) -0.028 (-1.02) -0.028 (-1.02)Open Credit Lines 0.052** (2.34) 0.024 (0.81) 0.023 (0.79) 0.023 (0.78)Revolving Credit Balance (in $1,000) 0.001 (1.24) 0.004** (2.18) 0.004** (2.17) 0.004** (2.15)Bankcard Utilization 0.408*** (3.66) 0.433*** (2.98) 0.434*** (3.00) 0.435*** (3.00)Months in Current Occupation 0.001 (0.91) 0.001 (0.81) 0.001 (0.80) 0.001 (0.82)Number Of Friends (Level 0) -0.163*** (-5.46) -0.079** (-2.21) -0.077** (-2.15) -0.078** (-2.16)Average Lender Experience -0.110*** (-3.84) -0.092*** (-2.59) -0.092*** (-2.59) -0.091*** (-2.58)Group Rating: 1 Star 0.370 (1.31) 0.359 (1.27) 0.379 (1.34)Group Rating: 2 Stars 0.389 (1.04) 0.393 (1.05) 0.379 (1.02)Group Rating: 3 Stars 0.875 (1.13) 0.840 (1.09) 0.873 (1.13)Group Rating: 4 Stars -0.802 (-1.50) -0.855 (-1.59) -0.830 (-1.54)Group Rating: 5 Stars -0.001 (-0.00) -0.028 (-0.09) 0.011 (0.04)Number Of Members In Group (in 1,000) -0.067*** (-2.69) -0.066*** (-2.64) -0.067*** (-2.72)Constant 5.252*** (13.09) 6.031*** (10.98) 6.246*** (10.63) 6.167*** (10.47)N 12,183 4,736 4,736 4,736 pseudo R² 0.161 0.181 0.181 0.181 Note: In specification (4), the difference between the regression coefficients of “GL Bid: Reward, Before” and “GL Bid: Reward, After” is significant at 10%.
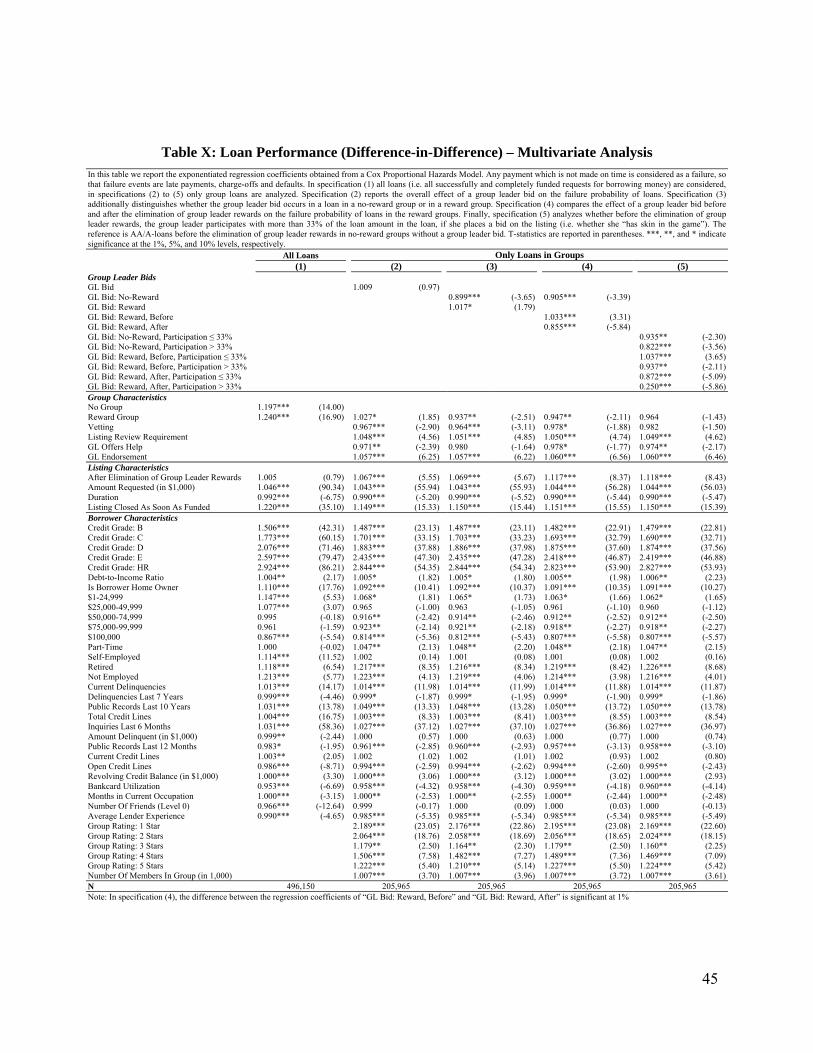
45
Table X: Loan Performance (Difference-in-Difference) – Multivariate Analysis In this table we report the exponentiated regression coefficients obtained from a Cox Proportional Hazards Model. Any payment which is not made on time is considered as a failure, so that failure events are late payments, charge-offs and defaults. In specification (1) all loans (i.e. all successfully and completely funded requests for borrowing money) are considered, in specifications (2) to (5) only group loans are analyzed. Specification (2) reports the overall effect of a group leader bid on the failure probability of loans. Specification (3) additionally distinguishes whether the group leader bid occurs in a loan in a no-reward group or in a reward group. Specification (4) compares the effect of a group leader bid before and after the elimination of group leader rewards on the failure probability of loans in the reward groups. Finally, specification (5) analyzes whether before the elimination of group leader rewards, the group leader participates with more than 33% of the loan amount in the loan, if she places a bid on the listing (i.e. whether she “has skin in the game”). The reference is AA/A-loans before the elimination of group leader rewards in no-reward groups without a group leader bid. T-statistics are reported in parentheses. ***, **, and * indicate significance at the 1%, 5%, and 10% levels, respectively. All Loans Only Loans in Groups (1) (2) (3) (4) (5) Group Leader Bids GL Bid 1.009 (0.97) GL Bid: No-Reward 0.899*** (-3.65) 0.905*** (-3.39) GL Bid: Reward 1.017* (1.79) GL Bid: Reward, Before 1.033*** (3.31) GL Bid: Reward, After 0.855*** (-5.84) GL Bid: No-Reward, Participation ≤ 33% 0.935** (-2.30)GL Bid: No-Reward, Participation > 33% 0.822*** (-3.56)GL Bid: Reward, Before, Participation ≤ 33% 1.037*** (3.65)GL Bid: Reward, Before, Participation > 33% 0.937** (-2.11)GL Bid: Reward, After, Participation ≤ 33% 0.872*** (-5.09)GL Bid: Reward, After, Participation > 33% 0.250*** (-5.86)Group Characteristics No Group 1.197*** (14.00) Reward Group 1.240*** (16.90) 1.027* (1.85) 0.937** (-2.51) 0.947** (-2.11) 0.964 (-1.43)Vetting 0.967*** (-2.90) 0.964*** (-3.11) 0.978* (-1.88) 0.982 (-1.50)Listing Review Requirement 1.048*** (4.56) 1.051*** (4.85) 1.050*** (4.74) 1.049*** (4.62)GL Offers Help 0.971** (-2.39) 0.980 (-1.64) 0.978* (-1.77) 0.974** (-2.17)GL Endorsement 1.057*** (6.25) 1.057*** (6.22) 1.060*** (6.56) 1.060*** (6.46)Listing Characteristics After Elimination of Group Leader Rewards 1.005 (0.79) 1.067*** (5.55) 1.069*** (5.67) 1.117*** (8.37) 1.118*** (8.43)Amount Requested (in $1,000) 1.046*** (90.34) 1.043*** (55.94) 1.043*** (55.93) 1.044*** (56.28) 1.044*** (56.03)Duration 0.992*** (-6.75) 0.990*** (-5.20) 0.990*** (-5.52) 0.990*** (-5.44) 0.990*** (-5.47)Listing Closed As Soon As Funded 1.220*** (35.10) 1.149*** (15.33) 1.150*** (15.44) 1.151*** (15.55) 1.150*** (15.39)Borrower Characteristics Credit Grade: B 1.506*** (42.31) 1.487*** (23.13) 1.487*** (23.11) 1.482*** (22.91) 1.479*** (22.81)Credit Grade: C 1.773*** (60.15) 1.701*** (33.15) 1.703*** (33.23) 1.693*** (32.79) 1.690*** (32.71)Credit Grade: D 2.076*** (71.46) 1.883*** (37.88) 1.886*** (37.98) 1.875*** (37.60) 1.874*** (37.56)Credit Grade: E 2.597*** (79.47) 2.435*** (47.30) 2.435*** (47.28) 2.418*** (46.87) 2.419*** (46.88)Credit Grade: HR 2.924*** (86.21) 2.844*** (54.35) 2.844*** (54.34) 2.823*** (53.90) 2.827*** (53.93)Debt-to-Income Ratio 1.004** (2.17) 1.005* (1.82) 1.005* (1.80) 1.005** (1.98) 1.006** (2.23)Is Borrower Home Owner 1.110*** (17.76) 1.092*** (10.41) 1.092*** (10.37) 1.091*** (10.35) 1.091*** (10.27)$1-24,999 1.147*** (5.53) 1.068* (1.81) 1.065* (1.73) 1.063* (1.66) 1.062* (1.65)$25,000-49,999 1.077*** (3.07) 0.965 (-1.00) 0.963 (-1.05) 0.961 (-1.10) 0.960 (-1.12)$50,000-74,999 0.995 (-0.18) 0.916** (-2.42) 0.914** (-2.46) 0.912** (-2.52) 0.912** (-2.50)$75,000-99,999 0.961 (-1.59) 0.923** (-2.14) 0.921** (-2.18) 0.918** (-2.27) 0.918** (-2.27)$100,000 0.867*** (-5.54) 0.814*** (-5.36) 0.812*** (-5.43) 0.807*** (-5.58) 0.807*** (-5.57)Part-Time 1.000 (-0.02) 1.047** (2.13) 1.048** (2.20) 1.048** (2.18) 1.047** (2.15)Self-Employed 1.114*** (11.52) 1.002 (0.14) 1.001 (0.08) 1.001 (0.08) 1.002 (0.16)Retired 1.118*** (6.54) 1.217*** (8.35) 1.216*** (8.34) 1.219*** (8.42) 1.226*** (8.68)Not Employed 1.213*** (5.77) 1.223*** (4.13) 1.219*** (4.06) 1.214*** (3.98) 1.216*** (4.01)Current Delinquencies 1.013*** (14.17) 1.014*** (11.98) 1.014*** (11.99) 1.014*** (11.88) 1.014*** (11.87)Delinquencies Last 7 Years 0.999*** (-4.46) 0.999* (-1.87) 0.999* (-1.95) 0.999* (-1.90) 0.999* (-1.86)Public Records Last 10 Years 1.031*** (13.78) 1.049*** (13.33) 1.048*** (13.28) 1.050*** (13.72) 1.050*** (13.78)Total Credit Lines 1.004*** (16.75) 1.003*** (8.33) 1.003*** (8.41) 1.003*** (8.55) 1.003*** (8.54)Inquiries Last 6 Months 1.031*** (58.36) 1.027*** (37.12) 1.027*** (37.10) 1.027*** (36.86) 1.027*** (36.97)Amount Delinquent (in $1,000) 0.999** (-2.44) 1.000 (0.57) 1.000 (0.63) 1.000 (0.77) 1.000 (0.74)Public Records Last 12 Months 0.983* (-1.95) 0.961*** (-2.85) 0.960*** (-2.93) 0.957*** (-3.13) 0.958*** (-3.10)Current Credit Lines 1.003** (2.05) 1.002 (1.02) 1.002 (1.01) 1.002 (0.93) 1.002 (0.80)Open Credit Lines 0.986*** (-8.71) 0.994*** (-2.59) 0.994*** (-2.62) 0.994*** (-2.60) 0.995** (-2.43)Revolving Credit Balance (in $1,000) 1.000*** (3.30) 1.000*** (3.06) 1.000*** (3.12) 1.000*** (3.02) 1.000*** (2.93)Bankcard Utilization 0.953*** (-6.69) 0.958*** (-4.32) 0.958*** (-4.30) 0.959*** (-4.18) 0.960*** (-4.14)Months in Current Occupation 1.000*** (-3.15) 1.000** (-2.53) 1.000** (-2.55) 1.000** (-2.44) 1.000** (-2.48)Number Of Friends (Level 0) 0.966*** (-12.64) 0.999 (-0.17) 1.000 (0.09) 1.000 (0.03) 1.000 (-0.13)Average Lender Experience 0.990*** (-4.65) 0.985*** (-5.35) 0.985*** (-5.34) 0.985*** (-5.34) 0.985*** (-5.49)Group Rating: 1 Star 2.189*** (23.05) 2.176*** (22.86) 2.195*** (23.08) 2.169*** (22.60)Group Rating: 2 Stars 2.064*** (18.76) 2.058*** (18.69) 2.056*** (18.65) 2.024*** (18.15)Group Rating: 3 Stars 1.179** (2.50) 1.164** (2.30) 1.179** (2.50) 1.160** (2.25)Group Rating: 4 Stars 1.506*** (7.58) 1.482*** (7.27) 1.489*** (7.36) 1.469*** (7.09)Group Rating: 5 Stars 1.222*** (5.40) 1.210*** (5.14) 1.227*** (5.50) 1.224*** (5.42)Number Of Members In Group (in 1,000) 1.007*** (3.70) 1.007*** (3.96) 1.007*** (3.72) 1.007*** (3.61)N 496,150 205,965 205,965 205,965 205,965 Note: In specification (4), the difference between the regression coefficients of “GL Bid: Reward, Before” and “GL Bid: Reward, After” is significant at 1%
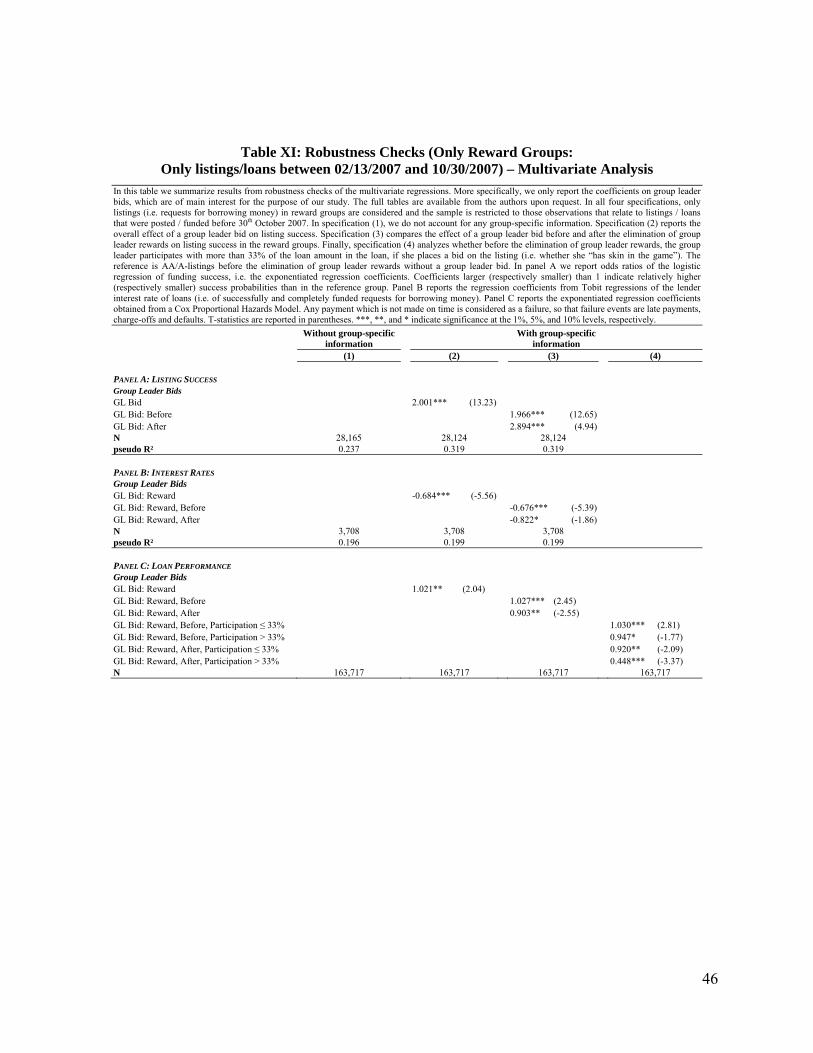
46
Table XI: Robustness Checks (Only Reward Groups: Only listings/loans between 02/13/2007 and 10/30/2007) – Multivariate Analysis
In this table we summarize results from robustness checks of the multivariate regressions. More specifically, we only report the coefficients on group leader bids, which are of main interest for the purpose of our study. The full tables are available from the authors upon request. In all four specifications, only listings (i.e. requests for borrowing money) in reward groups are considered and the sample is restricted to those observations that relate to listings / loans that were posted / funded before 30th October 2007. In specification (1), we do not account for any group-specific information. Specification (2) reports the overall effect of a group leader bid on listing success. Specification (3) compares the effect of a group leader bid before and after the elimination of group leader rewards on listing success in the reward groups. Finally, specification (4) analyzes whether before the elimination of group leader rewards, the group leader participates with more than 33% of the loan amount in the loan, if she places a bid on the listing (i.e. whether she “has skin in the game”). The reference is AA/A-listings before the elimination of group leader rewards without a group leader bid. In panel A we report odds ratios of the logistic regression of funding success, i.e. the exponentiated regression coefficients. Coefficients larger (respectively smaller) than 1 indicate relatively higher (respectively smaller) success probabilities than in the reference group. Panel B reports the regression coefficients from Tobit regressions of the lender interest rate of loans (i.e. of successfully and completely funded requests for borrowing money). Panel C reports the exponentiated regression coefficients obtained from a Cox Proportional Hazards Model. Any payment which is not made on time is considered as a failure, so that failure events are late payments, charge-offs and defaults. T-statistics are reported in parentheses. ***, **, and * indicate significance at the 1%, 5%, and 10% levels, respectively.
Without group-specific
information With group-specific
information (1) (2) (3) (4) PANEL A: LISTING SUCCESS Group Leader Bids GL Bid 2.001*** (13.23) GL Bid: Before 1.966*** (12.65) GL Bid: After 2.894*** (4.94) N 28,165 28,124 28,124 pseudo R² 0.237 0.319 0.319 PANEL B: INTEREST RATES Group Leader Bids GL Bid: Reward -0.684*** (-5.56) GL Bid: Reward, Before -0.676*** (-5.39) GL Bid: Reward, After -0.822* (-1.86) N 3,708 3,708 3,708 pseudo R² 0.196 0.199 0.199 PANEL C: LOAN PERFORMANCE Group Leader Bids GL Bid: Reward 1.021** (2.04) GL Bid: Reward, Before 1.027*** (2.45) GL Bid: Reward, After 0.903** (-2.55) GL Bid: Reward, Before, Participation ≤ 33% 1.030*** (2.81) GL Bid: Reward, Before, Participation > 33% 0.947* (-1.77) GL Bid: Reward, After, Participation ≤ 33% 0.920** (-2.09) GL Bid: Reward, After, Participation > 33% 0.448*** (-3.37) N 163,717 163,717 163,717 163,717
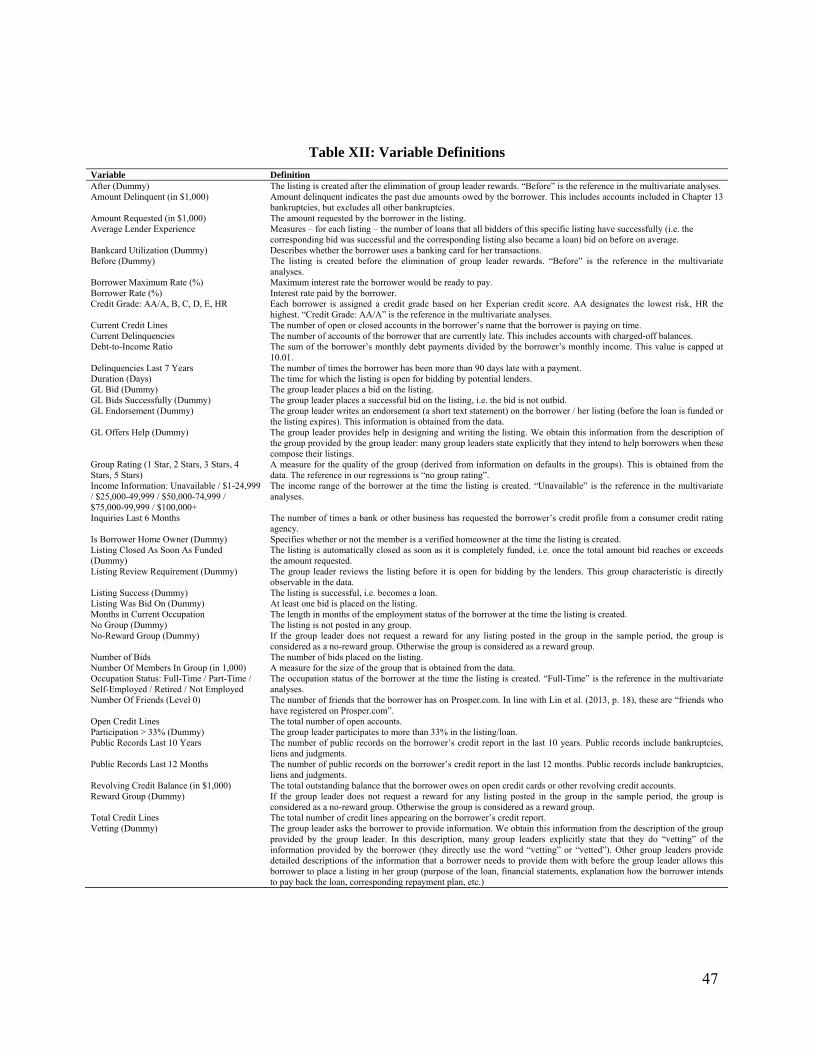
47
Table XII: Variable Definitions
Variable Definition After (Dummy) The listing is created after the elimination of group leader rewards. “Before” is the reference in the multivariate analyses. Amount Delinquent (in $1,000) Amount delinquent indicates the past due amounts owed by the borrower. This includes accounts included in Chapter 13
bankruptcies, but excludes all other bankruptcies. Amount Requested (in $1,000) The amount requested by the borrower in the listing. Average Lender Experience Measures – for each listing – the number of loans that all bidders of this specific listing have successfully (i.e. the
corresponding bid was successful and the corresponding listing also became a loan) bid on before on average. Bankcard Utilization (Dummy) Describes whether the borrower uses a banking card for her transactions. Before (Dummy) The listing is created before the elimination of group leader rewards. “Before” is the reference in the multivariate
analyses. Borrower Maximum Rate (%) Maximum interest rate the borrower would be ready to pay. Borrower Rate (%) Interest rate paid by the borrower. Credit Grade: AA/A, B, C, D, E, HR Each borrower is assigned a credit grade based on her Experian credit score. AA designates the lowest risk, HR the
highest. “Credit Grade: AA/A” is the reference in the multivariate analyses. Current Credit Lines The number of open or closed accounts in the borrower’s name that the borrower is paying on time. Current Delinquencies The number of accounts of the borrower that are currently late. This includes accounts with charged-off balances. Debt-to-Income Ratio The sum of the borrower’s monthly debt payments divided by the borrower’s monthly income. This value is capped at
10.01. Delinquencies Last 7 Years The number of times the borrower has been more than 90 days late with a payment. Duration (Days) The time for which the listing is open for bidding by potential lenders. GL Bid (Dummy) The group leader places a bid on the listing. GL Bids Successfully (Dummy) The group leader places a successful bid on the listing, i.e. the bid is not outbid. GL Endorsement (Dummy) The group leader writes an endorsement (a short text statement) on the borrower / her listing (before the loan is funded or
the listing expires). This information is obtained from the data. GL Offers Help (Dummy) The group leader provides help in designing and writing the listing. We obtain this information from the description of
the group provided by the group leader: many group leaders state explicitly that they intend to help borrowers when these compose their listings.
Group Rating (1 Star, 2 Stars, 3 Stars, 4 Stars, 5 Stars)
A measure for the quality of the group (derived from information on defaults in the groups). This is obtained from the data. The reference in our regressions is “no group rating”.
Income Information: Unavailable / $1-24,999 / $25,000-49,999 / $50,000-74,999 / $75,000-99,999 / $100,000+
The income range of the borrower at the time the listing is created. “Unavailable” is the reference in the multivariate analyses.
Inquiries Last 6 Months The number of times a bank or other business has requested the borrower’s credit profile from a consumer credit rating agency.
Is Borrower Home Owner (Dummy) Specifies whether or not the member is a verified homeowner at the time the listing is created. Listing Closed As Soon As Funded (Dummy)
The listing is automatically closed as soon as it is completely funded, i.e. once the total amount bid reaches or exceeds the amount requested.
Listing Review Requirement (Dummy) The group leader reviews the listing before it is open for bidding by the lenders. This group characteristic is directly observable in the data.
Listing Success (Dummy) The listing is successful, i.e. becomes a loan. Listing Was Bid On (Dummy) At least one bid is placed on the listing. Months in Current Occupation The length in months of the employment status of the borrower at the time the listing is created. No Group (Dummy) The listing is not posted in any group. No-Reward Group (Dummy) If the group leader does not request a reward for any listing posted in the group in the sample period, the group is
considered as a no-reward group. Otherwise the group is considered as a reward group. Number of Bids The number of bids placed on the listing. Number Of Members In Group (in 1,000) A measure for the size of the group that is obtained from the data. Occupation Status: Full-Time / Part-Time / Self-Employed / Retired / Not Employed
The occupation status of the borrower at the time the listing is created. “Full-Time” is the reference in the multivariate analyses.
Number Of Friends (Level 0) The number of friends that the borrower has on Prosper.com. In line with Lin et al. (2013, p. 18), these are “friends who have registered on Prosper.com”.
Open Credit Lines The total number of open accounts. Participation > 33% (Dummy) The group leader participates to more than 33% in the listing/loan. Public Records Last 10 Years The number of public records on the borrower’s credit report in the last 10 years. Public records include bankruptcies,
liens and judgments. Public Records Last 12 Months The number of public records on the borrower’s credit report in the last 12 months. Public records include bankruptcies,
liens and judgments. Revolving Credit Balance (in $1,000) The total outstanding balance that the borrower owes on open credit cards or other revolving credit accounts. Reward Group (Dummy) If the group leader does not request a reward for any listing posted in the group in the sample period, the group is
considered as a no-reward group. Otherwise the group is considered as a reward group. Total Credit Lines The total number of credit lines appearing on the borrower’s credit report. Vetting (Dummy) The group leader asks the borrower to provide information. We obtain this information from the description of the group
provided by the group leader. In this description, many group leaders explicitly state that they do “vetting” of the information provided by the borrower (they directly use the word “vetting” or “vetted”). Other group leaders provide detailed descriptions of the information that a borrower needs to provide them with before the group leader allows this borrower to place a listing in her group (purpose of the loan, financial statements, explanation how the borrower intends to pay back the loan, corresponding repayment plan, etc.)