Adventures in Equating Land: Facing the Intra-Individual Consistency Index Monster * *Louis Roussos...
26
Adventures in Equating Land: Facing the Intra-Individual Consistency Index Monster* *Louis Roussos retains all rights to the title
-
Upload
william-strickland -
Category
Documents
-
view
214 -
download
0
Transcript of Adventures in Equating Land: Facing the Intra-Individual Consistency Index Monster * *Louis Roussos...

Adventures in Equating Land:
Facing the Intra-Individual Consistency Index Monster*
*Louis Roussos retains all rights to the title

Overview of Equating Designs and Methods
• Designs– Single Group
– Random Groups
– Common Item Nonequivalent Groups (CING)
• Methods– Mean
– Linear
– Equipercentile
– IRT True or Observed

Guidelines for Selecting Common Items for Multiple-Choice (MC) Only Exams
• Representative of the total test (Kolen & Brennan, 2004)
• 20% of the total test
• Same item positions
• Similar average/spread of item difficulties (Durans, Kubiak, & Melican, 1997)
• Content representative (Klein & Jarjoura, 1985)

Challenges in Equating Mixed-Format Tests(Kolen & Brennan, 2004; Muraki, Hombo, & Lee, 2000)
• Constructed Response (CR) scored by raters
• Small number of tasks– Inadequate sampling of construct
– Changes in construct across forms
• Common Items– Content/difficulty balance of common items
– MC only may result in inadequate representation of groups/construct
• IRT– Small number of tasks may result in unstable parameter estimates
– Typically assume a single dimension underlies both item types
• Format Effects

Current Research
• Number of CR Items– Smaller RMSD with larger numbers of items and/or score points (Li and
Yin, 2008; Fitzpatrick and Yen, 2001)
– Misclassification (Fitzpatrick and Yen, 2001)
• Fewer than 12 items, more score points resulted in smaller error rates
• Greater than 12 items, error rates less than 10% regardless of score points
• Trend Scoring (Tate, 1999, 2000; Kim, Walker, McHale, 2008)
– Rescoring samples of CR items
– Smaller bias and equating error

Cont.
• Format Effects (FE)– MC and CR measure similar constructs (Ercikan et al., 1993; Traub, 1993)
– Males scored higher on MC; females higher on CR ( DeMars, 1998; Garner & Engelhard, 1999)
– Kim and Kolen, 2006
• Narrow-range tests (e.g., credentialing)
• Wide-range tests (e.g., achievement)
• Individual Consistency Index (Tatsuoka & Tatsuoka, 1982) – Detecting aberrant response patterns
– Not specifically in the context of mixed-format tests

Purpose and Research Questions
Purpose: Examine the impact of equating mixed format tests when student subscores differ across item types. Specifically,
• To what extent does the intra-individual consistency of examinee responses across item formats impact equating results?
• How does the selection of common items differentially impact equating results with varying levels of intra-individual consistency?

Data
• “Old Form” (OL) treated as “truth”– Large-scale 6th grade testing program
– Mathematics
– 54 point test
• 34 multiple choice (MC)
• 5 short answer (SA)
• 5 constructed response (CR) worth 4 points each
– Approx. 70,000 examinees
• “New Form” (NE)– Exactly the same items as OL
– Samples of examinees from OL

2006-07
Scoring Test
39 Items
OL (old form)
All Examinees
NE (new form)
Samples of 3,000 Examinees
2006-07
Scoring Test
39 Items
Both OL and NE contain the exact same items
Only difference between the forms are the examinees

Intra-Individual Consistency
• Consistency of student responses across formats• Regression of dichotomous item subscores (MC
and SA) onto polytomous item subscores (CR)• Standardized residuals
– Range from approximately -4.00 to +8.00
– Example: Index of +2.00
• Student subscores on CR under-predicted by two standard deviations based on MC subscores
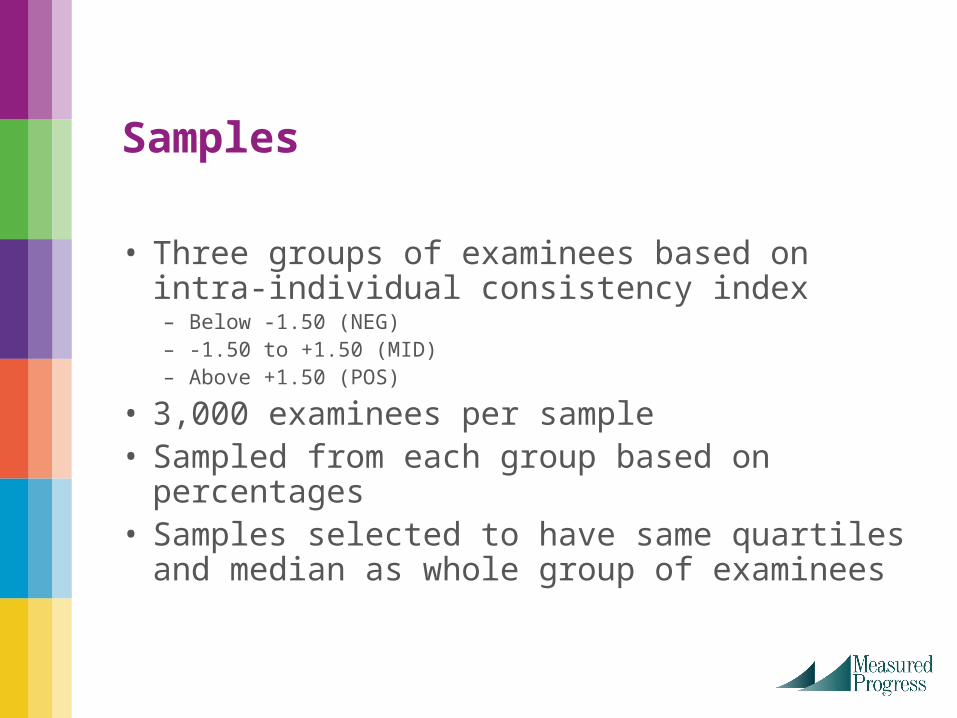
Samples
• Three groups of examinees based on intra-individual consistency index– Below -1.50 (NEG)– -1.50 to +1.50 (MID)– Above +1.50 (POS)
• 3,000 examinees per sample• Sampled from each group based on percentages• Samples selected to have same quartiles and
median as whole group of examinees

Sampling Conditions
• 60/20/20– 60% sampled from one of the groups (i.e., NEG, MID, POS)
– 20% sample from each of the remaining groups
– Repeated for each of the three groups
• 40/30/30

Common Items
• Six sets of common items– MC only (12 points)
– CR only (12 points)
– MC (4) and CR (8)
– MC (8) and CR (4)
– MC (4), CR (4), and SA (4)
– MC (7), CR (4), and SA (1)
• Representative of total test in terms of content, difficulty and length

Equating
• Common-item nonequivalent groups design • Item parameters calibrated using Parscale 4.1
– 3-parameter logistic model (3PL) for MC items
– 2PL model for SA items
– Graded Response Model for CR items
• IRT scale transformation– Mean/mean, mean/sigma, Stocking-Lord, and Haebara
• IRT true score equating

OL NE“Common”
Items
Equating conducted using only a selection of items treated as common
Equating
OL and NE
All items shared in common
“Truth” established by equating NE to OL using all items as common items

Evaluation
• Bias and RMSE – At each score point
– Averaged over score points
• Classification Consistency

Results: 60% Mid
60% Mid: Replication 1
-1
-0.5
0
0.5
1
1.5
2
2.5
1 4 7 10 13 16 19 22 25 28 31 34 37 40 43 46 49 52 55
Raw Score
Bia
s
MC
CR
MC8 CR4
MC4 CR8
MC4 CR4 SA4
MC7 CR4 SA1

Results: 40% Mid
40% Mid: Replication 1
-1
-0.5
0
0.5
1
1.5
2
2.5
1 3 5 7 9 11 13 15 17 19 21 23 25 27 29 31 33 35 37 39 41 43 45 47 49 51 53 55
Raw Scores
Bia
s
MC
CR
8MC 4CR
4CR 8MC
4MC 4CR 4SA
7MC 4CR 1SA

In the extreme…
60% Pos: Replication 1
-7
-6
-5
-4
-3
-2
-1
0
1
2
1 4 7 10 13 16 19 22 25 28 31 34 37 40 43 46 49 52 55
Raw Score
Bia
s
MC
CR
MC8 CR4
MC4 CR8
MC4 CR4 SA4
MC7 CR4 SA1

Across the Score Scale: Average Bias
-4
-3
-2
-1
0
1
2
3
4
5
MC CR MC8 CR4 MC4 CR8 MC4 CR4SA4
MC7 CR4SA1
Av
era
ge
Bia
sNeg40
Neg60
Mid40
Mid60
Pos40
Pos60
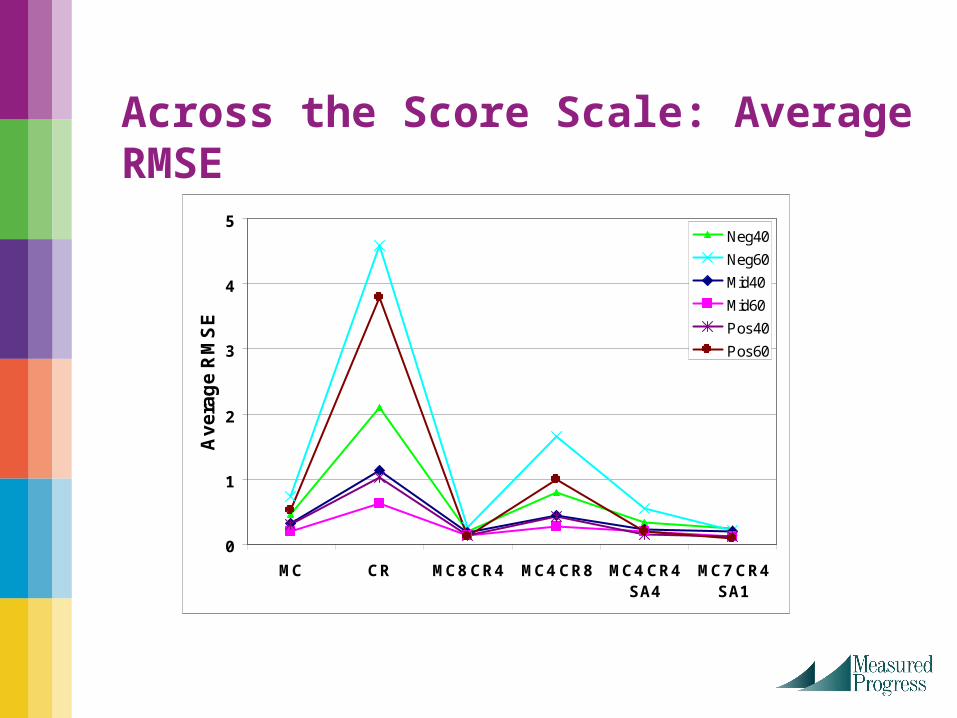
Across the Score Scale: Average RMSE
0
1
2
3
4
5
MC CR MC8 CR4 MC4 CR8 MC4 CR4SA4
MC7 CR4SA1
Av
era
ge
RM
SE
Neg40
Neg60
Mid40
Mid60
Pos40
Pos60

Across the Score Scale: Misclassification Rates
0
2
4
6
8
10
12
14
MC CR MC8 CR4 MC4 CR8 MC4 CR4SA4
MC7 CR4SA1
Pe
rce
nta
ge
Mis
cla
ss
ifie
dNeg40
Neg60
Mid40
Mid60
Pos40
Pos60

Classification Consistency: Proficient
-15
-10
-5
0
5
10
MC CR MC8 CR4 MC4 CR8 MC4 CR4SA4
MC7 CR4SA1
Pe
rce
nta
ge
Mis
cla
ss
ifie
d
Neg40
Neg60
Mid40
Mid60
Pos40
Pos60

Discussion
• Different equating results based on sampling conditions
• Differences more exaggerated when using common items sets with mostly CR items
• Mid 60 most similar to data, small differences across common item selections

Limitations and Implications
• Limitations– Sampling conditions
– Common item selections
– Only one equating method
• Implications for future research– Sampling conditions, common item selections, additional equating
methods
– Other content areas and grade levels
– Other testing programs
– Simulation studies

Thanks!
• Rob Keller• Mike, Louis, Won, Candy, and Jessalyn