Advancing development in Uganda: evaluating policy choices ...
34
Advancing development in Uganda: evaluating policy choices for 2016-21 and selected impacts to 2040 This research supported by USAID and QED Primary Authors: Jonathan D. Moyer Alex Porter Shelby Johnson Jason R. Moyer Dave K. Bohl Contributing Authors: Jordan Farrar Katherine Hill Caleb Petry Nenani Sichone
Transcript of Advancing development in Uganda: evaluating policy choices ...

Advancing development in Uganda: evaluating policy choices for 2016-21 and selected impacts to 2040
This research supported by USAID and QED
Primary Authors:
Jonathan D. Moyer Alex Porter Shelby Johnson Jason R. Moyer Dave K. Bohl
Contributing Authors:
Jordan Farrar Katherine Hill Caleb Petry Nenani Sichone

Contents
Executive Summary 3
The Frederick S. Pardee Center for International Futures 5
International Futures (IFs) 5
About the Current Path Scenario 5
Introduction 6
Improving basic human development 10
Reduce fertility rates 10
Increase primary education survival and completion 15
Improve access to safe water and sanitation to reduce stunting 17
Increase agricultural yields, reduce loss, and improve food security 21
Leveraging basic human development: governance and the economy 25
Improve government quality and capacity 25
Carefully manage oil revenues and temper expectations 27
Reduce the size of the informal sector 27
Increase economic sophistication and create jobs 29
Trade 30
Manufacturing 31
Services 32
Reducing human suffering: an integrated development push 33

3
Executive Summary
Uganda is Under pressUre from a mUltitUde of local constitUencies, international organizations, and foreign aid groups to simultaneously improve human, social, and environmental development outcomes. But, choosing among development priorities is a challenge and few tools
exist to facilitate strategic decision-making with long time horizons. This report uses the International Futures (IFs) modeling platform to evaluate the current development context in Uganda to both better understand the sequencing of policy priorities as well as identify leverage points to expeditiously improve human and social development.
Improving basic human development should be a cornerstone of Uganda’s development strategy. Specifically, over the next five years the Ugandan government and aid community should collaborate to:
•Improve family planning. With the third fastest growing population in Africa, Uganda is poised to double its population before 2040. This large and growing population reduces the impact of any set of policies aimed to improve human capabilities.
•Increase primary education survival and completion. Primary net enrollment rates in Uganda are high, but primary survival and completion rates are low. This creates a bottleneck between primary and secondary school. Eliminating this bottleneck will significantly improve education outcomes and will have positive spillover effects across other development sectors.
•Enhance agricultural production, reduce loss, and increase land under cultivation. Rapid popu-lation growth is driving an increase in food imports for caloric consumption. This food security issue should be addressed by promoting improvements in yield, storage, and transport of food in Uganda. Uganda should also create a strategic grain reserve as a buffer from global food price shocks.
•Increase access to safe water and sanitation. Reductions in communicable disease rates have been significant and are a success story in Uganda. However, very high levels of childhood malnutrition and stunting have long-term consequences. Investing in water and sanitation can reduce this burden.
In addition to improving basic human development, the Ugandan government and international aid communities should work to improve governance quality and capacity and increase economic sophistication.
•Improve governance transparency and accountability. Corruption is a long-term drag on economic production, social stability, and human development. Poor government transparency coupled with opaque oil management could drive social instability.
•Reduce the size of the informal economy. Currently, nearly 65 percent of labor is employed in the informal sector. Programs should be implemented to reduce informal labor and expand the tax base. This will also mitigate challenges associated with declines in government revenue as a share of GDP.
•Carefully manage the production of oil. It is highly unlikely that significant amounts of oil will be produced over the next five years. But, successful oil management requires a transparent government. Moreover, expectations about the scale of positive impact from oil production should be tempered.
•Promote an increased industrial and manufacturing base. High population growth means that millions will enter the labor force over the next five years. A thriving industrial sector can provide relatively high value added jobs and enhance Uganda’s production profile.
•Increase trade involvement within the East African Community (EAC). The EAC free trade zone reduces transport costs and improves export opportunities.

4
This report explores policy interventions over a five-year horizon (from 2016-21) and their broad implica-tions to 2040 (the time horizon of the Ugandan National Development Plan).
Figure 1 compares the impact of ten policy interventions against the “Current Path” of development in Uganda on three outcome indicators: GDP at market exchange rates (bubble size), percentage point decrease in absolute poverty (horizontal axis), and the percent increase in GDP per capita at market exchange rates (the vertical axis and a main target of the National Development Plan). While each inter-vention has a positive impact on human development, prioritizing them simultaneously has the most significant overall impact on improving human development in Uganda.
-2
2
6
10
14
18
22
26
30
0 2 4 6 8 10 12
Dec
reas
e in
pov
erty
(per
cent
age
poin
t)
Increase in GDP per capita (percent)
Agriculture HIV/AIDS Education Corruption
Informal Labor Water and Sanitation Fertility Malaria
Figure 1: Impact of various individual scenario interventions relative to the Current Path of Ugandan devel-
opment compared in 2040 to percentage change in GDP (bubble size), percentage change in GDP per
capita (horizontal axis), and percentage point change in Extreme Poverty Reduction (vertical axis). Source:
International Futures v 7.13.
Pursuing this development strategy over the next five years will lay a foundation for ascension to Upper Middle Income status, the stated goal of the National Development Plan. While we do not believe it is pos-sible for Uganda to achieve Upper Middle Income status by 2040, prioritizing investments in basic human development, improvements in governance quality and capacity, and increases in economic sophistication will accelerate human and social development in Uganda.
5
The Frederick S. Pardee Center for International Futures
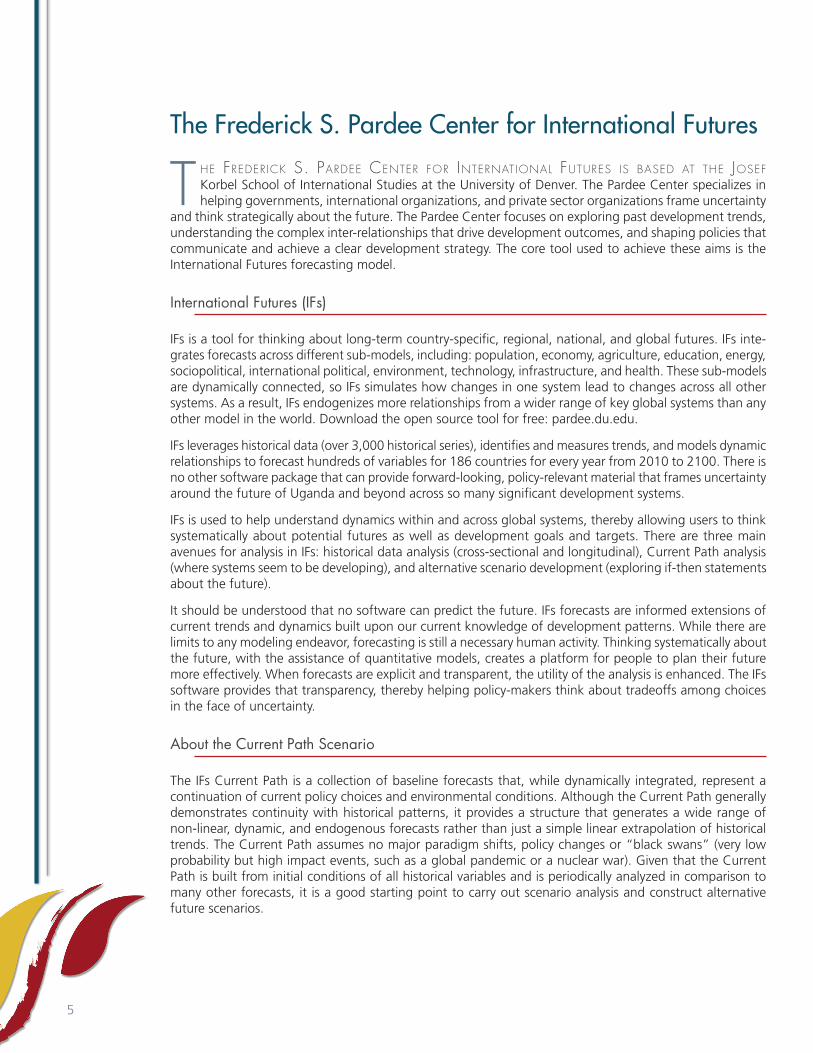
the frederick s. pardee center for international fUtUres is based at the Josef Korbel School of International Studies at the University of Denver. The Pardee Center specializes in helping governments, international organizations, and private sector organizations frame uncertainty
and think strategically about the future. The Pardee Center focuses on exploring past development trends, understanding the complex inter-relationships that drive development outcomes, and shaping policies that communicate and achieve a clear development strategy. The core tool used to achieve these aims is the International Futures forecasting model.
International Futures (IFs)
IFs is a tool for thinking about long-term country-specific, regional, national, and global futures. IFs inte-grates forecasts across different sub-models, including: population, economy, agriculture, education, energy, sociopolitical, international political, environment, technology, infrastructure, and health. These sub-models are dynamically connected, so IFs simulates how changes in one system lead to changes across all other systems. As a result, IFs endogenizes more relationships from a wider range of key global systems than any other model in the world. Download the open source tool for free: pardee.du.edu.
IFs leverages historical data (over 3,000 historical series), identifies and measures trends, and models dynamic relationships to forecast hundreds of variables for 186 countries for every year from 2010 to 2100. There is no other software package that can provide forward-looking, policy-relevant material that frames uncertainty around the future of Uganda and beyond across so many significant development systems.
IFs is used to help understand dynamics within and across global systems, thereby allowing users to think systematically about potential futures as well as development goals and targets. There are three main avenues for analysis in IFs: historical data analysis (cross-sectional and longitudinal), Current Path analysis (where systems seem to be developing), and alternative scenario development (exploring if-then statements about the future).
It should be understood that no software can predict the future. IFs forecasts are informed extensions of current trends and dynamics built upon our current knowledge of development patterns. While there are limits to any modeling endeavor, forecasting is still a necessary human activity. Thinking systematically about the future, with the assistance of quantitative models, creates a platform for people to plan their future more effectively. When forecasts are explicit and transparent, the utility of the analysis is enhanced. The IFs software provides that transparency, thereby helping policy-makers think about tradeoffs among choices in the face of uncertainty.
About the Current Path Scenario
The IFs Current Path is a collection of baseline forecasts that, while dynamically integrated, represent a continuation of current policy choices and environmental conditions. Although the Current Path generally demonstrates continuity with historical patterns, it provides a structure that generates a wide range of non-linear, dynamic, and endogenous forecasts rather than just a simple linear extrapolation of historical trends. The Current Path assumes no major paradigm shifts, policy changes or “black swans” (very low probability but high impact events, such as a global pandemic or a nuclear war). Given that the Current Path is built from initial conditions of all historical variables and is periodically analyzed in comparison to many other forecasts, it is a good starting point to carry out scenario analysis and construct alternative future scenarios.

6
Introduction
over the last 25 years Uganda has made signif icant strides in economic, human, and social development. GDP has expanded consistently. Primary net enrollment rates are above 90 percent. The crude death rate has declined since the mid 1990s, representing a signifi-
cant domestic policy and foreign aid program achievement. Investments in road infrastructure, increases in volume and complexity of trade, and the discovery of oil in the western region of Uganda have improved Uganda’s economic outlook.
However, Uganda still faces an uphill battle. Over 13 million Ugandans live in extreme poverty. Infant mor-tality claims 60 out of 1,000 infants. Half a million students who should be enrolled in primary school are not and over four million students are missing from secondary school. Low yields and high losses in the agricultural sector contribute to an increasing dependence on food imports and high levels of corruption, and other indirect costs of doing business, sustain a large informal sector. Each of these factors present significant obstacles for sustainable economic growth.
Uganda’s rapidly growing population is the largest barrier to fully breaking free of the poverty trap. In a relatively populous country, such as Uganda, high population growth can lead to significant development planning problems, food insecurity, and challenges for government service provision. Moreover, nearly half of the population is under the age of fifteen. A growing number of young people add pressure to the labor market, forcing a greater number of working-aged youth to seek unbenefited, unprotected, and low-paying employment in an already large and unproductive informal sector. As seen in countries like Libya and Egypt, large and underemployed youth populations can become a threat to security.
While these are daunting challenges, they can be mitigated if the government manages to reign in popu-lation growth while implementing sustainable growth and development policies. In doing so Uganda could simultaneously ease suffering and set the country on a more sustainable development path.
The National Development Plan, Uganda Vision 2040, endeavors to put the country on the path to Upper Middle Income Status by 2040. It forecasts that Uganda will reach a GDP per capita of $9,500 by 2040 and projects that the population of the country will grow from 36 million in 2015 to 61 million over the next 25 years. It also expects life expectancy to increase from 57 years today to 85 years by 2040.
We forecast that these goals will not be met, even in the most ambitious development scenarios. Our Current Path scenario forecasts that Ugandan GDP per capita (at MER) will reach only $2,100 by 2040, and in our most optimistic scenario (representing a successful push across policy spaces), per capita income only reaches $3,000. Similar differences in forecasts are found in life expectancy where we forecast life expectancy to not exceed 69 years in 2040. More importantly, the Current Path scenario forecasts that Uganda’s population will rise to almost 77 million by 2040, 26 percent higher than NDP projections.
Development Indicator
Per capita income (USD)
Population (millions)
Life expectancy at birth (years)
506
32.0
51.5
9,500
61.3
85
642
38.5
53.4
2,144
76.2
67.2
NDP:2010
Target:2040
IFs:2010
Current Path:2040
Table 1: Ugandan National Development Plan 2010 values and 2040 targets for development indicators
compared with International Futures v 7.13.

7
A note on population projections in the National Development Plan: The three proximate drivers of population change are births, deaths, and migration. The National Development Plan specifies births (through a projection of the fertility rate across time), implies a mortality rate by forecasting life expectancy, and does not provide an estimate of migration trends (this is understandable as long-term forecasts of migration are challenging).
NDP projects that the Ugandan population will rise to only 61 million by 2040. This forecast is well below the Current Path projection IFs even though the fertility rate projection in the National Development Plan is largely in line with the IFs fertility rate projection. The NDP also projects that Uganda will achieve an average life expectancy of 85 years by 2040, which is well above the 2040 IFs forecast (67 years).
If Uganda achieved its goals of fertility reduction and life expectancy growth, we project that the Ugandan population would rise to 76 million by 2040 , which is significantly higher than the NDP projection of 61 million. In this scenario, the NDP population projection could only be achieved if Uganda had out-migration of over 15 million within that time period.
Development goals should be lofty, but polices should be realistic. Uganda cannot leap-frog basic human development and hope to achieve Upper Middle Income status. Pursuing an integrated development plan now will reduce human suffering and better prepare Uganda to sustain human development and economic growth through 2040.
Realistic and aggressive development objectives are outlined in this document. Their implications are explored and a set of policy prescriptions are described. Further policy setting in any of these areas will require more detailed analysis than this macro-level modeling exercise can account for. The relative impacts of the various policies explored in this document are summarized in Table 2.

Scen
ario
GD
P (M
ER)
GD
P pe
r cap
ita (M
ER)
Popu
latio
nG
over
nmen
t Ris
kbi
llion
USD
USD
mill
ions
0 to
1 (l
ower
is b
ette
r)
2016
2021
2040
2016
2021
2040
2016
2021
2040
2016
2021
2040
Cur
rent
Pat
h26
.037
.016
3.4
677
820
2,14
438
.47
45.0
976
.24
0.39
0.38
0.34
Agr
icul
ture
Pus
h26
.037
.617
3.0
675
835
2,27
238
.47
45.0
976
.13
0.39
0.38
0.33
AID
S D
eath
Red
uctio
n26
.037
.016
4.8
677
820
2,15
738
.47
45.1
176
.42
0.39
0.38
0.34
Prim
ary
Educ
atio
n Pu
sh26
.037
.017
0.0
677
821
2,24
738
.47
45.0
875
.64
0.39
0.38
0.33
Tran
spar
ency
Impr
ovem
ent
26.0
37.6
181.
667
783
32,
385
38.4
745
.09
76.1
40.
390.
370.
33
Info
rmal
Lab
or R
educ
tion
26.0
37.4
167.
267
782
92,
195
38.4
745
.09
76.1
90.
390.
380.
34
Traf
fic A
ccid
ent R
educ
tion
26.0
37.0
164.
067
782
02,
148
38.4
745
.10
76.3
30.
390.
380.
34
Mal
aria
Dea
th R
educ
tion
26.0
37.0
163.
866
782
02,
151
38.4
745
.10
76.1
60.
390.
380.
34
Wat
er a
nd S
anita
tion
Impr
ovem
ent
26.0
37.0
168.
367
781
92,
217
38.4
745
.10
75.9
20.
390.
380.
33
Com
bine
d In
terv
entio
n26
.038
.620
5.6
675
862
3,02
338
.47
44.7
868
.01
0.39
0.37
0.31
Ferti
lity
Redu
ctio
n26
.037
.016
2.4
677
826
2,35
438
.47
44.7
768
.99
0.39
0.38
0.33
Slow
ed F
ertil
ity R
educ
tion
26.0
37.0
164.
067
781
72,
021
38.4
745
.25
81.1
80.
390.
380.
34
Vici
ous
Cyc
le26
.036
.915
4.9
677
816
1,90
738
.47
45.2
581
.23
0.39
0.38
0.35
Scen
ario
HD
IPo
verty
Pove
rty0
to 1
(hig
her i
s be
tter)
perc
ent o
f pop
ulat
ion
livin
g un
der $
2.00
a d
aype
rcen
t of p
opul
atio
n liv
ing
unde
r $1.
25 a
day
2016
2021
2040
2016
2021
2040
2016
2021
2040
Cur
rent
Pat
h0.
610.
640.
7561
.058
.633
.035
.332
.914
.2
Agr
icul
ture
Pus
h0.
610.
640.
7560
.757
.727
.034
.631
.310
.5
AID
S D
eath
Red
uctio
n0.
610.
640.
7561
.058
.732
.935
.332
.914
.2
Prim
ary
Educ
atio
n Pu
sh0.
610.
640.
7661
.058
.531
.535
.332
.813
.2
Tran
spar
ency
Impr
ovem
ent
0.61
0.64
0.75
61.0
58.3
32.8
35.3
32.6
14.1
Info
rmal
Lab
or R
educ
tion
0.61
0.64
0.75
61.0
58.2
32.2
35.2
32.5
13.7
Traf
fic A
ccid
ent R
educ
tion
0.61
0.64
0.75
61.0
58.6
33.0
35.3
32.9
14.3
Mal
aria
Dea
th R
educ
tion
0.61
0.64
0.75
61.0
58.6
32.9
35.3
32.9
14.2
Wat
er a
nd S
anita
tion
Impr
ovem
ent
0.61
0.64
0.75
61.0
58.6
32.2
35.3
32.9
13.8
Com
bine
d In
terv
entio
n0.
610.
640.
7860
.756
.317
.234
.630
.25.
8
Ferti
lity
Redu
ctio
n0.
610.
640.
7561
.058
.329
.135
.332
.611
.9
Slow
ed F
ertil
ity R
educ
tion
0.61
0.64
0.74
61.0
58.7
35.5
35.3
33.0
15.8
Vici
ous
Cyc
le0.
610.
640.
7461
.058
.939
.035
.333
.118
.2
Tabl
e 2:
Im
pact
of v
ario
us p
olic
y in
terv
entio
ns in
Uga
nda
for 2
021
and
2040
. So
urce
: In
tern
atio
nal F
utur
es v
7.1
3.

9
A note on data:
Measuring human and social systems is notoriously difficult. Even accurately collecting data on a seemingly basic statistic like population size is challenging. For instance, the most recent Ugandan census provided a lower estimate of the population than did the World Bank and United Nations Population Division. The recent re-basing of the Uganda GDP also provides an example of some of the challenges associated with gathering data on social systems, be they in Uganda or elsewhere. Data used in this analysis comes from many sources. Some of these sources are well known and associated with particular issue areas:
• Food and Agricultural Organization
• International Monetary Fund
• International Telecommunication Union
• Organization for Economic Cooperation and Development
• Uganda Bureau of Statistics
• Ugandan Ministry of Energy and Mineral Development
• United Nations Conference on Trade and Development
• United Nations Educational, Scientific, and Cultural Organization
• United States Energy Information Administration
• WHO/UNICEF Joint Monitoring Programme
• World Bank World Development Indicators
• World Health Organization Global Burden of Disease
• Transparency International Corruption Perception Index
• World Bank Governance Matters
It is possible to alter the underlying data within IFs to more closely tailor these results to data that individuals or groups may have. The data used in this report are modified to reflect rebased GDP (though adjusted through the IMF), updated population figures, and various other data from the most recent Ugandan census. To see a full comparison of historical trends in the relationship between Uganda census and household survey and international organization data, see the appendix of the larger Reference Report, also produced by Pardee as a background resource.
10
Improving basic human development
Reduce fertility rates
Uganda’s popUlation growth is the third fastest in africa. the Ugandan popU-lation doubled from 1960 to 1982. It doubled again from 1982 to 2003. Along the current path, Uganda’s population will double between 2003 and the mid-2020s and yet again by the 2050s. It is
currently the 34th largest population in the world, yet over the next five years it is forecast to experience the 15th largest absolute increase in population. It is difficult to overstate the impact that this seismic population shift will have on the development of human, social, physical, and natural systems.
Three factors drive Uganda’s extraordinary population growth. First, Ugandan fertility rates are extremely high. Second, deaths from communicable disease have declined, representing a significant policy and for-eign aid success story. Third, while data on net migration are unreliable, it is likely that regional conflicts in Burundi, Democratic Republic of Congo, and South Sudan are pushing refugees into the country. Without significant policy interventions to promote family planning, we forecast that Ugandan fertility rates will remain high and that population will continue to grow at a significant rate.1
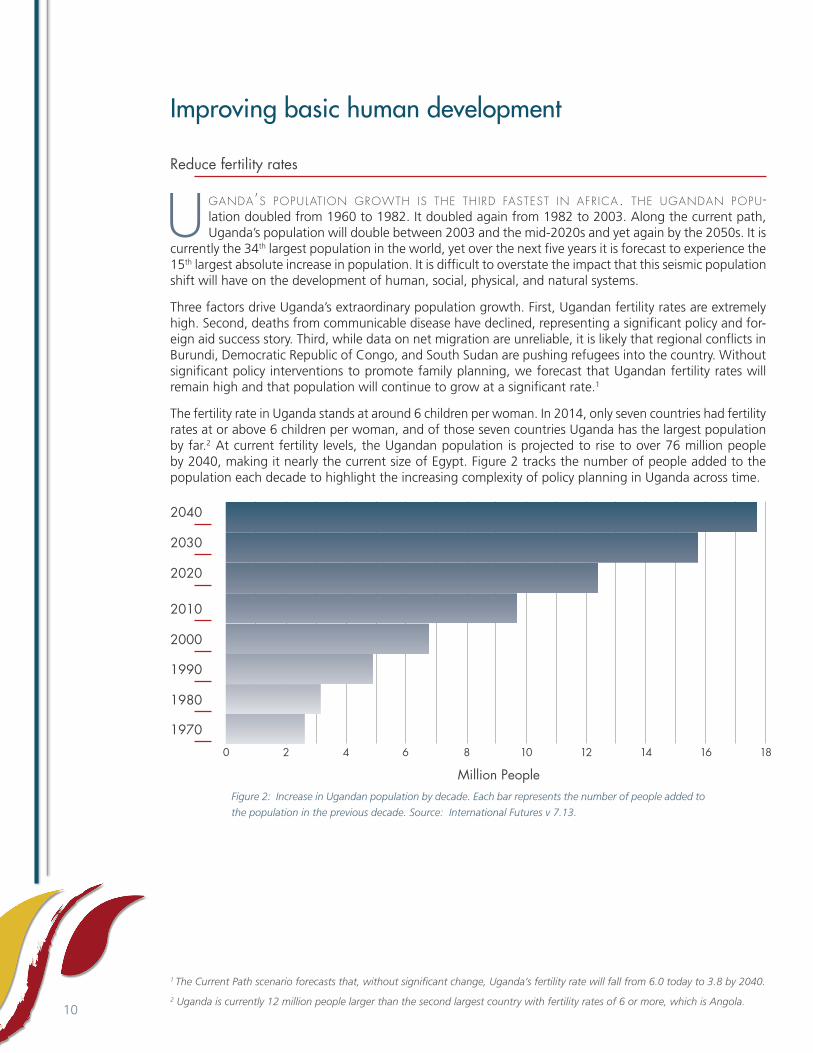
The fertility rate in Uganda stands at around 6 children per woman. In 2014, only seven countries had fertility rates at or above 6 children per woman, and of those seven countries Uganda has the largest population by far.2 At current fertility levels, the Ugandan population is projected to rise to over 76 million people by 2040, making it nearly the current size of Egypt. Figure 2 tracks the number of people added to the population each decade to highlight the increasing complexity of policy planning in Uganda across time.
1 The Current Path scenario forecasts that, without significant change, Uganda’s fertility rate will fall from 6.0 today to 3.8 by 2040.
2 Uganda is currently 12 million people larger than the second largest country with fertility rates of 6 or more, which is Angola.
2040
2030
2020
2010
2000
1990
1980
Figure 2: Increase in Ugandan population by decade. Each bar represents the number of people added to
the population in the previous decade. Source: International Futures v 7.13.
0 2 4 6 8
Million People
10 12 14 16 18
1970

11
3 While Ugandan population is predominantly rural and urbanization levels are low and rates of increase are not rapid (we forecast an increase in urbanization from 18 percent today to nearly 27 percent by 2040), population growth will lead to a continued rapid expansion of urban centers in absolute terms.
High population growth rates in a relatively populous country such as Uganda can create massive devel-opment planning problems and significantly hinder development outcomes. While extreme poverty rates, primary school drop-out rates, and youth population rates are slowly decreasing, the number of people living in extreme poverty, kids dropping out of school, and youth continue to rise. A sustained high fertility rate means that policies aimed at improving human development, increasing economic prosperity, and extending government services will experience “drag”. In other words, growth in investment in human development will need to keep pace or exceed population increases to avoid back-sliding. Specifically, Uganda’s rapid population growth will lead to:
•Significant urban population growth: 66 fold increase between 1960 and 2040.3
•Growth in the number of people living in poverty: a) the Current Path forecasts that people living on less than $1.25 per day will increase from 13 million people today to nearly 17 million in 2030 before beginning to decline; b) and that people living on less than $2.00 per day will increase from 20 million today to 32 million by 2030 and 38 million by 2040.
•Decline in the number of students who complete primary education, lower secondary education, and upper secondary education.
•Increase in the number of young people entering the work force each year, with 4 million entering this year, 5 million entering by 2021, and over 8 million entering by 2040.
Along the Current Path, we forecast that the fertility rate of Uganda will decline as the country experiences positive development trends in education (particularly female education), contraception use, infant mor-tality, and income. We expect fertility rates to decline from 6 today to less than 4 by 2040. In the Fertility Reduction scenario, we intervened with an ambitious goal of a 25 percent reduction in fertility rates over a 10 year period. This reduction in the fertility rate will have a subdued impact across the short-term time horizon (the years 2016-21), but the long-term impact will be significant. To further frame the impacts of fertility rate changes, we created a Slow Fertility Reduction scenario that reduces fertility rates to only 4.5 by 2040. Figure 3 compares these scenarios with fertility rates in China and South Korea, two countries that have produced significant fertility rate reductions through aggressive policy planning.
0
1
2
3
4
5
6
7
8
Tota
l Fer
tility
Rat
e
Uganda - Current Path Uganda - Reduced Fertility
Uganda - Slow Reduction in Fertility South Korea
China
Figure 3: Total fertility rates for China, South Korea, and Uganda, historical data and forecast for three
Ugandan fertility scenarios. Source: International Futures v 7.13.

12
By 2021, the Fertility Reduction scenario only registers 300,000 fewer people, a 0.7 percent reduction in population compared with the Current Path. But, the fertility intervention reduces the population by nearly 10 percent by 2040. Figure 4 shows the impact of this fertility reduction on absolute population levels in Uganda.
20
30
40
50
60
70
80
90
Popu
latio
n (m
illio
ns)
Current Path Fertility Reduction Slow Fertility Reduction
Figure 4: Population for Uganda, historical data and forecast for Current Path, Fertility Reduction, and Slow
Fertility Reduction scenarios. Source: International Futures v 7.13.

13
While large population increases create developmental challenges across sectors, rapid growth of the young working-age population can create acute development problems. A large underemployed youth bulge can be a major source of social and political instability. Uganda’s youth bulge (percent of the population aged 15 to 29) is currently around 53 percent and is forecast to drop only 5 percentage points in the next 25 years. Moreover, reducing fertility rates lowers the size of the youth bulge compared to the current path, but not until the 2030s (see Figure 5).
0
10
20
30
40
50
60
Yout
h Bu
lge
(per
cent
of p
opul
atio
n).
Uganda - Current Path Uganda - Reduced Fertility
Uganda - Slow Reduction in Fertility South Korea
China
Figure 5: Youth bulge for China, South Korea, and Uganda, historical data and forecast for Current Path
and alternative fertility scenarios. Source: International Futures v 7.13.

14
On the other hand, falling fertility rates can drive an increase in the size of the working age population relative to the dependent population. This transition leads to a demographic dividend which drives increased production and frees up resources for investments in social, economic, and human development. The demographic dividend in China and South Korea has been a significant driver of growth in economic output. Figure 6 shows the demographic dividends of China, South Korea, and Uganda, including the two Ugandan fertility scenarios.
45
50
55
60
65
70
75
Dem
ogra
phic
Div
iden
d (p
erce
nt o
f pop
ulat
ion)
Uganda - Current Path Uganda - Fertility ReductionUganda - Slow Fertility ChinaSouth Korea
Figure 6: Demographic dividend for China, South Korea, and Uganda, historical data and forecast for
Current Path and alternative fertility scenarios. Source: International Futures v 7.13.
We can see that the Fertility Reduction Scenario significantly accelerates Uganda’s path to its demographic dividend. Furthermore, when compared to the Current Path, the Fertility Reduction scenario results in the following outcomes by 2040:
•No change to overall GDP: the larger demographic dividend drives up output per worker over time
•Increased GDP per capita at purchasing power parity by $110
•1.6 million fewer people living on less than $1.25 per day
•300,000 fewer malnourished children
•1.7 percent reduction in risk of political instability
Reducing fertility rates is not a panacea to Ugandan development. However, successful family planning will release pressure on already strained resources and allow Uganda to increase the intensity of human development investments. It should be the backbone of any approach to setting development strategies and agendas for the country as it increases the effectiveness and reach of investments in any other area.

15
Increase primary education survival and completion
The typical Ugandan aged 15 or older has less than 6 years of education. The Current Path scenario forecasts that this will increase to 7.4 years by 2040, which is below the current level of education in the Dominican Republic. Improving educational attainment by both increasing primary survival and completion should be a cornerstone of an integrated development policy for Uganda for the next five years.
High levels of net primary enrollment are the first step along the path to improving educational outcomes and basic human development. Uganda has increased student primary education enrollment by making it both free (1997 Universal Primary Education policy) and compulsory (2008 Education Act). Primary net enrollment rates have grown from 84 percent in 2004 to 94 percent by 2011. Additionally, primary school education attainment has more than doubled for people 15-and-over over the past 35 years (from 21 percent in 1980 to 54 percent today).
Initiatives like the 2007 Universal Secondary Education (USE) policy, which incentivize continuation by pro-viding free lower- and upper- secondary education to students who score well on primary school exams, have been successful in increasing the net and gross secondary and tertiary enrollment rates. However, secondary enrollment levels are still relatively low.4 Both net and gross enrollment rates have more than doubled since 2000, but are still only at 26 and 33 percent, respectively. Comparatively, net enrollment rates in other EAC countries and low-income countries are currently at 37 and 35 percent, respectively. The Current Path scenario forecasts the enrollment gap between Uganda and other low-income countries to widen over the next 25 years.
In Uganda, there is a significant bottleneck between primary and secondary education. This has negative effects on the rest of the education system. Since only 25 to 55 percent5 of primary students survive to graduation, enrollment rates in secondary and tertiary education are constrained. Moreover, any initiatives aimed at education quality improvement are dramatically undermined by low attendance rates, particularly at secondary and tertiary levels.
Low primary survival rates are a function of several factors. Even though primary school is free, costs of supplies are a barrier for many children. Transportation infrastructure gaps limit school access and health issues from communicable diseases and stunting present major barriers to grade completion. Moreover, surveys indicate that between 81 and 94 percent of primary school children have been subjected to violence in school, often at the hands of their teachers.6 Sexual abuse in school is particularly prevalent. Astonishingly, 77.7 percent of primary students experience sexual assault by a teacher.7
Over the next five years, Uganda should focus on increasing the number of children who move through primary education. The most significant improvements are likely to be achieved by both reducing the opportunity costs of attending primary school and improving the safety of students who are in school. In the long-term, the country should focus on education quality in order to improve its levels of human capital and reap the economic benefits of a higher skilled and more productive workforce.8
4 Kavuma, Richard M. “Free Universal Secondary Education in Uganda Has Yielded Mixed Results.” The Guardian, 2011. http://www.theguardian.com/global-development/poverty-matters/2011/oct/25/free-secondary-education-uganda-mixed-results.
5 Primary rate completion stands at 55 percent. However, low levels of net lower-secondary enrollment would indicate that the primary survival rate of 25 percent may be a more accurate measure of those finishing primary education.
6 UNICEF & MES. “Research Briefing: Assessing Child Protection, Safety & Security Issues For Children in Ugandan Primary and Secondary Schools.” UNICEF & Ministry of Education and Sports (MES): Statistics Section, Republic of Uganda, July 2013. http://www.unicef.org/uganda/VACis_Study_Summary_July_8th_10.31am(1).pdf.
7 UNICEF & MES. “Research Briefing: Assessing Child Protection, Safety & Security Issues For Children in Ugandan Primary and Secondary Schools.” UNICEF & Ministry of Education and Sports (MES): Statistics Section, Republic of Uganda, July 2013. http://www.unicef.org/uganda/VACis_Study_Summary_July_8th_10.31am(1).pdf.
8 Dickson, Janet R., Barry Hughes, and Mohammod T. Irfan. Advancing Global Education. Patterns of Potential Human Progress, v. 2. [Denver] : Boulder : New Delhi: Pardee Center for International Futures, University of Denver ; Paradigm Publishers ; Oxford University Press, 2010.

16
The Primary Education Survival scenario increases primary survival rates and education expenditure by 10 percent over a five year time horizon.9 Over the next 10 years, the primary education intervention should increase the primary education completion rate to 95 percent and increase secondary net enrollment by 5 percentage points, which should reduce the number of students missing from secondary education by 600,000.10
By 2025, the Primary Education Survival scenario would increase GDP by 0.35 percent over the Current Path, and, by 2040, it would increase GDP by 4 percent over the Current Path. The line graph below represents a conservative cost-benefit analysis where the cumulative increase in education spending is compared with the annual additional GDP output. While the positive impact of this intervention takes time, improving primary education survival leads to broader human development spill-overs in the long-run.
0
1
2
3
4
5
6
7
Billi
on U
SD
Annual difference in GDP comparing Primary Education Push and Current PathCumulative additional education spending needed in Primary Education Push
Figure 7: Cost - benefit analysis of Primary Education Push compared with Current Path. Source: International
Futures v 7.13.
9 This is not just government spending by 10 percent, but total spending on education by all actors invested in that system.
10 This represents over 10 percent of total missing students in that year.

17
In addition to increases in productivity, higher levels of educational attainment serve to further drive down fertility rates. By 2040, improvements in primary survival rates result in a 4 percent fertility rate reduction compared with the Current Path. More broadly, removing the bottleneck to primary education improves the security of the country, reducing the Government Risk Index in IFs by 1.3 percent by 2040.11
While the benefits of pushing primary level survival certainly outweigh the costs in the long-run, combining the Primary Education Push scenario with the Fertility Reduction scenario produce cumulative benefits. See Figure 8 for the comparative impacts of each intervention on GDP per capita at market exchange rates.
0.5
0.7
0.9
1.1
1.3
1.5
1.7
1.9
2.1
2.3
2.5
Thou
sand
USD
Current Path Primary Education Push
Primary Education Push and Fertility Reduction Fertility Reduction
Figure 8: GDP per capita at market exchange rates for Uganda, forecast for Current Path, Primary Education
Push, Fertility Reduction, and Primary Education Push and Fertility Reduction scenarios. Source: International
Futures v. 7.13.
Improve access to safe water and sanitation to reduce stunting
Recent positive health trends in Uganda are largely the result of foreign aid programs aimed at reducing the burden of communicable disease. Communicable diseases account for the majority of deaths in Uganda (62 percent) and are forecast to remain a significant cause of deaths through 2021 (57 percent) and 2040 (37 percent). IFs shows that communicable disease rates are currently declining (from over 6.6 deaths per thousand in 2015) and will continue to decline through 2021 (over 5.2 deaths per thousand) and 2040 (over 2.3 deaths per thousand).
Maternal mortality has more than halved between 1990 and 2013, falling from 780 to 360 per 100,000 people. While Uganda’s maternal mortality remains considerably higher than the 2013 world average (210 per 100,000 people), it has been consistently lower than both other EAC countries (468 per 100,000 people) and other low-income countries (440 per 100,000 people). Infant deaths per 1,000 live births have
11 The Government Risk Index in IFs measures pressure for domestic instability across various dimensions of societal development, including education, health, governance, and security.

18
decreased between 1990 and 2015, from 108 to 64. In the same time period, Uganda has improved its world rank in this category from 39th to 26th. The under-5 mortality rate (also measured in deaths per 1,000 live births) improved between 1990 and 2013, from 179 to 66.
While Uganda remains in the global top ten for AIDS related deaths and has reentered the global top ten in HIV prevalence among adults (12.4 percent of adults had HIV in 1990, 6.3 percent of adults had HIV in 2005, and 7.4 percent of adults had HIV in 2013), the number of AIDS related deaths has greatly reduced since the 1990s. In 1995, an estimated 110,000 deaths were AIDS related. By 2013, AIDS related deaths dropped to 63,000.
Uganda currently ranks 23rd in deaths from malaria. Malaria is responsible for the loss of nearly 2.3 million (disability adjusted) life years, though IFs forecasts this to fall to under 1 million by 2040. This decline reflects a continuation of development policies that have successfully reduced communicable disease deaths.
While the share of AIDS and malaria deaths are on the decline, one trend is rising: deaths associated with traffic accidents and pedestrians hit by vehicles. Uganda’s economic and population growth has resulted in an increase in the number of vehicles on the road. If traffic laws, infrastructure, and safety norms do not grow in kind, fatalities from traffic accidents will continue to rise. IFs forecasts that deaths from traffic accidents will surpass those from malaria in ten years (see Figure 9).
0
5
10
15
20
25
30
35
Thou
sand
s of
dea
ths
Traffic Deaths Malaria Deaths
Figure 9: Deaths from Malaria and Traffic in Uganda, forecast for Current Path. Source: International
Futures v 7.13.
Beyond communicable disease and injuries, non-communicable disease also represents a growing share of Ugandan deaths. The double burden of disease (high levels of both communicable and non-communicable disease) is becoming increasingly prevalent in sub-Saharan Africa. The double burden puts significant pres-sure on health care systems to treat both types of illnesses. While rising non-communicable disease deaths will eventually place a burden on the health system, there are more pressing health issues in the short term.
Reductions in deaths from maternal mortality, AIDS, and malaria represent significant developmental success stories and Uganda should continue to reduce the burden of communicable disease. However, increased investment in reducing AIDS and malarial deaths does not show significant additional improvement in overall outcomes.12 Increasing policy focus on traffic fatalities also shows only a limited general impact on overall development indicators. However, given the relatively low cost of combating road death, it may represent a low-cost/high-reward safety policy.

19
0
50
100
150
200
250
300
Thou
sand
s of
dea
ths
Communicable Non-Communicable Injuries
Figure 10: Deaths in thousands for communicable, non-communicable, and injuries in Uganda, forecast
for Current Path. Source: International Futures v 7.13.
One area where Uganda could see both short- and long-term health benefits is in combating undernourish-ment and stunting. Undernourishment at young ages can lead to stunting. Stunting has significant impacts on productivity, the ability to learn, and general well-being. Childhood under-nutrition remains high at 22 percent of children (though lower than under-nutrition as a percent of total population). The rate of child-hood under-nutrition is forecast to fall to nearly nine percent by 2040, but Uganda’s massive population growth will keep the level of malnourished children over one million for the next twenty-five years.13
27 percent of Uganda’s population is stunted, which is lower than the stunting rate in most low-income countries (on average 33 percent). However, Uganda’s stunted population is significantly higher than in other EAC countries (20 percent). In the Current Path scenario, Uganda’s stunting rate drops to 16 percent (representing 12.5 million people) by 2040, while the rate in low-income countries drops to 20 percent and the rate in EAC countries drops to 14 percent. Nevertheless, Uganda’s rapidly growing population means that while the share of people affected by stunting and undernourishment is decreasing, the absolute number of affected people will continue to grow.
Stunting results in significantly lower returns from both human and physical capital over the long run. Drivers of under-nutrition and stunting are multi-sectoral, but lack of access to both clean water and sani-tation is an important driver of stunting in the future working population. Investing in water and sanitation provides long term benefits to Uganda’s population and can be financed at a fraction of the cost of other large infrastructure projects. Currently, nearly 10 million people in Uganda do not have adequate access to water. The Current Path scenario forecasts that there will be an additional 2 million people with unimproved access by 2030. Furthermore, we expect the number of people without access to adequate sanitation to increase from around 15.5 million today, to 18 million in 2030.
Investment in water and sanitation can have wide-spread positive health effects in both the short and long term. Access to water and sanitation reduces stunting and significantly reduces health costs. Ugandan health expenditures are significantly higher than in EAC and other low-income countries and Uganda’s rapidly rising population will only increase public and private costs of health provision.
12 To be clear, this does not mean that we recommend cutting current efforts to reduce AIDS and malaria.
13 The Fertility Reduction scenario, on the other hand, reduces the number of malnourished children by 50,000 in 2021 and over 200,000 by 2030.

20
Improving access to water and sanitation by 30 percent over the next 5 years would lead to a reduction in stunting for over a million and a half people by 2040, relative to the Current Path. Coupled with a reduction in fertility, this intervention could lower the number of people affected by stunting by another 600,000 and Uganda could see a cumulative total savings of $3 billion in health costs by 2040.14
5
5.5
6
6.5
7
7.5
8
8.5
9Po
pula
tion
(mill
ions
)
Current Path Fertility Reduction
Water and Sanitation Improvement Fertility Reduction and Water and Sanitation Improvement
Figure 11: Number of stunted people in Uganda, forecast for Current Path, Fertility Reduction, Water
and Sanitation Improvement, and Water and Sanitation Improvement with Fertility Reduction. Source:
International Futures v 7.13.
Investments in water and sanitation will not only improve long-term health and human development out-comes (by reducing stunting), it will result in long-term health cost savings. When added with fertility rate reductions, the cost of water and sanitation investment is almost fully offset by the savings from improving health outcomes. Moreover, the human capital increases from reduced stunting will have significant effects on long term productivity and economic growth.
While the long term effects of water and sanitation improvements will reduce stunting by providing access to clean water and improved sanitation facilities, undernourishment will continue to be a problem unless Uganda can increase agricultural production. Moreover, food security will become an increasingly important issue if Uganda cannot produce enough food to feed its rapidly growing population.
14 Ugandan health expenditures are significantly higher than in EAC and other low-income countries. While public health expendi-ture as a percent of GDP is largely in line with other low-income countries, private health expenditure as a percent of GDP is much higher than other low-income economies. Uganda’s rapidly rising population will only increase public and private costs of health provision. In order to reduce these costs, it is important that Uganda invests in health infrastructure projects now.

21
15 While parts of Uganda are arid, IFs measures that Uganda uses 1 percent of total renewable water resources.
16 This measures the percent of the population who live within 2 km of an all-weather road.
17 SSewanyana, Sarah, John Matovu, and Evarist Twimukye. “Building on Growth in Uganda.” In Yes African Can: Success Stories from a Dynamic Continent, edited by Manka Angwafo and Chuhan-Pole, 51–64. Washington, DC: World Bank, 2011.
Increase agricultural yields, reduce loss, and improve food security
Given its fertile soil, moderate climate, and abundant water resources,15 Uganda should have a comparative advantage in agricultural production. Instead, it lags behind in most agricultural indicators and is forced to import an increasing portion of its food to keep up with its growing population. As most of Ugandan agricultural production is informal, farmers lack the agricultural technology, scale, and access to markets necessary to take full advantage of the country’s natural endowments.
The Ugandan agricultural sector faces limited ability of improved farm inputs like fertilizer, hybrid seeds, tractors, and irrigation. Thus, the sector is composed of scattered small farms where low-yield, labor intensive subsistence farming dominates. Lack of road access (Uganda currently ranks 171 of 186 countries on the Rural Road Access Index16) means that only around 50 percent of agricultural products make it to market.17 Furthermore, small subsistence farms are increasingly vulnerable to flood, drought, and other climate-related shocks, which carry major implications for production and income. The Current Path forecasts that Uganda will get warmer (increasing average temperature by 1.5 degree centigrade relative to 1990 by 2040), wetter (increasing average precipitation by nearly 10 percent relative to 1990 by 2040), and will see its agricultural yields negatively impacted (3 percent reduction in yield relative to 1990 levels, ceteris paribus).
These barriers to production and efficiency, paired with high population growth, have led to a decline in per capita agricultural production (Figure 12). From 1990 to 2010, Ugandan agricultural yield increased by 33 percent while the population nearly doubled. This has forced Uganda to import an increasing amount of food. The increase in agricultural imports has accelerated over the last 10 years and is projected to con-tinue through 2040. Given global food price volatility, an overreliance on food imports could exacerbate Uganda’s food security situation.
0
0.2
0.4
0.6
0.8
1
1.2
Agr
icul
tura
l Pro
duct
ion
per
capi
ta
Current Path Agricultural Push
Figure 12: Crop production per capita for Uganda, historical data and forecast for Current Path, Agriculture
Push, and Agriculture Push and Fertility Reduction. Source: International Futures v 7.13.

22
Agricultural production is a function of yield, loss, and the amount of land under cultivation. Uganda must work to improve production and yield from currently cultivated land by using higher-yielding disease and drought resistant seed strains, improving infrastructure so currently produced crops can get to market cheaper and faster, and improving storage facilities to decrease post-harvest waste.
Over a five year period, the Agriculture Push scenario increases yields by 30 percent, increases land under cultivation by 10 percent, and reduces loss from poor transportation and storage infrastructure by 10 percent. This intervention increases crop production by over 40 percent across the extended time horizon of this study.
Increased agricultural production for consumption provides a domestic source of calories that will to help reduce stunting, a long-term negative driver of development. By 2040, the Agriculture Push scenario reduces the number of malnourished children by 50,000 and the number of stunted people by 150,000. These impacts are significantly improved when coupled with the Fertility Reduction scenario (Figure 13).
0.6
0.7
0.8
0.9
1
1.1
1.2
Chi
ldre
n (m
illio
ns)
Current Path Agriculture Push Agriculture Push and Fertility Reduction
Figure 13: Malnourished children in Uganda, forecast for Current Path, Agriculture Push, and Agriculture
Push and Fertility Reduction. Source: International Futures v 7.13.

23
In addition to reductions in stunting, increased domestic crop production will alleviate Uganda’s growing agricultural import dependency. Figure 14 shows agricultural imports from 1961 to 2011. We can see that food imports began to rise around 1994, but didn’t grow consistently until after 2001. This rapid growth in agricultural imports reflects the burden of a rapidly growing population and slow growth in agricultural production.
0
100000
200000
300000
400000
500000
600000
700000
Agr
icul
tura
l Im
ports
(USD
thou
sand
s)
Year
Animal Vegetable Oil Cereals and Preparations
Sugar Beverages
Fruit and Vegetables Tobacco
Figure 14: Food imports for Uganda, historical data. Source: Food and Agriculture Organization.
Along the Current Path, the growth of agriculture imports will continue through 2040. Currently, about 10 percent of net food demand is imported. But, Uganda’s massive population growth, paired with slow growth in agricultural production, is forecast to push this share to 40 percent by 2040.18
Relying on international trade for imports of many goods and services is not inherently bad. But importing 40 percent of food demand is a potential food security problem. In addition to promoting policies that increase yield, land under cultivation, and reduce loss, the government should create a strategic grain reserve as a stop-gap measure against future food price spikes.
18 Agricultural production growth in Uganda is forecast to be between 1 and 2 percent annually to 2040 while population growth is forecast to be between 2.5 and 3 percent annually.

24
The Agriculture Push scenario alters Uganda’s agricultural import pattern significantly. Improvements in agricultural yield, infrastructure, and land cultivation will significantly impact Uganda’s agricultural trade balance. Even with substantial population growth, Uganda could become a net food exporter by 2018.
-30
-20
-10
0
10
20
30
40
50Pe
rcen
t cro
p de
man
d im
porte
d
Current Path Agriculture Push Agriculture Push and Fertility Reduction
Figure 15: Percent of agricultural crop demand imported (positive is imported, negative is exported) for
Uganda, forecast for Current Path, Agricultural Push, and Agricultural Push and Fertility Reduction. Source:
International Futures v 7.13.
Improved agricultural production results in a cumulative increase in GDP of nearly 70 billion over the next 25 years. By 2040, the Agricultural Push scenario increases Uganda’s GDP per capita by $130 compared to the Current Path.
Promoting improvements in agricultural outcomes will have wide-ranging positive impacts on human and economic development, especially if coupled with other interventions highlighted earlier in this section. Improvements in food security will combat undernourishment and stunting and ensure that Uganda can feed its growing population. Moreover, increased agricultural production will help buffer Uganda from food price shocks and reduce food import costs.
However, agricultural development in Uganda is also not a panacea for development. Agricultural per capita value add is very low, and the long term vibrancy of the Ugandan economy is contingent on how the government can translate improvements in basic human development into increased social service provision and economic production.

25
Leveraging basic human development: governance and the economy
Improving governance transparency and capacity is key to the success of any Ugandan development plan. Uganda must improve governance capacity to sustain investments in human development over the long-term. Improvements in governance transparency are necessary in order to leverage human development outcomes into social and economic progress. Moreover, improvements in government transparency, paired with policies promoting higher value add production and economic diversification, will help place Uganda on a sustainable growth path.
We forecast that total spending on human services in Uganda as a share of GDP will decline over the next five years in Uganda, driven by falling foreign aid as a share of GDP.19 To help plug this public spending gap, the government should work to improve government revenue capacity by extending the tax base and improving the business environment for industry and manufacturing. Moreover, improvements in govern-ment transparency are crucial to ensure proper management of oil revenues and to increase the size of the formal economy. Furthermore, policies encouraging high value added production, export diversification, and reduced import dependence should help Uganda shift to a more sophisticated economy. Improvements in transparency, increases in government capacity, and sustained economic growth will help Uganda absorb a growing work force and enter a positive cycle of development.
Alternatively, slow improvements in both governance capacity and quality can lead to a vicious cycle that could undermine the security of the country. In this scenario, poor governance leads to rent-seeking behavior in the oil sector, the informal economy remains large and unwieldy, external shocks are poorly managed, and insufficient job growth could drive a large, disgruntled youth population to protest the status quo.
Improve government quality and capacity
The quality of institutional performance is tied to levels of transparency, rule of law, efficient creation, modification, and enforcement of legislation. In the 2014 Ibrahim Index of African Governance (IIAG), which measures governance quality, Uganda ranked 19th out of 52 countries. Uganda’s lowest scores were in access to information, political rights, accountability, transparency, bureaucracy, and corruption.20 Between 2000 and 2013, these scores have shown little improvement and Uganda’s scores for political rights, accountability, transparency, and corruption have actually declined during the same period. Within the EAC, Ugandan governance is more transparent than Burundi or Kenya, but less transparent than either Tanzania or Rwanda.21 Using estimates derived from Transparency International’s Corruption Perception Index, Uganda is the 33rd most transparent government in Africa.
Lack of government transparency can create distrust between the Ugandan people and the government and strain relations between businesses and the government. Rent-seeking behavior keeps workers from entering the formal workforce and creates a major barriers for local and international businesses. Moreover, high levels of corruption and rent-seeking divert funds from social programs and human development investment.
We created an Improved Transparency scenario that improved Ugandan transparency to the level of Lesotho, currently ranked as the 12th most transparent country in Africa.22 The Improved Transparency scenario leads to an additional 0.2 percent growth in GDP annually from 2021 through 2040. Improvements in transparency
19 In IFs government revenues is measured as a sum of tax revenue collected by the local government as well as foreign aid spent in the country on development. We forecast foreign aid to decline as a share of GDP, not in absolute terms.
20 With a scale of 0-100, with 100 being best, Access to Information Indicators ranged in score from 0-17, political rights were scored at 17, accountability, transparency, bureaucracy, and corruption were all scored at 29.
21 Using either Transparency International’s Corruption Perception Index or the World Bank’s Governance Matters measure of corruption.
22 Lesotho was chosen because it has a similar level of human development with Uganda, is more transparent than Uganda, and is an aggressive but reasonable target for improving governance. Even achieving this target Uganda would not be as transparent as Rwanda.

26
will help improve the business climate, likely resulting in increased investment in higher value add industries, and help to ensure successful management of oil production. When coupled with a reduction in fertility rates, the Improved Transparency scenario would significantly increase Ugandan GDP per capita (Figure 16).
0.5
1
1.5
2
2.5
3Th
ousa
nd U
SD
Current Path Transparency Improvement Transparency Improvement and Fertility Reduction
Figure 16: GDP per capita at market exchange rates for Uganda, forecast for Current Path, Transparency
Improvement, and Transparency Improvement and Fertility Reduction scenarios. Source: International
Futures v 7.13.
Improving government transparency will also have positive effects on government capacity. Improvements in the business climate and reductions in corruption will attract business to Uganda and bring workers into the formal economy. Increased business activity and shifting labor into the formal sector should increase economic output and widen Uganda’s tax base.
Uganda must to expand its tax base to ensure long-term fiscal sustainability. As of 2012, Uganda lagged behind all of its EAC counterparts with just under 11 percent tax revenue as a share of GDP. Currently, the government relies on external aid and concessional loans to plug the fiscal revenue gap. The Current Path scenario forecasts that foreign aid as a percent of GDP will fall from around 10 percent now to around 3 percent by 2040. While Uganda is within the bounds of debt sustainability right now,23 a falling aid to GDP ratio and a rapidly increasing population may cause debt sustainability issues in the medium to long term. As the population grows, the cost of investments in human development and public services will rise in kind. Unless the government can expand the tax base and improve tax administration to increase revenues, Uganda may be forced to increase non-concessional borrowing to plug the aid funding gap and run the risk of pushing public debt to unsustainable levels.
An increasing population, decreasing share of aid as a percent of GDP, and low tax revenue collection could quickly push Uganda into dangerous debt levels, even when factoring oil revenues as an offset to public spending in debt sustainability calculations. Moreover, recent history shows that that an influx of oil revenues does not necessarily relieve public debt burdens.
23 Analyses from the IMF and Bank of Uganda assert that Uganda’s medium and long-term debt levels are well within the bounds of sustainability. Right now, Uganda’s total public debt stands at about 30 percent of GDP, 18 percent of which is external debt. Uganda’s level of public debt is currently on a path that is not disruptive in the short-run, since many of its recently commenced infrastructure projects (e.g., the Karuma Dam) are frontloaded

27
24 Kaliisa, F.A. Kabagambe. “PEPD: Uganda’s Petroleum Resources Increase to 6.5 Billion Barrels Oil in Place.” Petroleum Exploration and Production Department, October 29, 2014.
25 Manyak, Terrell George. “Oil and Governance in Uganda.” Journal of Public Administration and Governance 5, no. 1 (March 17, 2015): 40. doi:10.5296/jpag.v5i1.7170.
26 RT Global Resource is subsidiary of Russian state corporation Rostec.
27 It should be also be noted that Uganda’s oil reserves as a share of the population are only the 19th largest in Africa and the 60th largest in the world. As noted repeatedly in this report, as massive population growth continues, the gains from these will be increasingly spread thin.
28 Looney, Robert. “Can Ghana’s Democracy Save It from the Oil Curse.” Foreign Policy 1 May 2014.
Carefully manage oil revenues and temper expectations
Improvements in governance capacity and quality are needed to offset potentially negative impacts resulting from recent oil discoveries. Since 2006, 6.5 billion barrels of oil have been discovered in Uganda.24 These reserves rank as the 10th largest in Africa and are the largest reserves in the EAC. Estimates indicate that Uganda should be able to produce approximately 200,000 barrels of crude oil per day, which would make it the 9th largest oil producer in Africa.25 At the current levels of recoverable reserves, this level of production should be sustainable for around 30 years. In order to maximize gains from oil extraction, the government has established a public-private partnership with RT Global Resources to build an oil refinery. 26 The Ugandan government will own 40 percent of the refinery and has begun selling shares of this ownership to other EAC countries.
The gains from oil exports should boost both public and private revenues, reduce dependence on petroleum imports, and diversify Uganda’s exports. However, the pitfalls of oil production could be harmful both eco-nomically and politically. The extraction and transport of oil from Uganda will be extremely expensive and will require extensive investment by both the public sector and foreign entities. Moreover, Uganda should avoid falling victim to the negative aspects of natural resource production and export, typically referred to as the resource curse. Increases in foreign currency inflows from oil exports could result in an appreciation of the exchange rate (Dutch Disease) and undermine exports from a growing industrial base. Lastly, oil market conditions are volatile and unpredictable and Uganda should temper expectations given its relatively low amount of oil reserves.27
The Ugandan government should proceed cautiously with investment in the extraction of oil from the western region and draw on lessons from Ghana. Ghana did not fall victim to Dutch Disease or corruption: the country instituted clear and comprehensive transparency rules concerning oil extraction. Instead, it fell victim to unrealistic expectations. Lack-luster revenues from oil extraction pushed the government to incur massive amounts of debt to fill the expected spending gap and avoid public perceptions of oil mismanage-ment.28 The Ghanaian case shows that even strong political institutions and transparent oil management can fail to harness the benefits of oil revenues when public expectation outstrips reality.
Moreover, the politically destabilizing effects of oil extraction must be taken into account. Rent seeking behavior could exacerbate the corruption already present in Uganda and access to cheap finance could increase the size of Uganda’s persistent budget deficit. It is important that Uganda pursue prudent fiscal planning, taking into account the uncertainties of oil extraction and putting oil revenues toward social and economically productive uses. While proper management of oil revenues should help plug Uganda’s looming spending gap, Uganda should work to formalize informal sector activity to expand its tax base.
Reduce the size of the informal sector
The informal economy is home to nearly 40 percent of economic activity and employs 65 percent the labor force. High levels of corruption create a lack of trust between the labor force and government and disin-centivize formalized business by increasing costs. Meanwhile, deficits in human development from lack of education, health, and nutrition limit the supply of productive workers. While investments in human development take some time to materialize in the workforce, improvements in corruption and government capacity can have immediate impacts on the informal sector.

28
Bringing informal labor into the formal sector increases economic output and government revenue. Incorporating even a relatively small portion of the informal labor force into the tax fold would increase government revenues significantly. Improvements in the business environment would incentivize businesses to formalize, leading to improvements in worker productivity and business output.
By integrating policy geared towards reducing the share of the informal sector into the broader develop-mental agenda, Uganda can continue to mitigate the country’s demographic risk while increasing domestic revenue collection and setting the stage for more inclusive economic success.
We created an additional scenario that exogenously reduced the share of workers in the informal sector over a five year period. Along the Current Path, we expect the share of informal workers to reduce over the next five years from 65 percent to 60 percent, which reflects ongoing aid and government programs designed to expand the tax base. We increased this reduction to 50 percent over a five-year period. In addition, we improved the ease of doing business in the country and increased transfers from the government to citizens.29
Reducing informality over five years leads to an additional $10 billion in Ugandan government revenues to 2040, though gains from this reduction are initially small (government revenues increase only $200 million from 2016 to 2021 relative to the Current Path). Coupling this intervention with a reduction in corruption provides even more dramatic gains: by 2040, government revenue increases by a total of $26 billion relative to the Current Path.
The impact of these policy interventions on GDP per capita at market exchange rates can be seen in Figure 17.
0.5
1
1.5
2
2.5
3
Thou
sand
USD
Current PathReducing InformalityImproving Transparency and Reducing InformalityImproving Transparency, Reducing Informality, and Reducing Fertility
Figure 17: GDP per capita at market exchange rates for Uganda forecast for four scenarios: Current Path,
Reducing Informality, Improving Transparency and Reducing Informality, Improving Transparency, Reducing
Informality, and Reducing Fertility scenarios. Source: International Futures v 7.13.
29 To increase tax base participation citizens need to be incentivized through government spending on issues of their concern.

29
Reducing informality can help Uganda move toward more sustainable economic growth. Shifting labor and production from the informal sector to the formal economy will result in increased efficiency, output, and trade. Moreover, drawing labor into the formal sector will allow Uganda to absorb the youth bulge and fully utilize its demographic dividend.
Increase economic sophistication and create jobs
For Uganda to harness the gains from human development investments and governance improvements, it must maintain robust economic growth by continuing the transformation to a service/manufacturing led economy. Increasing manufacturing production and service provision will move Uganda up the value added production chain and diversify its export bundle. Moreover, continuing the shift to a manufacturing and service based economy will help to provide quality jobs to a growing young workforce and help draw workers into the formal economy. Providing quality jobs in these sectors will further incentivize public and private investments in human development creating a virtuous cycle of economic growth.
Uganda has registered robust economic growth and undergone significant economic transformations in the past 25 years. But, in order to sustain economic growth and harness its demographic dividend, Uganda must invest in more sustainable growth sectors. By increasing manufacturing production and expanding service provision, Uganda will improve terms of trade and put itself in a position to better absorb shocks in international markets. Policies should be targeted toward increasing caloric self-sufficiency, exporting a wider range of high value-add products and services, and creating jobs to absorb the youth bulge.
Uganda has averaged 6.8 percent GDP growth since 1990. The Current Path scenario forecasts that Uganda will average 7.8 percent GDP growth over the next 25 years. By 2040, Ugandan GDP per capita is forecast to be nearly $2,000 at market exchange rates and $4,500 at purchasing power parity. While this growth is significant, it is well short of the desired upper middle income level of $9,500 put forward in the National Development Plan.30 Our forecasts show that Uganda’s GDP (MER) will reach $163 billion by 2040, placing Uganda in the middle of the EAC in terms of economic output.
0
50
100
150
200
250
Billi
on U
SD
Burundi Kenya Rwanda Tanzania Uganda
Figure 18: GDP at market exchange rates for EAC countries, historical data and forecast. Source: International
Futures v 7.13.
30 The NDP target of $9,500 GDP per capita does not explicitly state that they are set at market exchange rates and not purchasing power parity, but the base year amount used to initialize their model begins with market exchange rate values.

30
Until the mid-1990’s, Uganda’s value added economy was dominated by the agricultural sector. Since 1990, services as a percentage of GDP has grown from around 30 percent to just over 50 percent in 2015, while agriculture has gone from almost 60 percent of GDP to only 25 percent. The Current Path scenario expects this trend to continue, with services contributing 65 percent of value add, agriculture dropping down to 5 percent, and manufacturing remaining nearly constant.
0
20
40
60
80
100Va
lue
adde
d (p
erce
nt o
f GD
P)
Agriculture Industry Services
Figure 19: Value Added as a percent of GDP by Sector. Source: Food and Agriculture Organization.
The recent transition in the share of the value-add economy from agriculture to services represents a poten-tially important change in the composition of the Ugandan economy. However, this shift is likely an effect of regional and international integration rather than a fundamental transition in Ugandan economic pro-duction.31 Agricultural products and food stuffs still dominate the Ugandan production profile, making up 60 percent of merchandise exports and employing over 60 percent of the Ugandan labor force. Moreover, Uganda runs a persistent trade and budget deficit in order to sustain investment and imports required to fuel domestic consumption.
Trade
Ugandan total trade as percent of GDP has risen steadily over the last 25 years. In 1990, trade accounted for only 26 percent of GDP, now it accounts for over 50 percent. Over the last decade, exports of goods and services increased from 10 to 23 percent of GDP. Uganda has tapped into regional and international markets to increase export volume and diversity in agriculture, manufactures, and services. However, Ugandan export revenues still rely heavily on two products: exports of coffee (1.8 percent of GDP) and travel/tourism (5 percent of GDP), both of which are vulnerable to external market shocks. Moreover, import levels have outstripped exports and Uganda is still reliant on external supply of food stuffs, manufactures, and transportation.
Ugandan merchandise trade is highly concentrated in primary products. Coffee exports account for almost 20 percent of merchandise exports and 6 out of Uganda’s top 10 exports are primary products. Uganda is the second largest exporter of Robusta coffee in the world, selling $451,000,000 in 2014. While coffee has been a major revenue generator for Uganda, relying on the Robusta bean as the major source of income is dubious. Robusta is inferior to the highly demanded Arabica bean and the market for coffee is prone to volatility. While Arabica coffee growth has increased in Uganda since the early 21st century, the climate of Uganda is more suited to Robusta production.
31 Uganda’s recent economic shift to services has largely been due to a major increase in tourism and trade. Tourism accounts for 50 percent of Ugandan service exports and transportation account for 50 percent of service imports. A service import is any service that adds to the resources of a country by entering its economic territory (OECD)

31
0
5
10
15
20
25
30
35
40
45
Perc
ent o
f tot
al c
offe
e pr
oduc
tion
Arabica as share of coffee production
Figure 20: Arabica coffee share of total production, historical data. Source: United States Department of
Agriculture.
Merchandise imports are largely made up of agricultural goods, manufactures, and petroleum. 20 percent of Ugandan imports are petroleum imports, while high value-add manufactures (i.e., cars and medicine) and food stuffs (i.e., palm oil and sugar) make up the rest. Investments in industrial infrastructure and efficiency will allow Uganda to substitute some industrial imports. Furthermore, the recent discovery and projected production of oil in Uganda will help to alleviate petroleum imports. Uganda should work towards decreasing import dependence by producing oil domestically (though this will not happen for quite some time; more than likely after the 2021 early time horizon explored in this document), increasing food production for domestic consumption, and investing in the manufacturing sector.
The EAC, consisting of Kenya, Uganda, Tanzania, Burundi, and Rwanda, has succeeded in increasing trade between its members. Since the EAC was instituted in 2000, Uganda has seen a significant increase in exports and has rapidly diversified its export profile. Between 2004 and 2009, Ugandan exports to EAC members increased from $65 million to $330 million32 and from 2007 to 2011 the EAC had the highest share of manufacturing trade (58.3 percent) within African economic communities.33 Moreover, partnership with Kenya and Tanzania expose Ugandan exports to international markets via port access.
Manufacturing
Uganda needs to invest in manufacturing jobs to further grow the economy. Investment in manufacturing can increase the level of high value-add exports and create jobs for low-skilled workers. Low-skilled man-ufacturing jobs can help to absorb the youth bulge into the workforce, a necessity for long-term political stability. Moreover, an increase in manufactures exports should both diversify Uganda’s export bundle and help shift it from reliance on volatile commodities trade. Lastly, increasing manufacturing efficiency can provide an engine for sustainable economic growth.
Ugandan manufacturing has averaged a 9.4 percent growth rate since 1990, but Ugandan manufacturing still sees relatively low participation in export markets. The breakdown of merchandise exports shows an uptick in growth of all manufacturing exports in the mid-2000s. However, Ugandan imports of merchandise
32 Buigut, Steven. “An Assessment of the Trade Effects of the East African Community Customs Union on Member Countries.” International Journal of Economics and Finance 4, no. 10 (2012): 41–53.
33 UNCTAD. “Economic Development in African Report 2013 Intra-African Trade: Unlocking Private Sector Dynamism.” Geneva: United Nations: United Nations Conference on Trade and Development, 2013. http://therealfoodguide.com/bone-broth-basics-make-bone-broth-in-a-slow-cooker/.

32
and manufactures also grew over the past 10 years, particularly in the machinery and mineral fuels areas. Moreover, manufacturing import value has far outpaced manufacturing export value, further widening Uganda’s current account deficit.
Growth of the industry/manufacturing sector is imperative if Uganda wants to sustain increases in economic output and provide jobs to a rapidly growing population. In order to move up the value chain and transform to an industry-driven economy, Uganda must improve its business and investment climate, firm access to finance, and invest in human capital development, as discussed above. If the country can make strides to improve its manufacturing sector, the benefits will spill into other sectors of the economy.
Services
Uganda should also improve its economic resilience and harness its labor capacity by diversifying and expanding the service sector.34 According to the Uganda Export Promotion Board, services account for over 70 percent of formal employment and, as of 2009, services accounted for about 22 percent of total employment.35 Moreover, the service sector accounts for 8 out of every 10 new jobs. This growth underlines the potential that Uganda has in the service sector, specifically for high skilled individuals.
As the largest service export, over 50 percent of Uganda’s service exports are driven by travel and tourism. Although services both provide value-add opportunities and are less volatile than commodities, travel/tour-ism services still rely heavily on external markets. A major external shock, such as an Al-Shabaab terrorist attack or a pandemic, could negatively impact Uganda’s tourism market and in turn negatively impact up to 5 percent of GDP. Uganda’s service imports, on the other hand, are dominated by transportation, which reflects the costs of trade and the burden of being a landlocked country. Without a port to ship and receive goods, Uganda must rely on transportation services through Kenya and Tanzania for most of it imports.
The main challenge for Uganda is how the country should improve its service sector while lagging behind in indicators that are crucial for investors, such as electrification and business climate. Key issues that con-tinue to undermine Uganda’s competitiveness include the country’s weak infrastructure, lack of suitability of education for the job market, health indicators, and lack of training.36 Moreover, financial services in Uganda are less affordable and less accessible than in other countries in the EAC region. While many of these issues are long-term—such as education, health, and training—investments in urban electrification and improvements in the business climate are feasible in the short term.
34 A service export is any service provided by a resident to a non-resident.
35 Uganda Export Promotion Board. “Uganda Service Sector Export Strategy (Sses).” Uganda Export Promotion Board and The Sector Counterpart Team, June 2005.
36 OECD, 2013

33
Reducing human suffering: an integrated development push
Many people in Uganda suffer because of poor levels of human development. While high rates of eco-nomic growth over the past decade have contributed significantly to poverty reduction in Uganda, over 13 million people currently live on less than $1.25 per day and over 25 million live on less than $2.00 per day. If there is no significant shift in policy, especially to improve access to family planning and reduce the size of families, then we forecast that the number of people living on less than $1.25 per day will grow to 23 million by the 2030s and the number living on less than $2.00 will grow to over 45 million by 2040.
Reversing this trend requires making significant changes to the development strategy of Uganda. First, simply reducing average fertility would have a positive impact on poverty reduction and human develop-ment. Second, increasing the number of students who complete primary school and move onto secondary school would significantly improve human capital development. Third, improving agricultural outcomes, infrastructure (especially water and sanitation), and food storage will reduce stunting, improve food secu-rity and put Uganda on a more resilient path. Fourth, increasing manufacturing output and expanding the service sector will push Uganda toward sustainable long term growth while providing jobs for a growing young workforce. Finally, increasing government transparency and accountability will increase the likelihood that oil production successfully benefits Ugandans and will reduce the size of the Ugandan informal sector, driving up government revenues and completing the shift to a virtuous development cycle.
If Uganda does not make these strides in human development, economic resilience, and government capacity a vicious cycle of development could take hold. Under this scenario fertility rates reduce, however not as rapidly as the Current Path, government transparency does not improve, and agricultural production and loss improvements stagnate. Compared with the Current Path in 2040, this Vicious Cycle scenario leads to a larger youth-bulge, 4 million more people living on less than $1.25 per day, 100,000 more malnourished children, a 15 percent lower Human Development Index score, and a 3 percent increase in the likelihood of domestic social instability.
However, if Uganda and the international aid community chose to embrace this integrated policy plan, we project that Ugandan GDP per capita could reach $3,000 by 2040. While this is still well short of the $9,500 goal of the NDP, it is much higher than the Current Path projection. Under the Combined Interventions scenario Uganda would be well on its way to escaping the poverty trap and well positioned to deal with development challenges associated with the middle-income trap.

34
0.5
1
1.5
2
2.5
3
3.5
Thou
sand
USD
Current Path Vicious Cycle Combined Interventions
Figure 21: GDP per capita at market exchange rates for Uganda, forecast for Current Path, Vicious Cycle,
and Combined Interventions scenarios. Source: International Futures v 7.13.
We believe that our interventions are both aggressive and reasonable. Pushing on any of the leverage points we have outlined in this document will lead to positive development outcomes that reduce human suffering. Pushing on all of the leverage points we have outlined should help place Uganda on a sustainable development path and enter it into a virtuous cycle of development. But, patience is important. Many of the interventions outlined here will have small effects in the short term, but will provide significant dividends further down the road.
The long-term future of Ugandan development depends on its people. All of our interventions target invest-ments that improve human development and policies that harness human capital. Investing in education, health, and food security will boost human development and ease human suffering. Reducing population growth will increase the efficacy of each dollar spent on improving human development. Policies improving governance and fostering sustainable economic growth will help engage and employ a growing young workforce.