![Untitled-1 [isampe.org]...TECHNOLOGIES & INNOVATIONS I. Carbon Fibre composites for non-aerospace applications. 2. Out of Autoclave manufacturing 3. Composites over moulding 4. Advances](https://static.fdocuments.in/doc/165x107/60b96a3a3d5e8d7d3d1dde36/untitled-1-technologies-innovations-i-carbon-fibre-composites-for.jpg)
ADVANCES IN GRAPHENE BASED MATERIALS AND THEIR COMPOSITES … · Advances in GBMs and their...
303
ADVANCES IN GRAPHENE-BASED MATERIALS AND THEIR COMPOSITES WITH FOCUS ON BIOMEDICAL APPLICATIONS Artur Daniel Moreira Pinto This dissertation is submitted to the Faculty of Engineering, University of Porto, for the degree of Doctor of Philosophy in Biomedical Engineering. Supervisors: Prof. Dr. Fernão Domingos de Montenegro Baptista Malheiro de Magalhães Prof.ª Dr.ª Inês de Castro Gonçalves de Almada Lobo abril 2017
Transcript of ADVANCES IN GRAPHENE BASED MATERIALS AND THEIR COMPOSITES … · Advances in GBMs and their...

ADVANCES IN GRAPHENE-BASED
MATERIALS AND THEIR COMPOSITES WITH
FOCUS ON BIOMEDICAL APPLICATIONS
Artur Daniel Moreira Pinto
This dissertation is submitted to the Faculty of Engineering, University of
Porto, for the degree of Doctor of Philosophy in Biomedical Engineering.
Supervisors:
Prof. Dr. Fernão Domingos de Montenegro Baptista Malheiro de Magalhães
Prof.ª Dr.ª Inês de Castro Gonçalves de Almada Lobo
abril 2017


To my family and everyone who supports me


Advances in GBMs and their composites with focus on biomedical applications
Artur M. Pinto – Jan 2017 i
ACKNOWLEDGEMENTS
First, I would like to thank the unmatchable availability, all the support, advising, and resources
made available from my supervisor, Prof. Fernão Magalhães, which were indispensable for the
development of the work here presented.
I would like to thank my co-superviser, Prof. Inês Gonçalves, for making possible the beginning,
and advising me through the development, of almost all the biological characterization component
of this work at INEB-i3S, and university of Washington.
I would like to express my gratitude to everyone from ARCP, INEB-i3S, ISCS-N, and FEUP that
cooperated with me during this period, as for example Carla Mora, Carolina Gonçalves, Diana
Paiva, Daniela Sousa, Domingos Castro, Eva Ribeiro, Patrícia Henriques, Pedro Bandeira, Pedro
Fonte, Rita Ferreira, Rui Cruz, Sarah Pontes, Susana Moreira, and Viviana Pinto. My
acknowledgements to professors Adélio Mendes, Agostinho Moreira, Bruno Sarmento, Cristina
Martins, Rui Guedes, and respective teams, for making available, and assistance while using their
labs/equipment.
A mention of gratitude must be addressed to Prof. Buddy Ratner, and his team, for welcoming me
and making all the conditions available for the development of my work during the visiting period
at the Bioengineering Department of the University of Washington. My acknowledgments to
Prof. James Bryers and his team, for the use of the equipment in their lab.
Finally, I thank my family for all the support they have been giving me since ever, without which
it would not be possible for me to reach any goal, including the completion of this thesis.

Advances in GBMs and their composites with focus on biomedical applications
ii Artur M. Pinto – Jan 2017

Advances in GBMs and their composites with focus on biomedical applications
Artur M. Pinto – Jan 2017 iii
FUNDING ACKNOWLEDGEMENTS
Artur Pinto wishes to thank Fundação para a Ciência e a Tecnologia (FCT) for PhD grant
SFRH/BD/86974/2012, funded by European Social Fund and Portuguese Ministry of Education
and Science (MEC) through Programa Operacional Capital Humano (POCH).
This work was financially supported by: POCI-01-0145-FEDER-006939 (Laboratory for Process
Engineering, Environment, Biotechnology and Energy – UID/EQU/00511/2013) and Project
POCI-01-0145-FEDER-007274 (Institute for Research and Innovation in Health Sciences) funded
by the European Regional Development Fund (ERDF), through COMPETE2020 - Programa
Operacional Competitividade e Internacionalização (POCI) and by national funds, through FCT -
Fundacao para a Ciencia e a Tecnologia.
Funding for this work was partially provided by FEDER, through Programa Operacional Factores
de Competitividade – COMPETE, and by National Funding through FCT – Fundação para a
Ciência e a Tecnologia, in the framework of project PTDC/EME-PME/114808/2009 and project
PTDC/CTM-BIO/4033/2014.
Experiments at the University of Washington were funded, in part, through the University of
Washington Engineered Biomaterials (UWEB21) Engineering Research Center.
Advances in GBMs and their composites with focus on biomedical applications
iv Artur M. Pinto – Jan 2017
Advances in GBMs and their composites with focus on biomedical applications
Artur M. Pinto – Jan 2017 v
LIST OF PUBLICATIONS
1. A.M. Pinto, S. Moreira, I.C. Goncalves, F.M. Gama, A.M. Mendes, F.D. Magalhaes,
Biocompatibility of poly(lactic acid) with incorporated graphene-based materials, Colloids and
Surfaces B: Biointerfaces 104 (2013) 229-238.
2. A.M. Pinto, I.C. Gonçalves, F.D. Magalhães, Graphene-based materials biocompatibility: a
review, Colloids and Surfaces B: Biointerfaces 111 (2013) 188-202.
3. A.M. Pinto, C. Gonçalves, D.M. Sousa, A.R. Ferreira, J.A. Moreira, I.C. Gonçalves, F.D.
Magalhães, Smaller particle size and higher oxidation improves biocompatibility of graphene-
based materials, Carbon 99 (2016) 318-329.
4. C. Gonçalves*, A.M. Pinto*, A.V. Machado, J.A. Moreira, I.C. Gonçalves, F.D. Magalhães,
Biocompatible reinforcement of poly(lactic acid) with graphene nanoplatelets, Polymer
Composites (2016) article in press, DOI: 10.1002/pc.24050. *equal contribution
5. A.M. Pinto, J.A. Moreira, F.D. Magalhães, IC Gonçalves, Polymer surface adsorption as a
strategy to improve the biocompatibility of graphene nanoplatelets, Colloids and Surfaces B:
Biointerfaces 146 (2016) 818-824.
6. A.M. Pinto, C. Gonçalves, I.C. Gonçalves, F.D. Magalhães, Effect of biodegradation on
thermo-mechanical properties and biocompatibility of poly (lactic acid)/graphene nanoplatelets
composites, European Polymer Journal 85 (2016) 431-444.

Advances in GBMs and their composites with focus on biomedical applications
vi Artur M. Pinto – Jan 2017
Advances in GBMs and their composites with focus on biomedical applications
Artur M. Pinto – Jan 2017 vii
ABSTRACT
Graphene is the elementary structure of graphite, being a one carbon atom thick sheet, composed
of sp2 carbon atoms arranged in a flat honeycomb structure. Due to its unique characteristics,
graphene has unmatched electronic, mechanical, optical, and thermal properties, amongst others.
In 2010, Geim and Novoselov were awarded the Nobel prize "for groundbreaking experiments
regarding the two-dimensional material graphene". Since then significant financial and human
investment has been made on graphene applications in the most diverse forms. This means that
graphene tends to become widespread. However, only a small fraction of the research focuses on
the biological field.
Poly(lactic acid) (PLA) is an aliphatic polyester derived from renewable sources, which has
several applications in various areas. In bioengineering, PLA is used for production of
bioresorbable artificial ligaments, hernia repair meshes, scaffolds, screws, surgical plates, and
suture yarns. To make this material more effective in several applications some properties can be
improved, being mechanical performance usually the most relevant. Reinforcement with small
amounts of nanofillers, as graphene/based materials (GBMs) is an interesting option because it
allows improvement of target properties without changing PLA’s main characteristics.
Since GBMs have several potential applications in biomedical engineering and biotechnology,
this thesis is focused in understanding their biointeractions, and which sort of physical-chemical
features have impact on their biocompatibility. It also studies GBMs as fillers for PLA, and the
way by which they improve PLA properties and affect biocompatibility.
An extensive literature review is presented on the key issues regarding GBMs biocompatibility,
namely production methods, physical-chemical properties, concentrations, time of exposure, and
encapsulation in polymer matrices. In this thesis, the biological properties of GBMs dispersed in
liquid media are studied in in vitro assays, as well as how they are affected by the materials’
morphology, degree of oxidation, and surface modification with polymers. Human fibroblasts are
used as an in vitro model to characterize GBMs biocompatibility, in terms of induction of reactive
oxygen species production, metabolic activity changes, effect on cell morphology, evaluation of
membrane damages, and particles internalization. Smaller graphene nanoplatelets (GNP) are
observed to be generally more biocompatible than larger sized ones, which tend to cause
membrane damages. Also, complete oxidation of GNP folds its sharp edges, therefore preventing
toxicity. Surface adsorption of poly(vinyl alcohol) increases GNP size, preventing its
internalization, therefore improving its biocompatibility. These results are relevant for the
materials’ use in biomedical applications.

Advances in GBMs and their composites with focus on biomedical applications
viii Artur M. Pinto – Jan 2017
Literature on composites of PLA with carbon-based nanomaterials is also reviewed in depth.
Usually, GBMs are reported to improve several PLA properties, namely thermal, electrical,
mechanical, and biological properties. However, GBMs physico-chemical properties, composites
production methods, and ideal incorporation amounts vary between studies.
In this thesis, the production of PLA/GNP composites is explored by two different methods:
solvent mixing followed by doctor blading, and melt-blending followed by compression
moulding. Optimization of both methods is performed, in order to improve PLA physical-
chemical properties. GNP improves the mechanical properties of PLA, and reduces the decay of
its mechanical performance after 6 months degradation in physiological conditions. In addition,
the composites have stable behaviour under cyclic creep-relaxation testing, while PLA exhibits
significant cumulative permanent strain, and ruptures after a few cycles. This is particularly
relevant in the context of PLA uses in orthopedics, or other implantable materials that need to
have a suitable mechanical performance along time when inside the body.
Improvements in biological properties are also observed, namely increase in cell proliferation for
PLA/graphene oxide composites, and decrease of platelets activation for PLA/graphene
nanoplatelets composites, both produced by solvent mixing. Composites produced by melt-
blending, and their degradations products, do not affect cell metabolic activity and morphology.
Finally, the above-mentioned results are discussed in the light of the most recently available
literature reports, and new research perspectives are pointed out. In vivo characterization of the
PLA/GNP composites is being performed, since they present outstanding mechanical
performance after degradation in biological conditions, and lack of in vitro toxicity, which
perspectives them as a promising material for biomedical applications.
Keywords
graphene; poly(lactic acid); biocompatibility; biomaterials; biodegradation; composites;
mechanical properties.
Advances in GBMs and their composites with focus on biomedical applications
Artur M. Pinto – Jan 2017 ix
RESUMO
O grafeno é a estrutura elementar da grafite, sendo uma folha com a espessura de um átomo de
carbono, composta por átomos de carbono com hibridização sp2, ordenados numa estrutura de
colmeia 2D. Devido a estas características únicas, o grafeno possui ímpares propriedades
eletrónicas, mecânicas, óticas, térmicas, entre outras. Em 2010, o prémio Nobel da Física foi
atribuído a Geim e Novoselov “por experiências revolucionárias com o material bidimensional
grafeno”. Desde então, tem sido feito um significativo investimento financeiro e humano nas
aplicações do grafeno nas mais diversas formas. Isto significa que o grafeno tende a estar
disseminado, no entanto, apenas uma pequena parte da investigação na área está focada no campo
biológico.
O ácido poliláctico (PLA) é um poliéster alifático derivado de fontes renováveis, que tem
aplicações em diversas áreas. Em bioengenharia, o PLA é usado para produção de ligamentos
artificiais bioabsorvíveis, redes para reparação de hérnias, estruturas para regeneração de tecidos,
parafusos e placas cirúrgicas e fios de sutura. Para tornar este material mais eficaz para várias
aplicações, algumas propriedades podem ser melhoradas, sendo o desempenho mecânico
normalmente a mais relevante. O reforço com pequenas quantidades de nano-cargas, como os
materiais com base em grafeno (GBMs) é uma opção interessante, pois permite a melhoria das
propriedades alvo sem modificar as principais características do PLA.
Como os GBMs têm várias potenciais aplicações em engenharia biomédica e biotecnologia, esta
tese está focada na compreensão das suas bio-interações e no tipo de características físico-
químicas que têm impacto na sua biocompatibilidade. Também estuda os GBMs como cargas
para incorporação em PLA e a forma como melhoram as propriedades do PLA e afetam a sua
biocompatibilidade.
É apresentada uma extensa revisão bibliográfica dos pontos-chaves da biocompatibilidade dos
GBMs, nomeadamente métodos de produção, propriedades físico-químicas, concentrações,
tempos de exposição e encapsulação em matrizes poliméricas. Nesta tese, as propriedades
biológicas dos GBMs quando dispersos em meio líquido, são estudadas em ensaios in vitro, assim
como a forma como estas são afetadas pela morfologia dos materiais, grau de oxidação e
modificação superficial com polímeros. Fibroblastos humanos são usados como modelo in vitro
para caracterizar a biocompatibilidade dos GBMs, em termos de indução de espécies reativas de
oxigénio, alterações na atividade metabólica, efeito na morfologia celular, avaliação de danos na
membrana e internalização de partículas. Foi observado que nanoplaquetas de grafeno (GNP)
mais pequenas, no geral são mais biocompatíveis que as de tamanho maior, que tendem a causar
danos nas membranas celulares. Para além disso, a oxidação completa das GNP dobra as suas

Advances in GBMs and their composites with focus on biomedical applications
x Artur M. Pinto – Jan 2017
extremidades afiadas, prevenindo assim a sua toxicidade. A adsorção superficial de álcool
polivinílico aumenta o tamanho das GNP, impedindo a sua internalização e assim melhorando a
sua biocompatibilidade. Estes resultados são relevantes tendo em conta as aplicações biomédicas
destes materiais.
A literatura sobre materiais compósitos de PLA com nanomateriais com base em carbono também
é revista em profundidade. É descrito que normalmente os GBMs melhoram várias propriedades
do PLA, nomeadamente térmicas, elétricas, mecânicas e biológicas. No entanto, as propriedades
físico-químicas dos GBMs, os métodos de produção dos compósitos e quantidades de GBMs
incorporadas variam entre os estudos.
Nesta tese, a produção de compósitos de PLA/GBMs é explorada usando dois métodos diferentes:
1) mistura em solvente, seguida de doctor blading; 2) mistura em fundido, seguida de moldagem
por compressão. É realizada otimização de ambos os métodos, de forma a melhorar as
propriedades físico-químicas do PLA. As GNP melhoram as propriedades mecânicas do PLA e
reduzem o decaimento do seu desempenho mecânico após degradação em condições fisiológicas
durante 6 meses. Para além disso, os compósitos apresentam comportamento estável sob testes
cíclicos de fluência-relaxamento, enquanto que o PLA apresenta deformação cumulativa
constante e rompe após poucos ciclos. Isto é particularmente relevante tendo em conta as
aplicações do PLA em ortopedia ou noutros materiais implantáveis que necessitem de ter um
desempenho mecânico adequado ao longo do tempo quando no interior do corpo.
São observadas melhorias nas propriedades biológicas, nomeadamente aumento da proliferação
celular à superfície de filmes compósitos de PLA/óxido de grafeno e decréscimo da ativação de
plaquetas para PLA/nanoplaquetas de grafeno, ambos produzidos por mistura em solvente. É
observado que os compósitos produzidos por mistura em fundido e os seus produtos de
degradação não afetam a atividade metabólica nem a morfologia celular.
Finalmente, os resultados acima mencionados são discutidos à luz da literatura mais recente e
novas perspetivas de investigação apontadas. Está a ser realizada caracterização in vivo dos
compósitos de PLA/GNP, uma vez que apresentam um desempenho mecânico notável após
degradação em condições biológicas e não são tóxicos in vitro, o que os torna um material
promissor para aplicações biomédicas.
Palavras-chave
grafeno; ácido polilático; biocompatibilidade; biomateriais; biodegradação; compósitos;
propriedades mecânicas.

Advances in GBMs and their composites with focus on biomedical applications
Artur M. Pinto – Jan 2017 xi
TABLE OF CONTENTS
1 INTRODUCTION 1 1.1 Scope 3 1.2 Key concepts 3 1.2.1 Biomaterials and biocompatibility 3 1.2.2 Graphene-based materials (GBMs) 6 1.2.3 Poly(lactic acid) (PLA) 9 1.3 Motivation and Scope 11 1.4 Dissertation Outline 12
2 GBMs BIOCOMPATIBILITY – LITERATURE REVIEW 19 2.1 Scope 21 2.2 State of the art 21 2.2.1 Introduction 21 2.2.2 In vitro biocompatibility studies 25 2.2.3 In vivo biocompatibility studies 28 2.2.4 Hemocompatibility 35 2.2.5 Biocompatibility of composite materials containing GBMs 35 2.3 Conclusions 42
3 GBMs BIOCOMPATIBILITY – EFFECT OF PARTICLE SIZE AND DEGREE OF OXIDATION 51 3.1 Scope 53 3.2 State of the art 53 3.3 Materials and methods 55 3.3.1 Graphene-based materials oxidation 55 3.3.2 GBMs physical-chemical characterization 55 3.3.3 GBMs biocompatibility 57 3.3.4 Statistical analysis 61 3.4 Results 61 3.4.1 GBMs physical-chemical characterization 61 3.4.2 GBMs biocompatibility 67 3.5 Discussion 74 3.6 Conclusions 77
4 GBMs BIOCOMPATIBILITY – EFFECT OF POLYMER SURFACE ADSORPTION 83 4.1 Scope 85 4.2 State of the art 85 4.3 Materials and methods 87 4.3.1 Materials preparation 87 4.3.2 Physical-chemical characterization 87 4.3.3 Biocompatibility evaluation 88 4.3.4 Statistical analysis 90 4.4 Results 90 4.4.1 Physical-chemical characterization 90 4.4.2 Biocompatibility evaluation 92
Advances in GBMs and their composites with focus on biomedical applications
xii Artur M. Pinto – Jan 2017
4.5 Discussion 97 4.6 Conclusions 99
5 PLA/CARBON-BASED NANOMATERIALS COMPOSITES (CBNs) – LITERATURE REVIEW 103 5.1 Scope 105 5.2 State of the art 105 5.2.1 Introduction 105 5.2.2 Materials 106 5.2.3 Production of PLA/CBNs composites 112 5.2.4 Properties of PLA/CBNs Composites 114 5.3 Conclusions 135
6 PHYSICAL-CHEMICAL PROPERTIES AND BIOCOMPATIBILITY OF PLA/GBMs COMPOSITES - PRODUCTION BY SOLVENT-MIXING 147 6.1 Scope 149 6.2 State of the art 149 6.3 Materials and methods 151 6.3.1 Materials 151 6.3.2 Preparation of GO 152 6.3.3 Preparation of PLA/GO films 152 6.3.4 Preparation of PLA/GNP films 152 6.3.5 Films surface characterization 152 6.3.6 In vitro biocompatibility assays 153 6.3.7 Statistical analysis 156 6.4 Results and discussion 156 6.4.1 Topographical characterization 156 6.4.2 Chemical characterization 158 6.4.3 Wettability of the films surface 161 6.4.4 In vitro biocompatibility assessment 163 6.4.5 Platelet adhesion and activation 165 6.5 Conclusions 169
7 PHYSICAL-CHEMICAL PROPERTIES AND BIOCOMPATIBILITY OF PLA/GBMs COMPOSITES - PRODUCTION BY MELT-BLENDING 173 7.1 Scope 175 7.2 State of the art 175 7.3 Materials and methods 178 7.3.1 Materials 178 7.3.2 Preparation of PLA/GNP composites 178 7.3.3 X-ray photoelectron spectroscopy (XPS) 178 7.3.4 Fourier transform Infrared Spectroscopy (FTIR) 179 7.3.5 Tensile properties 179 7.3.6 Thermal analysis 179 7.3.7 Scanning Electron Microscopy (SEM) 180 7.3.8 Raman spectroscopy 180 7.3.9 Biocompatibility assays 181

Advances in GBMs and their composites with focus on biomedical applications
Artur M. Pinto – Jan 2017 xiii
7.4 Results and discussion 181 7.4.1 GNP-C physico-chemical characterization 181 7.4.2 FTIR analysis 182 7.4.3 Mechanical characterization 183 7.4.4 Thermal analysis 185 7.4.5 Scanning electron microscopy 189 7.4.6 Raman spectroscopy 191 7.4.7 Biocompatibility with fibroblasts 194 7.5 Conclusions 196
8 PHYSICAL-CHEMICAL PROPERTIES AND BIOCOMPATIBILITY OF PLA/GBMs COMPOSITES - EFFECT OF BIODEGRADATION 201 8.1 Scope 203 8.2 State of the art 204 8.3 Materials and methods 205 8.3.1 Materials 205 8.3.2 Preparation and degradation of PLA and PLA/GNP composites 206 8.3.3 Physico-chemical characterization 206 8.3.4 Mechanical properties characterization 207 8.3.5 Biocompatibility evaluation 208 8.3.6 Statistical analysis 209 8.4 Results 210 8.4.1 Physical-chemical characterization 210 8.4.2 Mechanical characterization 212 8.4.3 Biocompatibility with human fibroblasts 216 8.5 Discussion 220 8.6 Conclusions 223
9 GENERAL DISCUSSION 229
10 CONCLUSIONS AND FUTURE WORK 239 10.1 General conclusions 241 10.2 Ongoing and Future work 242
11 APPENDICES 245
APPENDIX A Supplementary material for Chapter 3 GBMs biocompatibility - effect of particle size and degree of oxidation 247 APPENDIX B Supplementary material for Chapter 4 GBMs biocompatibility - effect of polymer surface adsorption 257 APPENDIX C Supplementary material for Chapter 8 Physical-chemical properties and biocompatibility of PLA/GBMs composites - Effect of biodegradation 267

Advances in GBMs and their composites with focus on biomedical applications
xiv Artur M. Pinto – Jan 2017

Advances in GBMs and their composites with focus on biomedical applications
Artur M. Pinto – Jan 2017 xv
LIST OF TABLES
Table 2.1: GBMs and respective production methods. .................................................................. 23 Table 2.2: Effect of GBMs on bacteria viability and membrane integrity..................................... 26 Table 2.3: Effect of GBMs on mammalian cell structure, metabolism and viability..................... 29 Table 2.4: GBMs in vivo biocompatibility.................................................................................... 32 Table 2.5: GBMs hemocompatibility. ........................................................................................... 36 Table 2.6: Types of GBMs composites used in biocompatibility studies and respective production
methods. ........................................................................................................................................ 37 Table 2.7: Biocompatibility of GBMs composites. ....................................................................... 39 Table 5.1: Mechanical properties of PLA/CBNs composites in comparison with non-modified
PLA. Production methods and CBNs characteristics. ................................................................. 117 Table 5.2: Electrical properties of PLA/CBNs composites in comparison with non-modified PLA.
Production methods and CBNs characteristics. ........................................................................... 123 Table 5.3: Thermal properties of PLA/CBNs composites in comparison with non-modified PLA.
Production methods and CBNs characteristics. ........................................................................... 129 Table 5.4: Biological properties of PLA/CBNs composites in comparison with non-modified
PLA. Production methods and CBNs characteristics. ................................................................. 133 Table 6.1: Roughness parameters for PLA, PLA/GO and PLA/GNP films. Sa – arithmetic average
height of the surface, Sp – maximum peak height, Sv – maximum valley depth, Sz – maximum
height of the surface. Results are presented as mean and standard deviation (in parenthesis)
for n = 3. ..................................................................................................................................... 158 Table 6.2: Atomic composition of graphite, GNP and GO, determined by XPS. Results are
presented as mean and standard deviation (in parenthesis). ........................................................ 160 Table 6.3: Atomic composition analysis by XPS of the surface of PLA, PLA/GO and PLA/GNP
films. Results are presented as mean and standard deviation (in parenthesis) for n = 3. ............. 161 Table 6.4: Contact angles at 60 s of H2O, ethane-1,2-diol and hexadecane on PLA, PLA/GO and
PLA/GNP films. Results are presented as mean and standard deviation (in parenthesis) for n = 3.
.................................................................................................................................................... 161 Table 7.1: Glass transition temperature (Tg) and melting temperature (Tm) for PLA and
PLA/GNP-C composites (180°C, 20 min, and 50 rpm) with different filler contents. ................ 187

Advances in GBMs and their composites with focus on biomedical applications
xvi Artur M. Pinto – Jan 2017
Advances in GBMs and their composites with focus on biomedical applications
Artur M. Pinto – Jan 2017 xvii
LIST OF FIGURES
Figure 1.1: Evolution of the number of publications mentioning biomaterials and biocompatibility
from 1970 to 2016. Source: Scopus; keywords searched: “biomaterial” -
“biocompatibility”; search date: 30/12/2016. ........................................................................ 6 Figure 1.2: Timeline of selected events in the history of the preparation, isolation, and
characterization of graphene. Reprinted from reference 29, with permission from Wiley,
Copyright (2016). .................................................................................................................. 8 Figure 1.3: Evolution of the number of publications mentioning graphene and graphene +
biocompatibility from 2004 to 2016. Source: Scopus; keywords searched: “graphene” -
“graphene; biocompatibility”; search date: 31/12/2016. The number of “graphene;
biocompatibility” publications was subtracted from “graphene” ones in the graph. Labels on
top of the bars show the number of “graphene + biocompatibility” publications. ................. 9 Figure 1.4: Evolution of the number of publications mentioning PLA and PLA + medical from
1975 to 2016. Source: Scopus; keywords searched: “PLA” - “PLA; medical”; search date:
31/12/2016. The number of “PLA; medical” publications was subtracted from “PLA” ones in the
graph. Labels on top of the bars show the number of “PLA + medical” publications. .................. 11 Figure 1.5: Schematic diagram illustrating the different topics covered in this thesis and their
articulation. .......................................................................................................................... 13 Figure 2.1: Simplified scheme showing graphene and graphene oxide structures and some
examples of functionalization for both materials. ................................................................ 22 Figure 3.1: SEM images of dry powders of GNP-C at (A) 500×, (B) 100000×; GNP-M at (C)
500×, (E) 4000×, (F) 20000×, and (D) 100000×; GNP-M-ox-1:3 at (G) 4000×, and (H)
20000×; and of GNP-M-ox-1:6 at (I) 4000×, and (J) 20000×. Scale bars are 1 (B, D), 5 (F,
H, J), 30 (E, G, I), and 200 µm (A, C). ................................................................................ 62 Figure 3.2: Particle size distributions of GNP-C, GNP-M and GNP-M-ox-1:3 and 1:6 dispersed in
water at a concentration of 100 μg mL−1. ............................................................................ 63 Figure 3.3: A) Table shows atomic composition of GBMs and content of C 1s chemical groups
resulting from spectra fitting (*fitting for oxygen groups of GNP-C and M could not be
performed due to having low content); B) XPS spectra for the core level C 1s for GNP-C,
M, GNP-M-ox-1:3 and 1:6; C, D, E) spectra fitting for GNP-M, GNP-M-ox-1:3 and 1:6,
respectively. Deconvoluted peaks shown correspond to: 1) C=C (sp2), 2) C-C (sp3), 3) C-
OH, 4) C-O-C, 5) C=O, and 6) O-C=O. .............................................................................. 64 Figure 3.4: Representative unpolarized Raman spectra for GNP-C, GNP-M, GNP-M-ox-1:3, and
GNP-M-ox-1:6 powders, acquired at ambient conditions. B) Intensity ratio of the (D/G)
bands of GBMs powders. Results are presented as mean and standard deviation (n = 3). C)
TGA curves and weight loss for GBMs powders. ............................................................... 66 Figure 3.5: Percentage of RBCs lysis after 3 h incubation at 37 °C with PBS (negative control),
and different concentrations of GBMs (100, 200 and 500 μg mL−1). Positive control (Triton
1% in PBS) resulted in 100% hemolysis. Results are presented as mean and standard
deviation (n = 3). Greek symbols represent statistically significant differences between
samples within the same concentrations (p < 0.05). No significant differences were
observed between PBS and GBMs for all concentrations tested (p > 0.05). ........................ 67 Figure 3.6: A) HFF-1 cells viability after incubation with GBMs in DMEM+, at 24, 48 and 72 h.
Cell metabolic activity is represented as percentage in comparison with cells cultured in
DMEM+ (100%). Results are presented as mean and standard deviation (n = 6). The red
line at 70%, marks the toxicity limit, according to ISO 10993-5:2009(E). Statistical analysis
is presented in Table A1. B) Percentage of HFF-1 cell death after 72 h of incubation with
GBMs. Cell death percentage was corrected by subtraction of the value for cells cultured in
DMEM+ (negative control for cell death). Results are presented as mean and standard
deviation (n = 3). Statistically significant differences, analysed within each concentration
between all GBMs are represented by c – GNP-C, m – GNP-M, 1:3 – GNP-M-ox-1:3
(differences were only found comparing with GNP-M-ox-1:6); Differences comparing with
DMEM+ are represented by Ø. Symbols not underlined represent p < 0.05, for p < 0.01
signs are underlined. ............................................................................................................ 69

Advances in GBMs and their composites with focus on biomedical applications
xviii Artur M. Pinto – Jan 2017
Figure 3.7: Intracellular reactive oxygen species levels (ROS) induced by GNP-C, GNP-M, GNP-
M-ox-1:3, and GNP-M-ox-1:6 (1, 10, 50 μg mL−1), when incubated with HFF-1 cells for 1
h. Negative control for ROS levels increase is PBS (considered 100%) and positive control
H2O2 100 mM. Results are presented as mean and standard deviation (n = 3). Statistically
significant differences, analysed within each concentration are represented by c – GNP-C,
m – GNP-M, 1:3 – GNP-M-ox-1:3, 1:6 – GNP-M-ox-1:6. Symbols represented above a
sample concentration indicate that sample is different from samples represented by the
symbols for that concentration. Symbols are not underlined when p < 0.05 and underlined
when p < 0.01. Above 10 μg mL−1 all samples are different from PBS (p < 0.01). ........... 71 Figure 3.8: Representative immunofluorescence images of HFF-1 cells after 72 h incubation with
50 μg mL−1 of GNP-C, GNP-M, GNP-M-ox-1:3 and GNP-M-ox-1:6. Triton 0.1% in
DMEM+ was used as positive control for changed morphology and cells grown in DMEM+
as negative control. Cells were stained with DAPI (nuclei) – blue and Phalloidin (F-actin in
cytoskeleton) – green. Scale bar represents 200 μm. ........................................................... 73 Figure 3.9: TEM images of HFF-1 cells incubated for 72 h with 100 μg mL−1 GBMs. A, B –
DMEM+, C – GNP-C (a – particle interacting with plasma membrane (pm), b – particle
internalized and in contact with plasma membrane, c – particle inside a vesicle (vs) in
cytoplasm), D – GNP-C particles spread in cytoplasm and interaction with a mitochondria
(mt), E − Membrane rupture (white arrow) and cytoplasmic content leakage caused by
GNP-M particle, F – GNP-M in cytoplasm (nc – nucleus), G – GNP-M-ox-1:3 (a –
interacting with plasma membrane, b – entering through plasma membrane, c – vesicle
containing an internalized particle), H – GNP-M-ox-1:6 particle in contact with plasma
membrane causing no damages, I – GNP-M-ox-1:6 inside cytoplasm. Scale bar represents
0.5 μm for all images except for image A, in which it represents 2 μm............................... 73 Figure 4.1: A) Particle size distributions of GBMs dispersed in water at a concentration of 100 μg
mL−1. B) Particle size distributions for a narrower size range than in image A, to allow
comparison between GBMs with smaller size distribution. ................................................. 91 Figure 4.2: Percentage of RBCs lysis after 3 h incubation at 37 °C with PBS (negative control)
and different concentrations of GBMs (100, 200 and 500 μg mL−1). The positive control
(Triton 1% in PBS) resulted in 100% hemolysis (data not shown). The results are presented
as the mean and standard deviation (n = 3). Greek symbols represent statistically significant
differences between samples within the same concentration (p < 0.05). ............................. 92 Figure 4.3: A) HFF-1 cell viability after incubation with GBMs in DMEM+, at 24, 48 and 72 h.
Cell mitochondrial metabolic activity is represented as a percentage in comparison with
cells cultured in DMEM+ (100%). The results are presented as the mean and standard
deviation (n = 6). The red line at 70% marks the toxicity limit according to ISO 10993-
5:2009(E). The statistical analysis is presented in Table S1. B) Percentage of HFF-1 cell
death after 72 h of incubation with GBMs. Cell death percentage was corrected by
subtraction of the value for cells cultured in DMEM+ (negative control for cell death). The
results are presented as the mean and standard deviation (n = 3). Statistically significant
differences (p < 0.05) analysed within each concentration between all GBMs are
represented by Greek symbols. C) Intracellular reactive oxygen species levels (ROS)
induced by GBMs (1, 10, 50 μg mL−1) when incubated with HFF-1 cells for 1 h. The
negative control for ROS production is PBS (considered 100%) and the positive control is
H2O2 100 mM. The results are presented as the mean and standard deviation (n = 3). No
statistically significant differences (p > 0.05) were observed between samples within each
concentration. ...................................................................................................................... 94 Figure 4.4: TEM images of HFF-1 cells incubated for 72 h with 100 μg mL−1 GBMs. DMEM+ −
A [33], B (cyt − cytoplasm, nc − nucleus); GNP-C − C (a − particle interacting with pm −
plasma membrane, b − particles inside cytoplasm, c − particle in contact with nucleus), D
(particles inside cytoplasm, vs- vesicles); GNP-C-PVA − E (agglomerated particles inside
cytoplasm), F (particle outside plasma membrane); GNP-C-HEC − G (particles spread in
cytoplasm), H (particles interacting with mitochondria − mt). Scale bar represents 0.5 μm,
except for A − 2 μm............................................................................................................. 96 Figure 5.1: Evolution Scheme showing the relation between different types of GBMs and their
top-down production methods. .......................................................................................... 108

Advances in GBMs and their composites with focus on biomedical applications
Artur M. Pinto – Jan 2017 xix
Figure 5.2: Scheme showing the different types of modifications performed on CBNs prior to
incorporation in PLA. ........................................................................................................ 110 Figure 5.3: Scheme showing the different production methods of PLA/CBNs composites. ....... 111 Figure 6.1: Activation degree of platelets at the surface of the films. Representative images of
non-activated (A and B) and activated (C and D) platelets, at 20,000× magnification. ..... 155 Figure 6.2: Representative 3D images of the topography of the surface of pristine PLA (A),
PLA/GO (B) and PLA/GNP (C) films. .............................................................................. 157 Figure 6.3: Reflected light microscopy of the surface of PLA (A), PLA/GO (B) and PLA/GNP
(C) films. ........................................................................................................................... 159 Figure 6.4: XPS spectra for the core level C 1s (after fitting) of graphite, GO and GNP powders.
........................................................................................................................................... 160 Figure 6.5: Contact angle images for: A – water on PLA, B – ethane-1,2-diol on PLA, C –
hexadecane on PLA, D – hexadecane on PLA/GO and E – hexadecane on PLA/GNP film
surface. .............................................................................................................................. 162 Figure 6.6: Dispersive and polar components of the total surface free energy of PLA, PLA/GO
and PLA/GNP films. ......................................................................................................... 163 Figure 6.7: Cell proliferation inhibition index for mouse embryo fibroblasts, cultured on PLA,
PLA/GO and PLA/GNP films. Results are presented as mean and error bars represent SD.
*Significantly different (p < 0.05). .................................................................................... 164 Figure 6.8: Fluorescence microscopy of mouse embryo fibroblasts after 48 h incubation in the
direct contact assay: A – Agar (negative control); B – positive control (latex rubber); C and
D – PLA; E – PLA/GO and F – PLA/GNP. ...................................................................... 165 Figure 6.9: Platelet adhesion on PLA, PLA/GO and PLA/GNP films surface, pre-immersed in
PBS or plasma. Degree of activation of the platelets adhered to the surface of the films pre-
immersed in PBS or in plasma. A – activated, NA – non activated. Results are presented as
mean and error bars represent standard deviation. *Significantly different (p < 0.05). ..... 167 Figure 6.10: Platelets adherent on the surface of PLA (A), PLA/GO and (B) PLA/GNP films pre-
immersed in plasma (images of the films pre-immersed in PBS are not shown). .............. 168 Figure 7.1: (a) XPS spectrum for atomic composition of GNP-C powder; (b) TGA curve for
GNP-C powder. ................................................................................................................. 182 Figure 7.2: FTIR spectra for PLA and PLA/GNP-C 0.25 wt.% (180°C, 20 min, and 50 rpm). .. 183 Figure 7.3: Effect of increasing nanofiller content on mechanical properties of PLA/GNP-C
composites under the same processing conditions (180°C, 20 min, and 50 rpm): (a) Young's
modulus; (b) tensile strength; (c) toughness. Error bars represent standard deviations
computed from measurements on at least 10 samples. ...................................................... 184 Figure 7.4: Effect of mixing time and rotation speed on mechanical properties of PLA/GNP-C
composites processed at 180°C, for a filler content of 0.25 wt.%: (a) Young's modulus; (b)
tensile strength; (c) toughness. Error bars represent standard deviations computed from
measurements on at least 10 samples. ............................................................................... 186 Figure 7.5: DSC thermograms for PLA and PLA/GNP-C (180°C, 20 min, and 50 rpm) composites
with different filler contents. ............................................................................................. 187 Figure 7.6: (a) TGA; (b) −dTG curves for PLA and PLA/GNP-C composites with different filler
contents (180°C, 20 min, and 50 rpm). .............................................................................. 188 Figure 7.7: (a) SEM images of GNP-C powder at 100,000× magnification; (b) fracture surfaces
(under liquid nitrogen) of PLA/GNP-C composites (180°C, 20 min, and 50 rpm), showing
GNP-C agglomerates at 40,000× magnification; (c, d) individualized platelets at 200,000×
magnification, for loadings of 0.25 and 0.5 wt.% in PLA (180°C, 20 min, and 50 rpm),
respectively........................................................................................................................ 189 Figure 7.8: (a) Cumulative plots of number of agglomerates per unit of area (mm2) as a function
of agglomerate length, for different GNP-C loadings (180°C, 20 min, and 50 rpm); (b) SEM
images of fracture of surfaces for 5,000× magnification. .................................................. 190 Figure 7.9: Representative unpolarized Raman spectra for PLA, GNP-C powder, and PLA/GNP-
C 0.5 wt.% 20 min, recorded at ambient conditions. ......................................................... 191 Figure 7.10: Example of Raman spectrum fitting according to Eq. (1) to PLA/GNP-C 0.5 wt.% 20
min. Bands 1–3 are attributed to D band and 5–6 to G band of GNP-C, while band 4 arises
from PLA matrix. .............................................................................................................. 192

Advances in GBMs and their composites with focus on biomedical applications
xx Artur M. Pinto – Jan 2017
Figure 7.11: Unpolarized Raman spectra of PLA and PLA/GNP-C 0.1, 0.25, and 0.5 wt.% for (a)
10 and (b) 20 min mixing times. ........................................................................................ 193 Figure 7.12: Intensity ratios of the D and G bands of monolayer GNP-C (peak 2/peak 6) for GNP-
C powder and PLA/GNP-C 0.1, 0.2, and 0.5 wt.% for 10 and 20 min mixing times. Results
are presented as average values and error bars represent standard deviation (n > 3). ........ 194 Figure 7.13: Metabolic activity of HFF-1 cells cultured at the surface of PLA/GNP-C 0.25 wt.%
(180 °C, 20 min, and 50 rpm) in DMEM+, at 24, 48, and 72 h. Cell metabolic activity is
represented as percentage in comparison with cells cultured at PLA surface in DMEM+
(100%). Results are presented as mean and standard deviation (n = 6). The red line at 70%
marks the toxicity limit, according to ISO 10993-5:2009(E). For positive control of cell
death, cells were cultured at PLA surface in DMEM+/Triton 0.1%, with metabolic activity
being close to 0% (data not shown). For representative immunofluorescence images of
HFF-1 at 72 h, cells were stained with DAPI (nuclei) blue and phalloidin (F-actin in
cytoskeleton) green. Bottom line presents the phase-contrast images of materials surface.
Scale bar represents 100 μm. ............................................................................................. 195 Figure 8.1: SEM images of PLA 0 M (A), PLA 6 M (B), PLA/GNP-M 0.25 wt.% 0 M (C),
PLA/GNP-M 0.25 wt.% 6 M (D), PLA/GNP-C 0.25 wt.% 0 M (E), and PLA/GNP-C
0.25 wt.% 6 M (F), broken under liquid nitrogen. Magnification is 4000×. Scale bar
represents 30 μm. Elliptical contours point out surface erosion and possible bulk
degradation. ....................................................................................................................... 211 Figure 8.2: Average 𝑴w evolution for PLA, PLA/GNP-M and C 0.25 wt.% along degradation
time (0, 2, 4 and 6 months). Results are presented as mean and standard deviation (n = 3).
........................................................................................................................................... 212 Figure 8.3: TGA curves and temperatures of onset of intense thermal degradation (Td) for PLA
and composites before and after 6 months degradation in PBS at 37 °C and 100 rpm. ..... 213 Figure 8.4: Stress-strain curves and mechanical parameters for PLA and composites before and
after 6 months degradation in PBS at 37 °C and 100 rpm. ................................................ 214 Figure 8.5: Creep and recovery curves for PLA, PLA/GNP-M and C 0 and 6 M at 37 °C. ........ 215 Figure 8.6: Multicycle creep-relaxation curves for PLA and composites before (0 M) and after
6 months (6 M) degradation in PBS at 37 °C. ε – strain. ................................................... 215 Figure 8.7: (A) HFF-1 cells viability at the surface of PLA, PLA/GNP-M and C 0.25 wt.%
cultured in DMEM, at 24, 48 and 72 h. Cell metabolic activity is represented as a
percentage in comparison with negative control for metabolic activity decrease - DMEM
(100%). Positive control for metabolic activity decrease – Triton 0.1% presented metabolic
activity below 5% (data not shown). Results are presented as the mean and standard
deviation (n = 6). The red line at 70%, marks the toxicity limit, according to ISO 10993-
5:2009(E). [31] * Statistically significantly different from the negative control (p < 0.05). All
samples were different from positive control – Triton 0.1% (p < 0.05). (B) LIVE/DEAD
staining of HFF-1 cells incubated at the surface PLA, PLA/GNP-M and C 0.25 wt.% for
72 h. Triton 0.1% in DMEM was used as toxicity positive control and DMEM as negative
control. Cytoplasm is stained with calcein – green, all nuclei with Hoechst 33342, and cells
with membrane integrity compromised were stained in the nucleus with propidium iodide
(PI) – red. The bottom line presents a phase-contrast image of the materials surface. Scale
bar represents 100 μm. (C) Immunofluorescence images of HFF-1 cells after 72 h culture at
the surface of PLA, PLA/GNP-M and C 0.25 wt.%. Triton 0.1% in DMEM was used as
positive control for changed morphology, and cells grown in DMEM as negative control.
Cells were stained with DAPI (nuclei) - blue and Phalloidin (F-actin in cytoskeleton) -
green. Scale bar represents 100 μm. .................................................................................. 217 Figure 8.8: (A) HFF-1 cells viability after incubation with 6 months degradation products of PLA
6 M, PLA/GNP-M and C 6 M 0.25 wt.% cultured in DMEM+, at 24, 48 and 72 h. Cell
metabolic activity is represented as percentage in comparison with negative control for
metabolic activity decrease (100%) – DMEM 6 M – cells exposed to 50 μL PBS 6 M
(incubated 6 months at 37 °C at 100 rpm) in 150 μL DMEM. Positive control for metabolic
activity decrease – Triton 0.1% presented a metabolic activity below 5% (data not shown).
Results are presented as the mean and standard deviation (n = 6). The red line at 70%,
marks the toxicity limit, according to ISO 10993-5:2009(E). [31] There are no statistically

Advances in GBMs and their composites with focus on biomedical applications
Artur M. Pinto – Jan 2017 xxi
significant differences (p > 0.05) between samples, and between samples and negative
control (DMEM). (B) LIVE/DEAD staining of HFF-1 cells incubated with 6 months
degradation products of PLA 6 M, PLA/GNP-M and C 6 M 0.25 wt.% for 72 h. Triton
0.1% was used as toxicity positive control (images not shown – similar to Fig. 8.7(B)).
Negative control was DMEM 6 M (50 μL PBS 6 M + 150 μL DMEM). Cytoplasm is
stained with calcein – green, all nuclei with Hoechst 33342, and cells with membrane
integrity compromised were stained in the nucleus with propidium iodide (PI) – red. Scale
bar represents 100 μm. (C) Representative immunofluorescence images of HFF-1 cells after
incubation for 72 h with PLA 6 M and PLA/GNP-M and C 6 M 0.25 wt.% degradation
products. Triton 0.1% was used as positive control for changed morphology (images not
shown – similar to Fig. 8.7(C)). Negative control was DMEM 6 M (50 μL PBS
6 M + 150 μL DMEM). Cells were stained with DAPI (nuclei) - blue and Phalloidin (F-
actin in cytoskeleton) - green. Scale bar represents 100 μm. ............................................. 219

Advances in GBMs and their composites with focus on biomedical applications
xxii Artur M. Pinto – Jan 2017
Advances in GBMs and their composites with focus on biomedical applications
Artur M. Pinto – Jan 2017 xxiii
LIST OF ABBREVIATIONS AND ACRONYMS
%ID/g – percent injected dose per gram of wet tissue
aG – aggregated graphene
APS – ammonium persulfate
at.% – atomic percentage
BB-rGO – brilliant blue functionalized rGO
BBS – balanced buffer solution
BSA – bovine serum albumin
C18PMHePEG – poly(maleic anhydride-alt-1-octadecene)
CB – carbon black
CBNs – carbon-based nanomaterials
CCCP – carbonyl cyanide m-chlorophenylhydrazone
CCVD – catalytic carbon vapor deposition
CL – cellulose
CM-H2DCFDA – chloromethyl-2′,7′-dichlorodihydrofluorescein diacetate
CNT(s) – carbon nanotube(s)
CON – chondroitin
CPII – cell proliferation inhibition index
CS – chitosan
CVD – chemical vapor deposition
CXYG – carboxyl graphene nanoplatelets
d – diameter
DAPI – 4′,6-Diamidino-2-phenylindole dihydrochloride
DCC – N,N’-dicyclohexylcarbodiimide
DD – degree of deacetylation
DLS – dynamic light scattering
DMA – dynamic mechanical analysis
DMEM – Dulbecco's modified eagle's medium
DMF – dimethylformamide
DNA – deoxyribonucleic acid
DSC – differential scanning calorimetry
EDC – N-(3-dimethylamino-propyl-N’-ethylcarbodiimide)
EDTA – ethylenediaminetetraacetic acid

Advances in GBMs and their composites with focus on biomedical applications
xxiv Artur M. Pinto – Jan 2017
ERG – electroretinography
FBS – fetal bovine serum
FDA – food and drug administration
f-G – functionalized graphene
FTIR – Fourier transform infrared
G2xO – doubly-oxidized graphene oxide
GBM(s) – graphene-based material(s)
GLU – glucosamine
G-NH2 – amine-modified graphene
GNP(s) – graphene nanoplatelets
GNP-ox – oxidized graphene nanoplatelets
GNSs – graphene nanosheets
GO – graphene oxide
GO-COOH – graphene oxide functionalized with carboxylic groups
GONP – graphene oxide nanoplatelets
GONSs – graphene oxide nanosheets
GPC-SEC – size exclusion chromatography
G-Pluronic – graphene dispersed in Pluronic aqueous solution
GS – graphene sheets
GSH – glutathione
Gt – graphite
GtO – graphite oxide
HA – hyaluronic acid
HA – hydroxyapatite
Hb – hemoglobin
HD – hydrodynamic diameter
HEC – hydroxyethyl cellulose
Hep/BSA-g-pRGO – heparin/bovine serum albumin grafted pRGO
hpf – hours post-fertilization
HPMEC – human pulmonary microvascular endothelial cells
Hr – Hydrazine reduction
HUVECS – human umbilical vein endothelial cells
i.v. – intravenous
IL – interleukin
IOP – intraocular pressure
IPTES – 3-isocyanatoporpyl triethoxysilane

Advances in GBMs and their composites with focus on biomedical applications
Artur M. Pinto – Jan 2017 xxv
l – length
MA – maleic anhydride
MDG – methanol derived graphene
MFG – magnetic multifunctional graphene
MG – magnetic graphene
MHM – modified Hummers method
MMP – mitochondrial membrane potential
MPC – 2-(methacryloyloxy) ethyl phosphorylcholine
MPS – mononuclear phagocyte system
mt – mitochondria
MTT – 1-(4,5-dimethylthiazol-2-yl)-3,5-diphenylformazan
Mw – molecular weight
MWCNT(s) – multi-walled carbon nanotube(s)
NA-rGO – 1-Naphthalenesulfonate functionalized rGO
nGO – ultra small graphene oxide
NGO-SS-mPEG – PEGylated nano-graphene oxide
PANI – poly(aniline)
PBMCs – peripheral blood mononuclear cells
PBS – phosphate buffered saline
PC – human platelets concentrate
PDMS – polydimethylsiloxane
PEG – poly(ethylene glycol)
PEG – poly(ethylene glycol)
PEG-NGS – poly(ethylene glycol) functionalized nanographene sheets
PEI-g-GNR – poly(ethylenimine)-grafted graphene nanoribbon
PFA – paraformaldehyde
PFG – polymer-functionalized graphene nanoparticles
p-G – pristine graphene
PI – propidium iodide
PLA – poly(lactic acid)
PLGA – poly(lactide-co-glycolide acid)
PLL – poly(l-lysine)
pm – plasma membrane
PMMA – poly(methyl methacrylate)
pRGO – poly(dopamine) adhered RGO
PS – poly(styrene)
Advances in GBMs and their composites with focus on biomedical applications
xxvi Artur M. Pinto – Jan 2017
PU – poly(urethane)
PVA – poly(vinyl alcohol)
PVK – poly(N-vinylcarbazole)
PVP – poly(vinyl pyrrolidone)
Py – 1-Pyrenemethanol
RBC – red blood cells
RES – reticuloendothelial system
rGO/RGO – reduced graphene oxide
ROS – reactive oxygen species
rpm – revolutions per minute
Sa – arithmetic average height of the surface
SD – standard deviation
SEM – scanning electron microscopy
Sp – maximum peak height
SSLS – surface selective laser sintering
Sv – maximum valley depth
SWCNT(s) – single-walled carbon nanotubes
Sz – maximum height of the surface
t – thickness
t1/2 – area under the curve after
t1/2 – elimination half-life
Tc – cold crystallization temperature
Td max – temperature of maximum degradation rate
Td5 – decomposition temperature for 5 wt.% loss
Td50 – decomposition temperature for 50% weight loss
Tdi – beginning of thermal degradation
TEM – transmission electron microscopy
Tg – glass transition temperature
TGA – Thermogravimetric Analysis
THF – tetrahydrofuran
Tm – melting temperature
TMRE – tetramethylrhodamine, ethyl ester
trGO – thermally reduced Graphene Oxide
uCNT – unzipped Carbon Nanotubes
UHMWPE – ultra-high molecular weight polyethylene
vs – vesicle
Advances in GBMs and their composites with focus on biomedical applications
Artur M. Pinto – Jan 2017 xxvii
wt.% – weight percentage
XPS – X-ray photoelectron spectroscopy
XRD – X-ray diffraction
ΔHc – cold crystallization enthalpy
ΔHm – melting enthalpy
ε∞ – permanent creep strain
εmax – maximum creep strain
χc – degree of crystallinity

Advances in GBMs and their composites with focus on biomedical applications
xxviii Artur M. Pinto – Jan 2017
Advances in GBMs and their composites with focus on biomedical applications
Artur M. Pinto – Jan 2017 xxix
LIST OF APPENDICES
APPENDIX A
SUPPLEMENTARY MATERIAL FOR CHAPTER 3
SMALLER PARTICLE SIZE AND HIGHER OXIDATION IMPROVES
BIOCOMPATIBILITY OF GRAPHENE-BASED MATERIALS
247
APPENDIX B
SUPPLEMENTARY MATERIAL FOR CHAPTER 4
POLYMER SURFACE ADSORPTION AS A STRATEGY TO IMPROVE THE
BIOCOMPATIBILITY OF GRAPHENE NANOPLATELETS
257
APPENDIX C
SUPPLEMENTARY MATERIAL FOR CHAPTER 8
EFFECT OF BIODEGRADATION ON THERMO-MECHANICAL PROPERTIES AND
BIOCOMPATIBILITY OF POLY(LACTIC ACID)/GRAPHENE NANOPLATELETS
COMPOSITES
267
Advances in GBMs and their composites with focus on biomedical applications
xxx Artur M. Pinto – Jan 2017

Advances in GBMs and their composites with focus on biomedical applications
Artur M. Pinto – Jan 2017 1
Chapter 1
Introduction
Chapter 1 - Introduction
2 Artur M. Pinto – Jan 2017

Advances in GBMs and their composites with focus on biomedical applications
Artur M. Pinto – Jan 2017 3
1 INTRODUCTION
1.1 Scope
The present chapter starts by introducing some of the key concepts intimately related to the work
in the chapters presented later in this thesis.
Since historical basis usually provides the motivation to do research within a certain scope,
sometimes it is hard to dissociate between the two. However, a separate section, entitled
motivation and scope, was introduced to explain the events and conditions that made this work
possible and that directed it along the last years.
Finally, an outline of the chapters in this thesis is presented, with the relations between them
pointed out and their contents briefly explained.
1.2 Key concepts
1.2.1 Biomaterials and biocompatibility
The use of biomaterials can be traced back to the origins of civilization, in parallel with the
invention and application of instruments and tools. Ranging from Mesoamerica to Asia, including
Mexico, Rome, Athens, Egypt, and India, findings of antient artificial limbs, eyes, ears, teeth, and
noses took place. This states the early concern of mankind to augment or repair the body, using
materials available in nature such as wood, glue, rubber, manufactured materials such as iron,
gold, zinc, and glass, and even tissues from living origins. [1-6] Materials were tested, selected, and
modified for medical applications along the ages with early concepts starting to arise, however it
was only in the late 17th century with advancements in the field of surgery, the usage of aseptic
techniques, and radiography that a more accurate use and scientific understanding of biomaterials
was possible. [2, 5, 7, 8] In the late 19th and early 20th centuries, previous knowledge and concepts
resulted in the advent of today’s routinely used biomaterials in for example, intraocular lenses,
orthopedic prostheses, dental implants, kidney dialysis machines, catheters, pacemakers, heart

Chapter 1 - Introduction
4 Artur M. Pinto – Jan 2017
valves, stents, and breast implants. [1, 2, 9] Every day, advances on biomaterials field result in
improvement of the quality of life and life expectancy. The refinement of the production methods,
along with the improvement of existent materials, and the arising of new ones, as synthetic
polymers, ceramics, and metal alloys, increased the application range of biomaterials. Also, the
1970s advances in molecular biology and 1990-2000s in genomics and proteomics, allowed the
study and understanding of biological interactions at the interface with materials. The possibility
of using methods or molecules to modify biomaterials interactions with the body or even using
living tissue as a biomaterial itself, revolutionized the field to a point in which it is already hard to
define the main terms commonly used. [1, 9] For that reason, the definition of “biomaterial” has
been evolving and adapting to new insights along the past decades. One of the first definitions
was resultant from the National Institutes of Health (NIH) consensus development conferences in
1982, and describes biomaterial as “any substance (other than a drug) or combination of
substances synthetic or natural in origin, which can be used for any period of time, as a whole or
part of a system which treats, augments, or replaces tissue, organ, or function of the body.” [2, 5, 10,
11] Some years later, at the 1986 consensus conference of the European Society for Biomaterials
in Chester, England, several key definitions within the scope of biomaterials science were debated
with some consistency being achieved. [8, 12, 13] Consensual definitions for artificial organ,
bioactive material, bioadhesion, bioattachment, biocompatibility, biomaterial, bioprosthesis, host
response, hybrid artificial organ, implant, medical device, prosthesis, and thrombogenicity were
published in the proceedings. [14] The definition agreed for biomaterial was “a non viable material
used in a medical device, intended to interact with biological systems.” [1, 8, 12, 13, 15] The success
of the first consensus conference led to a second meeting in the same place in 1991, in which the
past definitions were further discussed and perfected. For example, in the case of biomaterial
definition, the reference to non-viability was removed. [13, 16] Further reflection and refinement of
the concepts was published in a contextual dictionary of biomaterials science published in 1999.
[17] The most recent refinement of the definition of biomaterial in literature was published in
2009, in which after a methodical discussion the following conclusion was stated, “a biomaterial
is a substance that has been engineered to take a form which, alone or as part of a complex
system, is used to direct, by control of interactions with components of living systems, the course
of any therapeutic or diagnostic procedure, in human or veterinary medicine.’’ [12]
Another key term that has been discussed along the years in biomaterials science is
“biocompatibility”. [1, 8, 13, 18, 19] Despite papers studying tissue reaction to implanted biomaterials
appearing since 1940s, only by 1970 the word “biocompatible” was used. [8] The most widespread
concept for it was originated at the 1986 consensus conference on biomaterials held in Chester.
There, biocompatibility is defined as “the ability of a material to perform with an appropriate host
response in a specific application”. [1, 8, 18]
Advances in GBMs and their composites with focus on biomedical applications
Artur M. Pinto – Jan 2017 5
This simple and at the same time broad definition reminds us that a biomaterial should not elicit a
deleterious host response, but leaves questions open regarding the criteria to evaluate if that
response is acceptable or not. In a comprehensive leading opinion article, the previous definition
was updated to, “biocompatibility refers to the ability of a biomaterial to perform its desired
function with respect to a medical therapy, without eliciting any undesirable local or systemic
effects in the recipient or beneficiary of that therapy, but generating the most appropriate
beneficial cellular or tissue response in that specific situation, and optimising the clinically
relevant performance of that therapy.” This definition reaffirms the importance of biomaterials
safety in a more specific manner, and adds that the material should exert beneficial effects to the
host. [18] However, it is still being a qualitative definition, because it doesn’t specify the criteria to
judge the “undesirable local or systemic effects”. Absolute absence of undesirable effects with
desirable biological actions can be considered the ultimate goal of biomaterials. However, while
that is not achieved a risk/benefit approach on accessing biocompatibility can be taken. An
interesting term found in literature is “biomaterial performance”. It consists of characterizing
biomaterials using many qualitative, semi-quantitative, and/or quantitative observations or
measurements. Some of these observations can be data in surface corrosion, changes in bulk and
surface properties, and histological and biological analysis of inflammation. [19] Here, physico-
chemical characterization of the biomaterial is important because it can impact on its
performance, both by leading to “undesirable effects” or changing/preventing “the clinically
relevant performance”. Also, the application of this concept requires the support of well-
documented reference standards of materials, methods, and responses. [19] In vitro studies allow a
first understanding of tissues and cells interactions with a biomaterial. Also, low levels of
endotoxins and no measurable leachables are a predictor of better performance after implantation.
In vivo studies allow the assessment of the body’s overall response towards a biomaterial, and
allow the understanding of how the immune system reacts to it, which can be done by evaluating
a possible foreign body reaction and its extent. [8, 19] Usually, a biomaterial that elicits the
formation of a thin, stable foreign body capsule and only low levels of cellular reaction at the
implant site is accepted as biocompatible by physicians, regulatory agencies, and standards
organizations. However, the evolution on materials science field led to “the ability of a material to
locally trigger and guide non-fibrotic wound healing, reconstruction and tissue integration”, and
this is the latest proposed definition for biocompatibility, regarding biomaterials to which it is
applicable. Thus, “the ability of a material to reside in the body for long periods of time with only
low degrees of inflammatory reaction” should be considered biotolerability. [8] The definitions of
biomaterial and biocompatibility have been evolving since they first started to be found in
literature around 1970. Since then, their use has been growing as can be noticed in Figure 1.1. As
the biomaterials science field expand new insights keep arising, that creates a pressing need for
reflection and constant adjustment of the definitions, so those should be regarded as dynamic

Chapter 1 - Introduction
6 Artur M. Pinto – Jan 2017
instead of dogmatic. Also, the definitions can be subdivided according to the context, because for
example the concept of biocompatibility regarding an implant is surely different from when
considering a polymer-nucleotide conjugate, and the attempt to make a definition that comprises
such different biomaterials, can result in a hollow one.
Figure 1.1: Evolution of the number of publications mentioning biomaterials and
biocompatibility from 1970 to 2016. Source: Scopus; keywords searched: “biomaterial” -
“biocompatibility”; search date: 30/12/2016.
1.2.2 Graphene-based materials
Carbon has been observed since prehistoric times in the form of soot, charcoal, graphite and
diamond. For example, the usage of graphite has been traced to before 4000 BC, when the
Marican, Boian, and Gumelniţa cultures in Europe used it to paint pottery. [20-24] Obviously,
ancient cultures did not realize, that these substances were different forms of the same element,
[23, 24] because the identification of carbon as an element only millennia after was worked out step
by step by R.-A.-F. de Reaumur, H.-L. Duhamel du Monceau, Torbern Bergman, C. W. Scheele,
C.-L. Berthollet, A.-L. Lavoisier, and others. [24] In 1789, A-. L. Lavoisier listed “Carbone” in his
“Traité Elémentaire de Chimie” as one of the newly identified chemical elements, whose
versatility was already known since it had been shown that it was the elementary component of
both diamond and graphite. [25, 26] Since then, more allotropes of carbon have been discovered
and studied, ranging from amorphous carbon, to fullerenes (0 D), graphene (1D), and nanotubes
(2 D). [26-28] Graphite ore has been found and mined in England since the 16th century. One of its

Advances in GBMs and their composites with focus on biomedical applications
Artur M. Pinto – Jan 2017 7
uses was to mark sheep, and because of that in 1789 A. G. Verner named it after the Greek word
“graphein”, which means “to write”. [21, 29] Since the development of the pencil industry in the
18th century, graphite has been one of the most widely used materials to write. [21] Due to its
layered structure when mechanical friction occurs between the paper and graphite in the pencil,
graphite flakes are delaminated becoming attached to the paper. Thus by the simple act of writing,
we have been on the way between graphite and graphene since centuries ago, but that only started
to be considered recently, due to the importance that graphene has been achieving. [30] Reviews
on graphene history [29, 31] report the firstly produced monolayer graphene-based material (GBM)
to be graphene oxide (GO). Since around 1840, Schafhaeutl, Brodie, Staudenmaier, and others
were studying the intercalation (insertion of small molecules in between the graphite layers) and
exfoliation of graphite with strong oxidizing acids (Figure 1.2). [29] In 1948, G. Ruess and F.
Vogt, observed few nanometers flakes of GO by transmission electron microscopy (TEM), being
these studies continued by the group of Ulrich Hofmann, which in 1962, together with Hanns-
Peter Boehm identified some GO fragments as monolayers. [31] The later, proposed the term
graphene for the first time in 1962 in the following terms, “The ending -ene is used for fused
polycyclic aromatic hydrocarbons, even when the root of the name is of trivial origin, e.g.
naphthalene, anthracene, tetracene, coronene, ovalene. A single carbon layer of the graphitic
structure would be the final member of infinite size of this series. The term graphene layer should
be used for such a single carbon layer.” [32] In 1997, IUPAC recognized graphene by including the
following recommendations into their Compendium of Chemical Technology, “previously,
descriptions such as graphite layers, carbon layers or carbon sheets have been used for the term
graphene. Because graphite designates that modification of the chemical element carbon, in which
planar sheets of carbon atoms, each atom bound to three neighbours in a honeycomb-like
structure, are stacked in a three-dimensional regular order, it is not correct to use for a single layer
a term which includes the term graphite, which would imply a threedimensional structure. The
term graphene should be used only when the reactions, structural relations or other properties of
individual layers are discussed [emphasis added].” In 1999 Ruoff and co-workers
micromechanically exfoliated graphite into thin lamellae comprising multiple graphene layers. In
this method, lithographic patterning of highly ordered pyrolytic graphite was combined with
oxygen-plasma etching to create pillars, which were converted into the thin lamellae by rubbing.
[29] In 2004, Geim, Novoselov, and co-workers using a similar micromechanical approach,
followed by repeated peeling of flakes from graphite with scotch tape, finally achieved a single
layer – graphene, which could be located by optical and electron microscopy and its electric-field
effects characterized. [33]
Chapter 1 - Introduction
8 Artur M. Pinto – Jan 2017
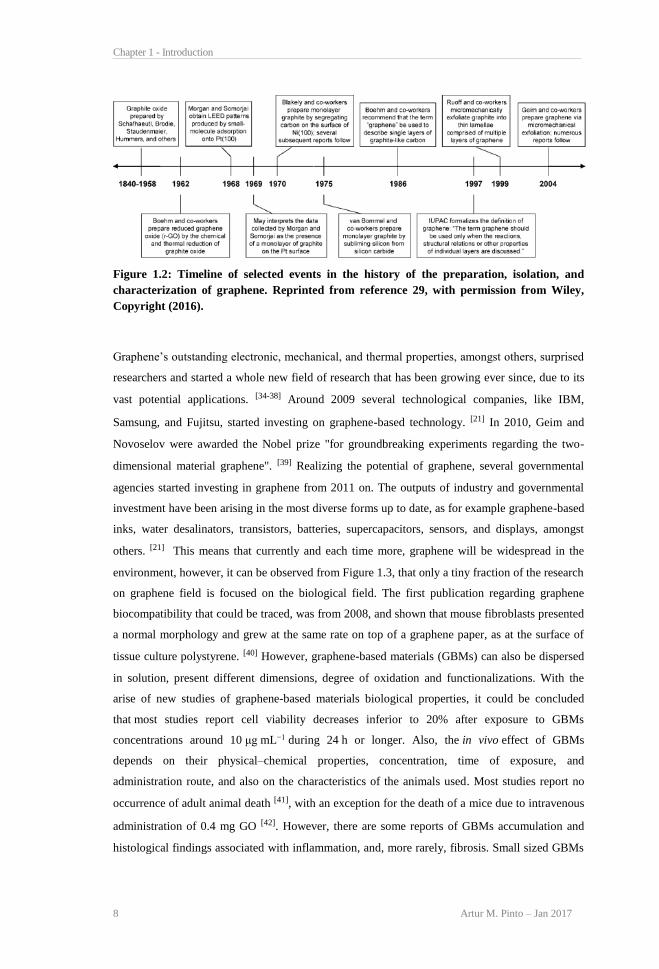
Figure 1.2: Timeline of selected events in the history of the preparation, isolation, and
characterization of graphene. Reprinted from reference 29, with permission from Wiley,
Copyright (2016).
Graphene’s outstanding electronic, mechanical, and thermal properties, amongst others, surprised
researchers and started a whole new field of research that has been growing ever since, due to its
vast potential applications. [34-38] Around 2009 several technological companies, like IBM,
Samsung, and Fujitsu, started investing on graphene-based technology. [21] In 2010, Geim and
Novoselov were awarded the Nobel prize "for groundbreaking experiments regarding the two-
dimensional material graphene". [39] Realizing the potential of graphene, several governmental
agencies started investing in graphene from 2011 on. The outputs of industry and governmental
investment have been arising in the most diverse forms up to date, as for example graphene-based
inks, water desalinators, transistors, batteries, supercapacitors, sensors, and displays, amongst
others. [21] This means that currently and each time more, graphene will be widespread in the
environment, however, it can be observed from Figure 1.3, that only a tiny fraction of the research
on graphene field is focused on the biological field. The first publication regarding graphene
biocompatibility that could be traced, was from 2008, and shown that mouse fibroblasts presented
a normal morphology and grew at the same rate on top of a graphene paper, as at the surface of
tissue culture polystyrene. [40] However, graphene-based materials (GBMs) can also be dispersed
in solution, present different dimensions, degree of oxidation and functionalizations. With the
arise of new studies of graphene-based materials biological properties, it could be concluded
that most studies report cell viability decreases inferior to 20% after exposure to GBMs
concentrations around 10 μg mL−1 during 24 h or longer. Also, the in vivo effect of GBMs
depends on their physical–chemical properties, concentration, time of exposure, and
administration route, and also on the characteristics of the animals used. Most studies report no
occurrence of adult animal death [41], with an exception for the death of a mice due to intravenous
administration of 0.4 mg GO [42]. However, there are some reports of GBMs accumulation and
histological findings associated with inflammation, and, more rarely, fibrosis. Small sized GBMs

Advances in GBMs and their composites with focus on biomedical applications
Artur M. Pinto – Jan 2017 9
present fast elimination. Existing information on in vivo toxicity mechanisms is still scarce, and
more studies are needed to support safe biological applications of these materials. Little is known
about long-term toxicity of GBMs. This is an issue that merits consideration in future studies.
Also, the effect of GBMs on cell signaling is being studied, and more information should become
available soon. [41] More detailed information regarding GBMs biological effects can be found on
Chapter 2. However, in the scope of this thesis, it is important to note that, encapsulation of
GBMs in a matrix reduces potential toxicity. In addition, incorporation of hydrophilic forms
improves cell adhesion at the biomaterials surface. Also, some reports of antibacterial properties
and improved hemocompatibility of GBMs-based composites offer interesting perspectives for
future research and developments. [41]
Figure 1.3: Evolution of the number of publications mentioning graphene and graphene +
biocompatibility from 2004 to 2016. Source: Scopus; keywords searched: “graphene” -
“graphene; biocompatibility”; search date: 31/12/2016. The number of “graphene;
biocompatibility” publications was subtracted from “graphene” ones in the graph. Labels
on top of the bars show the number of “graphene + biocompatibility” publications.
1.2.3 Poly(lactic acid)
The basic building block for poly(lactic acid) (PLA) is lactic acid, which was first isolated from
sour milk by Scheele, in 1780, and started to be produced for commercial purposes in 1881. [43]
PLA was firstly obtained in 1845 by Pelouze, which condensed lactic acid by distillation of water.
[44, 45] However, because each step of polymerization forms water that degrades the polymer that is
Chapter 1 - Introduction
10 Artur M. Pinto – Jan 2017
being produced, and no method to remove it was known by then, only low molecular weight PLA
was obtained, which had few or no commercial interest. [46] For that reason, for almost a century,
research on PLA was focused in trying to produce a polymer with high molecular weight by a
method with industrial applicability. [45] The most widely used method to obtain PLA, ring-
opening polymerization (ROP) of lactide, was first demonstrated by Carothers in 1932, but high
molecular weights were not obtained until in 1954, when the purification techniques of lactide
were developed by Dupont. [44, 46, 47] Due to the high cost of high molecular weight PLA
production, its use was limited to the biomedical field, as for example in the development of
sutures, implants, and drug delivery systems. In 1990s, Cargill Inc. found a commercially viable
lactide ring opening reaction and, in 1997, Cargill Dow LLC was formed between Cargill Inc. and
The Dow Chemical Company, beginning to significant commercialize high molecular weight
PLA under the trade name NatureWorks™. [44, 45, 47] Due to its suitable mechanical properties and
biodegradability, PLA has been regarded as a promising material to replace non-degradable oil-
based polymers. For that reason, it has been used to produce coatings, flexible packaging films,
rigid packaging containers, cold drink cups, bottles, and injection- and extrusion-moulds, textiles,
automotive materials, amongst others. [44]
Despite the existence of the abovementioned early research on PLA’s medical applications, it was
only after the year 2000, with the beginning of PLA’s widespread commercialization, that the
outputs of the research on this field increased considerably, as can be observed from Figure 1.4.
Several PLA-based products are now approved for biomedical applications and contact with body
fluids by Food and Drug Administration (FDA). This polymer has several applications in
bioengineering, like the production of bioresorbable artificial ligaments, hernia repair meshes,
scaffolds, screws, surgical plates, and suture yarns. PLA can also be used in the production of
drug delivery systems, and in the packaging of pharmaceutical products. To make this material
more effective in several applications, namely orthopaedic, some properties can be improved,
being mechanical performance usually the most relevant. Approaches like adjustment of
crystallinity, incorporation of plasticizers, blends with other polymers and addition of nanofillers
have been tested. Reinforcement with small amounts of nanofillers is an interesting option
because it allows improvement of target properties without changing PLA’s main characteristics.
[48, 49] More detailed information on the subject can be found on Chapters 5-8.
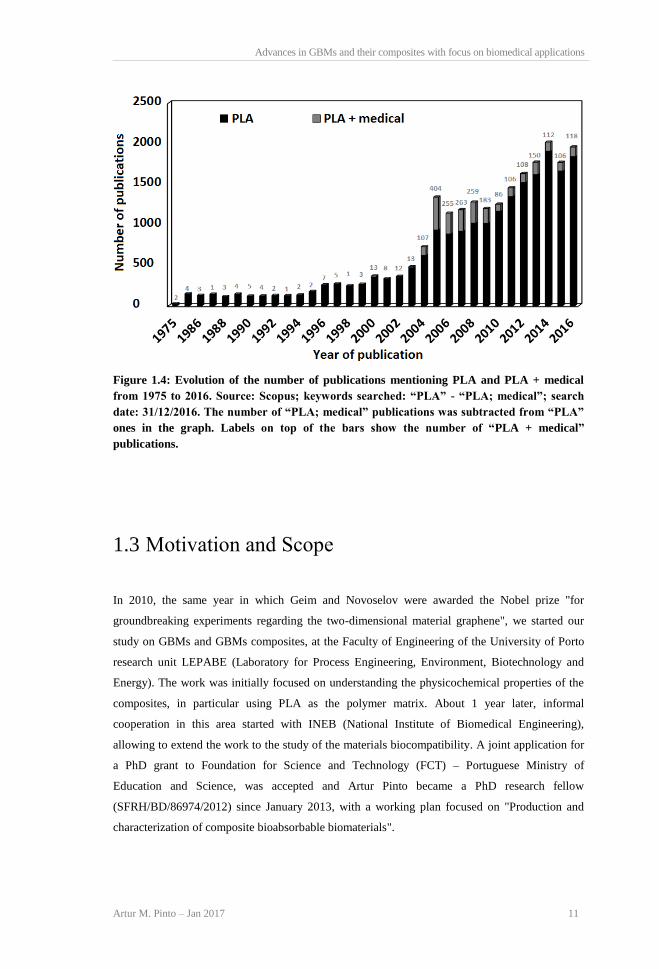
Advances in GBMs and their composites with focus on biomedical applications
Artur M. Pinto – Jan 2017 11
Figure 1.4: Evolution of the number of publications mentioning PLA and PLA + medical
from 1975 to 2016. Source: Scopus; keywords searched: “PLA” - “PLA; medical”; search
date: 31/12/2016. The number of “PLA; medical” publications was subtracted from “PLA”
ones in the graph. Labels on top of the bars show the number of “PLA + medical”
publications.
1.3 Motivation and Scope
In 2010, the same year in which Geim and Novoselov were awarded the Nobel prize "for
groundbreaking experiments regarding the two-dimensional material graphene", we started our
study on GBMs and GBMs composites, at the Faculty of Engineering of the University of Porto
research unit LEPABE (Laboratory for Process Engineering, Environment, Biotechnology and
Energy). The work was initially focused on understanding the physicochemical properties of the
composites, in particular using PLA as the polymer matrix. About 1 year later, informal
cooperation in this area started with INEB (National Institute of Biomedical Engineering),
allowing to extend the work to the study of the materials biocompatibility. A joint application for
a PhD grant to Foundation for Science and Technology (FCT) – Portuguese Ministry of
Education and Science, was accepted and Artur Pinto became a PhD research fellow
(SFRH/BD/86974/2012) since January 2013, with a working plan focused on "Production and
characterization of composite bioabsorbable biomaterials".

Chapter 1 - Introduction
12 Artur M. Pinto – Jan 2017
When this PhD work started, little information was available regarding GBMs and
GBMs/composites biocompatibility. However, observing the abovementioned recent findings on
graphene production methods, properties and potential applications, and early investments of
several companies on the field, there was no doubt that soon GBMs would play a key role on state
of the art technology in the most diverse fields.
Within the scope of an on-going research project (PTDC/EME-PME/114808/2009), led by prof.
Rui Guedes (FEUP), which goal was the production of bioabsorbable artificial ligaments, PLA
was being studied as a biomaterial, but its excessive fatigue/creep that leads to laxity was a
problem. [50] Previously, the base knowledge from work developed at LEPABE on GBMs for
different applications, and on polymer/nanofillers composites, set the roots for preliminary testing
of GBMs as fillers to improve the properties of PLA. These studies were regarded with broad
scope due to this biodegradable polymer having several potential applications (see above). Results
revealed that PLA performance was improved with incorporation of GBMs, namely in terms of
mechanical, thermal and gas permeation properties. [51] Thus, our previously acquired knowledge
on the potential of GBMs as fillers for PLA further strengthened the decision to continue working
with these fillers to reinforce PLA for biomedical applications.
The lack of knowledge regarding GBMs biocompatibility, and reports on the toxicity of other
nanomaterials, [52-54] including the most similar known structures, carbon nanotubes, [55, 56]
motivated the study of GBMs biocompatibility, both when dispersed in culture media, to allow
free contact with cells, and when integrated in a PLA matrix, to assure the safety of the
biocomposite and its viability for biomedical applications.
For those reasons, this research was focused on developing original work that could contribute
with pertinent advancements on the field. It started with the production and characterization of
PLA/GBMs composites, whose methods were further explored and improved, in parallel with the
characterization of GBMs biological properties when dispersed in liquid media, and the effect of
their morphology, degree of oxidation, and surface modification with polymers. This work is
presented in this dissertation, whose outline can be found below.
1.4 Dissertation Outline
This thesis is divided into 8 chapters. Chapter 1 is the present introduction, Chapters 2-4 and 6-8
are based on articles published in peer-reviewed international indexed journals, and Chapter 5 is
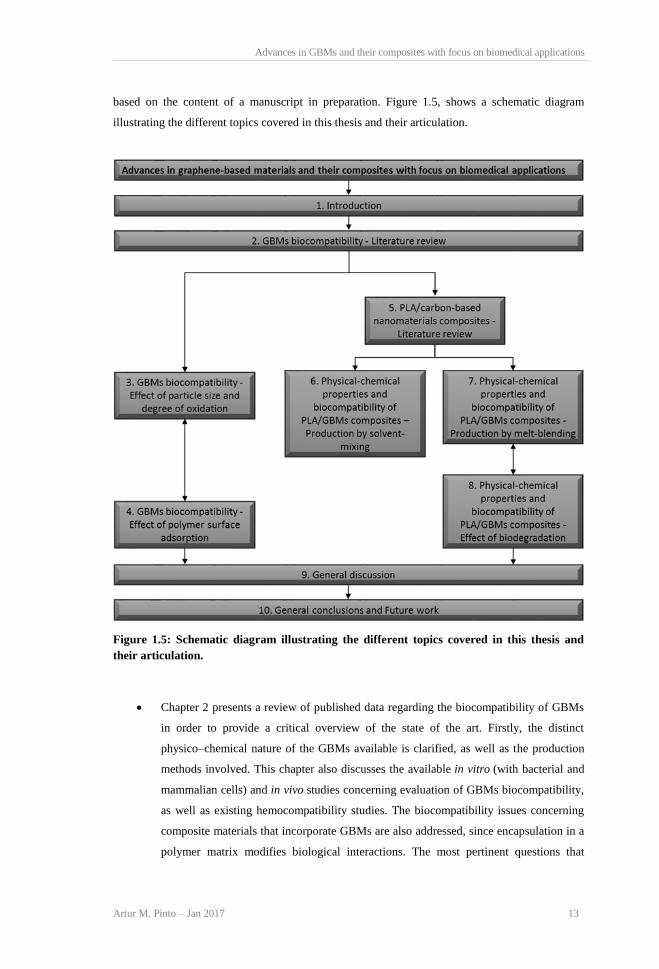
Advances in GBMs and their composites with focus on biomedical applications
Artur M. Pinto – Jan 2017 13
based on the content of a manuscript in preparation. Figure 1.5, shows a schematic diagram
illustrating the different topics covered in this thesis and their articulation.
Figure 1.5: Schematic diagram illustrating the different topics covered in this thesis and
their articulation.
• Chapter 2 presents a review of published data regarding the biocompatibility of GBMs
in order to provide a critical overview of the state of the art. Firstly, the distinct
physico–chemical nature of the GBMs available is clarified, as well as the production
methods involved. This chapter also discusses the available in vitro (with bacterial and
mammalian cells) and in vivo studies concerning evaluation of GBMs biocompatibility,
as well as existing hemocompatibility studies. The biocompatibility issues concerning
composite materials that incorporate GBMs are also addressed, since encapsulation in a
polymer matrix modifies biological interactions. The most pertinent questions that
Chapter 1 - Introduction
14 Artur M. Pinto – Jan 2017
should be addressed in the scope of this work and regarding future works on the field
are also highlighted.
• Information gathered on Chapter 2 shows that GBMs have recognized potential for
biomedical applications, but also that different production methods and treatments
originate divergent biocompatibility. For that reason, Chapter 3 reports the study of two
commercially available graphene nanoplatelets (GNP), differing in platelet size, GNP-C
(with 1–2 μm) and GNP-M (with 5 μm). Also, GNP-M was oxidized in different extents
so that an in vitro study of the effect of oxidation and size on biocompatibility could be
made.
• Chapter 4 reports further manipulation of GNP biocompatibility, by adsorbing different
polymers onto its surface. Graphene nanoplatelets (GNP-C) were modified with
poly(vinyl alcohol), hydroxyethyl cellulose, polyethylene glycol, poly(vinyl
pyrrolidone), and glycosaminoglycans (chondroitin, glucosamine, and hyaluronic acid).
The obtained materials were characterized in terms of physicochemical properties and
their in vitro biocompatibility is studied.
• Chapter 5 reviews existing information on PLA reinforced with two types of carbon-
based nanofillers (CBNs): carbon nanotubes (CNTs) and graphene-based materials
(GBMs). It describes the composites production methods, and the effects of CBNs on
PLA properties, namely mechanical, thermal, electrical and biological properties.
• Chapter 6 presents the production, by solvent casting followed by doctor blading, of
thin PLA films and composite PLA films incorporating two GBMs – graphene oxide
(GO) and GNP-M. These films were characterized regarding not only biocompatibility,
but also mechanical performance, surface topography, chemistry, and wettability.
Studies on platelet adhesion and activation on PLA and PLA/GBMs films surface are
also presented.
• Chapter 7 explores a solvent free method (melt blending) to incorporate different
loadings of GNP-C (0.1–0.5 wt%) in PLA. The effect of varying mixing time and
mixing intensity is reported and the best conditions identified. An analysis of the

Advances in GBMs and their composites with focus on biomedical applications
Artur M. Pinto – Jan 2017 15
physical-chemical properties, with focus on mechanical performance is presented, along
with the study of the PLA and PLA/GNP-C composites in vitro biocompatibility.
• Chapter 8 complements the work presented in chapter 7. It presents a study on the
hydrolytic degradation along 6 months, in phosphate-buffered saline at 37 °C, of
PLA/GNP-C and PLA/GNP-M composites produced by melt-blending at 0.25 wt.%
loading. Physico-chemical characterization is performed before and after degradation,
and biocompatibility of the degradation products tested in vitro.
• Finally, chapter 9 and 10 present a brief general discussion of the most relevant results,
in the light of the most recently available literature reports, and the general conclusions
withdrawn from the work presented in this thesis. Also, ongoing, and future work is
presented and proposed.

Chapter 1 - Introduction
16 Artur M. Pinto – Jan 2017
References
1. B.D. Ratner, A.S. Hoffman, F. Schoen, J. Lemons, Biomaterials Science: an
introduction to materials in medicine, third ed., Academic Press, 2012.
2. G. Binyamin, B.M. Shafi, C.M. Mery, Biomaterials: a primer for surgeons, Semin
Pediatr Surg 15 (2006) 276-83.
3. H.F. Hildebrand, Biomaterials – a history of 7000 years, BioNanoMaterials 14 (2013)
119-133.
4. N. Huebsch, D.J. Mooney, Inspiration and application in the evolution of biomaterials,
Nature 462 (2009) 426-32.
5. P.P.G. Nitesh R. Patel, A Review on Biomaterials: Scope, Applications & Human
Anatomy Significance, IJETAE 2 (2012) 91-101.
6. E.W. Cudger, Stitching wounds with the mandibles of ants and beetles, JAMA 84
(1925) 1861-2865.
7. J.Y. Wong, J.D. Bronzino, D.R. Peterson, Biomaterials: Principles and Practices, CRC
Press, 2012.
8. B.D. Ratner, The Biocompatibility Manifesto: Biocompatibility for the Twenty-first
Century, J Cardiovasc Transl 4 (2011) 523-527.
9. N. Huebsch, D.J. Mooney, Inspiration and application in the evolution of biomaterials,
Nature 462 (2009) 426-432.
10. National-Institutes-of-Health Consensus Development Conference Statement on the
Clinical-Applications of Biomaterials - November 1-3, 1982, Artif Organs 7 (1983)
260-265.
11. A.F. von Recum, M. Laberge, Educational-Goals for Biomaterials Science and
Engineering - Prospective View, J Appl Biomater 6 (1995) 137-144.
12. D.F. Williams, On the nature of biomaterials, Biomaterials 30 (2009) 5897-5909.
13. J. Black, Biological Performance of Materials: Fundamentals of Biocompatibility,
fourth ed., CRC Press, 2005.
14. Definitions in biomaterials: proceedings of a consensus conference of the European
Society for Biomaterials, Chester, England, March 3-5, 1986, Elsevier, 1987.
15. P. Ducheyne, Comprehensive Biomaterials, first ed., Elsevier, 2012.
16. Biomaterial-tissue interfaces: proceedings of the Ninth European Conference on
Biomaterials, Chester, U.K., September 9-11, 1991, Elsevier, 1992.
17. D.F. Williams, The Williams dictionary of biomaterials, Liverpool University Press,
1999.
18. D.F. Williams, On the mechanisms of biocompatibility, Biomaterials 29 (2008) 2941-
2953.
19. A.F. von Recum, Handbook Of Biomaterials Evaluation: Scientific, Technical And
Clinical Testing Of Implant Materials, second ed., CRC Press, 1998.
20. V. Singh, D. Joung, L. Zhai, S. Das, S.I. Khondaker, S. Seal, Graphene based materials:
Past, present and future, Prog Mater Sci 56 (2011) 1178-1271.
21. S. Madhuri, Graphene: An Introduction to the Fundamentals and Industrial
Applications, Wiley-Scrivener, 2015.
22. I.E.J. Boardman, N. G. L. Hammond, E. Sollberger, The Cambride Ancient History,
second ed., Cambridge University Press, 2008.
23. "Carbon." Chemicool Periodic Table. Chemicool.com. 25 July. 2014. Web. 12/30/2016.
24. M.E. Weeks, Discovery of the elements, fifth ed., Journal of chemical education, 1945.
25. A.-L. Lavoisier, Traité Élémentaire de Chimie, Paris, 1789.
26. C. Soldano, A. Mahmood, E. Dujardin, Production, properties and potential of
graphene, Carbon 48 (2010) 2127-2150.
Advances in GBMs and their composites with focus on biomedical applications
Artur M. Pinto – Jan 2017 17
27. S.K. Tiwari, V. Kumar, A. Huczko, R. Oraon, A. De Adhikari, G.C. Nayak, Magical
Allotropes of Carbon: Prospects and Applications, Crit Rev Solid State 41 (2016) 257-
317.
28. J. Robertson, Amorphous-Carbon, Adv Phys 35 (1986) 317-374.
29. D.R. Dreyer, R.S. Ruoff, C.W. Bielawski, From Conception to Realization: An
Historial Account of Graphene and Some Perspectives for Its Future, Angew Chem Int
Edit 49 (2010) 9336-9344.
30. X.Z.Z. Liu, Graphene: Energy Storage and Conversion Applications, CRC Press, 2014.
31. A.K. Geim, Graphene prehistory, Phys Scripta T146 (2012).
32. H.P. Boehm, R. Setton, E. Stumpp, Nomenclature and Terminology of Graphite-
Intercalation Compounds, Carbon 24 (1986) 241-245.
33. K.S. Novoselov, A.K. Geim, S.V. Morozov, D. Jiang, Y. Zhang, S.V. Dubonos, I.V.
Grigorieva, A.A. Firsov, Electric field effect in atomically thin carbon films, Science
306 (2004) 666-669.
34. Y.W. Zhu, S. Murali, W.W. Cai, X.S. Li, J.W. Suk, J.R. Potts, R.S. Ruoff, Graphene
and Graphene Oxide: Synthesis, Properties, and Applications, Adv Mater 22 (2010)
3906-3924.
35. A.H. Castro Neto, F. Guinea, N.M.R. Peres, K.S. Novoselov, A.K. Geim, The
electronic properties of graphene, Rev Mod Phys 81 (2009) 109-162.
36. S. Stankovich, D.A. Dikin, G.H.B. Dommett, K.M. Kohlhaas, E.J. Zimney, E.A. Stach,
R.D. Piner, S.T. Nguyen, R.S. Ruoff, Graphene-based composite materials, Nature 442
(2006) 282-286.
37. H. Kim, A.A. Abdala, C.W. Macosko, Graphene/polymer nanocomposites,
Macromolecules 43(16) (2010) 6515-6530.
38. D.R. Dreyer, S. Park, C.W. Bielawski, R.S. Ruoff, The chemistry of graphene oxide,
Chemical Society Reviews 39 (2010) 228-240.
39. "The 2010 Nobel Prize in Physics - Press Release". Nobelprize.org. Nobel Media AB
2014. Web. 31 Dec 2016.
<http://www.nobelprize.org/nobel_prizes/physics/laureates/2010/press.html>.
40. H. Chen, M.B. Muller, K.J. Gilmore, G.G. Wallace, D. Li, Mechanically strong,
electrically conductive, and biocompatible graphene paper, Adv Mater 20 (2008) 3557-
3561.
41. A.M. Pinto, I.C. Goncalves, F.D. Magalhaes, Graphene-based materials
biocompatibility: A review, Colloid Surface B 111 (2013) 188-202.
42. K. Wang, J. Ruan, H. Song, J. Zhang, Y. Wo, S. Guo, D. Cui, Biocompatibility of
Graphene Oxide, Nanoscale Res Lett 6 (2011) 8.
43. D. Garlotta, A literature review of poly(lactic acid), J Polym Environ 9 (2001) 63-84.
44. M.P.A. Jiménez, R. Ruseckaite, Poly(lactic acid) Science and Technology: Processing,
Properties, Additives and Applications, Royal Society of Chemistry, 2014.
45. A. Steinbuchel, Biopolymers, John Wiley and Sons, 2004.
46. X.A. Pang, X.L. Zhuang, Z.H. Tang, X.S. Chen, Polylactic acid (PLA): Research,
development and industrialization, Biotechnol J 5 (2010) 1125-1136.
47. R. Auras, L.-T. Lim, S.E. Selke, H. Tsuji, Poly(Lactic Acid): Synthesis, Structures,
Properties, Processing, and Applications, John Wiley and Sons, 2010.
48. A.M. Pinto, S. Moreira, I.C. Goncalves, F.M. Gama, A.M. Mendes, F.D. Magalhaes,
Biocompatibility of poly(lactic acid) with incorporated graphene-based materials,
Colloid Surface B 104 (2013) 229-238.
49. A.M. Pinto, C. Gonçalves, I.C. Gonçalves, F.D. Magalhães, Effect of biodegradation on
thermo-mechanical properties and biocompatibility of poly(lactic acid)/graphene
nanoplatelets composites, Eur Polym J 85 (2016) 431–444.
50. A.C. Vieira, R.M. Guedes, A.T. Marques, Development of ligament tissue
biodegradable devices: A review, J Biomech 42 (2009) 2421-2430.

Chapter 1 - Introduction
18 Artur M. Pinto – Jan 2017
51. A.M. Pinto, J. Cabral, D.A.P. Tanaka, A.M. Mendes, F.D. Magalhães, Effect of
incorporation of graphene oxide and graphene nanoplatelets on mechanical and gas
permeability properties of poly(lactic acid) films, Polym Int 62 (2013) 33-40.
52. C.M. Sayes, D.B. Warheit, Characterization of nanomaterials for toxicity assessment,
Wires Nanomed Nanobi 1 (2009) 660-670.
53. V.C. Sanchez, J.R. Pietruska, N.R. Miselis, R.H. Hurt, A.B. Kane, Biopersistence and
potential adverse health impacts of fibrous nanomaterials: what have we learned from
asbestos?, Wires Nanomed Nanobi 1 (2009) 511-529.
54. G. Bystrzejewska-Piotrowska, J. Golimowski, P.L. Urban, Nanoparticles: Their
potential toxicity, waste and environmental management, Waste Manage 29 (2009)
2587-2595.
55. J.P. Kaiser, H.F. Krug, P. Wick, Nanomaterial cell interactions: how do carbon
nanotubes affect cell physiology?, Nanomedicine-Uk 4 (2009) 57-63.
56. P.A. Tran, L.J. Zhang, T.J. Webster, Carbon nanofibers and carbon nanotubes in
regenerative medicine, Adv Drug Deliver Rev 61 (2009) 1097-1114.
Chapter 2
Artur M. Pinto – Jan 2017 19
Chapter 2
GBMs biocompatibility:
Literature review
This chapter was based in the following published paper:

GBMs biocompatibility – literature review
20 Artur M. Pinto – Jan 2017

Chapter 2
Artur M. Pinto – Jan 2017 21
2 GBMS BIOCOMPATIBILITY – LITERATURE
REVIEW
2.1 Scope
The present chapter focuses on graphene-based materials (GBMs) potential applications in
biomedical engineering and biotechnology. It presents a review of published data in order to
provide a critical overview of the state of the art. Firstly, the distinct physical–chemical nature of
the GBMs available is clarified, as well as the production methods involved. Then it discusses the
available in vitro (with bacterial and mammalian cells) and in vivo studies concerning evaluation
of GBMs biocompatibility, as well as existing hemocompatibility studies. The biocompatibility
issues concerning composite materials that incorporate GBMs are addressed in a separate section,
since encapsulation in a polymer matrix modifies biological interactions. The most pertinent
questions that should be addressed in future works are also emphasized.
2.2 State of the art
2.2.1 Introduction
Graphene, the elementary structure of graphite, is an atomically thick sheet composed of sp2
carbon atoms arranged in a flat honeycomb structure. It possesses very high mechanical strength,
surface area and thermal and electrical conductivity. [1-9] However, graphene is hydrophobic and,
consequently, stable dispersions in polar solvents can only be obtained with addition of proper
surfactants. [10, 11] Graphene oxide (GO) is similar to graphene, but presents oxygen-containing
functional groups. [12-17] The presence of these polar and reactive groups reduces the thermal
stability of the nanomaterial, but may be important to promote interaction and compatibility with
polar solvents or with a particular polymer matrix. [1, 2, 18-20] Both graphene and GO can be
modified in order to obtain other graphene-based materials (GBMs) with suitable properties to

GBMs biocompatibility – literature review
22 Artur M. Pinto – Jan 2017
specific applications. [21-28] Some examples of chemical modifications, which will be mentioned
in this review, are shown in Figure 2.1.
Figure 2.1: Simplified scheme showing graphene and graphene oxide structures and some
examples of functionalization for both materials.
In the last years there has been a surge in research work on GBMs, with applications in fields as
diverse as nanoelectronics [29-32], energy technology [33, 34], sensors [35, 36], and composite
materials [37-39]. Several biomedical applications have also been studied, like
biosensing/bioimaging [21], drug delivery [18], cancer photothermal therapy [40], and antibacterial
materials [18]. Furthermore, approaches for applications in biomedical engineering [41, 42],
regenerative medicine [41, 42], and biotechnology [43] are under study. Some examples of the
reported advantages of GBMs are: (a) improvement of biomaterials mechanical/electrical
properties, (b) increase of cellular attachment and growth at biomaterials surface, and (c)
production of more efficient biosensors.
In view of the growing interest in using GBMs in medical applications, the issue of
biocompatibility has gained relevance. This is evidenced in Figure 1.3, which shows the evolution
in the number of scientific publications mentioning the term “graphene biocompatibility” between
2004 and 2016. It must be noted that existing information on other carbon-based materials is not

Chapter 2
Artur M. Pinto – Jan 2017 23
necessarily valid for GBMs, due to differences in production methodologies, particle morphology,
and surface chemistry. For instance, contrary to carbon nanotubes, metal catalysis is not usually
employed in the synthesis of GBMs, thus, cytotoxicity and inflammation caused by residual
metals can be avoided. [44, 45]
GBMs biocompatibility depends on their intrinsic physical–chemical properties. These are
dependent on the raw materials and production methods used. Sometimes GBMs obtained from
different sources and/or methods are described using identical designations. [1, 2]
Table 2.1: GBMs and respective production methods.
Material Production Refs.
Graphite (Gt)
Raw material (commercial product) usually from
different suppliers and with different characteristics (e.g. size, purity)
[54-56, 60-64]
Graphite oxide (GtO) Modified Hummers Method (MHM) [54]
Graphene oxide (GO)
MHM
[54, 55, 60, 61,
63-69, 73, 74, 77-79, 85]
MHM + 7 days dialysis [56]
Refluxing with sulfuric and nitric acid mixture [86]
Ultrasonically separated from graphite and modified by
chloroacetic acid [87]
Ultra small (nGO) MHM + functionalization with six-arm branched PEG
– poly(ethylene glycol) (10 kDa) [80]
(G2xO) Doubly-oxidized
graphene oxide GO lyophilization + Modified Hummers method [64]
GO–Pluronic hydrogel
GO 0.5 wt.% solution (Angstrom Materials, OH, USA)
(46 wt.% C and O)
GO and Pluronic solutions were refrigerated to make
sol-state solutions placed at 37 °C to make hydrogels
[82]
GO functionalized with carboxylic groups (GO-COOH)
(information only available in Chinese) [87]
PEGylated nano-graphene
oxide (NGO-SS-mPEG)
MHM + conjugation of amino-terminated PEG to
carboxylated NGO sheets via a disulfide bond [70]
Reduced graphene oxide (rGO) MHM + hydrazine reduction (Hr) [54, 55]
GO nanosheets functionalized with fetal bovine serum (FBS)
MHM + 10% FBS in cell culture medium (adsorption by electrostatic and hydrophobic interactions)
[73]
Reduced graphene oxide
(RGO)
GO rapid thermal heating (>2000 °C min−1, to
1100 °C) [85, 86]
RGO-PEG GO + Hr + PEG-grafted poly (maleic anhydride-alt-1-
octadecene) (C18PMHePEG) non-covalent
functionalization
[80]
nRGO-PEG nGO + Hr + (C18PMHePEG) non-covalent [80]

GBMs biocompatibility – literature review
24 Artur M. Pinto – Jan 2017
For this reason, it is often difficult to extract general conclusions from existing literature. The
present work presents a review of the literature available until the current date, regarding the
evaluation of GBMs biocompatibility, taking care in distinguishing the particular types of
functionalization
Polydopamine adhered RGO
(pRGO)
GO and dopamine hydrochloride were dispersed in PBS by sonication and stirred at 60 °C for 12 h,
followed by centrifugation and dialysis
[74]
Heparin/bovine serum albumin grafted pRGO (Hep/BSA-g-
pRGO)
pRGO was dispersed in PBS by sonication and pristine heparin or BSA was added and stirred at 25 °C, 24 h,
followed by centrifugation and dialysis
[80]
1-Naphthalenesulfonate
functionalized rGO (NA-rGO) MHM + NA direct sonication + Hr [57]
Brilliant blue functionalized
rGO (BB-rGO) MHM + BB direct sonication + Hr [58]
Graphene sheets (GS) Hydrothermal processing of GO in deionized water
(pH ≈ 3) [61]
Pristine graphene (p-G) Chemical oxidation of graphite + thermal exfoliation [62]
Arc-Discharge Method [84] [83]
COOH-functionalized graphene
(f-G) Chemical oxidation of p-G [62]
Functionalized graphene (f-G) Chemical oxidation of p-G [83]
Graphene dispersed in Pluronic
aqueous solution (G-Pluronic)
Natural graphite flakes ultrasonication in Pluronic
aqueous solution followed by ultracentrifugation [78]
Aggregated graphene (aG) Flocculation with isopropyl alcohol 4:1 of G-Pluronic [78]
Magnetic multifunctional graphene (MFG)
Magnetic graphene (MG) obtained by GO and ferrocene microwave irradiation
MG modified with poly(acrylic acid) and
fluorescein o-methacrylate (sonication + microwaves)
[66]
(PEG-NGS) Poly(ethylene
glycol) functionalized nanographene sheets
MHM + conjugation via amide formation with amine
terminated PEG [76]
Amine-modified graphene (G-NH2)
GO stirring in SOCl2 and dimethylformamide (DMF),
dispersing the product in sodium azide and DMF (40 h,
room temperature)
[86]
Methanol derived graphene (MDG)
Sodium hydroxide and methanol supersaturated
solution
heating (under flow of argon)
[59]
(GNP) Graphene nanoplatelets Graphite rapid microwave heating + ultrasonic
treatment [63]
Graphene oxide nanoplatelets
(GONP) MHM [72]
Polyethylenimine-grafted graphene nanoribbon (PEI-g-
GNR)
Unzipping of multiwalled carbon nanotubes by a
MHM [71]

Chapter 2
Artur M. Pinto – Jan 2017 25
materials tested. Table 2.1 congregates the GBMs types mentioned along the text, together with a
succinct description of the corresponding production methods.
This review focuses on in vitro studies performed with bacterial and mammalian cell models, and
on in vivo studies performed with animals and embryos. The issue of GBMs hemocompatibility is
also analyzed. Finally, the existing studies on biocompatibility of GBMs incorporated in
composite materials are also presented.
It is relevant to mention that part of the available data regarding GBMs toxicity (mostly in vitro)
is obtained from studies on its potential use as vehicle in drug delivery. In some cases the authors
characterize the toxicity of GBMs in conjugation with the drug. [46-50] These studies were not
included in this review, due to the impossibility in isolating the biological effect of the GBM
material alone.
Some studies have been recently published concerning the effect of GBMs on cell signaling. [51-
53] However, this subject is not within the scope of this work. We believe that due to the
complexity of this topic, it should be reviewed at a later date, when more data are available.
2.2.2 In vitro biocompatibility studies
2.2.2.1 Bacterial cells
The effect of GBMs on bacteria structure, metabolism and viability has been shown to depend on
the materials’ concentration, time of exposure, and physical–chemical properties, as well as on the
characteristics of bacteria used in the tests. [54-59] Table 2.2 presents the main results of current
available studies regarding the effect of GBMs on bacterial cells. Most works report bacterial
viability decrease after exposure to GBMs. [54-59] Moreover, viability was observed to decrease
with increase of contact time [54] and GBMs concentration. [54, 55, 59] Some authors consider that
viability decrease is associated with GBMs causing physical damage on bacterial membranes
upon direct contact, resulting in the release of intracellular contents. This rupture is originated by
the blade-like action of low thickness GBMs (a few nanometers) having sharp edges (like GO,
rGO [54, 55], and BB-rGO [58]).

GBMs biocompatibility – literature review
26 Artur M. Pinto – Jan 2017
Table 2.2: Effect of GBMs on bacteria viability and membrane integrity.
Ref Material Particle size Bacterial model Cell viability Membrane
damage
Liu et
al. [54]
GtO Length
(l) ≈ 6.28 μm
Escherichia
coli (E. coli)
GtO ≈ 85%, Gt ≈ 74%, rGO ≈ 54%, GO ≈ 31%
(80 μg mL−1, 2 h)
Decreases with incubation time (results not shown),
concentration increase and
size decrease
Not studied (n/s)
Gt l ≈ 6.87 μm n/s
rGO l ≈ 2.75 μm Yes
GO Thickness
(t) <≈0.31 μm Yes
Hu et
al. [55]
GO t ≈ 1.1 nm E. coli DH5α ≈70% (20 μg mL−1, 2 h)
≈13% (85 μg mL−1, 2 h) Yes
rGO t ≈ 1 nm
≈24% (85 μg mL−1, 2 h)
Ruiz et
al. [56] GO n/s E. coli
Cell proliferation: 130% (25 μg mL−1, 16 h)
n/s
Cai et
al. [57] NA-rGO t ≈ 0.5 nm
E. coli ≈7.5% (≈100 μg mL−1, 6 h)
n/s Staphylococcus aureus (S. aureus)
≈11.2% (≈100 μg mL−1, 6 h)
Cai et
al. [58] BB-rGO n/s
E. coli ≈50% (1.2 μg mL−1, 24 h) Yes
S. aureus ≈50% (0.8 μg mL−1, 24 h)
Pandey
et al. [59] MDG t ≈ 3.5 nm E. coli
≈70% (20 μg mL−1, 2 h) ≈55% (40 μg mL−1, 2 h) n/s
Additionally, Liu et al. [54] observed GBMs-induced oxidative stress, in terms of strong time and
concentration dependent oxidization capacity toward glutathione (GSH), an endogenous
antioxidant. They also found that when in direct contact with cells, reduced graphene oxide (rGO)
and graphite (Gt) originate more intense oxidative stress than GO (graphene oxide) and GtO
(graphite oxide). This is explained taking into account that the reduced forms of graphene are
good electrical conductors. These authors also asserted that GBMs containing higher density of
functional groups, and that are smaller in size, have more chances to interact with bacterial cells.
This results in deposition on cellular surfaces, leading to more pronounced decreases in viability.
Contrasting to what is suggested in most studies, Ruiz et al. [56] reported increase of E. coli
proliferation after exposure to GO. The GO used was dialyzed during 7 days after being produced
by modified Hummer's method. Increase in proliferation was attributed to GO acting as a support
for bacterial growth.
It must be noted that purification of the materials used is essential to assure removal of toxic
contaminants. Information on the procedures adopted in this context is often absent from
published works. This may mask the effect of contaminations on the results.

Chapter 2
Artur M. Pinto – Jan 2017 27
2.2.2.2 Mammalian cells
Table 2.3 presents the main results of currently available studies regarding the effect of GBMs on
mammalian cell structure, metabolism and viability. Most studies report cell viability decreases
inferior to 20% after exposure to GBMs concentrations around 10 μg mL−1 during 24 h or longer
[57, 60-62, 64, 66, 69, 71-74]. Moreover, most of the studies that considered both the effects of contact
time [60, 66, 73] and GBMs concentration [57, 60-64, 66, 68, 69, 72-74] conclude that increasing these
variables leads to a decrease in cell viability.
Hydrophilic and small GBMs usually penetrate the cell membrane [60, 62, 71-73]. After
internalization, these materials can lead to cytoplasmatic [60, 73], perinuclear [60, 62] or nuclear
accumulation [60]. On the other hand, hydrophobic materials are hindered from penetrating into
the cell membrane due to repulsive interactions or to presenting large hydrodynamic diameters,
since they tend to agglomerate in physiological medium. [62] Despite not entering the cell,
hydrophobic GBMs have been reported to cause membrane deformation, destabilize the
cytoskeleton, and trigger intracellular stress, which may lead to apoptosis. [62] Hydrophilic
materials may originate similar effects [57, 60], but no relevant toxicity was observed in some
cases, even after internalization [62, 71].
It has been shown that both hydrophobic [61] and hydrophilic [66] GBMs generate reactive oxygen
species (ROS). This is one of the major factors leading to lipid peroxidation, DNA damage, and
caspase activation followed by chromatin condensation which eventually leads to cell death via
apoptosis.
Additional studies are needed to clarify the effect of the GBMs degree of oxidation on
biocompatibility. The tendency of hydrophilic (oxidized) materials to penetrate cell membranes
can be counteracted by physical or chemical functionalization with polymers, in order to increase
hydrophobicity. As abovementioned, this sort of modification might improve GBMs
biocompatibility. [71, 74] This issue is discussed further in Section 2.2.5.
Peng et al. [65] observed that a small decrease in cell viability caused by GO was reversed by
incubation with fresh medium. Further studies on the fate of GBMs after cell uptake, combined
with the resultant long term effects of the materials internalization, should be performed. An
interesting aspect that is lacking from existing studies has to do with the effect of particle size
(length and thickness) on the biocompatibility of GBMs with similar chemical properties. In
addition, there are no references in the literature regarding the effect of GBMs surface charge on
biocompatibility. These have been shown to be relevant issues for cell adhesion and proliferation
on biomaterial surfaces. [75]
GBMs biocompatibility – literature review
28 Artur M. Pinto – Jan 2017
Several authors [57, 64, 65-71] employ cancer cell lines to evaluate GBMs cytotoxicity. It is observed
that in most cases cell viability decrease is lower for this type of cells (Table 2.3). This might
occur due to cancer cell lines being more resistant to possible damages or metabolic impairment.
This fact may imply some restraint regarding the significance of the obtained results and of the
conclusions that may be withdrawn. Furthermore, studies by Rana et al. [68] revealed that GO
caused different cell viability decreases in two different cancer cell models, for equal
concentrations. Biocompatibility results may therefore be biased by the cell line used. Care should
be taken in evaluating the suitability of the cell models.
2.2.3 In vivo biocompatibility studies
There are few in vivo studies concerning the biocompatibility of GBMs (Table 2.4). In the works
available, radioactive labels are usually used to track GBMs in vivo and study its distribution in
the body. Histological analysis of the tissues of most relevant organs is often performed, and in
some cases inflammatory cells and cytokine levels are evaluated. The in vivo effect of GBMs was
observed to depend on their physical–chemical properties, concentration, exposure time,
administration route, and on the characteristics of the animals used in the assays [60, 66, 72, 76-82].
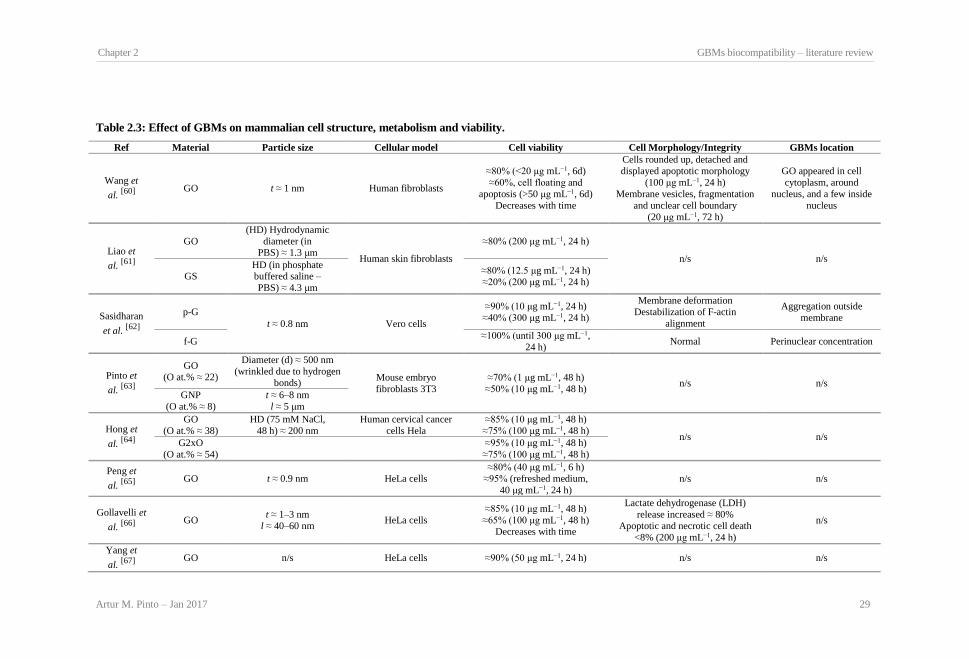
Chapter 2 GBMs biocompatibility – literature review
Artur M. Pinto – Jan 2017 29
Table 2.3: Effect of GBMs on mammalian cell structure, metabolism and viability.
Ref Material Particle size Cellular model Cell viability Cell Morphology/Integrity GBMs location
Wang et
al. [60]
GO t ≈ 1 nm Human fibroblasts
≈80% (<20 μg mL−1, 6d)
≈60%, cell floating and
apoptosis (>50 μg mL−1, 6d)
Decreases with time
Cells rounded up, detached and
displayed apoptotic morphology
(100 μg mL−1, 24 h)
Membrane vesicles, fragmentation
and unclear cell boundary
(20 μg mL−1, 72 h)
GO appeared in cell
cytoplasm, around
nucleus, and a few inside
nucleus
Liao et
al. [61]
GO
(HD) Hydrodynamic
diameter (in PBS) ≈ 1.3 μm
Human skin fibroblasts
≈80% (200 μg mL−1, 24 h)
n/s n/s
GS HD (in phosphate buffered saline –
PBS) ≈ 4.3 μm
≈80% (12.5 μg mL−1, 24 h)
≈20% (200 μg mL−1, 24 h)
Sasidharan
et al. [62]
p-G
t ≈ 0.8 nm Vero cells
≈90% (10 μg mL−1, 24 h)
≈40% (300 μg mL−1, 24 h)
Membrane deformation
Destabilization of F-actin
alignment
Aggregation outside
membrane
f-G ≈100% (until 300 μg mL−1,
24 h) Normal Perinuclear concentration
Pinto et
al. [63]
GO
(O at.% ≈ 22)
Diameter (d) ≈ 500 nm
(wrinkled due to hydrogen
bonds) Mouse embryo
fibroblasts 3T3
≈70% (1 μg mL−1, 48 h)
≈50% (10 μg mL−1, 48 h) n/s n/s
GNP
(O at.% ≈ 8)
t ≈ 6–8 nm
l ≈ 5 μm
Hong et
al. [64]
GO
(O at.% ≈ 38)
HD (75 mM NaCl,
48 h) ≈ 200 nm
Human cervical cancer
cells Hela
≈85% (10 μg mL−1, 48 h)
≈75% (100 μg mL−1, 48 h) n/s n/s
G2xO
(O at.% ≈ 54)
≈95% (10 μg mL−1, 48 h)
≈75% (100 μg mL−1, 48 h)
Peng et
al. [65]
GO t ≈ 0.9 nm HeLa cells
≈80% (40 μg mL−1, 6 h)
≈95% (refreshed medium,
40 μg mL−1, 24 h)
n/s n/s
Gollavelli et
al. [66]
GO
t ≈ 1–3 nm
l ≈ 40–60 nm HeLa cells
≈85% (10 μg mL−1, 48 h)
≈65% (100 μg mL−1, 48 h)
Decreases with time
Lactate dehydrogenase (LDH)
release increased ≈ 80%
Apoptotic and necrotic cell death
<8% (200 μg mL−1, 24 h)
n/s
Yang et
al. [67]
GO n/s HeLa cells ≈90% (50 μg mL−1, 24 h) n/s n/s

Chapter 2 GBMs biocompatibility – literature review
30 Artur M. Pinto – Jan 2017
Rana et
al. [68]
GO t ≈ 1 nm
CEM
(human lymphoblastic
leukemia)
≈80% (10 μg mL−1, 5 d)
≈30% (400 μg mL−1, 5d) n/s n/s
MCF7-human breast
cancer ≈50% (10 μg mL−1, 5 d)
≈30% (400 μg mL−1, 5 d)
Yang et
al. [69]
GO
t ≈ 0.8–1 nm l < 200 nm
HeLa cells ≈100% (10 μg mL−1, 24 h) ≈80% (500 μg mL−1, 24 h)
n/s n/s
Cai et
al. [57]
NA-rGO t ≈ 0.5 nm CNE1 cells
≈90% (10 μg mL−1, 24 h)
≈80% (100 μg mL−1, 24 h)
Cell shape became
irregular (500 μg mL−1, 24 h) n/s
Wen et
al. [70]
NGO-SS-
mPEG
t ≈ 0.87 nm
d ≈ 220 nm HeLa cells
>100% (50–1000 μg mL−1,
24 h) n/s n/s
Dong et
al. [71]
PEI-g-GNR l ≈ 220–400 nm HeLa cells >95% (24 μg mL−1, 12 h) Apoptotic ratio = 8.8% Enter the cells
Zhan et
al. [72]
GONP (labeled
with 99mT)
Irregular shape (big particle size ≈200 nm)
ARPE-19 cells (human retinal pigment
epithelium)
>80% (10 μg mL−1, 72 h) >60% (100 μg mL−1, 72 h)
LDH release
<5% (100 μg mL−1, 72 h) and decreases with time
Apoptosis rate ≈ 1.5% (similar to
control)
Enter the cells (until
50 μg mL−1, ≈50 μg mL−1is too
aggregated)
Hu et
al. [73]
GO
nanosheets t ≈ 1 nm
A549 (adenocarcinomic
human alveolar basal
epithelial)
≈80%, (20 μg mL−1, 24 h)
≈50% (100 μg mL−1, 24 h)
Decreases with time
Destroys cell membrane and
directly induces cell death
Predominantly inside cell
membrane
GO
nanosheets-
FBS
Increased ≈ 30% comparing to
GO nanosheets (20 and
100 μg mL−1, 24 h)
FBS formed a protein corona on
GO nanosheets surface
preventing direct interaction with the cells
Normal cells Few inside cell
membrane
Cheng et
al. [74]
GO t ≈ 1.038 nm
d (PBS) ≈ 1429.1 nm
HUVECS (human umbilical vein
endothelial cells)
≈95%, (20 μg mL−1, 24 h) ≈60% (100 μg mL−1, 24 h)
n/s n/s
pRGO t ≈ 1 nm
d (PBS) ≈ 1596.8 nm
≈100%, (20 μg mL−1, 24 h)
≈70% (100 μg mL−1, 24 h) Normal cells n/s
Hep-g-pRGO t ≈ 1 nm
d (PBS) ≈ 1241.5 nm
≈110%, (20 μg mL−1, 24 h)
≈95% (100 μg mL−1, 24 h) Normal cells n/s
BSA-g-pRGO t ≈ 1 nm
d (PBS) ≈ 1131.7 nm
≈105%, (20 μg mL−1, 24 h)
≈75% (100 μg mL−1, 24 h) Normal cells n/s

Chapter 2 GBMs biocompatibility – literature review
Artur M. Pinto – Jan 2017 31
Most studies report no occurrence of adult animal's death, even for GBMs doses up to 20 mg kg−1.
[76-82] However, Wang et al. [60] observed that almost half mice population died after intravenous
(i.v.) administration of GO. When administered by i.v. route, GBMs generally accumulate in MPS
(mononuclear phagocyte system) – mainly in liver and spleen – and in lung [60, 72, 76-78]. These
materials are reported to have mostly fecal elimination via bile when accumulated in MPS, and
renal elimination when particles have sufficiently small sizes [60, 76-78]. Small size GBMs (single
sheets with diameter of 10 nm or less) present t1/2 (elimination half-life) close to 0.4 h, while t1/2
for GBMs with larger sizes can be superior to 5 h. [76, 77] There is only one study that reports
possible long term degradation, using PEG-NGS (PEG-functionalized nanographene sheets). [76]
Some studies report dose and time dependent inflammation, usually in lung and liver, with cell
infiltration and in few cases fibrosis [60, 77, 78]. However, Yang et al. [76] did not observe
appreciable inflammation with PEG-NGS.
Yang et al. [80] observed that few hours after being administered by oral route, nGO-PEG, RGO-
PEG and nRGO-PEG were present in high quantities in stomach and intestine, but not in other
major organs. However, after 1 day only low levels were detected in the organs, and no trace was
detected after 1 week. Thus, these GBMs seem to be poorly adsorbed in gastrointestinal tract,
presenting fast excretion. Yan et al. [81] reported no clear clinical evidence of ocular changes
caused by GO intravitreal injection. When subcutaneously injected, a GO-Pluronic hydrogel
caused mild inflammation after 3 weeks, which reverted later [82]. Finally, Dutch et al. [78] tested
three different GBMs (GO, G-Pluronic – graphene dispersed in Pluronic aqueous solution, and aG
– aggregated graphene) by intratracheal administration. They observed that GO caused persistent
lung inflammation, which was attributed to its ability to increase the rate of mitochondrial
respiration, and the generation of reactive oxygen species in cells, activating inflammatory and
apoptotic pathways. Opposingly, mice treated with hydrophobic G-Pluronic presented no signs of
fibrosis. However, aG, which probably presented larger particle sizes, persisted in the medium or
small airways of the lung, and induced peribronchial inflammation and mild fibrosis. Li et al. [79]
also observed that GO caused acute lung injury and mild to severe fibrosis.
Gollavelli and Ling [66] evaluated the embryotoxicity of GO and MFG (magnetic multifunctional
graphene) injected in the pole region of Danio rerio and observed minute drop in survival
comparing to control. The authors also found that both GO and MFG distributed from head to tail,
despite being observed mainly in the yolk sac region, where they caused edema. Additionally,
mutations were observed, occurring probably due to interactions with some specific proteins and
biomolecules.

Chapter 2 GBMs biocompatibility – literature review
32 Artur M. Pinto – Jan 2017
Table 2.4: GBMs in vivo biocompatibility.
Ref Material Particle size Animal model Animals survival Toxicokinetics Histology
Wang et
al. [60]
GO t ≈ 1 nm
Kunming mice
(female, 28–
30 g, 4–5 weeks old)
100% (0.1 and 0.25 mg
per mouse)
66% (0.4 mg per mouse)
(deaths occurred: 1, 7d)
(i.v. administration)
Biodistribution: mainly to lungs, liver and
spleen Not present in brain
Few in kidney (probably excreted in bile)
Dose-dependent lung
inflammatory response
(neutrophils and foamy alveolar
macrophage)
After 7 d: lesions surrounded GO
After 30 d: Multifocal macrophage-containing
granulomas
GO in hepatic macrophage
phagosome
Yang et
al. [76]
PEG-NGS
(labeled
with 125I)
t ≈ 1 nm
l ≈ 10–30 nm
Balb/c mice
(female)
100%, no significant
body weight drop
(20 mg kg−1, 3–90 d)
(i.v. administration)
t1/2 ≈ 0.4 h (smaller particles) and 7 h
AUC0–∞ ≈ 4.6 mg min mL−1
Biodistribution: mainly accumulated on MPS
(liver and spleen)
Elimination: renal (small size – single sheets d < 10 nm), fecal via bile (accumulated in
MPS), possible long term degradation by
oxidative metabolic pathways
No obvious organ damage
Liver and spleen turned brown
(NGS accumulation) Reverted after 20 d
Zhang et
al. [77]
GO (labeled
with 188R)
t ≈ 1 nm
l = 10–800 nm
Kunming mice
100%, no body weight
drop (1 and 10 mg kg−1,
14 d)
(i.v. administration)
t1/2 ≈ 5 h
Biodistribution: (48 h) mainly accumulated in
lungs (≈26% injected dose per gram of tissue
(%ID/g)) and MPS – liver (≈3%ID/g) and
spleen (≈2.5%ID/g)
Elimination: renal – small GO particles, large size GO accumulated in lungs
1 mg kg−1, 14 days: n pathological
changes (lungs, liver, spleen,
kidney)
10 mg kg−1, 14 days:
granulomatous lesions, pulmonary
edema, inflammatory cell
infiltration, and fibrosis throughout the lung
Zhan et
al. [72]
GONP
(labeled
with 99mT)
Irregular shape (big
particle size ≈200 nm)
Kunming mice
(female, 15–
18 g)
100%, no body weight drop
Biodistribution:
0.3 mL 99mT-GONP
Histology: 1 mg of
GONP/mouse
(i.v. administration) Biodistribution; (24 h) Mainly accumulated in
MPS – liver (≈15%ID/g) and spleen (≈5%ID/g)
and lungs (≈3%ID/g)
Elimination: ≈ 0.5%, 24 h (feces + urine)
Observed in stomach (by eyes)
and in transmission electron microscopy (TEM) of chyme and
gastric tissues
2 h post i.v.: accumulated in liver
and phagocytosed by Kupffer
cells, little observed in lung/spleen
Duch et GO t = 0.5–2 nm
C57BL/6 mice
(8–12 week
100%, no body weight
drop (50 μg/mouse in
(Intratracheal administration)
Leakage of protein into the alveolar space,
After 21 d:
Persistent lung inflammation

Chapter 2 GBMs biocompatibility – literature review
Artur M. Pinto – Jan 2017 33
al. [78]
Area
(90%) ≤ 25,000 nm2
old, 20–25 g,
male)
50 μL, 24 h) bronchoalveolar lavage (BAL) fluid
pleiocytosis, ↑pro inflammatory cytokines,
hyaline membrane formation Induction of prothrombotic state
Increase in apoptosis
ROS after uptake into macrophages
Little evidence of lung fibrosis
G-Pluronic
t = 1.2–5 nm
Areas
(90%) ≤ 25,000 nm2
Contains more macrophages with a black
cytoplasm than aG (better distribution in lung) No evidence of fibrosis (21 days)
aG n/s
Persisted in medium/small airways
Macrophages with black cytoplasm
Induced peribronchial
inflammation and mild fibrosis (21
days)
Li et
al. [79]
GO (labeled
with 125I)
t ≈ 1 nm
d = 10–800 nm
KunMing mice 100%
(Intratracheal administration)
(10 mg kg−1, 24 h)
Biodistribution: (10 min) ≈ 70% remained in lung, (2 h) ≈ 20% remained in lung, (6 h) NGO
may pass through the air–blood barrier and be
delivered to other organs mainly liver and
intestine.
Elimination: higher concentration in urine
observed within 6 h
Sheets with small sizes can penetrate the
alveolar–capillary barrier and be quickly eliminated by a renal route
Acute lung injury with the greatest
severity at 48 h being then alleviated
1 week: fibroproliferation and
organization of lung tissue –
emergence of lung fibrosis
1–3 months: consolidation of the
lung and an accumulation of
alveolar macrophages
Yang et
al. [80]
(labeled
with 125I) GO
t ≈ 0.94 nm d = 450 nm
Female balb/c
mice 100%
(Oral route) (4 mg kg−1)
4 h: high levels of nGO-PEG, RGO-PEG and
nRGO-PEG in stomach and intestine, but not in
other major organs; 1 day: low levels in all
organs; 1 week: undetectable.
(Intraperitoneal injection) (4 mg kg−1)
1 and 7 days: high accumulation in liver and spleen, RGO-PEG with larger sizes showed
nearly 2 fold RES uptake compared to smaller
nGO-PEG and nRGO-PEG at day 7
(Oral route) (100 mg kg−1)
30 days: PEGylated GO derivatives were not adsorbed by
organs and were rapidly excreted
(Intraperitoneal injection)
(50 mg kg−1)
30 days: PEGylated GO
derivatives (but not GO) were not
engulfed by phagocytes in the RES system (size and surface
coating)
Long-term retention occurred for
injected GO and PEGylated GO
No significant toxicity was noticed
nGO-PEG t ≈ 1.22 nm
d = 25 nm
RGO-PEG t ≈ 4.43 nm
d = 50 nm
nRGO-PEG t ≈ 5.66 nm
d = 27 nm
Yan et
al. [81]
GO t ≈ 1 nm
Japanese white
rabbits
100%, no body weight
drop (0.1, 0.2 and
(Intravitreal injection)
No clear clinical evidence of ocular changes
Very small amount of residue in
the eye
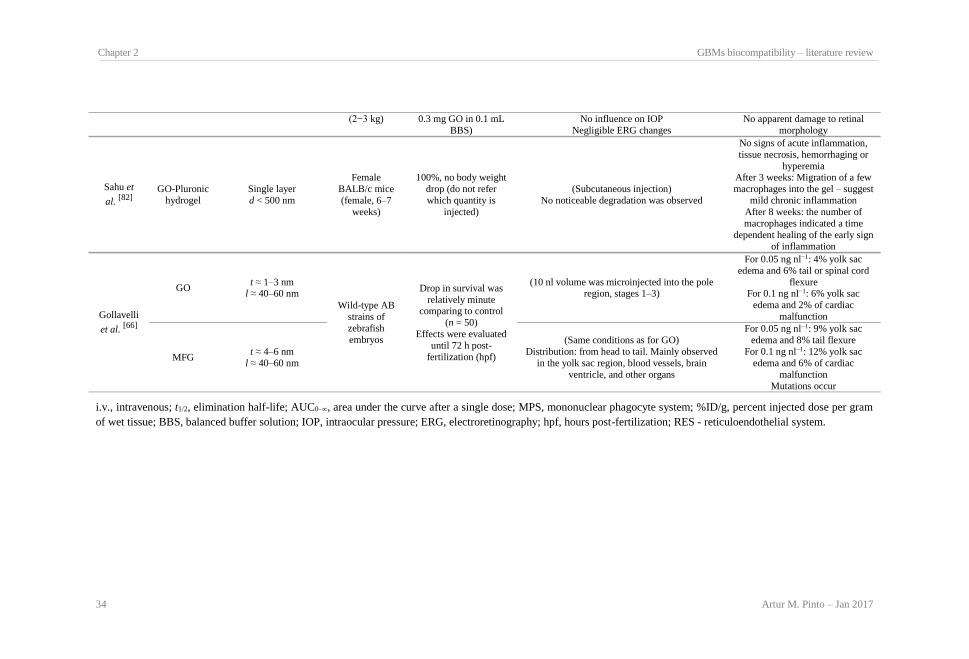
Chapter 2 GBMs biocompatibility – literature review
34 Artur M. Pinto – Jan 2017
(2−3 kg) 0.3 mg GO in 0.1 mL
BBS)
No influence on IOP
Negligible ERG changes
No apparent damage to retinal
morphology
Sahu et
al. [82]
GO-Pluronic
hydrogel
Single layer
d < 500 nm
Female
BALB/c mice
(female, 6–7
weeks)
100%, no body weight
drop (do not refer
which quantity is
injected)
(Subcutaneous injection)
No noticeable degradation was observed
No signs of acute inflammation,
tissue necrosis, hemorrhaging or
hyperemia After 3 weeks: Migration of a few
macrophages into the gel – suggest
mild chronic inflammation
After 8 weeks: the number of
macrophages indicated a time
dependent healing of the early sign
of inflammation
Gollavelli
et al. [66]
GO t ≈ 1–3 nm
l ≈ 40–60 nm
Wild-type AB
strains of
zebrafish
embryos
Drop in survival was
relatively minute comparing to control
(n = 50)
Effects were evaluated
until 72 h post-
fertilization (hpf)
(10 nl volume was microinjected into the pole region, stages 1–3)
For 0.05 ng nl−1: 4% yolk sac
edema and 6% tail or spinal cord
flexure For 0.1 ng nl−1: 6% yolk sac
edema and 2% of cardiac
malfunction
MFG t ≈ 4–6 nm
l ≈ 40–60 nm
(Same conditions as for GO)
Distribution: from head to tail. Mainly observed
in the yolk sac region, blood vessels, brain
ventricle, and other organs
For 0.05 ng nl−1: 9% yolk sac
edema and 8% tail flexure
For 0.1 ng nl−1: 12% yolk sac
edema and 6% of cardiac
malfunction
Mutations occur
i.v., intravenous; t1/2, elimination half-life; AUC0–∞, area under the curve after a single dose; MPS, mononuclear phagocyte system; %ID/g, percent injected dose per gram
of wet tissue; BBS, balanced buffer solution; IOP, intraocular pressure; ERG, electroretinography; hpf, hours post-fertilization; RES - reticuloendothelial system.

GBMs biocompatibility – literature review
Artur M. Pinto – Jan 2017 35
As abovementioned, there are not many studies concerning in vivo biocompatibility of GBMs.
More detailed characterization and mechanistic toxicity studies are essential for safer design and
production of GBMs, in order to optimize potential biological applications of these materials with
minimal risks for health.
2.2.4 Hemocompatibility
Several biomedical applications are being studied for GBMs (e.g. drug delivery, contrast imaging,
cancer thermal ablation, biosensors, implants). [36, 37, 41-43] In this context, hemocompatibility
studies are necessary to assess if intravenous administration or implantation of GBMs is safe.
Even so, there is a relatively low number of studies on this subject (Table 2.5). Most of the
available literature considers GBMs to be hemocompatible. These materials are described as not
causing hemolysis, platelet activation, and changes in coagulation or hematological markers
abnormalities. [76, 77, 83, 87]. However, Singh et al. [85, 86] reported that GO caused strong platelet
aggregation and extensive thromboembolism in mice. Interestingly, much less platelet
aggregation occurred with RGO. [86] Moreover, amine-modified graphene (G-NH2) did not show
stimulatory effects on human platelets or thromboembolism and did not induce erythrocyte lysis.
[86] Sasidaram et al. [83] observed that peripheral blood mononuclear cells (PBMCs) treated with
p-G expressed more IL-8 and IL-6 than PBMCs exposed to f-G. These results oppose those
obtained by Singh et al. [86], mentioned before, where GO revealed lower hemocompatibility than
RGO. Additionally, high GO concentrations (>100 μg mL−1) were shown to cause erythrocyte
lysis, while with low concentrations (<10 μg mL−1) no effect was observed. [74, 77] In our
unpublished work, GNP and GNP oxidized by modified Hummers method did not cause lysis of
red blood cells when incubated in concentrations up to 200 μg mL−1. The effect of GBMs
physical–chemical properties and concentration on hemocompatibility deserves further attention,
in order to clarify conflicting results and pending questions.
2.2.5 Biocompatibility of composite materials containing
GBMs
GBMs can be incorporated in different polymer matrices in order to improve relevant properties,
namely mechanical [88-89], thermal [88-89], and electrical [90].

Chapter 2
36 Artur M. Pinto – Jan 2017
Table 2.5: GBMs hemocompatibility.
Reference Material Particle size Hemocompatibility
Sasidharan
et al. [83]
p-G t ≈ 0.4 nm
Hemolysis: both (p-G and f-G) did not interfered with
RBC membrane integrity
Platelet activation/aggregation: both did not interfere
with natural platelet functioning
Coagulation studies: both did not interfere with
intrinsic or extrinsic pathways of coagulation
f-G (n/s)
Pro-inflammatory cytokines: p-G treated peripheral
blood mononuclear cells (PBMCs) express relatively
higher levels of IL-8 and IL-6, comparing to f-G treated
PBMCs
Singh et
al. [85]
GO Single or few layer
d ≈ 0.2–5 μm
GO caused strong aggregatory response in platelets
through activation of Src kinases and release of calcium
from intracellular stores
GO i.v. administration induced extensive pulmonary
thromboembolism in mice (Swiss, 8–12 weeks, male)
RGO (n/s) RGO was much less effective in aggregating platelets
Singh et
al. [86]
G-NH2 Single and few layer
l ≈ 2 μm
No platelet aggregation (2 μg mL−1)
No effect on [Ca2+]i (intracellular free calcium)
(10 μg mL−1)
Did not evoked cytosolic proteins or tyrosine
phosphorylation
Did not increased ROS (2 μg mL−1)
Did not evoked significant lysis of erythrocytes
(50 μg mL−1)
(i.v., 250 μg kg−1) No pulmonary thromboembolism in
mice (Swiss male mice, 8–12 weeks old)
GO
Size distribution similar to G-
NH2and RGO (flow
cytometry)
≈90% platelet aggregation (2 μg mL−1)
[Ca2+]i ↑4× (2 μg mL−1)
Evoked strong tyrosine phosphorylation
ROS ↑2× (2 μg mL−1)
Evoked significant concentration dependent lysis of
erythrocytes (2–10 μg mL−1)
(i.v., 250 μg kg−1) Occlusion of large number of lung
vessels with platelet thrombi
RGO Similar to G-NH2and GO ≈15% platelet aggregation (2 μg mL−1)
[Ca2+]i ↑2× (2 μg mL−1)
Zhang et
al. [77]
GO (labeled
with 188R)
t ≈ 1 nm
l = 10–800 nm
Little effect on erythrocyte morphology and membrane
integrity (10 μg mL−1 for 1 and 4 h)
A part of erythrocyte membranes were ruptured and
ghost cells were observed (80 μg mL−1 for 4 h)
No significant difference was found between RBC
exposure to PBS and GO (10–80 μg mL−1 for 1 h)
Yang et
al. [76]
PEG-NGS
(labeled with
Cy7)
t ≈ 1 nm
l ≈ 10–30 nm
Normal hematology markers (20 mg kg−1, unlabeled, 3,
40, and 90d p.i.)
Dong et
al. [87]
GO
GO-COOH
(information only available in
Chinese)
GO-COOH recalcification time increased 11 min
(1.25 μg mL−1)
GO-COOH hematolysis ratio was less than 5% (0.5–
100 μg mL−1)
GO-COOH anti-clotting properties better than GO, due
to direct complexation between carboxyl group and
clotting factors
Cheng et
al. [74]
GO t ≈ 1.038 nm
d (PBS) ≈ 1429.1 nm Hemolysis: GO hemolysis ratio of 2.3% (5 mg mL−1)
and 78.5% (200 mg mL−1)
pRGO, Hep/BSA-g-pRGO hemolysis ratio < 2%
(200 mg mL−1)
Activated partial thromboplastin time (APTT): slightly
increases in presence of GO (attributed to COOH)
gradually increases with Hep-g-pRGO concentration
pRGO t ≈ 1 nm
d (PBS) ≈ 1596.8 nm
Hep-g-pRGO t ≈ 1 nm
d (PBS) ≈ 1241.5 nm
BSA-g-pRGO t ≈ 1 nm
d (PBS) ≈ 1131.7 nm
Table 2.6 introduces the composite types mentioned in the existing biocompatibility studies. In
the case of biomedical applications, the incorporation of GBMs should not decrease
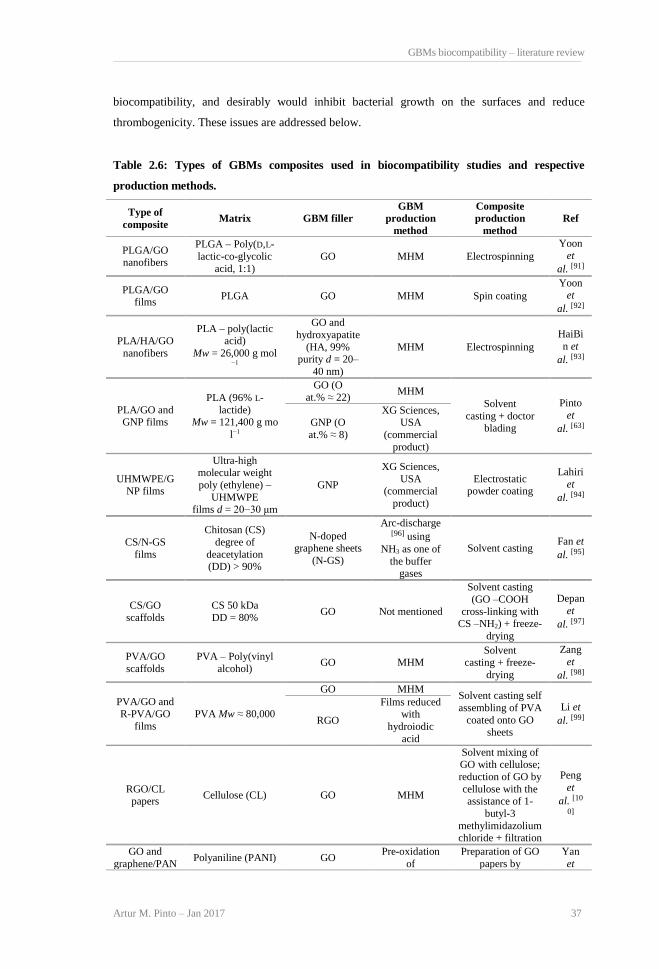
GBMs biocompatibility – literature review
Artur M. Pinto – Jan 2017 37
biocompatibility, and desirably would inhibit bacterial growth on the surfaces and reduce
thrombogenicity. These issues are addressed below.
Table 2.6: Types of GBMs composites used in biocompatibility studies and respective
production methods.
Type of
composite Matrix GBM filler
GBM
production
method
Composite
production
method
Ref
PLGA/GO nanofibers
PLGA – Poly(D,L-
lactic-co-glycolic
acid, 1:1)
GO MHM Electrospinning
Yoon et
al. [91]
PLGA/GO
films PLGA GO MHM Spin coating
Yoon et
al. [92]
PLA/HA/GO
nanofibers
PLA – poly(lactic acid)
Mw = 26,000 g mol−1
GO and
hydroxyapatite
(HA, 99% purity d = 20–
40 nm)
MHM Electrospinning
HaiBi
n et
al. [93]
PLA/GO and GNP films
PLA (96% L-
lactide) Mw = 121,400 g mo
l−1
GO (O
at.% ≈ 22) MHM
Solvent
casting + doctor blading
Pinto
et
al. [63] GNP (O
at.% ≈ 8)
XG Sciences, USA
(commercial
product)
UHMWPE/GNP films
Ultra-high molecular weight
poly (ethylene) –
UHMWPE
films d = 20−30 μm
GNP
XG Sciences,
USA (commercial
product)
Electrostatic powder coating
Lahiri
et
al. [94]
CS/N-GS
films
Chitosan (CS)
degree of
deacetylation (DD) > 90%
N-doped graphene sheets
(N-GS)
Arc-discharge [96] using
NH3 as one of
the buffer gases
Solvent casting Fan et
al. [95]
CS/GO
scaffolds
CS 50 kDa
DD = 80% GO Not mentioned
Solvent casting
(GO –COOH
cross-linking with CS –NH2) + freeze-
drying
Depan
et
al. [97]
PVA/GO
scaffolds
PVA – Poly(vinyl
alcohol) GO MHM
Solvent casting + freeze-
drying
Zang
et
al. [98]
PVA/GO and
R-PVA/GO
films
PVA Mw ≈ 80,000
GO MHM Solvent casting self
assembling of PVA
coated onto GO sheets
Li et
al. [99] RGO
Films reduced
with
hydroiodic
acid
RGO/CL papers
Cellulose (CL) GO MHM
Solvent mixing of GO with cellulose;
reduction of GO by
cellulose with the assistance of 1-
butyl-3
methylimidazolium chloride + filtration
Peng
et
al. [10
0]
GO and
graphene/PANPolyaniline (PANI) GO
Pre-oxidation
of
Preparation of GO
papers by
Yan
et

Chapter 2
38 Artur M. Pinto – Jan 2017
I papers graphite + MHM
filtration + immersion of GO papers in
an aniline solution
in which a polymerization
reaction was
recently induced
al. [10
1]
Graphene Hr of GO-
PANI paper
PVK/GNP
composites and films
poly(N-
vinylcarbazole) – PVK
GNP
XG Sciences, USA
(commercial
product)
Solvent mixing + PVK/GN
P composites
electrodeposition at indium tin oxide
(ITO) surfaces
Spin coating of ITO surfaces with
pristine GNP
(control)
Santo
s et
al. [10
2]
GO/rGO-DS-
PLL and PET-GO-DS-PLL
films
(poly-L-lysine) –
PLL Mw = 30,000–
70,000
GO MHM Functionalization of GO and rGO
with benzene
diazonium salt (DS) to generate
more -COOH
groups
+
composites with PLL prepared by
mixing in aqueous
solution +
spin coating of
glass cover slips with 100 μL of
1 mg mL−1
dispersions
Pre-plasma treated
PET coated with 250 μL of
1 mg mL−1GO-DS-PLL
Some et
al. [10
3]
rGO Not mentioned
Solid culture
mediums with GBMs
composites
CS
Small area GO
(sGO)
Obtained from
graphite
powder (MHM)
Solvent casting
(1.0 wt% chitosan
solution added with 0.3 wt% GBMs)
+
preparation of broth solutions
with 2% GBMs
Petri dish: 100 μl broth
solution + 15 mL
trypticase soy agar
Lim et
al. [10
4]
Large area GO
(hGO)
Obtained from
graphite flakes
by a simplified hummers
method [105]
rGO NaOH, 80 °C,
overnight
Polyurethane
(PU)/functional graphene
oxide nanocomposit
e films
(PU/GO-g-pMPC)
PU
Graphene oxide functionalized
with 2-
(methacryloyloxy) ethyl
phosphorylcholine
(GO-g-pMPC)
GO was obtained from
graphite
powder by Modified
Brodie
Method [107] a
nd GO-g-
pMPC was
GO-g-pMPC powders were
dispersed in
dimethylformamide (DMF) by
sonication and then dispersed in a PU
dispersion by the
same method
Su-
et
al. [10
6]

GBMs biocompatibility – literature review
Artur M. Pinto – Jan 2017 39
synthesized by reverse atom
transfer radical
polymerization in alcoholic
media using
peroxide groups as
initiator
PU and PU/GO-g-pMPC films were
obtained by solvent
evaporation at 100 °C
Cotton-GO
fabrics Cotton GO MHM
Adsorption
(Cotton-GO), radiation-induced
crosslinking
(Cotton-rx-GO) and chemical
crosslinking
(Cotton-cx-GO)
Zhao et
al. [10
8]
2.2.5.1 Mammalian cells
Table 2.7 presents several studies in which the biocompatibility of GBM-based composites is
assessed. Most studies show that the toxic effect of the fillers is reduced when incorporated in
biomaterials [63, 100-102], due to minimization of direct biological interactions with the
encapsulated materials. GO usually increases surface hydrophilicity of the biocomposites [63, 91-
93], therefore improving biocompatibility [63, 91, 92] by providing potential adhesion sites, like
hydroxyl groups [97]. Additionally, incorporation of GO may create a more favorable surface
topography toward cell adhesion [93]. Hydrophobic GBMs have been reported to not change [63] or
cause reduction [96] of cell proliferation at the surface of biocomposites.
Table 2.7: Biocompatibility of GBMs composites.
Ref Material Size Biocompatibility
Yoon et
al. [91]
PLA/GO 1 and 2 wt.% nanofibers
GO (t = 1.5 nm, l ≈ 1 μm)
Nanofibers (length = 11–
14 μm)
Cell proliferation: (PLGA = 100%,
PLGA/GO 1 wt.% ≈ 102%, PLGA/GO 2 wt.% ≈ 108%, 48 h)
(PC 12 cells)
Yoon et
al. [92] PLGA/GO films
GO (not mentioned)
Films (t ≈ 5 μm)
Cell proliferation: small increase (≈10%)
comparing to PLGA for PLGA/GO 2 wt.% (48 h) (Hela cells)
HaiBin
et
al. [93]
PLA/HA
(10 wt.%)/GO nanofibers
GO (few layer)
PLA/HA/GO (d = 0.3–1.3 μm)
Cell proliferation: 1, 2 and 5 wt.% GO ↑cell
proliferation, comparing to PLA/HA (24 h)
Only nanofibers with 5 wt.% GO presented higher proliferation than PLA/HA (48 h)
(MC3T3-E1 cells)
Pinto et
al. [63]
PLA/GO films
(0.4 wt.%)
d ≈ 500 nm
Films (t = 25–65 μm)
Cell proliferation: no variations until 48 h,
except for PLA/GO after 24 h (more 13% than pristine PLA)
(mouse embryo fibroblasts 3T3 – ATCC
CCL-164) Hemocompatibility: less platelets activated in
PLA/GNP films
(0.4 wt.%)
GNP (t ≈ 6–8 nm, l ≈ 5 μm)
Films (t = 25–65 μm)

Chapter 2
40 Artur M. Pinto – Jan 2017
PLA/GNP comparing with PLA in presence of plasma proteins (human platelets
concentrate)
Lahiri
et
al. [94]
UHMWPE/GNP
films
GNP (t = 6–8 nm, l = 5 μm)
Films (t = 200 μm)
Cell proliferation: UHMWPE/GNP 0.1 wt.%
↓6, 14 and 17%, UHMWPE/GNP 1 wt.% ↓43, 69 and 87% comparing to pristine
polymer after, respectively, 1, 3 and 5 d.
(osteoblasts, ATCC)
Fan et
al. [95] CS/N-GS films
Films (t = not mentioned)
GS (2–6
layers, l ≈ 500 nm)
Cell proliferation: = for CS and CS/N-GS 0.1–0.6 wt.% (24 and 48 h)
Cell adhesion: completed at 6 h for CS/N-GS
0–0.3 wt.%, at 9 h for 0.6 wt.%, at 12 h was similar for every concentration and reached
80%
Morphology: no differences for every concentration (24 h) (L929 fibroblasts)
Depan et
al. [97]
CS/GO 1 and 3 wt.% scaffolds
GO (t = 1.3 nm, d ≈ 2μm) Pore diameter = 100–
120 μm
Porosity 84–91%
Cell adhesion: ↑CS/GO than CS (7 d)
Cell viability: ↑CS/GO than CS scaffolds (9
and 21d) Degradation products: cell viability was
higher after 48 h (mouse pre-osteoblast
MC3T3-E1, ATCC)
Zhang
et
al. [98]
PVA/GO 0–1 wt.%
scaffolds
PVA (any information)
GO (t = several layers)
Cell adhesion: 1 d – most adhered to PVA and PVA/GO 0.4%, PVA/GO 1% – did not
adhere and appear spherical; 3 d – almost
completely flat and spread out and fewer cells are observed for all samples; 5 d – no
differences in the cell morphology or the
number of cells. (osteoblasts)
Li et
al. [99]
PVA/GO films
Reduced (R)-
PVA/GO films
GO (t = 1.3–1.7 nm, l = several
hundred nm to several
μm)
PVA/GO films
(t ≈ 10 μm)
R-PVA/GO films (t ≈ 7.5 μm)
Cell adhesion: 2.5 h – 56% adhered to R-
PVA/GO films, 49% adhered to common
tissue culture polystyrene (TCPS)
Cell viability: 72 h – ↑PVA R-PVA/GO films
than on TCPS (human umbilical vein
endothelial cells – HUVECs)
Peng et
al. [100]
RGO (24 wt.%)/CL
papers
GO (t = 1 nm)
RGO/CL papers (t = 1.9 nm)
Cell viability: very few necrotic cells on RGO/CL, necrosis in RGO (24 h) (HeLa
cells)
Yan et
al. [101]
GO/PANI paper
Graphene/PANI
paper
Both papers (t = 4–5 μm,
distance between layers = 100–200 nm)
Cell viability: 2 d – 71% GO, 77% GO/PANI,
75% graphene, 84% graphene/PANI; 4 d:
92% GO, 97% GO/PANI, 92% graphene, 100% graphene-PANI. (Fibroblasts L-929
cells)
Santos
et
al. [102]
PVK/GNP
composites
PVK/GNP films
PVK films
GNP films
GNP (t = 1.8 nm, l = 10–20 μ)
Films (t = 150 nm)
Cell viability: GNP ≈ 60%, PVK ≈ 90%,
PVK/GNP 3 wt.% composites ≈ 80%; concentrations of 1.0 mg mL−1 in culture
medium (NIH 3T3 Fibroblasts, Univ.
Wisconsin-Madison) Antibacterial properties: (E. coli and B.
subtilis) Cell viability: after 1 h – PVK > 85%,
GNP < 30% (concentrations of
1.0 mg mL−1 in culture medium), PVK/GNP 3 wt.% composites <90%, <90%, <20%,
<10%, respectively for 0.01, 0.05, 0.5 and
1 mg mL−1 in culture medium. Biofilm formation: inhibited at PVK/GNP
and GNP films surfaces
Some et GO/rGO-DS-PLL
Cell proliferation: ↑GO-PLL, GO-DS-PLL

GBMs biocompatibility – literature review
Artur M. Pinto – Jan 2017 41
al. [103] films
PET-GO-DS-PLL
films
and rGO-DS-PLL than PLL and GO (non-small cell lung carcinoma A549 and human
adipose derived stem cells)
Antibacterial properties (E. coli DH5-α):
Live dead: control 4%, GO-DS-PLL 97%
dead cells (25 μg mL−1) Cell viability: E. coli = 100% (control), GO-
PLL, rGO-DS-PLL, GO-DS-PLL ≈ 0;
PLL ≈ 43%, rGO-PLL ≈ 52%, GO-DS 78%, rGO 87%, GO 96%, rGO-DS 104%
(25 μg mL−1)
Biofilm formation: PET-PLL presented bacterial growth contrarily to PET-GO-DS-
PLL.
Lim et
al. [104]
Solid culture
mediums with GBMs composites
sGO (l = 5 μm)
hGO (l = 100 μm)
Cell viability: P. aeruginosa = 0% CS/srGO
and hrGO; for CS/sGO and hGO growth was not suppressed
Su-xing
et
al. [106]
PU/GO-g-pMPC
films GO-g-pMPC (t ≈ 1 nm)
Hemocompatibility: PU/GO-g-pMPC films
(in plasma) showed improved resistance to
nonspecific protein adsorption and platelet adhesion (comparing with PU)
Zhao et
al. [108]
Cotton-GO
Cotton-rx-GO Cotton-cx-GO
t ≈ 1.1 nm
Bacteria: E. coli and B. subtilis ≈ 0% (4 h,
37 °C), membrane damage occurred in E.
coli, it was not studied for B. cereus Rabbits: no evidence of significant irritation
in a skin irritation test until 72 h
The composite production method may influence biocompatibility. Cell proliferation at the
surface of graphene nanoplatelets (GNP) composites produced by electrostatic powder coating
decreased due to leaching of the filler [94], which was shown to be toxic [63]. However, for
materials produced by solvent mixing no changes in cell proliferation were observed, since GNP
was effectively embedded in the polymer matrix [63]. Hydrophilic GO released by degradation of
chitosan (CS) scaffolds was found to be non-toxic [97].
2.2.5.2 Bacterial cells
Since it has been reported that some GBMs have antibacterial properties, it is relevant to address
if incorporation of GBMs in polymer matrices decreases bacterial proliferation at the composite
surface. This is an important issue because infection is frequent in biomaterial implantation
procedures. [109]
In a few studies, the incorporation of both hydrophilic and hydrophobic GBMs (GO, rGO, GNP)
in polymer matrixes [PLL – poly-l-lysine, CS, PVK – poly(N-vinylcarbazole)] was shown to
decrease bacterial cell viability. [102-104] This was explained by GBMs causing direct damage [102,
104] on cell membrane and/or by oxidative stress. [104] This effect was enhanced in the reduced

Chapter 2
42 Artur M. Pinto – Jan 2017
form of the materials, due to stronger interaction between the more sharpened edges of the sheets
and the bacteria's cell membrane and/or better charge transfer between the bacteria and the edge
of the GBMs. [104]
The ideal biocomposite should inhibit bacterial growth at the surface, while promoting cell
attachment and proliferation. [104] However, conjugation of these two effects is not evident and
must be evaluated for each case. As an example, Santos et al. [102] observed that incorporation of
GNP on PVK matrix decreased biofilm growth but simultaneously caused a slight decrease in cell
viability. Additionally, Zhao et al. [108] observed that cotton fabrics modified with GO inhibit
almost completely bacteria proliferation and that the fabrics caused no irritation to rabbit skin
after 72 h contact.
2.2.5.3 Hemocompatibility
Hemocompatibility studies are relevant to assess whether implantation of composites with GBMs
is safe (see Section 2.2.4). In our previous study [63] the hemocompatibility of PLA composite
films was evaluated. Results showed that less adherent platelets were activated in PLA/GNP films
comparing with pristine PLA films, in the presence of plasma proteins. Hydrophobic GNP
seemed to favor albumin adsorption, which blocked platelet activation. Su-xing et al. [106],
observed that PU/GO-g-pMPC films showed improved resistance to nonspecific protein
adsorption and platelet adhesion, in the presence of plasma proteins, comparing with pristine PU
films.
These results suggest that incorporation of GBMs in biomaterials may decrease their
thrombogenicity. However, further studies are needed to clarify whether these fillers can indeed
be used to prevent thrombus formation associated with implantation procedures.
2.3 Conclusions
Most existing works report bacterial viability decrease after exposure to GBMs. Often,
physical damages occur upon direct contact of bacterial membranes with sharp edges of
graphene sheets. Additionally, oxidative stress has been observed. GBMs with small particle
size and in oxidized state seem to present higher antibacterial effect.
GBMs biocompatibility – literature review
Artur M. Pinto – Jan 2017 43
Studies frequently show that mammalian cell viability decreases slightly after exposure to
GBMs. These materials were shown to induce oxidative stress and apoptosis. The most
hydrophilic forms of GBMs were found to penetrate the cellular membrane. Even so, these
materials were found to be generally less toxic than hydrophobic forms, which accumulate
on cell membrane surfaces. One issue that has not yet been addressed is the effect of particle
size on cell viability, for the same type of GBMs.
The in vivo effect of GBMs depends on their physical–chemical properties, concentration,
time of exposure, and administration route, and also on the characteristics of the animals
used. Most studies report no occurrence of adult animal death. However, there are some
reports of GBMs accumulation and histological findings associated with inflammation, and,
more rarely, fibrosis. Small sized GBMs present fast elimination. Existing information on in
vivo toxicity mechanisms is still scarce, and more studies are needed to support safe
biological applications of these materials.
Most of the available literature considers GBMs to be hemocompatible, but, again, further
work is needed for confirmation.
Encapsulation of GBMs in a matrix reduces potential toxicity. In addition, incorporation of
hydrophilic forms improves cell adhesion at the biomaterials surface. Some reports of
antibacterial properties and improved hemocompatibility in GBM-based composites offer
interesting perspectives for future research and developments.
Little is known about long-term toxicity of GBMs. This is an issue that merits consideration
in future studies. Also, the effect of GBMs on cell signaling has just started being studied,
and more information should become available soon.

Chapter 2
44 Artur M. Pinto – Jan 2017
2.4 References
1. H. Kim, A.A. Abdala, C.W. Macosko, Graphene/Polymer Nanocomposites,
Macromolecules 43 (2010) 6515.
2. V. Singh, D. Joung, L. Zhai, S. Das, S.I. Khondaker, S. Seal, Graphene based materials:
Past, present and future, Prog Mater Sci 56 (2011) 1178-1271.
3. K.P. Loh, Q. Bao, P.K. Ang, J. Yang, The chemistry of graphene, J Mater Chem 20
(2010) 2277-2289.
4. W. Choi, I. Lahiri, R. Seelaboyina, Y.S. Kang, Synthesis of Graphene and Its
Applications: A Review, Crit Rev Solid State Mater Sci 35 (2010) 52-71.
5. O.V. Prezhdo, P.V. Kamat, G.C. Schatz, Virtual Issue: Graphene and Functionalized
Graphene, J Phys Chem C 115 (2011) 3195-3197.
6. M.J. Allen, V.C. Tung, R.B. Kaner, Honeycomb carbon: a review of graphene, Chem
Rev 110 (2010) 132-145.
7. M. Batzill, The surface science of graphene: Metal interfaces, cvd synthesis,
nanoribbons, chemical modifications, and defects, Surf Sci Rep 67 (2012) 83-155.
8. C.N. Rao, K.S. Subrahmanyam, M.H. Ramakrishna, M. Urmimala, M. Kota,
A.Govindaraj, Graphene: synthesis, functionalization and properties, Int J Mod Phys B
25 (2011) 4107-4143.
9. R.J. Young, J. Robert, I.A. Kinloch, L. Gong, K.S. Novoselov, The mechanics of
graphene nanocomposites: a review, Compos Sci Technol 72 (2012) 1459-1476.
10. A.M. Pinto, J. Martins, J.A. Moreira, A.M. Mendes, F.D. Magalhães, Dispersion of
graphene nanoplatelets in PVAc latex and effect on adhesive bond strength, Polym Int 62
(2013) 928–935.
11. M.J. Fernández-Merino, J.I. Paredes, S. Villar-Rodil, L. Guardia, P. Solís-Fernández, D.
Salinas-Torres, D. Cazorla-Amorós, E. Morallón, A. Martínez-Alonso, J.M. Tascón,
Investigating the influence of surfactants on the stabilization of aqueous reduced
graphene oxide dispersions and the characteristics of their composite films, Carbon 50
(2012) 3184-3194.
12. D.R. Dreyer, S. Park, C. Bielawski, R.S. Ruoff, The chemistry of graphene oxide, Chem
Soc Rev 39 (2010) 228-240.
13. J.I. Paredes, S. Villar-Rodil, A. Martínez-Alonso, J.M. Tascon, Graphene oxide
dispersions in organic solvents, Langmuir 24 (2008) 10560-10564.
14. Y. Zhu, D.K. James, K. Dustin, J.M. Tour, New routes to graphene, graphene oxide and
their related applications, Adv Mater 24 (2012) 4924-4955.
15. J. Kim, L.J. Cote, J. Huang, Two dimensional soft material: new faces of graphene oxide,
Acc Chem Res 45 (2012) 1356-1364.
16. Y. Zhu, S. Murali, W. Cai, X. Li, J.W. Suk, J.R. Potts, R.S. Ruoff, Graphene and
graphene oxide: synthesis, properties, and applications, Adv Mater 22(2010) 3906-3924.
17. O.C. Compton, S.T. Nguyen, Graphene Oxide, Highly Reduced Graphene Oxide, and
Graphene: Versatile Building Blocks for Carbon‐Based Materials, Small 6 (2010) 711-
723.
18. H. Bai, C. Li, G. Shi, Functional composite materials based on chemically converted
graphene, Adv Mater 23 (2011) 1089-115.
19. J. Du, H. Cheng, The fabrication, properties, and uses of graphene/polymer composites,
Macromol Chem Phys 213 (2012) 1060-1077.
20. X. Huang, Z. Yin, S. Wu, X. Qi, Q. He, Q. Zhang, Q. Yan, F. Boey, H. Zhang,
Graphene‐based materials: synthesis, characterization, properties, and applications, Small
7 (2010) 1876-1902.
21. T. Kuila, S. Bose, A.K. Mishra, P. Khanra, N.H. Kim, J.H. Lee, Chemical
functionalization of graphene and its applications, Prog Mater Sci 57(2012) 1061-1105.
22. S. Park, R.S. Ruoff, Chemical methods for the production of graphenes, Nat Nanotechnol
4 (2009) 217-224.
GBMs biocompatibility – literature review
Artur M. Pinto – Jan 2017 45
23. S. Mao, H. Pu, J. Chen, Graphene oxide and its reduction: modeling and experimental
progress, RSC Adv 2 (2012) 2643-2662.
24. X. Gao, D. Jiang, Y. Zhao, S. Nagase, S. Zhang, Z. Chen, Theoretical Insights into the
Structures of Graphene Oxide and Its Chemical Conversions Between Graphene, J
Comput Theor Nanosci 8 (2011) 2406-2422.
25. X. Gao, J. Jang, S. Nagase, Hydrazine and Thermal Reduction of Graphene Oxide:
Reaction Mechanisms, Product Structures, and Reaction Design, J Phys Chem C 114
(2010) 832-842.
26. D.W. Boukhvalov, M.I. Katsnelson, A new route towards uniformly functionalized
single-layer graphene, J Phys D-Appl Phys 43 (2010) 175302.
27. D.K. James, J.M. Tour, The chemical synthesis of graphene nanoribbons-A tutorial
review, Macromol Chem Phys 213 (2012) 1033-1050.
28. P. Kumar, B. Das, B. Chitara, K.S. Subrahmanyam, K. Gopalakrishnan, S.B. Kru-
panidhi, C.N. Rao, Novel radiation-induced properties of graphene and related materials,
Chem Phys 213 (2012) 1146-1163.
29. G. Eda, M. Chhowalla, Graphene-based composite thin films for electronics, Nano Lett 9
(2009) 814-818.
30. A.A. Balandin, S. Ghosh, W. Bao, I. Calizo, D. Teweldebrhan, F. Miao, C.N. Lau,
Superior thermal conductivity of single-layer graphene, Nano Lett 8 (2008) 902-907.
31. Y. Chen, B. Zhang, G. Liu, X. Zhuang, E. Kang, Graphene and its derivatives: Switching
on and off, Chem Soc Rev 41 (2012) 4688-4707.
32. E. Morales-Narvaez, A. Merkoci, Graphene oxide as an optical biosensing platform, Adv
Mater 24 (2012) 3298-3308.
33. B. Tang, G.X. Hu, Two kinds of graphene-based composites for photoanode applying in
dye-sensitized solar cell, J Power Sources 220 (2012) 95-102.
34. G.V. Dubacheva, C. Liang, D.M. Bassani, Functional monolayers from carbon
nanostructures - fullerenes, carbon nanotubes, and graphene - as novel materials for solar
energy conversion, Coord Chem Rev 256 (2012) 2628-2639.
35. Y. Shao, J. Wang, H. Wu, J. Liu, I.A. Aksay, Y. Lin, Graphene based electrochemical
sensors and biosensors: A review, Electroanalysis 22 (2010) 1027-1036.
36. Z. Zhu, L. Garcia-Gancedo, A.J. Flewitt, H. Xie, F. Moussy, W.I. Milne, A critical
review of Glucose biosensors based on Carbon nanomaterials: Carbon nanotubes and
graphene, Sensors 12 (2012) 5996-6022.
37. T. Kuilla, S. Bhadra, D. Yao, N.H. Kim, S. Bose, J.H. Lee, Recent advances in graphene
based polymer composites, Prog Polym Sci 35 (2010) 1350-1375.
38. S. Stankovich, D.A. Dikin, G.H. Dommett, K.M. Kohlhaas, E.J. Zimney, E.A.
Stach,R.D. Piner, S.T. Nguyen, R.S. Ruoff, Graphene-based composite materials, Nature
442 (2006) 282-286.
39. D. Cai, M. Song, Recent advance in functionalized graphene/polymer nanocomposites, J
Mater Chem 20 (2010) 7906-7915.
40. K. Yang, S. Zhang, G. Zhang, X. Sun, S.T. Lee, Z. Liu, Graphene in mice: Ultrahigh in
vivo tumor uptake and efficient photothermal therapy, Nano Lett 10 (2010) 3318-3323.
41. H. Shen, L. Zhang, M. Liu, Z. Zhang, Biomedical Applications of Graphene,
Theranostics 2 (2012) 283-294.
42. V.C. Sanchez, A. Jachak, R.H. Hurt, A.B. Kane, Biological Interactions of Graphene-
Family Nanomaterials: An Interdisciplinary Review, Chem Res Toxicol 25 (2012) 15-34.
43. Y. Wang, Z. Li, J. Wang, J. Li, Y. Lin, Graphene and graphene oxide:
biofunctionalization and applications in biotechnology, Trends Biotechnol 29 (2011)
205-212.
44. S.C. Tjong, Graphene and its derivatives: Novel materials for forming functional
polymer nanocomposites, Exp Polym Lett 6 (2012) 437.
45. A.K. Jain, N.K. Mehra, N. Lodhi, V.D. Dinesh, K. Mishra, P.K. Jain, N.K. Jain, Carbon
nanotubes and their toxicity, Nanotoxicology 1 (2007) 167-197.
46. G. Xie, J. Cheng, Y. Li, P. Xi, F. Chen, H. Liu, F. Hou, Y. Shi, L. Huang, Z. Xu, D.
Bai,Z. Zeng, Fluorescent graphene oxide composites synthesis and its biocompatibility
study, J Mater Chem 22 (2012) 9308-9314.
Chapter 2
46 Artur M. Pinto – Jan 2017
47. L. Zhang, J. Xia, Q. Zhao, L. Liu, Z. Zhang, Functional graphene oxide as a nanocarrier
for controlled loading and targeted delivery of mixed anticancer drugs, Small 6 (2010)
537-544.
48. N.G. Sahoo, H. Bao, Y. Pan, M. Pal, M. Kakran, H.K. Cheng, L. Li, L.P. Tan,
Functionalized carbon nanomaterials as nanocarriers for loading and delivery of a poorly
water-soluble anticancer drug: a comparative study, Chem Commun 47 (2011) 5235-
5237.
49. M. Kakran, N.G. Sahoo, H. Bao, Y. Pan, L. Li, Functionalized Graphene Oxide as
Nanocarrier for Loading and Delivery of Ellagic Acid, Curr Med Chem 18 (2011) 4503-
4512.
50. K. Liu, J. Zhang, F. Cheng, T. Zheng, C. Wang, J. Zhu, Green and facile synthesis of
highly biocompatible graphene nanosheets and its application for cellular imaging and
drug delivery, J Mater Chem 21 (2011) 12034-12040.
51. G.-Y. Chen, H.-J. Yang, C.-H. Lu, Y.-C. Chao, S.-M. Hwang, C.-L. Chen, K.-W. Lo,L.-
Y. Sung, W.-Y. Luo, H.-Y. Tuan, Y.-C. Hu, Simultaneous induction of autophagy and
toll-like receptor signaling pathways by graphene oxide, Biomaterials 33 (2012) 6559-
6569.
52. H. Zhou, K. Zhao, W. Li, N. Yang, Y. Liu, C. Chen, T. Wei, The interactions between
pristine graphene and macrophages and the production of cytokines/chemokines via
TLR- and NF-κB-related signaling pathways, Biomaterials 33 (2012) 6933-6942.
53. Y. Li, Y. Liu, Y. Fu, T. Wei, L.L. Guyader, G. Gao, R.-S. Liu, Y.-Z. Chang, C. Chen,
The triggering of apoptosis in macrophages by pristine graphene through the MAPK and
TGF-beta signaling pathways, Biomaterials 33 (2012) 402-411.
54. S. Liu, T.H. Zeng, M. Hofmann, E. Burcombe, J. Wei, R. Jiang, J. Kong, Y. Chen,
Antibacterial Activity of Graphite, Graphite Oxide, Graphene Oxide, and Reduced
Graphene Oxide: Membrane and Oxidative Stress, ACS Nano 5 (2011) 6971-6980.
55. W. Hu, C. Peng, W. Luo, M. Lv, X. Li, D. Li, Q. Huang, C. Fan, ACS Nano 4
(2010)4317.
56. O.N. Ruiz, K.A. Fernando, B. Wang, N.A. Brown, P.G. Luo, N.D. McNamara,
M.Vangsness, Y. Sun, C.E. Bunker, Graphene Oxide: A Nonspecific Enhancer of
Cellular Growth, ACS Nano 5 (2011) 8100-8107.
57. X. Cai, S. Tan, A. Yu, J. Zhang, J. Liu, W. Mai, Z. Jiang, Sodium 1-
Naphthalenesulfonate-Functionalized Reduced Graphene Oxide Stabilizes Silver
Nanoparticles with Lower Cytotoxicity and Long-Term Antibacterial Activity,
Chemistry 7 (2012) 1664-1670.
58. X. Cai, S. Tan, M. Lin, A. Xie, W. Mai, X. Zhang, Z. Lin, T. Wu, Y. Liu, Synergistic
Antibacterial Brilliant Blue/Reduced Graphene Oxide/Quaternary Phosphonium Salt
Composite with Excellent Water Solubility and Specific Targeting Capability, Langmuir
27 (2011) 7828-7835.
59. H. Pandey, V. Parashar, R. Parashar, R. Prakash, P.W. Ramteke, A.C. Pandey,
Controlled drug release characteristics and enhanced antibacterial effect of graphene
nanosheets containing gentamicin sulfate, Nanoscale 3 (2011) 4104-4108.
60. K. Wang, J. Ruan, H. Song, J. Zhang, Y. Wo, S. Guo, D. Cui, Biocompatibility of
Graphene Oxide, Nanoscale Res Lett 6 (2011) 8.
61. L.H. Liao, Y.S. Lin, C.W. Macosko, C.L. Haynes, Cytotoxicity of graphene oxide and
graphene in human erythrocytes and skin fibroblasts, Appl Mater Interfaces 3 (2011)
2607-2615.
62. A. Sasidharan, L.S. Panchakarla, P. Chandran, D. Menon, S. Nair, C.N. Raob,
M.Koyakutty, Differential nano-bio interactions and toxicity effects of pristine versus
functionalized graphene, Nanoscale 3 (2011) 2461-2464.
63. A.M. Pinto, S.M. Moreira, F.M. Gama, I.C. Gonçalves, F.D. Magalhães,
Biocompatibility of poly (lactic acid) with incorporated graphene-based materials,
Colloid Surface B 104 (2013) 229-238.
64. B.J. Hong, O.C. Compton, Z. An, I. Eryazici, S.T. Nguyen, Successful Stabilization of
Graphene Oxide in Electrolyte Solutions: Enhancement of Biofunctionalization and
Cellular Uptake, ACS Nano 6 (2012) 63-73.

GBMs biocompatibility – literature review
Artur M. Pinto – Jan 2017 47
65. C. Peng, W. Hu, Y. Zhou, C. Fan, Q. Huang, Intracellular Imaging with a Graphene-
Based Fluorescent Probe, Small 6 (2010) 1686-1692.
66. G. Gollavelli, Y. Ling, Multi-functional graphene as an in vitro and in vivo imaging
probe, Biomaterials 33 (2012) 2532-2545.
67. X. Yang, Y. Wang, X. Huang, Y. Ma, Y. Huang, R. Yang, H. Duan, Y. Chen, Multi-
functionalized graphene oxide based anticancer drug-carrier with dual-targeting function
and pH-sensitivity, J Mater Chem 21 (2011) 3448-3454.
68. V.K. Rana, M. Choi, J. Kong, G.Y. Kim, M.J. Kim, S. Kim, S. Mishra, R.P. Singh, C.Ha,
Synthesis and Drug-Delivery Behavior of Chitosan-Functionalized Graphene Oxide
Hybrid Nanosheets, Macromol Mater Eng 96 (2011) 131-140.
69. X. Yang, G. Niu, X. Cao, Y. Wen, R. Xiang, H. Duan, Y. Chen, The preparation of
functionalized graphene oxide for targeted intracellular delivery of siRNA, J Mater Chem
22 (2012) 6649-6654.
70. H. Wen, C. Dong, H. Dong, A. Shen, W. Xia, X. Cai, Y. Song, X. Li, Y. Li, D. Shi,
Engineered Redox-Responsive PEG Detachment Mechanism in PEGylated Nano-
Graphene Oxide for Intracellular Drug Delivery, Small 8 (2012) 760-769.
71. H. Dong, L. Ding, F. Yan, H. Ji, H. Ju, Engineered Redox-Responsive PEG Detachment
Mechanism in PEGylated Nano-Graphene Oxide for Intracellular Drug Delivery,
Biomaterials 32 (2011) 3875-3882.
72. L. Zhan, G. Yanxia, Z. Xiaoyong, Q. Wei, F. Qiaohui, L. Yan, J. Zongxian, W.Jianjun,
T. Yuqin, D. Xiaojiang, W. Wangsuo, Biodistribution of co-exposure to multi-walled
carbon nanotubes and graphene oxide nanoplatelets radiotracers, J Nanopart Res 13
(2011) 2939-2947.
73. W. Hu, C. Peng, M. Lv, X. Li, Y. Zhang, N. Chen, C. Fan, Q. Huang, Protein-
coronamediated mitigation of cytotoxity of graphene oxide, Protein-corona mediated
mitigation of cytotoxity of graphene oxide, ACS Nano 5 (2011) 3693-3700.
74. C. Cheng, S. Nie, S. Li, H. Peng, H. Yang, L. Ma, S. Sun, C. Zhao, Biopolymer
functionalized reduced graphene oxide with enhanced biocompatibility via mussel
inspired coatings/anchors, J Mater Chem B 1 (2013) 265-275.
75. C.J. Wilson, B.E. Clegg, D.I. Leavesley, M.J. Pearcy, Mediation of biomaterial-cell
interactions by adsorbed proteins: a review, Tissue Eng 11 (2005) 1-18.
76. K. Yang, J. Wan, S. Zhang, Y. Zhang, S. Lee, Z. Liu, In vivo Pharmacokinetics, Long-
Term Biodistribution, and Toxicology of PEGylated Graphene in Mice, ACS Nano 5
(2011) 516-522.
77. X. Zhang, J. Yin, C. Peng, W. Hu, Z. Zhu, W. Li, C. Fan, Q. Huang, In vivo
Pharmacokinetics, Long-Term Biodistribution, and Toxicology of PEGylated Graphene
in Mice, Carbon 49 (2011) 986-995.
78. M.C. Duch, G.R. Budinger, Y.T. Liang, S. Soberanes, D. Urich, S.E. Chiarella,
L.A.Campochiaro, A. Gonzalez, N.S. Chandel, M.C. Hersam, G.M. Mutlu, Minimizing
Oxidation and Stable Nanoscale Dispersion Improves the Biocompatibility of Graphene
in the Lung, Nano Lett 11 (2011) 5201-5207.
79. B. Li, J. Yang, Q. Huang, Y. Zhang, C. Peng, Y. Zhang, Y. He, J. Shi, W. Li, J. Hu, C.
Fan, Biodistribution and pulmonary toxicity of intratracheally instilled graphene oxide in
mice, NPG Asia Materials, 2013
http://www.nature.com/am/journal/v5/n4/full/am20137a.html
80. K. Yang, H. Gong, X. Shi, J. Wan, Y. Zhang, Z. Liu, In vivo biodistribution and
toxicology of functionalized nano-graphene oxide in mice after oral and intraperitoneal
administration, Biomaterials 34 (2013) 2787-2795.
81. L. Yan, Y. Wang, X. Xu, C. Zeng, J. Hou, M. Lin, J. Xu, F. Sun, X. Huang, L. Dai, F.
Lu, Y. Liu, Can graphene oxide cause damage to eyesight?, Chem Res Toxicol 25 (2012)
1265-1270.
82. A. Sahu, W.I. Choi, G. Tae, A stimuli-sensitive injectable graphene oxide composite
hydrogel, Chem Commun 48 (2012) 5820-5822.
83. A. Sasidharan, L.S. Panchakarla, A.R. Sadanandan, A. Ashokan, P. Chandran,C.M.
Girish, D. Menon, S.V. Nair, C.N. Rao, M. Koyakutty, Hemocompatibility and
Chapter 2
48 Artur M. Pinto – Jan 2017
Macrophage Response of Pristine and Functionalized Graphene, Small 8 (2012) 1251-
1263.
84. K.S. Subrahmanyam, L.S. Panchakarla, A. Govindaraj, C.N. Rao, Simple Method of
Preparing Graphene Flakes by an Arc-Discharge Method, J Phys Chem C 113 (2009)
4257-4259.
85. S.K. Singh, M.K. Singh, M.K. Nayak, S. Kumari, S. Shrivastava, J.J. Grácio, D.Dash,
Thrombus Inducing Property of Atomically Thin Graphene Oxide Sheets, ACS Nano 5
(2011) 4987-4996.
86. S.K. Singh, M.K. Singh, P.P. Kulkarni, V.K. Sonkar, J.J. Grácio, D. Dash, Amine-
Modified Graphene: Thrombo-Protective Safer Alternative to Graphene Oxide for
Biomedical Applications, ACS Nano 6 (2012) 2731-2740.
87. X. Dong, Z. NingLin, S. Jian, Hemocompatibility of Carboxylic Graphene Oxide, Chem
J Chin Univ 31 (2010) 2354-2359.
88. A.M. Pinto, J. Cabral, D.P. Tanaka, A. Mendes, F.D. Magalhães, Effect of incorporation
of graphene oxide and graphene nanoplatelets on mechanical and gas permeability
properties of poly (lactic acid) films, Polym Int 62 (2013) 33-40.
89. J. Liang, Y. Huang, L. Zhang, Y. Wang, Y. Ma, T. Guo, Y. Chen, Molecular-Level
Dispersion of Graphene into Poly(vinyl alcohol) and Effective Reinforcement of their
Nanocomposites, Adv Funct Mater 19 (2009) 2297-2302.
90. M. Pumera, Electrochemistry of graphene: new horizons for sensing and energy storage,
Chem Rec 9 (2009) 211-223.
91. O.J. Yoon, C.Y. Jung, I.Y. Sohn, H.J. Kim, B. Hong, M.S. Jhon, N. Lee,
Electrochemistry of graphene: new horizons for sensing and energy storage,
Composites:Part A 42 (2011) 1978-1984.
92. O.J. Yoon, I.Y. Sohn, D.J. Kim, N. Lee, Enhancement of thermomechanical properties of
poly(D,L-lactic-co-glycolic acid) and graphene oxide composite films for scaffolds,
Macromol Res 20 (2010) 789-794.
93. M.A. HaiBin, S.U. WenXin, T. ZhiXin, S. DongFei, Y. XingBin, L. Bin, X. QunJi,
Preparation and cytocompatibility of polylactic acid/hydroxyapatite/graphene oxide
nanocomposite fibrous membrane, Chin Sci Bull 57 (2012) 3051-3058.
94. D. Lahiri, R. Dua, C. Zhang, I. Socarraz-Novoa, A. Bhat, S. Ramaswamy, A. Agarwal,
Graphene Nanoplatelet-Induced Strengthening of UltraHigh Molecular Weight
Polyethylene and Biocompatibility In vitro, ACS Appl Mater Interfaces 4 (2012) 2234-
2241.
95. H. Fan, L. Wang, K. Zhao, N. Li, Z. Shi, Z. Ge, Z. Jin, Fabrication, Mechanical
Properties, and Biocompatibility of Graphene-Reinforced Chitosan Composites,
Biomacromolecules 11 (2010) 2345-2351.
96. N. Li, Z. Wang, K. Zhao, Z. Shi, Z. Gu, S. Xu, Fabrication, Mechanical Properties, and
Biocompatibility of Graphene-Reinforced Chitosan Composites, Carbon 48 (2010) 255-
259.
97. D. Depan, B. Girase, J.S. Shah, R.D. Misra, Fabrication, Mechanical Properties, and
Biocompatibility of Graphene-Reinforced Chitosan Composites, Acta Biomater 7 (2011)
3432-3445.
98. L. Zhang, Z. Wang, C. Xu, Y. Li, J. Gao, W. Wang, Y. Liu, High strength graphene
oxide/polyvinyl alcohol composite hydrogels, J Mater Chem 21 (2011) 10399-10406.
99. Y. Li, T. Yu, T. Yang, L. Zheng, K. Liao, Bio-Inspired Nacre-like Composite Films
Based on Graphene with Superior Mechanical, Electrical, and Biocompatible Properties,
Adv Mater 24 (2012) 3426-3431.
100. H. Peng, L. Meng, L. Niu, Q. Lu, Simultaneous Reduction and Surface Functionalization
of Graphene Oxide by Natural Cellulose with the Assistance of the Ionic Liquid, J Phys
Chem C 116 (2012) 16294-16299.
101. X. Yan, J. Chen, J. Yang, Q. Xue, P. Miele, Fabrication of Free-Standing,
Electrochemically Active, and Biocompatible Graphene Oxide−Polyaniline and
Graphene−Polyaniline Hybrid Papers, Appl Mater Interfaces 2 (2010) 2521-2529.

GBMs biocompatibility – literature review
Artur M. Pinto – Jan 2017 49
102. C.M. Santos, J. Mangadlao, F. Ahmed, A. Leon, R.C. Advincula, D.F. Rodrigues,
Graphene nanocomposite for biomedical applications: fabrication, antimicrobial and
cytotoxic investigations, Nanotechnology 23 (2012) 395101.
103. S. Some, S. Ho, P. Dua, E. Hwang, Y.H. Shin, H. Yoo, J. Kang, D. Lee, H. Lee, Dual
Functions of Highly Potent Graphene Derivative–Poly-l-Lysine Composites To Inhibit
Bacteria and Support Human Cells, ACS Nano 6 (2012) 7151-7161.
104. H.N. Lim, N.M. Huang, C.H. Loo, Facile preparation of graphene-based chitosan films:
Enhanced thermal, mechanical and antibacterial properties, J Non-Cryst Solids 358
(2012) 525-530.
105. H.N. Lim, N.M. Huang, S.S. Lim, I. Harrison, C.H. Chia, Fabrication and
characterization of graphene hydrogel via hydrothermal approach as a scaffold for
preliminary study of cell growth, Int J Nanomed 29 (2011) 1817-1823.
106. J. Su-xing, Z. Ning-lin, X. Dong, W. Yue, T. Yi-da, L. Chun-yana, Z. Juna, S. Jian,
Synthesis and anticoagulation activities of polymer/functional graphene oxide
nanocomposites via Reverse Atom Transfer Radical Polymerization (RATRP), Colloid
Surfaces B 101 (2013) 319-324.
107. X. Wang, N. Zhou, J. Yuan, W. Wang, Y. Tang, C. Lu, J. Zhang, J. Shen, Antibacterial
and anticoagulation properties of carboxylated graphene oxide–lanthanum complexes, J
Mater Chem 22 (2012) 1673-1678.
108. J. Zhao, B. Deng, M. Lv, J. Li, Y. Zhang, H. Jiang, C. Peng, J. Li, J. Shi, Q. Huang, C.
Fan, Graphene Oxide-Based Antibacterial Cotton Fabrics, Adv Healthc Mater 2 (2013)
1259-1266.
109. B.D. Ratner, A. Hoffman, F. Schoen, J. Lemons, Biomaterials Science: An Introduction
to Materials in Medicine, third ed., Academic Press, 2012.

Chapter 2
50 Artur M. Pinto – Jan 2017

GBMs biocompatibility – effect of particle size and degree of oxidation
Artur M. Pinto – Jan 2017 51
Chapter 3
GBMs biocompatibility:
Effect of particle size and degree of
oxidation
This chapter was based in the following published paper:

Chapter 3
52 Artur M. Pinto – Jan 2017
GBMs biocompatibility – effect of particle size and degree of oxidation
Artur M. Pinto – Jan 2017 53
3 GBMS BIOCOMPATIBILITY – EFFECT OF
PARTICLE SIZE AND DEGREE OF
OXIDATION
3.1 Scope
Graphene-based materials (GBMs) have recognized potential for biomedical applications,
however different production methods and treatments originate divergent biocompatibility. In this
chapter, two commercially available graphene nanoplatelets (GNP) were studied, differing in
platelet size. The effect of oxidation is known to change GBMs physico-chemical properties, thus
affecting its biointeractions. For those reasons, the effect of oxidation and size on
biocompatibility was evaluated in vitro. GBMs biocompatibility was studied in terms of
hemolysis potential, induction of reactive oxygen species production, metabolic activity changes,
effect on cell morphology, evaluation of membrane damages and particles internalization. The
studies were performed using two different cell models, human fibroblasts, and pulmonary
microvascular endothelial cells.
3.2 State of the art
Graphene is a single layer of sp2 carbon atoms arranged in a honeycomb structure. It possesses
very high mechanical strength, specific surface area and high thermal and electrical conductivity.
[1-9] Strong oxidizing agents can be used to produce oxidized forms of graphene, designated as
graphene oxide (GO). Also, graphite can be directly oxidized to produce graphite oxide, which
can then be exfoliated originating GO. [4] The presence of polar and reactive oxygen-containing
functional groups in graphene oxide [10-15] reduces its thermal stability, but may be important to
promote interaction and compatibility with polar solvents and with some polymer matrices. [4, 8,
16-18]
Chapter 3
54 Artur M. Pinto – Jan 2017
Several biomedical applications have been studied for graphene-based materials (GBMs), like
biosensing/bioimaging [19], drug delivery [18], cancer photothermal therapy [20], regenerative
medicine [21-22], and antibacterial materials [18]. Examples of GBMs functions in some of the
mentioned fields are: a) improvement of biomaterials mechanical/electrical properties, b)
adsorption and targeted delivery of drugs, c) strong optical absorption of near infrared radiation,
d) increase of cellular attachment and growth at biomaterials surface, and e) induction of selective
damages in bacteria. In view of the growing interest in using GBMs in medical applications, it is
relevant to evaluate their biocompatibility. From existent studies it can be concluded that
generally GBMs induce a decrease on cell viability above a concentration of 10 μg mL−1 after 24
h incubation, with cell viability often decreasing with time and concentration. GBMs interaction
with cells depends on their intrinsic physical––chemical properties (e.g. size, hydrophilicity),
which are related to the raw materials and production methods used. However, few studies are
available and some contradictory results can be found in literature. This subject was recently
reviewed by Pinto et al. [23-24]. There is still the need to perform a comprehensive characterization
for the different GBMs available, in terms of both physical–chemical properties and
biocompatibility. Also, since several biomedical applications under study for GBMs imply
contact with blood, hemocompatibility studies are necessary to assess the clinic safety of
intravenous administration or implantation of GBMs [23-24]. Some GBMs have been reported to
induce cell death by different mechanisms: a) generation of reactive oxygen species (ROS), which
leads to lipid peroxidation, denaturation of proteins, DNA degradation, and activation of
apoptosis, b) direct damage on cell membrane by a blade-like action of the particles sharp edges
[25], c) decrease of free cell surface area modifying metabolic changes with the cell medium,
leading to poor nutrient absorption and inefficient waste release, or affecting cell–cell interaction.
[26] Thus, careful characterization of each particular GBM is needed to assure their
biocompatibility.
The present work studies a commercially available product, with reduced cost comparing with
single layer graphene: graphene nanoplatelets (GNP). Each particle is constituted by at least 2
stacked graphene layers, possessing oxygen-containing functional groups at the edges. Since this
is a commercial product, there is the advantage of material consistency and availability.
Moreover, GNP has been reported to display good results as biopolymers fillers, improving
mechanical performance [24] and biocompatibility, namely reducing platelets activation without
increasing toxicity. [24] In this work, the biocompatibility of GNP is studied for different sizes and
oxidation states. Namely, evaluating hemolysis, effects on cell viability, proliferation,
mitochondrial membrane potential and morphology, and ROS production.

GBMs biocompatibility – effect of particle size and degree of oxidation
Artur M. Pinto – Jan 2017 55
3.3 Materials and methods
3.3.1 Graphene-based materials oxidation
Graphene nanoplatelets (GNP) grades M5 and C750, were acquired from XG Sciences (Lansing,
USA), with the following characteristics: Grade M5 (GNP-M) – average thickness of 6–8 nm,
maximum length 5 μm, and surface area between 120 and 150 m2 g−1; Grade C750 (GNP-C) –
average thickness lower than 2 nm and surface area of 750 m2 g−1. The sizes of a typical grade C
sample has a distribution that ranges from very small flakes (diameter below 100 nm) up to larger
flakes (1–2 μm). According to the manufacturer, GNP production is based on exfoliation of
sulphuric acid-based intercalated graphite by rapid microwave heating, followed by ultrasonic
treatment. [27]
GNP-M was oxidized by modified Hummers method (MHM), as described in our previous work.
[24] Briefly, 50 mL of H2SO4 were added to 2 g of GNP-M at room temperature and the solution
was cooled using an ice bath, followed by gradual addition of KMnO4, 6 g for GNP-M-ox-1:3 and
12 g for GNP-M-ox-1:6. Then 300 mL of distilled water were added, followed by addition of
H2O2 until oxygen release stopped. GNP-M-ox-1:3 and 1:6 were washed 5 times with water by
centrifugation at 4000 rpm during 15 min. The solids were dispersed in 500 mL of water by
sonication (Bandelin Sonorex R K512 H) during 5 h, frozen at −80 °C and lyophilized for 72 h.
3.3.2 GBMs physical-chemical characterization
3.3.2.1 GBMs physical characterization
3.3.2.1.1 Scanning electron microscopy (SEM)
The morphology of GBMs was observed using SEM (FEI Quanta 400FEG, with acceleration
voltage of 3 kV). Powders of the nanomaterials were applied on conductive carbon strips for
visualization.
3.3.2.1.2 Dynamic light scattering
Particle sizes and distributions of the materials were determined with an LS230 laser particle
analyzer (Coulter, USA). GBMs were dispersed in water at a concentration of 100 μg mL−1 and
sonicated for 1 h. Just before sample testing, 10 min sonication was performed to redisperse
agglomerates using a Bandelin Sonorex R K512 H ultrasound bath. Data were collected
performing 3 scans of 60 s, including polarization intensity differential scattering and using
Fraunhofer's model. This model assumes spherical shape for the particles in suspension. The
obtained size distributions must therefore be considered as relative evaluations of the degree of

Chapter 3
56 Artur M. Pinto – Jan 2017
deagglomeration of the different materials in water, and not as precise estimations of particle
sizes. Li et al. [28] used a similar approach to evaluate graphene oxide particle size distribution in
water by dynamic light scattering.
3.3.2.2 GBMs chemical characterization
3.3.2.2.1 X-ray photoelectron spectroscopy (XPS)
The XPS analysis of GBMs powders tablets (d = 10 mm) was performed at CEMUP (Centro de
Materiais da Universidade do Porto) using a ESCALAB 200A, VG Scientific (UK) with PISCES
software for data acquisition and analysis. For analysis, an achromatic Al (Kα) X-ray source
(1486.6 eV) operating at 15 kV (300 W) was used, and the spectrometer, calibrated with reference
to Ag 3d5/2 (368.27 eV), was operated in constant analyser energy mode with a pass energy of 20
eV for regions of interest, and 50 eV in survey. The core levels for O 1s and C 1s were analyzed.
The photoelectron take-off angle (the angle between the surface of the sample and the axis of the
energy analyzer) was 90°. The electron gun used focused on the specimen in an area close to 100
mm2. Data acquisition was performed with a pressure lower them 1 × 10⁶ Pa. The effect of the
electric charge was corrected by the reference of the carbon peak (285 eV). The deconvolution of
spectra was performed with the XPSPEAK41 program, in which a peak fitting was performed
using Gaussian–Lorentzian peak shape and Shirley type background subtraction.
3.3.2.2.2 Raman spectroscopy
The unpolarized Raman spectra of GNP-C, GNP-M, GNP-M-ox-1:3 and GNP-M-ox-1:6 powders
were obtained under ambient conditions, in several positions for each sample. The linear
polarized 514.5 nm line of an Ar+ laser was used as excitation. The Raman spectra were recorded
in a backscattering geometry by using a confocal Olympus BH-2 microscope with a 50×
objective. The spatial resolution is about 2 μm, and laser power was 15 mW. The scattered
radiation was analysed using a Jobin–Yvon T64000 triple spectrometer, equipped with a charge-
coupled device. The analysis diameter was 10 μm and spectral resolution was better than 4 cm−1.
The spectra were quantitatively analysed by fitting a sum of damped oscillator to the experimental
data, according to the equation:
N
j ojoj
ojoj
ojATnBTI1
22222
2
)()),(1()(),(
(1)
Here ),( Tn is the Bose-Einstein factor: ojA , oj and oj are the strength, wave number
and damping coefficient of the j-th oscillator, respectively, and )(B is the background. In this
GBMs biocompatibility – effect of particle size and degree of oxidation
Artur M. Pinto – Jan 2017 57
work, the background was well simulated by a linear function of the frequency, which enable us
to obtain reliable fits of equation (1) to the experimental data. The fitting procedure was
performed for all Raman bands collected from the same sample, but in different positions. This
procedure allows us to determine the average and standard deviation (SD) values of the phonon
parameters, namely the wave number and intensity. [29]
3.3.2.2.3 Thermogravimetric analysis (TGA)
Thermal stability of samples was determined with a Netzsh STA 449 F3 Jupiter device. Sample
amounts ranged from 10 to 12 mg. The thermograms were recorded between 50 and 800 °C at a
heating rate of 10 °C min−1 under nitrogen flow.
3.3.3 GBMs biocompatibility
GBMs were sterilized in ethanol by dispersion and sonication during 20 min (Bandelin Sonorex
RK 512 H). Materials were dried in a vacuum oven overnight at 50 °C under sterile conditions.
GBMs were redispersed in appropriate volume of phosphate buffered saline (PBS, pH 7.4) or cell
culture medium.
3.3.3.1 Hemolysis assay
Red blood cells (RBCs) were isolated from buffy coats (obtained from Immunohemotherapy
Service, Hospital S. João, Porto, Portugal), as described previously. [30] Briefly, RBCs were
centrifuged over density gradient with Histopaque-1077 (Sigma–Aldrich) according to the
manufacturer's instructions. After removal of the plasma upper layer, the lower layer containing
RBC was washed three times in PBS. The purified RBCs were diluted to a concentration of 2 ×
108 cells mL−1 and 100 μL of RBCs were placed in round bottom 96 wells polypropylene
microtiter plates. Next, 100 μL of GNP dispersions were added to the wells and incubated for 3 h
at 37 °C and 80 rpm. Afterwards, 96-well plates were centrifuged at 4000 rpm for 15 min to
collect supernatant, which was transferred (80 μL) from each well to black polypropylene 96
wells microtiter plates for absorbance reading. Absorbance was read at 380, 415, and 450 nm
using a micro-plate reader spectrophotometer (Bioteck Plate Reader, Synergy MX). The amount
of hemoglobin (Hb) is calculated as follows: Hb value of sample (mg dL−1) = [[2 × A415 − (A380
+ A450)] × 1000 × Dilution factor]/(E), where A415, A380, A450 are the absorbance values at
415, 380, and 450 nm, respectively. A415 is the Soret band absorption of Hb and A380, A450 are
correction factors of uroporphyrin whose absorption falls under the same wavelength range. E is
the molar absorptivity of oxyhemoglobin at 415 nm, which is 79.46. The hemolytic potential of
GNP was calculated as follows: Hemolysis (%) = Hb value of sample/Total Hb value × 100,
Chapter 3
58 Artur M. Pinto – Jan 2017
where total Hb value corresponds to 100% hemolysis with Triton 1% (Sigma Aldrich, X100). [31]
GBMs concentrations tested were 100, 200 and 500 μg mL−1. Controls with PBS (lysis negative
control) and Triton 1% in PBS (positive control for 100% hemolysis) were performed.
Additionally, controls with only GBMs in PBS were performed for each concentration tested. All
assays were performed in triplicate and repeated 3 times.
3.3.3.2 Biocompatibility with cell line
Human foreskin fibroblasts HFF-1 (from ATCC) where grown in DMEM+ (Dulbecco's modified
Eagle's medium (DMEM, Gibco) supplemented with 10% (V/V) foetal bovine serum (Gibco) and
1% (V/V) penicillin/streptomycin (biowest) at 37 °C, in a fully humidified air containing 5%
CO2. The media were replenished every 3 days. When reaching 90% confluence, cells were
rinsed with PBS (37 °C) and detached from culture flasks (TPP®) using 0.25% (w/V) trypsin
solution (Sigma Aldrich) in PBS. For all assays, HFF-1 cells were seeded at a density of 2 × 10⁴
cells mL−1 in 96 well plates or in 8 chamber Lab-Tek-II. Upon subconfluence (24 h), DMEM+
was removed and cells incubated with increasing concentrations of GBMs in DMEM+ (1–100 μg
mL−1) for 24, 48, and 72 h. At indicated time-points, cells were observed in an inverted
fluorescence microscope (Carl Zeiss – Axiovert 200) and phase contrast images were acquired.
All experiments were performed using cells between passages 10 to 14.
HPMEC-ST1.6R cells (from ATCC) were cultured in culture flasks (TPP®) treated with 0.2%
gelatine (Sigma) in medium M199+ (M199 medium (Sigma–Aldrich) supplemented (M199+)
with 20% (V/V) foetal bovine serum (FBS), 2 mM Glutamax I, 100 U/100 μg mL−1 Pen/Strep,
(all Gibco Invitrogen), 25 μg mL−1 sodium heparin (Sigma–Aldrich), 25 μg mL−1 endothelial cell
growth supplement (ECGS, Becton Dickinson), and 50 μg mL−1 G-418 (Gibco, Invitrogen). For
resazurin assay, HPMEC cells were seeded at a density of 2 × 10⁴ cells mL−1 in 96 well plates
coated with 0.2% gelatine. Upon subconfluence (24 h), M199+ was removed and cells incubated
with increasing concentrations of GBMs in M199+ (10–100 μg mL−1) for 24, and 72 h. At
indicated time-points, cells were observed in an inverted fluorescence microscope (Carl Zeiss –
Axiovert 200) and phase contrast images were acquired. All experiments were performed using
cells between passages 26 to 37.
3.3.3.2.1 Cytotoxicity assays
Cell metabolic activity was quantified by resazurin assay at 24, 48, and 72 h of incubation.
Briefly, 20 μL (1 mg mL−1) resazurin (Sigma Aldrich) solution in PBS was added to each well.
Cells were incubated for 3 h and fluorescence (λex/em = 530/590 nm) read in a micro-plate reader
spectrophotometer. Negative control for metabolic activity decrease was performed incubating

GBMs biocompatibility – effect of particle size and degree of oxidation
Artur M. Pinto – Jan 2017 59
cells with DMEM+ and positive control incubating with Triton 0.1 wt.%. Cell metabolic activity
(%) was calculated as follows: Fluorescence of sample/Fluorescence of negative control * 100.
Controls were performed with materials only (without cells) dispersed in DMEM+, for all
concentrations tested. All assays were performed in sextuplicate and repeated 3 times.
Cell viability/membrane integrity was evaluated by LIVE/DEAD assay. Hoechst 33342 permeates
membrane and stains nucleic acids. Calcein also permeates membrane and is metabolized in
cytoplasm by intracellular esterases originating a green highly fluorescent derivative. Cell
membrane has residual permeability to propidium iodide, which only enters cells whose
membrane integrity is compromised, staining nucleic acids. At 24, 48 and 72 h DMEM+ was
removed and cells incubated with Hoechst 33342 (Molecular Probes) and Calcein (Molecular
Probes), both at 2.5 μg mL−1 in PBS for 15 min, at 37 °C in the dark. Then, propidium iodide (PI)
(Sigma Aldrich) in PBS was added to each well to a final concentration of 1.25 μg mL−1 and
images acquired in an inverted fluorescence microscope (Carl Zeiss – Axiovert 200). Cell death
(%) was calculated as follows: number of cells stained with PI/number of cells stained with
Hoechst 33342 * 100. All assays were performed in triplicate and repeated 3 times.
TMRE (tetramethylrhodamine, ethyl ester) Mitochondrial Membrane Potential (MMP) Assay Kit
(Abcam, ab113852) was used to measure MMP of HFF-1 cells according to manufacturer's
instructions. HFF-1 cells were seeded in 96-well plates and exposed to GBMs at concentrations
from 10 to 100 μg mL−1, for 48 h. Then, cells were rinsed 3× with DMEM+ to assure no
interference from materials in fluorescence determination and were loaded with 500 nM TMRE in
DMEM+ for 30 min at 37 °C. Cells were rinsed once with BSA 0.2 wt.% in PBS and fluorescence
(λex/em = 549/575 nm) read in a micro-plate reader spectrophotometer. Negative control for
MMP decrease was performed with cells cultured in culture medium (DMEM+), as positive
control for MMP decrease cells were exposed to carbonyl cyanide m-chlorophenylhydrazone
(CCCP) 20 μM for 15 min. MMT (%) was calculated as follows: Fluorescence of
sample/Fluorescence of negative control for MMP decrease * 100. Controls were performed with
materials only (without cells) dispersed in DMEM+ for all concentrations tested and revealed
similar fluorescence to DMEM+. All assays were performed in triplicate and repeated 3 times.
Cells were prepared for image acquisition in an inverted fluorescence microscope (Carl Zeiss –
Axiovert 200), following the same procedure, but incubating with 500 nM TMRE and Hoechst
33342 (2.5 μg mL−1), to allow observation of cell nuclei on cells with decreased MMP.
3.3.3.2.2 Intracellular ROS evaluation
Chloromethyl-2′,7′-dichlorodihydrofluorescein diacetate (CM-H2DCFDA) is a chloromethyl
derivative of H2DCFDA, useful as an indicator for reactive oxygen species (ROS) in cells. It
passively diffuses into cells, where its acetate groups are cleaved by intracellular esterases

Chapter 3
60 Artur M. Pinto – Jan 2017
originating a highly fluorescent derivative (DCF) and its thiol-reactive chloromethyl group reacts
with intracellular glutathione and other thiols. The fluorescence intensity is proportional to the
ROS levels within the cell cytosol.
HFF-1 cells were seeded as previously described and, after reaching a state of subconfluence (24
h), washed with PBS at 37 °C and incubated 45 min at 37 °C with 95 μL CM-DCFH-DA
(Molecular Probes) at a concentration of 2 μg mL−1. The reagent was removed and cells incubated
at 37 °C for 1 h, with 150 μL GBMs dispersed in PBS (1, 10, and 50 μg mL−1). Finally, 100 μL
Triton 1% in PBS was added to each well and fluorescence (λex/em = 480/530 nm) read in a
micro-plate reader spectrophotometer. Controls were performed with GBMs dispersed in PBS, for
all concentrations tested, incubated with the same amount of CM-H2DCFDA, in wells without
cells. PBS was used as negative control and H2O2 (Merck) 100 mM as positive control for
intracellular ROS levels increase. ROS levels were calculated as follows: ROS levels (%) =
Fluorescence of the sample/Fluorescence of negative control * 100. All assays were performed in
triplicate and repeated 3 times.
3.3.3.2.3 Immunocytochemistry
Cells in each well exposed to 50 μg mL−1 of GBMs (at 100 μg mL−1 GBMs interfere with staining
and images had worse quality) were washed with PBS. Then, fixation was performed with
paraformaldehyde (PFA – Merck) 4 wt.% in PBS for 15 min. PFA was removed, cells washed
with PBS and stored at 4 °C. Cell cytoskeletal filamentous actin can be visualized by binding of
fluorescent phalloidin and the nucleus can be stained with 4′,6-Diamidino-2-phenylindole
dihydrochloride (DAPI) that intercalates with nucleic acids. Cell membrane was permeabilized
with Triton 0.1 wt.% at 4 °C for 5 min. Washing was done with PBS and incubation performed
with phalloidin (Alexa Fluor 488; Molecular Probes) solution in PBS in a 1:80 dilution for 20 min
in the dark. After rinsing with PBS, DAPI (Sigma Aldrich) solution at 3 μg mL−1 was added to
each well and incubated for 15 min in the dark. Finally, cells were washed and kept in PBS to
avoid drying. Plates with adherent cells were observed in an inverted fluorescence microscope
(Carl Zeiss – Axiovert 200).
For evaluation of cell proliferation, Ki-67 immunocytochemistry was performed. Fixed and
permeabilized cells were incubated with a blocking solution 4 wt.% BSA and 1% (V/V) FBS for
1 h, and subsequently incubated with rabbit anti-Ki67 primary antibody (1:100) from Abcam
(ab15580) overnight. Cells were further incubated with the secondary antibody goat anti-rabbit
IgG Alexa Fluor® 488 (1:800) from Invitrogen (a11070) for 1 h. Nuclei were stained with
Nuclear Mask (Invitrogen, H10294). In order to identify possible nonspecific labelling, a negative
control was performed excluding the incubation with primary antibody. Images were acquired
using the In cell analyser 2000 6E Healthcare, equipped with an Nikon 10×/0.45 Plan Apo. Image
analysis/Ki67 quantification was performed using the software In cell investigator developer toll

GBMs biocompatibility – effect of particle size and degree of oxidation
Artur M. Pinto – Jan 2017 61
box (GE Healthcare). Ki67 positive (Ki67+) cells percentage were calculated as follows:
Ki67+(%) = Ki67+ cells/total cell number × 100.
3.3.3.2.4 Transmission electron microscopy (TEM)
After 72 h incubation, cells exposed to 100 μg mL−1 GBMs in Lab-Tek-II were fixed in 2%
glutaraldehyde (Electron Microscopy sciences, Hatfield, USA) and 4% PFA in cacodylate Buffer
0.1 M (pH 7.4), dehydrated and embedded in Epon resin (TAAB, Berks, England). Ultrathin
sections (40–60 nm thickness) were prepared on a Leica Reichert SuperNOVA Ultramicrotome
(Germany) using diamond knives (DDK, Wilmington, DE, USA). The sections were mounted on
200 mesh copper or nickel grids, stained with uranyl acetate and lead citrate for 15 min each, and
examined under a JEOL JEM 1400 TEM (Tokyo, Japan). Images were digitally recorded using a
CCD digital camera Orious 1100W (Tokyo, Japan) at the HEMS – Institute for Molecular and
Cell Biology (IBMC) of the University of Porto.
3.3.4 Statistical analysis
Statistical analysis was performed using the software Statistical Package for the Social Sciences
(SPSS 20, IBM, USA) performing Kruskal–Wallis one-way analysis of variance. Resazurin
assays were analysed performing parametric analysis of variance (ANOVA) followed by post hoc
tests Tamhane, Dunnett, and Games-Howell. Multiple means comparison were performed
between samples to identify significant differences, which were considered for p < 0.05.
3.4 Results
3.4.1 GBMs physical-chemical characterization
3.4.1.1 Physical characterization
SEM imaging of the powders (Figure 3.1) shows that GNP-C is constituted by platelets with a
length bellow 2 μm and small flakes (<0.5 μm) that form agglomerates (Fig. 3.1(A and B)). The
larger platelets have planar conformation, being constituted by few single layer sheets, while
small flakes are wrinkled and possess folded edges (Fig. 3.1(B)). This probably occurs due to the
flakes short dimensions allowing the oxygen-containing functional groups at the edges to form
hydrogen bonds, distorting the sheets. GNP-M (Fig. 3.1(C and D)) is also constituted by
agglomerated platelets. However, some agglomerates can be redispersed in liquid medium. Each
platelet is formed by stacks of few individual “graphene” sheets, assuming planar conformations
and presenting sharp edges. These platelets have a length of about 5 μm (Fig. 3.1(E and F)).

Chapter 3
62 Artur M. Pinto – Jan 2017
Figure 3.1: SEM images of dry powders of GNP-C at (A) 500×, (B) 100000×; GNP-M at (C)
500×, (E) 4000×, (F) 20000×, and (D) 100000×; GNP-M-ox-1:3 at (G) 4000×, and (H)
20000×; and of GNP-M-ox-1:6 at (I) 4000×, and (J) 20000×. Scale bars are 1 (B, D), 5 (F, H,
J), 30 (E, G, I), and 200 µm (A, C).
Oxidation of GNP-M changes its morphology. Both GNP-M-ox-1:3 (Fig. 3.1(G and H)) and
GNP-M-ox-1:6 (Fig. 3.1(I and J)) powders have sizes similar to GNP-M, however oxidized
platelets are more wrinkled and exhibit folded edges, due to formation of hydrogen bonds
between intra-platelet oxygen-containing functional groups.
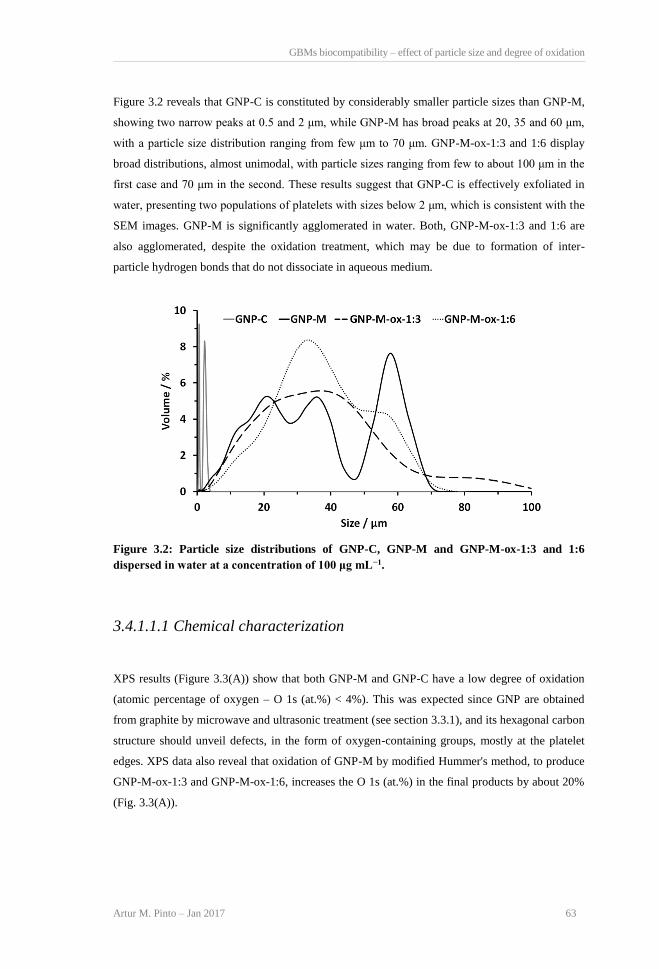
GBMs biocompatibility – effect of particle size and degree of oxidation
Artur M. Pinto – Jan 2017 63
Figure 3.2 reveals that GNP-C is constituted by considerably smaller particle sizes than GNP-M,
showing two narrow peaks at 0.5 and 2 μm, while GNP-M has broad peaks at 20, 35 and 60 μm,
with a particle size distribution ranging from few μm to 70 μm. GNP-M-ox-1:3 and 1:6 display
broad distributions, almost unimodal, with particle sizes ranging from few to about 100 μm in the
first case and 70 μm in the second. These results suggest that GNP-C is effectively exfoliated in
water, presenting two populations of platelets with sizes below 2 μm, which is consistent with the
SEM images. GNP-M is significantly agglomerated in water. Both, GNP-M-ox-1:3 and 1:6 are
also agglomerated, despite the oxidation treatment, which may be due to formation of inter-
particle hydrogen bonds that do not dissociate in aqueous medium.
Figure 3.2: Particle size distributions of GNP-C, GNP-M and GNP-M-ox-1:3 and 1:6
dispersed in water at a concentration of 100 μg mL−1.
3.4.1.1.1 Chemical characterization
XPS results (Figure 3.3(A)) show that both GNP-M and GNP-C have a low degree of oxidation
(atomic percentage of oxygen – O 1s (at.%) < 4%). This was expected since GNP are obtained
from graphite by microwave and ultrasonic treatment (see section 3.3.1), and its hexagonal carbon
structure should unveil defects, in the form of oxygen-containing groups, mostly at the platelet
edges. XPS data also reveal that oxidation of GNP-M by modified Hummer's method, to produce
GNP-M-ox-1:3 and GNP-M-ox-1:6, increases the O 1s (at.%) in the final products by about 20%
(Fig. 3.3(A)).
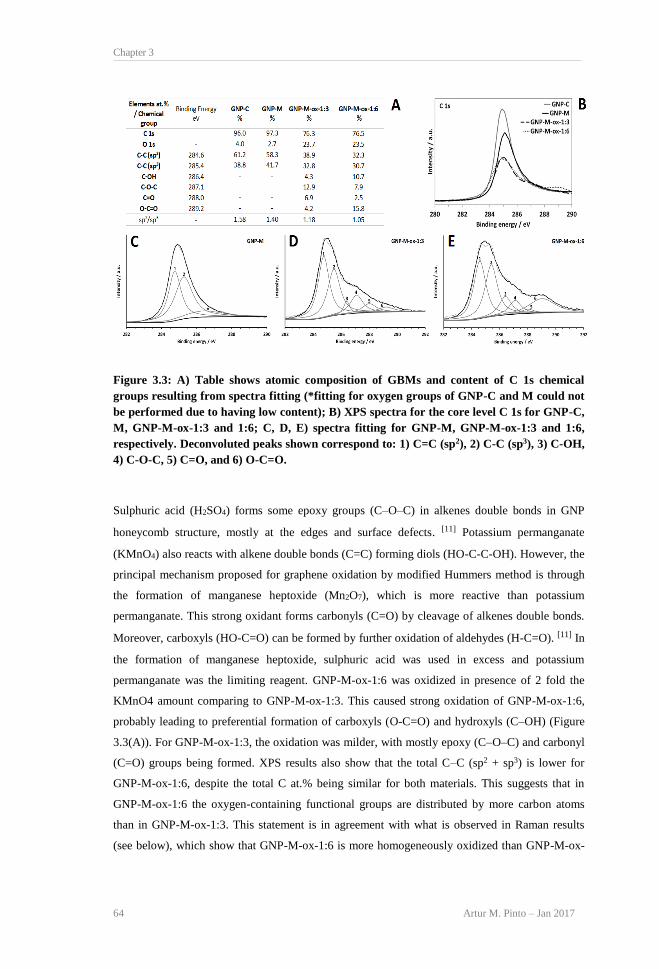
Chapter 3
64 Artur M. Pinto – Jan 2017
Figure 3.3: A) Table shows atomic composition of GBMs and content of C 1s chemical
groups resulting from spectra fitting (*fitting for oxygen groups of GNP-C and M could not
be performed due to having low content); B) XPS spectra for the core level C 1s for GNP-C,
M, GNP-M-ox-1:3 and 1:6; C, D, E) spectra fitting for GNP-M, GNP-M-ox-1:3 and 1:6,
respectively. Deconvoluted peaks shown correspond to: 1) C=C (sp2), 2) C-C (sp3), 3) C-OH,
4) C-O-C, 5) C=O, and 6) O-C=O.
Sulphuric acid (H2SO4) forms some epoxy groups (C–O–C) in alkenes double bonds in GNP
honeycomb structure, mostly at the edges and surface defects. [11] Potassium permanganate
(KMnO4) also reacts with alkene double bonds (C=C) forming diols (HO-C-C-OH). However, the
principal mechanism proposed for graphene oxidation by modified Hummers method is through
the formation of manganese heptoxide (Mn2O7), which is more reactive than potassium
permanganate. This strong oxidant forms carbonyls (C=O) by cleavage of alkenes double bonds.
Moreover, carboxyls (HO-C=O) can be formed by further oxidation of aldehydes (H-C=O). [11] In
the formation of manganese heptoxide, sulphuric acid was used in excess and potassium
permanganate was the limiting reagent. GNP-M-ox-1:6 was oxidized in presence of 2 fold the
KMnO4 amount comparing to GNP-M-ox-1:3. This caused strong oxidation of GNP-M-ox-1:6,
probably leading to preferential formation of carboxyls (O-C=O) and hydroxyls (C–OH) (Figure
3.3(A)). For GNP-M-ox-1:3, the oxidation was milder, with mostly epoxy (C–O–C) and carbonyl
(C=O) groups being formed. XPS results also show that the total C–C (sp2 + sp3) is lower for
GNP-M-ox-1:6, despite the total C at.% being similar for both materials. This suggests that in
GNP-M-ox-1:6 the oxygen-containing functional groups are distributed by more carbon atoms
than in GNP-M-ox-1:3. This statement is in agreement with what is observed in Raman results
(see below), which show that GNP-M-ox-1:6 is more homogeneously oxidized than GNP-M-ox-

GBMs biocompatibility – effect of particle size and degree of oxidation
Artur M. Pinto – Jan 2017 65
1:3. This may be due to oxidation in GNP-M-ox-1:3 having occurred predominantly at the
platelets edges. For GNP-M-ox-1:6, due to excess manganese heptoxide, oxygen-containing
functional groups were also produced throughout the platelets surfaces, despite this being less
sterically favourable than edge oxidation. [11]
The ratio between C sp2 and sp3 is lower for GNP-M than for GNP-C (Fig. 3.3(A)), because it has
higher thickness, thus more electronic delocalization trough parallel single carbon sheets. This
ratio also decreases with oxidation [32], due to the induction of defects at platelets surface by
cleavage of alkene double bonds and aldehydes oxidation to form carboxyls. Moreover, stronger
oxidation, as observed for GNP-M-ox-1:6, leads to the lowest sp2/sp3 ratio. This is in agreement
with this material being more homogenously oxidized.
As seen in Figure 3.4(A), Raman spectra obtained for GBMs powders are similar. D-band,
located between 1270 and 1450 cm−1, is assigned to the carbon lattice disorder typical of crystal
edges and defects in the graphene network. G-band close to 1580 cm−1, is associated with the sp2
hybridization. [33, 34] From the fitting procedure, we have calculated the intensity of the observed
Raman bands. It is well established that the ratio between the intensities of the D- and G-bands,
ID/G, is widely used for characterizing the defects degree in graphene materials and to evaluate
multilayered graphene crystallite size. [33] Usually, the D band is absent or week in the surface of
graphene sheets and intense in their edges. [34] For this reason, the ratio between the D- and G-
bands is higher for GNP-C, because it exhibits a smaller mean diameter than GNP-M, having
more edges in the analysis volume.
The oxidation of GNP-M lead to an increase of D-band intensity (Fig. 3.4(B)), due to disruption
of sp2 hybridization in the interior of graphene sheets due to introduction of oxygen containing
functional groups and also due to weakening of π interactions between individual sheets and
particles. [8-35] GNP-M-ox-1:3 has a lower ID/G ratio, comparing with GNP-M-ox-1:6, because in
some spectra acquired, D-band was intense but in other cases, this band presented an intensity
similar to non oxidized GNP-M. This points out for a non-uniform oxidization when a ratio of
GNP-M 1:3 KMnO4 is used, as it was discussed previously (see section 3.3.3.1.2). Opossingly, all
spectra of GNP-M-ox-1:6 present an intense D-band and a broader G-band, evidencing both
homogeneous and large degree of oxidation. Moreover, G band width slightly increases for both
oxidized materials comparing with non-oxidized GNP-M and D band width is higher for the more
oxidized GNP-M-ox-1:6 (Fig. 3.4(B)).
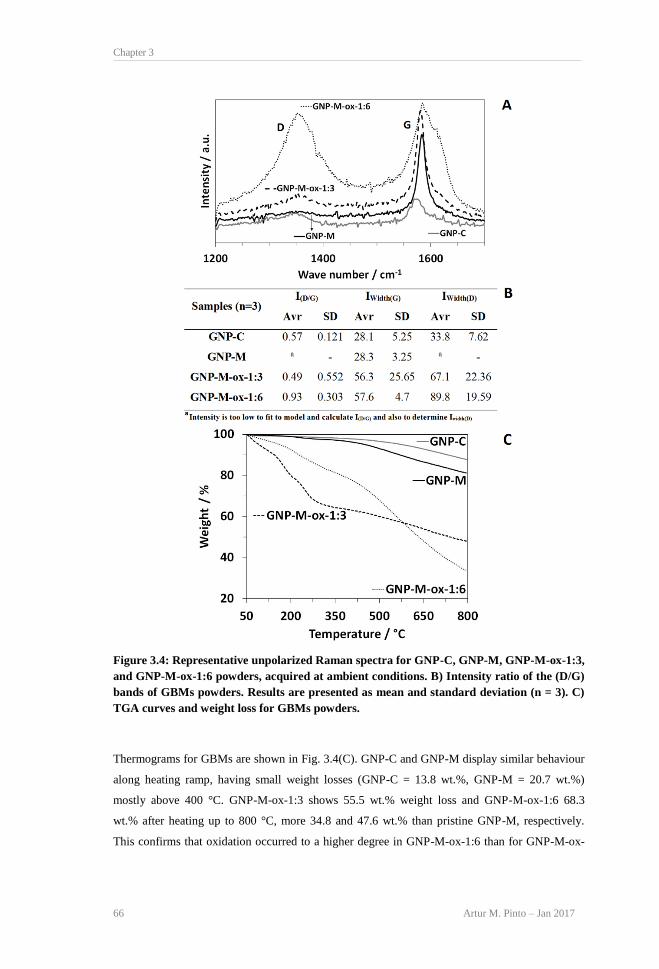
Chapter 3
66 Artur M. Pinto – Jan 2017
Figure 3.4: Representative unpolarized Raman spectra for GNP-C, GNP-M, GNP-M-ox-1:3,
and GNP-M-ox-1:6 powders, acquired at ambient conditions. B) Intensity ratio of the (D/G)
bands of GBMs powders. Results are presented as mean and standard deviation (n = 3). C)
TGA curves and weight loss for GBMs powders.
Thermograms for GBMs are shown in Fig. 3.4(C). GNP-C and GNP-M display similar behaviour
along heating ramp, having small weight losses (GNP-C = 13.8 wt.%, GNP-M = 20.7 wt.%)
mostly above 400 °C. GNP-M-ox-1:3 shows 55.5 wt.% weight loss and GNP-M-ox-1:6 68.3
wt.% after heating up to 800 °C, more 34.8 and 47.6 wt.% than pristine GNP-M, respectively.
This confirms that oxidation occurred to a higher degree in GNP-M-ox-1:6 than for GNP-M-ox-
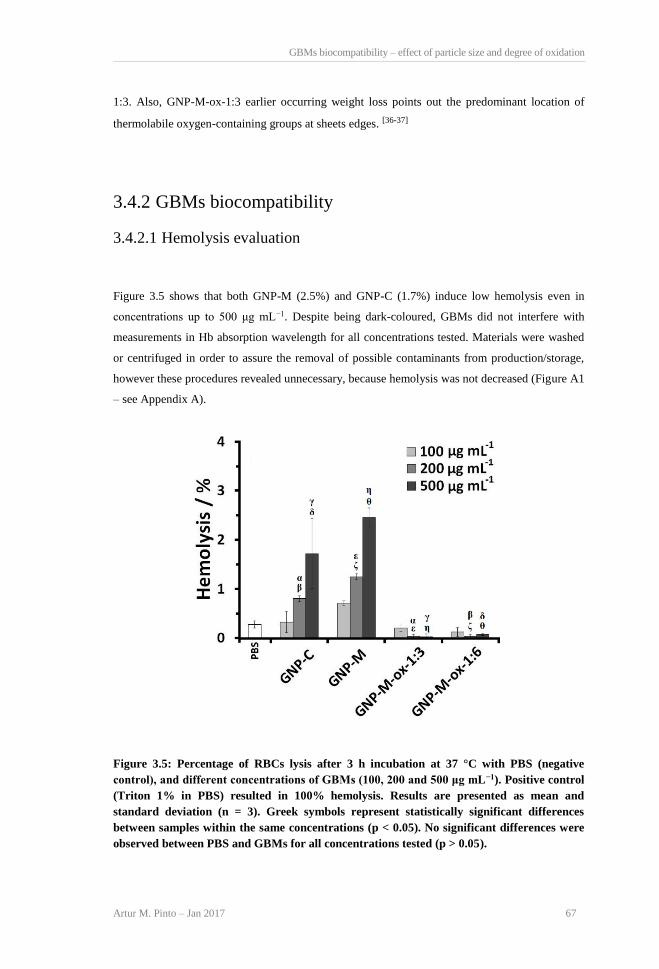
GBMs biocompatibility – effect of particle size and degree of oxidation
Artur M. Pinto – Jan 2017 67
1:3. Also, GNP-M-ox-1:3 earlier occurring weight loss points out the predominant location of
thermolabile oxygen-containing groups at sheets edges. [36-37]
3.4.2 GBMs biocompatibility
3.4.2.1 Hemolysis evaluation
Figure 3.5 shows that both GNP-M (2.5%) and GNP-C (1.7%) induce low hemolysis even in
concentrations up to 500 μg mL−1. Despite being dark-coloured, GBMs did not interfere with
measurements in Hb absorption wavelength for all concentrations tested. Materials were washed
or centrifuged in order to assure the removal of possible contaminants from production/storage,
however these procedures revealed unnecessary, because hemolysis was not decreased (Figure A1
– see Appendix A).
Figure 3.5: Percentage of RBCs lysis after 3 h incubation at 37 °C with PBS (negative
control), and different concentrations of GBMs (100, 200 and 500 μg mL−1). Positive control
(Triton 1% in PBS) resulted in 100% hemolysis. Results are presented as mean and
standard deviation (n = 3). Greek symbols represent statistically significant differences
between samples within the same concentrations (p < 0.05). No significant differences were
observed between PBS and GBMs for all concentrations tested (p > 0.05).

Chapter 3
68 Artur M. Pinto – Jan 2017
No significant differences in hemolysis were observed between GNP-M and GNP-C for all
concentrations tested (p > 0.05). The oxidation of GNP-M, significantly reduced hemolysis ratio
for both GNP-M-ox-1:3 and 1:6 for the higher concentrations tested of 200 and 500 μg mL−1 (Fig.
3.5). As an example, for 500 μg mL−1, GNP-M hemolysis was 2.5%, GNP-M-ox-1:3 0.04% and
1:6 0.08%. This can be explained by the presence of oxygen-containing functional groups at
sheets edges causing folding, therefore reducing the occurrence of physical damages to cells.
3.4.2.2 Biocompatibility with fibroblasts
After verifying that the materials do not show relevant toxic effects towards RBCs, further assays
were performed to evaluate their effect when in direct contact with human foreskin fibroblasts
(HFF-1). Phase contrast images were obtained for each time and concentration tested,
representative images are shown in Figure A2. Further characterization was performed and
described below.
3.4.2.2.1 Cytotoxicity
Considering that a sample has cytotoxic potential if its metabolic activity is reduced to less than
70% comparing to negative control for metabolic activity decrease (cells incubated with
DMEM+) [ISO 10993-5:2009(E)], it can be observed from Figure 3.6(A) that both GNP-M and
GNP-C are potentially non-toxic up to a concentration of 20 μg mL−1, until 72 h. GNP-C is toxic
at 24 h for concentrations above 20 μg mL−1. However, cell metabolic activity recovered over
time, and at 48 h toxicity is only present above 50 μg mL−1. At 72 h the results show toxicity only
slightly above the limit of 70% for 100 μg mL−1. For GNP-M, toxicity occurs at 24 h above 50 μg
mL−1. At 48 and 72 h, toxicity is observed above 20 μg mL−1. These results are in agreement with
conclusions from our previous review on graphene-based materials (GBMs) biocompatibility, in
which most analysed studies reported cell viability decreases inferior to 20% after exposure to
GBMs concentrations around 10 μg mL−1 during 24 h or longer. [23]
GNP-M-ox-1:3 unveils a toxicity profile similar to GNP-M, while GNP-M-ox-1:6
biocompatibility is greatly improved. This occurs because GNP-M-ox-1:3 oxidization was not as
uniform as for GNP-M-ox-1:6, which is only slightly toxic (viability ≈ 69%, SD = 5.1%) at 24 h
for 100 μg mL−1, however at 48 and 72 h of incubation, no toxicity is observed. Controls
performed with materials dispersed in DMEM+ without cells, for all concentrations tested,

GBMs biocompatibility – effect of particle size and degree of oxidation
Artur M. Pinto – Jan 2017 69
presented similar values to DMEM+, suggesting that the materials tested did not interfere with
fluorescence determinations.
Figure 3.6: A) HFF-1 cells viability after incubation with GBMs in DMEM+, at 24, 48 and
72 h. Cell metabolic activity is represented as percentage in comparison with cells cultured
in DMEM+ (100%). Results are presented as mean and standard deviation (n = 6). The red

Chapter 3
70 Artur M. Pinto – Jan 2017
line at 70%, marks the toxicity limit, according to ISO 10993-5:2009(E). Statistical analysis
is presented in Table A1. B) Percentage of HFF-1 cell death after 72 h of incubation with
GBMs. Cell death percentage was corrected by subtraction of the value for cells cultured in
DMEM+ (negative control for cell death). Results are presented as mean and standard
deviation (n = 3). Statistically significant differences, analysed within each concentration
between all GBMs are represented by c – GNP-C, m – GNP-M, 1:3 – GNP-M-ox-1:3
(differences were only found comparing with GNP-M-ox-1:6); Differences comparing with
DMEM+ are represented by Ø. Symbols not underlined represent p < 0.05, for p < 0.01
signs are underlined.
Results are also presented in terms of fluorescence intensity values, so that the increase of cell
metabolic activity over time can be observed in Figure A3. It also provides images of the cells
incubated with culture medium and GBMs for a concentration of 100 μg mL−1, showing an
increase of cell density from 24 to 72 h.
For evaluation of cell proliferation, Ki-67 assay was performed. Ki-67 is a nuclear antigen present
at all stages of the cell cycle, except G0 when cells are in the resting state. [38, 39] Results
presented in Figure A5 revealed that there is significant decrease in cell proliferation for GNP-C
100 μg mL−1 at 24 h comparing with control (p < 0.05), followed by a recovery of the
proliferative capacity of the cells at 48 h and 72 h. These results are in agreement with the
metabolic activity assay obtained for this condition. Importantly, as for the other conditions
tested, an increase of cell proliferation has been observed from 24 to 72 h for 50 and 100 μg mL−1
concentrations.
Resazurin assay was also performed with HPMEC (Human Pulmonary Microvascular Endothelial
Cells). The results showed the same trend as for HFF-1, with GNP-M and GNP-M-ox-1:3 being
the most toxic materials, while GNP-M-ox-1:6 showed no toxicity. Also, GNP-C presented initial
mild toxicity which was recovered over time. Detailed results are presented as supplementary data
in Figure A7.
Figure A4 show example images for HFF-1 cells fluorescently labelled for LIVE/DEAD assay.
As expected, positive control of cell death (cells incubated with Triton 0.1 wt.% in DMEM+ for
72 h) unveils 100% cell death. Negative control was performed incubating cells with DMEM+,
presenting mostly live cells with scarce dead cells.
Fig. 3.6(B) shows that cell death is below 11% for all materials tested. The resazurin assays
showed larger metabolic activity decreases. A possible explanation for this difference is that
metabolic activity decreased in some cells, despite possessing intact membranes, avoiding being
stained by PI. GNP-M exhibits higher cell death values than GNP-C for all concentrations tested,
but no significant differences were observed (p > 0.05). However, GNP-C only reveals
significantly higher cell death than DMEM+ for 100 μg mL−1 (p < 0.05), while GNP-M presents it
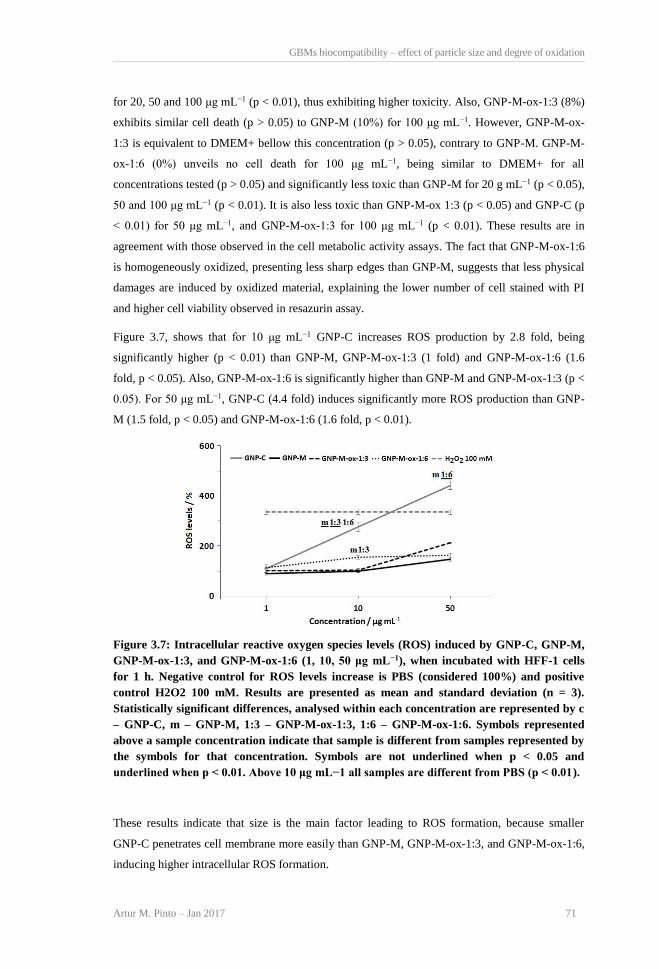
GBMs biocompatibility – effect of particle size and degree of oxidation
Artur M. Pinto – Jan 2017 71
for 20, 50 and 100 μg mL−1 (p < 0.01), thus exhibiting higher toxicity. Also, GNP-M-ox-1:3 (8%)
exhibits similar cell death (p > 0.05) to GNP-M (10%) for 100 μg mL−1. However, GNP-M-ox-
1:3 is equivalent to DMEM+ bellow this concentration (p > 0.05), contrary to GNP-M. GNP-M-
ox-1:6 (0%) unveils no cell death for 100 μg mL−1, being similar to DMEM+ for all
concentrations tested (p > 0.05) and significantly less toxic than GNP-M for 20 g mL−1 (p < 0.05),
50 and 100 μg mL−1 (p < 0.01). It is also less toxic than GNP-M-ox 1:3 (p < 0.05) and GNP-C (p
< 0.01) for 50 μg mL−1, and GNP-M-ox-1:3 for 100 μg mL−1 (p < 0.01). These results are in
agreement with those observed in the cell metabolic activity assays. The fact that GNP-M-ox-1:6
is homogeneously oxidized, presenting less sharp edges than GNP-M, suggests that less physical
damages are induced by oxidized material, explaining the lower number of cell stained with PI
and higher cell viability observed in resazurin assay.
Figure 3.7, shows that for 10 μg mL−1 GNP-C increases ROS production by 2.8 fold, being
significantly higher (p < 0.01) than GNP-M, GNP-M-ox-1:3 (1 fold) and GNP-M-ox-1:6 (1.6
fold, p < 0.05). Also, GNP-M-ox-1:6 is significantly higher than GNP-M and GNP-M-ox-1:3 (p <
0.05). For 50 μg mL−1, GNP-C (4.4 fold) induces significantly more ROS production than GNP-
M (1.5 fold, p < 0.05) and GNP-M-ox-1:6 (1.6 fold, p < 0.01).
Figure 3.7: Intracellular reactive oxygen species levels (ROS) induced by GNP-C, GNP-M,
GNP-M-ox-1:3, and GNP-M-ox-1:6 (1, 10, 50 μg mL−1), when incubated with HFF-1 cells
for 1 h. Negative control for ROS levels increase is PBS (considered 100%) and positive
control H2O2 100 mM. Results are presented as mean and standard deviation (n = 3).
Statistically significant differences, analysed within each concentration are represented by c
– GNP-C, m – GNP-M, 1:3 – GNP-M-ox-1:3, 1:6 – GNP-M-ox-1:6. Symbols represented
above a sample concentration indicate that sample is different from samples represented by
the symbols for that concentration. Symbols are not underlined when p < 0.05 and
underlined when p < 0.01. Above 10 μg mL−1 all samples are different from PBS (p < 0.01).
These results indicate that size is the main factor leading to ROS formation, because smaller
GNP-C penetrates cell membrane more easily than GNP-M, GNP-M-ox-1:3, and GNP-M-ox-1:6,
inducing higher intracellular ROS formation.

Chapter 3
72 Artur M. Pinto – Jan 2017
Controls performed with GBMs dispersed in PBS, incubated with CM-H2DCFHDA in wells
without cells, present similar values to PBS only, incubated with the indicator. Thus, GBMs do
not interfere in ROS quantification method used.
Mitochondrial membrane potential (MMP) was evaluated for GBMs at concentrations between 10
and 100 μg mL−1, with 48 h incubation. It was observed to be decreased for both GNP-M and
GNP-M-ox-1:3 for concentrations above 10 μg mL−1 and for GNP-C above 50 μg mL−1. For
GNP-M-ox-1:6 no significant differences in MMP were perceptible (p > 0.05) comparing with
cells cultured in DMEM+. Detailed results are presented in Figure A6.
3.4.2.2.2 Cell morphology and interaction with GBMs
After the resazurin assays, cells exposed to 50 μg mL−1 of GBMs were stained and observed (at
100 μg mL−1 GBMs interfere with staining and images had lower quality). Immunofluorescence
images (Figure 3.8) show that for toxicity positive control (Triton 0.1% in DMEM+), cells
cytoskeleton was disassembled. A control was performed with cells cultured in DMEM+, which
exhibited the typical “spindle” like shape of fibroblasts. After 72 h of incubation with 50 μg mL−1
GNP-C, cells exhibit a normal morphology, similar to negative control. For GNP-M, the cell
density is lower, with some cells showing altered morphology and being weakly attached to the
bottom of the well. Similar images were obtained for GNP-M-ox-1:3. However, for GNP-M-ox-
1:6, cell morphology is normal and similar to cell cultured in DMEM+. As expected, these results
are in agreement with those observed in cell viability assays results (see section 3.3.3.2.2.1) at 72
h for all materials.
TEM images (Figure 3.9(B)) show that GNP-C interacts with plasma membrane, being
internalized without causing membrane damages, probably by pinocytosis. GNP-C is found often
in cytoplasm, being able to interact with mitochondria (Fig. 3.9(C)), which may induce ROS
production (see section 3.3.3.2.2.1). Sometimes, GNP-M causes cell membrane damage (Fig.
3.9(D)), entering cells and being found inside plasma membrane (Fig. 3.9(E)). However, this
seems to be less frequent than for GNP-C. It is not clear if internalization always occurs by
membrane rupture or other mechanism. GNP-M-ox-1:3 interacts with plasma membrane, being
internalized and forming vesicles in cytoplasm. The internalization process occurs both with and
without causing membrane damages (Fig. 3.9(F)). GNP-M-ox-1:6 was found not to cause
membrane damages (Fig. 3.9(G)), probably do to having less sharp edges. However, it was found
inside cells in some cases (Fig. 3.9(H)). For all materials, the internalized particles had sizes from
hundreds of nanometres to 5 μm. Internalized agglomerated particles have therefore not been
observed.

GBMs biocompatibility – effect of particle size and degree of oxidation
Artur M. Pinto – Jan 2017 73
Figure 3.8: Representative immunofluorescence images of HFF-1 cells after 72 h incubation
with 50 μg mL−1 of GNP-C, GNP-M, GNP-M-ox-1:3 and GNP-M-ox-1:6. Triton 0.1% in
DMEM+ was used as positive control for changed morphology and cells grown in DMEM+
as negative control. Cells were stained with DAPI (nuclei) – blue and Phalloidin (F-actin in
cytoskeleton) – green. Scale bar represents 200 μm.
Figure 3.9: TEM images of HFF-1 cells incubated for 72 h with 100 μg mL−1 GBMs. A, B –
DMEM+, C – GNP-C (a – particle interacting with plasma membrane (pm), b – particle
internalized and in contact with plasma membrane, c – particle inside a vesicle (vs) in
cytoplasm), D – GNP-C particles spread in cytoplasm and interaction with a mitochondria
(mt), E − Membrane rupture (white arrow) and cytoplasmic content leakage caused by
GNP-M particle, F – GNP-M in cytoplasm (nc – nucleus), G – GNP-M-ox-1:3 (a –

Chapter 3
74 Artur M. Pinto – Jan 2017
interacting with plasma membrane, b – entering through plasma membrane, c – vesicle
containing an internalized particle), H – GNP-M-ox-1:6 particle in contact with plasma
membrane causing no damages, I – GNP-M-ox-1:6 inside cytoplasm. Scale bar represents
0.5 μm for all images except for image A, in which it represents 2 μm.
3.5 Discussion
The particle size distribution of GBMs dispersed in water was determined to evaluate their
agglomeration state in conditions similar to those used in the biocompatibility assays. After
sonication, agglomerated fractions were identified for all materials except GNP-C. The oxidation
of GNP-M to GNP-M-ox-1:3 and 1:6 slightly reduced agglomeration, as expected due to
increased hydrophilicity. However, it was observed by optical microscopy that over time all
materials sediment on the bottom of the wells contacting with the cells. This can be explained by
the presence of more oxygen-containing functional groups, allowing hydrogen bonds between
GNP particles. Despite agglomerates with considerable size being present, TEM images show that
only small platelets and agglomerates, with diameters bellow 5 μm, are internalized.
To our knowledge, a complete characterization of the in vitro biological effect of materials
oxidized to different degrees, comparing with the base GBM, has not been performed until date.
For this reason, the oxidation degree of the materials and the functional groups present were
studied with particular attention. GNP-M-ox-1:6 was oxidized in higher extension and more
homogeneously than GNP-M-ox-1:3, because of the higher amount of KMnO4 used. Also, more
sp2 disruption is observed for GNP-M-ox-1:6 due to more effective introduction of oxygen-
containing functional groups in GNP-M surface. GNP-M-ox-1:3 was preferentially oxidized in
platelets edges, because peripheral oxidation demands lower amount of KMnO4. Finally, different
amounts of oxygen-containing functional groups were introduced in both materials, GNP-M-ox-
1:3 presenting mostly epoxides and carbonyls and GNP-M-ox-1:6 carboxyls and hydroxyls.
No toxicity (0.1% lysis) was caused by both oxidized materials in RBCs, while for the original
GNP-M, 2.5% hemolysis occurred after 3 h incubation with high concentrations of 500 μg mL−1.
The published literature on this topic is scarce and shows that hemocompatibility is dependent on
the particular GBMs considered. Dong et al. observed that functionalization of GO with
carboxylic groups improved its hemocompatibility. [40] Sasidharan et al. reported that both
pristine bilayer graphene (p-G) obtained by chemical oxidation of graphite and thermal
exfoliation, and carboxyl-functionalized graphene (f-G) by mild chemical oxidation were
nonhemolytic (hemolysis ≈ 0.2%) up to a tested concentration of 75 μg mL−1 with incubations of
3 h at room temperature. [31] Liao et al. [41] performed hemolysis assays for GO (C at.% 2:1 O

GBMs biocompatibility – effect of particle size and degree of oxidation
Artur M. Pinto – Jan 2017 75
at.%) obtained by a MHM from graphite and GS – graphene sheets (C at.% 7:1 O at.%) obtained
from GO by hydrothermal treatment. They observed that GO caused about 80% hemolysis and
graphene sheets (GS) about 15%, for the higher concentration tested of 200 μg mL−1, for the same
incubation time.
Metabolic activity of two cell lines (HFF-1 and HPMEC) exposed to different concentrations of
GBMs over time was evaluated. These models were chosen because they are human non-
cancerous cell lines, from tissues that may be exposed to GBMs in case of either dermal contact
or inhalation, respectively for HFF-1 and HPMEC. To the best of our knowledge,
biocompatibility of HPMEC exposed to GBMs has never been reported. The results show similar
toxicological profile for GBMs in contact with both cell lines. GNP-M-ox-1:3 causes a decrease
of HFF-1 cells metabolic activity similar to the base material GNP-M. However, the more
homogeneously oxidized GNP-M-ox-1:6 is biocompatible up to the highest concentration tested
(100 μg mL−1). Hong et al. [42] observed that GO (produced by MHM from graphite (1:3
KMnO4), O at.% = 38%, hydrodynamic diameter (HD) = 200 nm) caused a decrease in HeLa
cells metabolic activity of about 15% and 25%, respectively for 48 h incubations with 10 and 100
μg mL−1. When this material was re-oxidized by the same method (G2xO – O at.% of 54%, HD =
200 nm), the metabolic activity decreased about 5% and 25% for 10 and 100 μg mL−1 (48 h),
respectively. Comparing with our work, GO and G2xO are nanometric, while GNP-M, GNP-M-
ox-1:3 and 1:6 are in the micrometer range. Thus, the biologic relevance of oxidation may be
different.
GNP-M-ox-1:6 causes no metabolic activity decrease, contrary to GNP-M-ox-1:3. With a more
extensive and homogeneous oxidation, GNP-M sharp edges fold, by formation of intra-platelet
hydrogen bonds, causing much less damage to cell membrane and structures. However, GNP-M-
ox-1:6 is also found inside cells, pointing out to a non-disruptive internalization mechanism.
These results are in agreement with immunocytochemistry observations of normal cell
morphology for GNP-M-ox-1:6, contrarily to GNP-M and GNP-M-ox-1:3. Also, LIVE/DEAD
assay shows lower cell death for GNP-M-ox-1:6, comparing with GNP-M. The fact that GNP-M-
ox-1:6 causes no damage on cell structure was confirmed by a non-reduced cell metabolic activity
at all concentrations, comparing with cells cultured in DMEM+, contrary to GNP-M and GNP-M-
ox-1:3, which revealed decreases for concentrations above 10 μg mL−1. Sasidharan et al. [43]
observed Vero cells in contact with f-G to have higher cell metabolic activity (comparing to
control with culture medium) than the originally toxic hydrophobic material (p-G), which
presented a metabolic activity of 60% for a concentration 100 μg mL−1 and 24 h incubation. Also,
Liao et al. [41] studied the biocompatibility of a hydrophilic and a hydrophobic GBM using human
skin fibroblasts. They tested GO with an HD in deionized water of about 0.7 μm and GS with 3
μm. It should be noted that as in our work, the same GBM presented larger HD in the reduced

Chapter 3
76 Artur M. Pinto – Jan 2017
form in relation to the oxidized material, due to agglomeration. Using the WST assay, the
metabolic activity values for GO were of 88% and for GS of 20% for 24 h incubations with 50 μg
mL−1 concentrations. Thus, based on the current studies, it can be concluded that the oxidation of
a hydrophobic GBM often improves its biocompatibility. Actually, GNP-M-ox-1:6 has increased
metabolic activity, comparing with negative control (cells cultured in DMEM+) at 24 h for 100 μg
mL−1, and at 72 h for 50 μg mL−1 and above. This suggests a favourable effect on cell
proliferation. Such was confirmed by evaluating cell proliferation, which showed to significantly
increase (p < 0.05), not only for GNP-M-ox-1:6, but for all GBMs at 72 h, for the higher
concentration – 100 μg mL−1, comparing with DMEM+. This points out that GNP-M-ox-1:6 is
not toxic at higher concentrations, opposing to other GBMs. Interestingly, Ruiz et al. [44]
observed that mammalian colorectal adenocarcinoma HT-29 cells attached and proliferated more
efficiently in GO coated glass slides, than in control (glass slides).
An interesting aspect that is lacking from existing studies on GBMs biocompatibility has to do
with the effect of particle size on the biocompatibility of hydrophobic GBMs. For this reason,
biocompatibility tests were also performed for GNP-C, which exhibits smaller size than GNP-M
and completely exfoliates in aqueous medium in particles with HDs of about 0.5 and 2 μm. GNP-
C seems to lead to lower (1.7%) Hb leakage from RBCs than GNP-M (2.5%) for 3 h incubation
with a high concentration of 500 μg mL−1. However, these differences are not statistically
significant (p > 0.05). Liau et al. [41] compared the hemolytic activity of GO with different sizes,
produced by ultrasounds fragmentation of the base GO. They conclude that after 30 min
sonication, GO decreased size by half to about 0.8 μm and caused higher hemolysis than the
original material, which was already hemolytic. Liau et al. [41] also observed that no hemolysis
was observed after coating the most hemolytic GO with chitosan, due to prevention of toxic
interactions of RBCs with materials. Thus, polymer coating is a method that can be tried to
improve GBMs biocompatibility.
Higher decreases on cell metabolic activity were observed for GNP-C at 24 h than for GNP-M.
However, at 48 and 72 h GNP-M decreases metabolic activity more than GNP-C. This can be
explained by GNP-C inducing more ROS production than GNP-M in the initial contact with cells
(1 h incubation), causing early toxicity at 24 h, from which cells recover over time. Sasidharan et
al. observed highly increased ROS levels in Vero cells for p-G, unfortunately f-G was not tested.
However, Liao et al. [41] observed a 9-fold increase (control: cells with no GBMs) in ROS
production for GO, comparing to GS (about 1.3 fold). For GNP-M, metabolic activity decreases
with incubation time, because physical damages are caused on cell membranes, by the platelets'
sharp edges. LIVE/DEAD results show that GNP-M causes 3-fold more cell death than GNP-C.
Additionally, immunocytochemistry images show that cells incubated with GNP-C display
normal cell morphology, as opposed to cells incubated with GNP-M. In fact, the latter particles

GBMs biocompatibility – effect of particle size and degree of oxidation
Artur M. Pinto – Jan 2017 77
were found to cause cell membrane rupture by TEM. GNP-C particles, on the other hand, were
found inside cells, in higher quantities, without evidence of damages, despite an observed
occurrence of interaction with cell membrane. To our knowledge it is the first time different types
of GBMs interaction, internalization and effects in non-phagocytic or cancer line cells is shown in
TEM images. Lamel et al. [25] observed that graphene oxide (GO) and carboxyl graphene
nanoplatelets (CXYG) penetrate through the plasma membrane of Hep G2 (human hepatocellular
carcinoma) cells into the cytosol, are concentrated and encapsulated in intracellular vesicles. They
also observed that exposure to GO (HD ≈ 0.4 μm) and CXYG (HD ≈ 1.7 μm) nanoplatelets
results in high intracellular ROS levels by perturbation of mitochondrial structure and function.
GNP-C (HD ≈ 0.5 and 2 μm) caused high increases of ROS levels and was found spread in
cytoplasm close to mitochondria. However, as mentioned above, this material did not cause
membrane damages. GNP-M-ox-1:6, which was internalized, did not cause observable membrane
damages, despite having a particle size distribution around 35 μm. It must be noted, however, that
only particles bellow 5 μm were found in cytoplasm for all materials tested.
Since GNP-C induces higher ROS production than the other materials and was found close to
mitochondria, mitochondrial membrane potential (MMP) was evaluated. However, since a
decrease on MMP was observed not only for GNP-C, but also for GNP-M and GNP-M-ox-1:3,
another mechanism besides ROS formation is involved in MMP decrease, such as direct
mitochondrial damage. Lamel et al. [25] also proposed that MMP disruption can be caused by
physical interaction with mitochondria, besides being induced indirectly through ROS resultant
from GBMs biointeraction. The collapse of the MMP coincides with the opening of the
mitochondrial permeability transition pores, leading to the release of cytochrome c into the
cytosol, which in turn triggers other downstream events in the apoptotic cascade. [45] MMP is
decreased for both GNP-M and GNP-M-ox-1:3 for concentrations above 10 μg mL−1 and for
GNP-C above 50 μg mL−1, pointing out apoptosis induced by these GBMs. For GNP-M-ox-1:6 no
significant differences in MMP were perceptible (p > 0.05) comparing with cells cultured in
DMEM+. These results are in agreement with above discussed data regarding cell death
(LIVE/DEAD assay).
3.6 Conclusions
The biocompatibility of GNPs with different platelet sizes and oxidation degrees was
evaluated in vitro. GNP-C, which exhibited smaller sizes, was shown to be generally more
biocompatible than GNP-M. The sharper and longer edges of GNP-M platelets cause

Chapter 3
78 Artur M. Pinto – Jan 2017
membrane damages on cells being cytotoxic above 20 μg mL−1. GNP-C, despite being
internalized without causing membrane damages, increases ROS levels being toxic above
50 μg mL−1.
The complete oxidation of GNP-M (GNP-M-ox-1:6) folds its sharp edges, assuring
biocompatibility until the highest concentration tested (100 μg mL−1). GNP-M-ox-1:6 has an
oxygen content of 24% (mostly carboxyls and hydroxyls) and is dispersible in water by
sonication, revealing potential to be used for biomedical purposes.
Generally, oxidation was found to be more important than size, since more oxidized GNP-M
performed better than smaller GNP-C.

GBMs biocompatibility – effect of particle size and degree of oxidation
Artur M. Pinto – Jan 2017 79
3.7 References
1. M.J. Allen, V.C. Tung, R.B. Kaner, Honeycomb Carbon: A Review of Graphene, Chem
Rev 110 (2010) 132-145.
2. M. Batzill, The surface science of graphene: Metal interfaces, CVD synthesis,
nanoribbons, chemical modifications, and defects, Surf Sci Rep 67 (2012) 83-115.
3. W. Choi, I. Lahiri, R. Seelaboyina, Y.S. Kang, Synthesis of Graphene and Its
Applications: A Review, Crit Rev Solid State 35 (2010) 52-71.
4. H. Kim, A.A. Abdala, C.W. Macosko, Graphene/Polymer Nanocomposites,
Macromolecules 43 (2010) 6515-6530.
5. K.P. Loh, Q.L. Bao, P.K. Ang, J.X. Yang, The chemistry of graphene, J Mater Chem 20
(2010) 2277-2289.
6. O.V. Prezhdo, P.V. Kamat, G.C. Schatz, Virtual Issue: Graphene and Functionalized
Graphene, J Phys Chem C 115 (2011) 3195-3197.
7. C.N.R. Rao, K.S. Subrahmanyam, H.S.S.R. Matte, U. Maitra, K. Moses, A. Govindaraj,
Graphene: Synthesis, Functionalization and Properties, Int J Mod Phys B 25 (2011)
4107-4143.
8. V. Singh, D. Joung, L. Zhai, S. Das, S.I. Khondaker, S. Seal, Graphene based materials:
Past, present and future, Prog Mater Sci 56 (2011) 1178-1271.
9. R.J. Young, I.A. Kinloch, L. Gong, K.S. Novoselov, The mechanics of graphene
nanocomposites: A review, Compos Sci Technol 72 (2012) 1459-1476.
10. O.C. Compton, S.T. Nguyen, Graphene Oxide, Highly Reduced Graphene Oxide, and
Graphene: Versatile Building Blocks for Carbon-Based Materials, Small 6 (2010) 711-
723.
11. D.R. Dreyer, S. Park, C.W. Bielawski, R.S. Ruoff, The chemistry of graphene oxide,
Chem Soc Rev 39 (2010) 228-240.
12. J. Kim, L.J. Cote, J.X. Huang, Two Dimensional Soft Material: New Faces of Graphene
Oxide, Accounts Chem Res 45 (2012) 1356-1364.
13. J.I. Paredes, S. Villar-Rodil, A. Martinez-Alonso, J.M.D. Tascon, Graphene oxide
dispersions in organic solvents, Langmuir 24 (2008) 10560-10564.
14. Y. Zhu, D.K. James, J.M. Tour, New Routes to Graphene, Graphene Oxide and Their
Related Applications, Adv Mater 24 (2012) 4924-4955.
15. Y.W. Zhu, S. Murali, W.W. Cai, X.S. Li, J.W. Suk, J.R. Potts, R.S. Ruoff, Graphene
and Graphene Oxide: Synthesis, Properties, and Applications, Adv Mater 22 (2010)
5226-5226.
16. H. Bai, C. Li, G.Q. Shi, Functional Composite Materials Based on Chemically
Converted Graphene, Adv Mater 23 (2011) 1089-1115.
17. J.H. Du, H.M. Cheng, The Fabrication, Properties, and Uses of Graphene/Polymer
Composites, Macromol Chem Phys 213 (2012) 1060-1077.
18. X. Huang, Z.Y. Yin, S.X. Wu, X.Y. Qi, Q.Y. He, Q.C. Zhang, Q.Y. Yan, F. Boey, H.
Zhang, Graphene-Based Materials: Synthesis, Characterization, Properties, and
Applications, Small 7 (2011) 1876-1902.
19. T. Kuila, S. Bose, A.K. Mishra, P. Khanra, N.H. Kim, J.H. Lee, Chemical
functionalization of graphene and its applications, Prog Mater Sci 57 (2012) 1061-1105.
20. K. Yang, S.A. Zhang, G.X. Zhang, X.M. Sun, S.T. Lee, Z.A. Liu, Graphene in Mice:
Ultrahigh In vivo Tumor Uptake and Efficient Photothermal Therapy, Nano Lett 10
(2010) 3318-3323.
Chapter 3
80 Artur M. Pinto – Jan 2017
21. V.C. Sanchez, A. Jachak, R.H. Hurt, A.B. Kane, Biological Interactions of Graphene-
Family Nanomaterials: An Interdisciplinary Review, Chem Res Toxicol 25 (2012) 15-
34.
22. H. Shen, L.M. Zhang, M. Liu, Z.J. Zhang, Biomedical Applications of Graphene,
Theranostics 2 (2012) 283-294.
23. A.M. Pinto, I.C. Goncalves, F.D. Magalhaes, Graphene-based materials
biocompatibility: A review, Colloid Surface B 111 (2013) 188-202.
24. A.M. Pinto, J. Cabral, D.A.P. Tanaka, A.M. Mendes, F.D. Magalhaes, Effect of
incorporation of graphene oxide and graphene nanoplatelets on mechanical and gas
permeability properties of poly(lactic acid) films, Polym Int 62 (2013) 33-40.
25. T. Lammel, P. Boisseaux, M.L. Fernandez-Cruz, J.M. Navas, Internalization and
cytotoxicity of graphene oxide and carboxyl graphene nanoplatelets in the human
hepatocellular carcinoma cell line Hep G2, Part Fibre Toxicol 10 (2013).
26. S. Jaworski, E. Sawosz, M. Grodzik, A. Winnicka, M. Prasek, M. Wierzbicki, A.
Chwalibog, In vitro evaluation of the effects of graphene platelets on glioblastoma
multiforme cells, Int J Nanomed 8 (2013) 413-420.
27. K. Kalaitzidou, H. Fukushima, L.T. Drzal, Mechanical properties and morphological
characterization of exfoliated graphite-polypropylene nanocomposites, Compos Part a-
Appl S 38 (2007) 1675-1682.
28. W.X. Li, Z.W. Xu, L. Chen, M.J. Shan, X. Tian, C.Y. Yang, H.M. Lv, X.M. Qian, A
facile method to produce graphene oxide-g-poly(L-lactic acid) as an promising
reinforcement for PLLA nanocomposites, Chem Eng J 237 (2014) 291-299.
29. J.A. Moreira, A. Almeida, M.R. Chaves, M.L. Santos, P.P. Alferes, I. Gregora, Raman
spectroscopic study of the phase transitions and pseudospin phonon coupling in sodium
ammonium sulphate dihydrate, Phys Rev B 76 (2007) 174102.
30. C. Monteiro, M. Fernandes, M. Pinheiro, S. Maia, C.L. Seabra, F. Ferreira-da-Silva, F.
Costa, S. Reis, P. Gomes, C.L. Martins, Antimicrobial properties of membrane-active
dodecapeptides derived from MSI-78, Biochim Biophys Acta-Biomembr 1848 (2015)
1139–1146.
31. A. Sasidharan, L.S. Panchakarla, A.R. Sadanandan, A. Ashokan, P. Chandran, C.M.
Girish, D. Menon, S.V. Nair, C.N.R. Rao, M. Koyakutty, Hemocompatibility and
Macrophage Response of Pristine and Functionalized Graphene, Small 8 (2012) 1251-
1263.
32. B. Lesiak, L. Stobinski, A. Malolepszy, M. Mazurkiewicz, L. Kover, J. Toth,
Preparation of graphene oxide and characterisation using electron spectroscopy, J
Electron Spectrosc 193 (2014) 92-99.
33. A.C. Ferrari, Raman spectroscopy of graphene and graphite: Disorder, electron-phonon
coupling, doping and nonadiabatic effects, Solid State Commun 143 (2007) 47-57.
34. M.A. Pimenta, G. Dresselhaus, M.S. Dresselhaus, L.G. Cancado, A. Jorio, R. Saito,
Studying disorder in graphite-based systems by Raman spectroscopy, Phys Chem Chem
Phys 9 (2007) 1276-1291.
35. O.J. Yoon, C.Y. Jung, I.Y. Sohn, H.J. Kim, B. Hong, M.S. Jhon, N.E. Lee,
Nanocomposite nanofibers of poly(D, L-lactic-co-glycolic acid) and graphene oxide
nanosheets, Compos Part a-Appl S 42 (2011) 1978-1984.
36. A. Ganguly, S. Sharma, P. Papakonstantinou, J. Hamilton, Probing the Thermal
Deoxygenation of Graphene Oxide Using High-Resolution In Situ X-ray-Based
Spectroscopies, J Phys Chem C 115 (2011) 17009-17019.
37. K. Haubner, J. Murawski, P. Olk, L.M. Eng, C. Ziegler, B. Adolphi, E. Jaehne, The
Route to Functional Graphene Oxide, Chemphyschem 11 (2010) 2131-2139.

GBMs biocompatibility – effect of particle size and degree of oxidation
Artur M. Pinto – Jan 2017 81
38. J.M. Hillegass, A. Shukla, S.A. Lathrop, M.B. MacPherson, N.K. Fukagawa, B.T.
Mossman, Assessing nanotoxicity in cells in vitro, Wires Nanomed Nanobi 2 (2010)
219-231.
39. S.C. Patel, G. Lalwani, K. Grover, Y.X. Qin, B. Sitharaman, Fabrication and
Cytocompatibility of In Situ Crosslinked Carbon Nanomaterial Films, Sci Rep-Uk 5
(2015).
40. D. Xu, N.L. Zhou, J.A. Shen, Hemocompatibility of Carboxylic Graphene Oxide, Chem
J Chinese U 31 (2010) 2354-2359.
41. K.H. Liao, Y.S. Lin, C.W. Macosko, C.L. Haynes, Cytotoxicity of Graphene Oxide and
Graphene in Human Erythrocytes and Skin Fibroblasts, Acs Appl Mater Inter 3 (2011)
2607-2615.
42. B.J. Hong, O.C. Compton, Z. An, I. Eryazici, S.T. Nguyen, Successful Stabilization of
Graphene Oxide in Electrolyte Solutions: Enhancement of Biofunctionalization and
Cellular Uptake, Acs Nano 6 (2012) 63-73.
43. A. Sasidharan, L.S. Panchakarla, P. Chandran, D. Menon, S. Nair, C.N.R. Rao, M.
Koyakutty, Differential nano-bio interactions and toxicity effects of pristine versus
functionalized graphene, Nanoscale 3 (2011) 2461-2464.
44. O.N. Ruiz, K.A.S. Fernando, B.J. Wang, N.A. Brown, P.G. Luo, N.D. McNamara, M.
Vangsness, Y.P. Sun, C.E. Bunker, Graphene Oxide: A Nonspecific Enhancer of
Cellular Growth, Acs Nano 5 (2011) 8100-8107.
45. E. Gottlieb, S.M. Armour, M.H. Harris, C.B. Thompson, Mitochondrial membrane
potential regulates matrix configuration and cytochrome c release during apoptosis, Cell
Death Differ 10 (2003) 709-717.

Chapter 3
82 Artur M. Pinto – Jan 2017

GBMs biocompatibility - effect of polymer surface adsorption
Artur M. Pinto – Jan 2017 83
Chapter 4
GBMs biocompatibility:
Effect of polymer surface adsorption
This chapter was based in the following published paper:
Chapter 4
84 Artur M. Pinto – Jan 2017

GBMs biocompatibility - effect of polymer surface adsorption
Artur M. Pinto – Jan 2017 85
4 GBMS BIOCOMPATIBILITY – EFFECT OF
POLYMER SURFACE ADSORPTION
4.1 Scope
The biointeractions of graphene-based materials depend on their physico-chemical properties.
Thus, these properties can be manipulated in order to understand and improve GBMs
biocompatibility. This chapter presents a study on the biocompatibility of graphene nanoplatelets
modified by surface adsorption of several water-soluble polymers. In addition to biocompatibility,
the materials produced were characterized by scanning electron microscopy, dynamic light
scattering, X-ray photoelectron spectroscopy, Raman spectroscopy, and thermogravimetric
analysis.
4.2 State of the art
Excellent physico-mechanical properties have been extensively reported in the literature
concerning graphene and graphene-based materials (GBMs), such as high mechanical strength,
specific surface area and high thermal and electrical conductivity. [1-9] Several biomedical
applications have been studied, including biosensing/bioimaging [10], drug delivery [11], cancer
photothermal therapy [12], regenerative medicine [13-14], and antibacterial materials [11]. In view of
the growing interest in using GBMs in this context, it is paramount to evaluate their
biocompatibility. Existing studies indicate that GBMs generally induce a decrease in cell viability
above a concentration of 10 μg mL−1 after 24 h of incubation, with cell viability often decreasing
as time and concentration increase. However, it is expected that cell interactions will be
dependent on the physical-chemical properties of GBMs (e.g., size, hydrophilicity), which are
related to the raw materials and production methods used. However, the number of available
studies is still relatively low, and some contradictory results can be found. This subject was
recently reviewed by Pinto et al. [15]. The relationship between the physical-chemical properties
of GBMs and their biocompatibility is still not clearly established and has to be evaluated in each
Chapter 4
86 Artur M. Pinto – Jan 2017
case. In addition, because intravenous administration or implantation of GBMs is often
considered, haemocompatibility studies must be included. [15-16]
Covalent and non-covalent surface modification with polymers is a strategy to overcome possible
toxicity of GBMs. Regarding covalent modification, GBMs biocompatibility has been shown to
be improved by functionalization with 2-methacryloyloxyethyl phosphorylcholine [17], and
crosslinked poly(N-isopropylacrylamide)-g-poly(ethylene oxide) [18]. A limitation of some
reported works that describe chemical functionalization in the context of drug delivery
applications is that the biocompatibility of only the modified GBMs conjugated with drugs is
reported, without comparison to the polymer-functionalized material. [19-21] The approach of non-
covalent modification has been less fully explored, with few biocompatibility studies available.
The only such reports concern surface adsorption of polyethylene glycol (PEG) [22] and
poly(ethylene imine) − PEI [23], with biocompatibility improvements being observed. A main
advantage of this strategy is that it can usually be performed in aqueous medium. Covalent
functionalization, on the other hand, often implies using toxic solvents as reaction medium. In
addition, the procedures for non-covalent surface modification are simple and easily up-scaled.
The present work studies a commercially available product, graphene nanoplatelets (GNP), with
reduced cost compared to single layer graphene. Each particle of GNP-C consists of 2 or more
stacked graphene layers, possessing oxygen-containing functional groups at the edges, which may
interact with solvent or polymers. Because this is a commercial product, it has the advantage of
material consistency and availability. Moreover, GNP has been reported to display good results as
a biopolymer filler, improving mechanical performance [24] and biocompatibility, namely
reducing platelet activation without increasing toxicity [24]. In this work, the biocompatibility of
GNP was studied, as were the effects of non-covalent surface modification with several
biocompatible polymers, namely poly(vinyl alcohol) (PVA), poly(ethylene glycol) (PEG),
poly(vinyl pyrrolidone) (PVP), hydroxyethyl cellulose (HEC), and glycosaminoglycans:
chondroitin (CON), glucosamine (GLU) and hyaluronic acid (HA). [25-28] Polymers such as PVA,
PEG, PVP, and HEC are often used in biomedical applications themselves or as modifying agents
to improve the biocompatibility of materials. [29] Glycosaminoglycans are a significant component
of proteoglycans, and they do not elicit immune response and have been used extensively for
tissue engineering applications. [30] As an example, HA has been used for surface modification of
carbon nanotubes and GO. [31] Wu et al. [32] observed that GO functionalized with adipic acid and
covalently conjugated with HA was biocompatible with HeLa and L929 cells and non-toxic to
mice up to high concentrations.
In the present work, biocompatibility was evaluated in terms of hemolysis, effects on cell
viability, morphology and membranes, and ROS production.

GBMs biocompatibility - effect of polymer surface adsorption
Artur M. Pinto – Jan 2017 87
4.3 Materials and methods
4.3.1 Materials preparation
Graphene nanoplatelets (GNP) grade C750 were acquired from XG Sciences (Lansing, USA),
presenting an average thickness lower than 2 nm and surface area of 750 m2 g−1. GNP-C has a
size distribution that ranges from very small flakes (diameter below 100 nm) up to larger flakes
(1–2 μm). According to the manufacturer, GNP production is based on exfoliation of sulphuric
acid-based intercalated graphite by rapid microwave heating, followed by ultrasonic
treatment. [39]
GNP-C were modified by surface adsorption with: a) poly(vinyl alcohol) − PVA, b) hydroxyethyl
cellulose − HEC, c) poly(ethylene glycol) − PEG, d) poly(vinyl pyrrolidone) − PVP e)
chondroitin sulfate potassium − CON, f) d-glucosamine sulfate potassium − GLU and g)
hyaluronic acid − HA. HEC − WeKcelo 300 was acquired from WeiKem Chemical Co., China;
according to manufacturer, the polymer has a particle size of 180 μm (98,5%) and �� w
= 3000000 g mol−1. PVA − Mowiol 47-88, ��w = 205000 g mol−1, hydrolysis degree (HD) = 88%
− was purchased from Clariant. CON (��w = 463.3 g mol−1), GLU (��w = 277.2 g mol−1) and HA
( �� w = 1450000 g mol−1) were acquired from PureBulk, USA. PVP-K30 ( �� w = 40000–
80000 g mol−1) was purchased from Alfa Aesar. PEG-bioultra (��w = 16000–24000 g mol−1) was
acquired from Sigma Aldrich. Polymers and GNP-C (1:1 w/w ratio) were dispersed in water,
performing sonication with a Hielsher UIP 1000 probe for 5 min. Next, the dispersion was
centrifuged at 4000 rpm for 15 min and supernatant discarded, assuring removal of excess
polymer. The precipitate was dried at 60 °C for 1 week. Controls were performed by washing
GNP-C with 5 L distilled water by filtration, and this material was designated GNP-C-w. GNP-C
was centrifuged at 4000 rpm for 15 min, and the precipitate was recovered and tested. This
material was designated GNP-C-c. [37]
4.3.2 Physical-chemical characterization
Dynamic light scattering particle sizes and distributions of the materials were determined with an
LS230 laser particle analyzer (Coulter, USA). GBMs were dispersed in water at a concentration
of 100 μg mL−1 and sonicated for 20 min. Just before sample testing, a 10 min sonication was
performed to redisperse agglomerates. Data were collected performing 3 scans of 60 s, including

Chapter 4
88 Artur M. Pinto – Jan 2017
polarization intensity differential scattering and using Fraunhofer’s model. This model assumes
spherical shape for the particles in suspension. The obtained size distributions must therefore be
considered as relative evaluations of the degree of deagglomeration of the different materials in
water and not as precise estimations of particle sizes. Li et al. [40] used a similar approach to
evaluate graphene oxide particle size distribution in water by dynamic light scattering.
4.3.3 Biocompatibility evaluation
GBMs were sterilized in ethanol by sonication for 20 min (Bandelin Sonorex RK512H). The
materials were dried in a vacuum oven at 50 °C under sterile conditions. GBMs were redispersed
in appropriate volume of phosphate buffered saline (PBS, pH 7.4) or Dulbecco’s modified Eagle’s
medium (DMEM, Gibco) supplemented with 10% (V/V) newborn calf serum (Gibco) and 1%
(V/V) penicillin/streptomycin (biowest) (DMEM +).
4.3.3.1 Hemolysis assay
Red blood cells (RBCs) were isolated from buffy coats (obtained from Immunohemotherapy
Service, Hospital S. João, Porto, Portugal) as described previously. [41] Briefly, RBCs were
centrifuged over a density gradient with Histopaque-1077 (Sigma-Aldrich) according to
manufacturer's instructions. The lower layer containing RBCs was washed three times in PBS.
The purified RBCs were diluted to a concentration of 2 × 10⁸ cells mL−1, and 100 μL of RBCs
were placed in round bottom 96-well polypropylene microtiter plates. Next, 100 μL of GBMs
dispersion was added to the wells and incubated for 3 h at 37 °C and 80 rpm. Afterwards, the 96-
well plates were centrifuged at 4000 rpm for 15 min to collect supernatant, which was transferred
(80 μL) from each well to black polypropylene 96-well microtiter plates. Absorbance was read at
380, 415, and 450 nm using a micro-plate reader spectrophotometer (Bioteck Plate Reader,
Synergy MX). The haemolytic potential of GBMs was calculated as follows: Hemolysis (%) = Hb
value of sample/Total Hb value × 100, where total Hb value corresponds to 100% hemolysis with
1% Triton X-100. [34] The GBMs concentrations tested were 100, 200 and 500 μg mL−1. Controls
with PBS (lysis negative control) and 1% Triton (Sigma Aldrich, X100) in PBS (positive control
for 100% hemolysis) were performed. Additionally, controls with only GBMs in PBS were
performed for each concentration tested. All assays were performed in triplicate and repeated 3
times.

GBMs biocompatibility - effect of polymer surface adsorption
Artur M. Pinto – Jan 2017 89
4.3.3.2 Biocompatibility with fibroblasts
In vitro assays were performed using HFF-1 (from ATCC), grown in DMEM+ at 37 °C, in fully
humidified air containing 5% CO2. The medium was replenished every 3 days and cells were
detached from T75 flasks upon reaching 90% confluence. For all assays, HFF-1 cells were seeded
at a density of 2 × 10⁴ cells mL−1 in 96-well plates or an 8-well chamber slide system Lab-Tek-II.
Upon confluence (24 h), the DMEM+ was removed and cells were incubated with increasing
concentrations of GBMs in DMEM+ (1–100 μg mL−1) for 24, 48, and 72 h. At the indicated time-
points, cells were observed in an inverted fluorescence microscope (Carl Zeiss − Axiovert 200)
and phase contrast images were acquired. All experiments were performed using cells between
passages 10 and 14.
4.3.3.3 Cytotoxicity assays
Cell mitochondrial metabolic activity was quantified by resazurin assay at 24, 48, and 72 h of
incubation. Briefly, 20 μL (1 mg mL−1) of resazurin (Sigma Aldrich) solution in PBS was added
to each well. Cells were incubated for 3 h and fluorescence (λex/em = 530/590 nm) read in a micro-
plate reader spectrophotometer. The negative control for metabolic activity decrease was
performed by incubating cells with DMEM+ and the positive control by incubating with triton
0.1 wt.%. Cell metabolic activity (%) was calculated as follows: Fluorescence of
sample/Fluorescence of negative control x 100. Controls were performed with materials only
(without cells) dispersed in DMEM+ for all concentrations tested. All assays were performed in
sextuplicate and repeated 3 times.
Cell viability/membrane integrity was evaluated by LIVE/DEAD assay. At 72 h, the medium was
removed and cells incubated with Hoechst 33342 (Molecular Probes) and Calcein (Molecular
Probes), both at 2.5 μg mL−1 in PBS for 15 min at 37 °C in the dark. Then, propidium iodide (PI)
(Sigma Aldrich) in PBS was added to each well to a final concentration of 1.25 μg mL−1 and
images were acquired in a Carl Zeiss − Axiovert 200. Cell death (%) was calculated as follows:
number of cells stained with PI/number of cells stained with Hoechst 33342 * 100. All assays
were performed in triplicate and repeated 3 times.
4.3.3.4 Intracellular ROS evaluation
HFF-1 cells were seeded as previously described and, after reaching a state of subconfluence
(24 h), washed with PBS at 37 °C and incubated 45 min at 37 °C with 95 μL chloromethyl-2′,7′-
dichlorodihydrofluorescein diacetate (CM-H2DCFDA, Molecular Probes) at a concentration of
2 μg mL−1. The reagent was removed and cells incubated at 37 °C for 1 h with 150 μL GBMs

Chapter 4
90 Artur M. Pinto – Jan 2017
dispersed in PBS (1, 10, and 50 μg mL−1). Finally, 100 μL Triton 1% in PBS was added to each
well and fluorescence (λex/em = 480/530 nm) read in a micro-plate reader spectrophotometer.
Controls were performed with GBMs dispersed in PBS, for all concentrations tested, and
incubated with the same amount of CM-H2DCFDA in wells without cells. PBS was used as a
negative control and H2O2 (Merck) 100 mM as a positive control for intracellular ROS
production. ROS levels were calculated as follows: ROS levels (%) = Fluorescence of the
sample/Fluorescence of negative control x 100. All assays were performed in triplicate and
repeated 3 times.
4.3.3.5 Transmission electron microscopy (TEM)
After 72 h of incubation, cells exposed to 100 μg mL−1 GBMs in a Lab-Tek-II were fixed in 2%
glutaraldehyde (Electron Microscopy sciences, Hatfield, USA) and 4% PFA in cacodylate Buffer
0.1 M (pH 7.4), dehydrated and embedded in Epon resin (TAAB, Berks, England). Ultrathin
sections (40–60 nm thickness) were prepared on a Leica Reichert SuperNOVA Ultramicrotome
(Germany) using diamond knives (DDK, Wilmington, DE, USA). The sections were mounted on
200 mesh copper or nickel grids, stained with uranyl acetate and lead citrate for 15 min each, and
examined under a JEOL JEM 1400 TEM (Tokyo, Japan). Images were digitally recorded using a
CCD digital camera Orious 1100 W (Tokyo, Japan) at the HEMS − Institute for Molecular and
Cell Biology (IBMC) of the University of Porto.
4.3.4 Statistical analysis
Statistical analysis was performed using the software SPSS20 (IBM) performing Kruskal–Wallis
one-way analysis of variance. The resazurin assays were analysed by performing parametric
analysis of variance (ANOVA) followed by Tamhane, Dunnett, and Games-Howell post hoc tests.
Multiple means comparisons were performed between samples to identify significant differences,
which were considered for p < 0.05.
4.4 Results
4.4.1 Physical-chemical characterization
Figure 4.1 shows particle size distributions obtained after GBMs dispersion in water. GNP-C
exfoliates effectively in water, originating two populations of platelets with sizes below 2 μm

GBMs biocompatibility - effect of polymer surface adsorption
Artur M. Pinto – Jan 2017 91
(approximately 0.5 and 2 μm). Dispersion after treatment with PEG, PVP, CON, GLU and HA
does not increase particle size. However, it increases for GNP-C-PVA (approximately 25 μm) and
GNP-C-HEC (approximately 8 μm), indicating significant formation of platelet agglomerates due
to interaction with these two polymers. GNP-C is composed of platelets with length below 2 μm
and small wrinkled flakes with folded edges (< 0.5 μm) that tend to form agglomerates.
Figure 4.1: A) Particle size distributions of GBMs dispersed in water at a concentration of
100 μg mL−1. B) Particle size distributions for a narrower size range than in image A, to
allow comparison between GBMs with smaller size distribution.
Polymer presence at the GNP-C surface was confirmed and quantified by XPS, Raman
spectroscopy, and TGA (Figure B2 – Appendix B). The presence of these polymers increased O
(at.%) in the final products in all cases, this increment being above 10% for GNP-C-PVA and
HEC. The morphology of GNP-C before and after surface adsorption of the polymers was
observed by SEM (Figure B1).

Chapter 4
92 Artur M. Pinto – Jan 2017
4.4.2 Biocompatibility evaluation
4.4.2.1 Hemolysis evaluation
Figure 4.2 shows that the hemolysis ratio seems to be decreased with surface adsorption of most
polymers, except for HA, despite significant differences (p < 0.05) only being observed between
GNP-C (1.7%), GNP-C-PVA (0.05%) and HEC (0%) at the higher concentration (500 μg mL−1).
Figure 4.2: Percentage of RBCs lysis after 3 h incubation at 37 °C with PBS (negative
control) and different concentrations of GBMs (100, 200 and 500 μg mL−1). The positive
control (Triton 1% in PBS) resulted in 100% hemolysis (data not shown). The results are
presented as the mean and standard deviation (n = 3). Greek symbols represent statistically
significant differences between samples within the same concentration (p < 0.05).
Because PVA and HEC presented the best performance at reducing hemolysis, these polymers
were selected for testing in further biocompatibility assays, presented next.
4.4.2.2 Biocompatibility with fibroblasts
After verifying that the materials do not show relevant toxic effects towards RBCs, further assays
were performed to evaluate their effect when in direct contact with human foreskin fibroblasts
(HFF-1). Phase contrast images were obtained for each time and concentration tested, and
representative images are shown in (Fig. B1). Further characterization was performed and
described below.
4.4.2.3 Cytotoxicity
Considering that, if metabolic activity is reduced to less than 70% compared to the negative
control for mitochondrial metabolic activity decrease (cells incubated with DMEM+), a sample

GBMs biocompatibility - effect of polymer surface adsorption
Artur M. Pinto – Jan 2017 93
has cytotoxic potential [ISO 10993-5:2009(E)], it can be observed from Figure 4.3 (A) that GNP-
C is potentially non-toxic up to a concentration of 20 μg mL−1 until 72 h. GNP-C is toxic at 24 h
at concentrations above 20 μg mL−1, however, the cell mitochondrial metabolic activity recovers
over time until 72 h. For GNP-C-HEC, no improvements in biocompatibility are observed
compared to pristine GNP-C. GNP-C-PVA is toxic at 24 h only above 50 μg mL−1, which
constitutes an improvement in biocompatibility compared with GNP-C. Moreover, at 48 and 72 h,
it also presents higher viability than GNP-C, revealing no toxicity until the highest concentration
tested of 100 μg mL−1. Controls performed with materials dispersed in DMEM+ without cells, for
all concentrations tested, presented similar values to DMEM+, suggesting that the materials tested
did not interfere with fluorescence determination.
Figure B4 (Appendix B) shows representative images of HFF-1 cells, with and without contact
with GBMs, after labelling for LIVE/DEAD assay. As expected, the positive control for cell death
(cells incubated with 0.1 wt.% Triton in DMEM+ for 72 h) unveiled 100% cell death. A negative
control was performed incubating cells with DMEM+, presenting mostly live cells with scarce
dead fibroblasts. Fig. 4.3(B) shows that cell death was below 5% for all materials tested. At 20
and 50 μg mL−1, cell death was significantly lower (p < 0.05) for modified GNP-C-PVA
compared to pristine GNP-C.
Fig. 4.3(C), shows that for 50 μg mL−1 at 1 h, GNP-C increases ROS production by 4.4-fold
compared with the negative control (PBS). For GNP-C-PVA and HEC it also increases by 3.3-
and 5.2-fold, respectively. Despite no significant differences being observed between materials
(p > 0.05), there is a trend toward surface adsorption of HEC increasing and PVA reducing ROS
production compared to unmodified GNP-C (Figure 4.3(C)). All materials are different from the
negative control (PBS) at 10 and 50 μg mL−1 (p < 0.05). Controls performed with GBMs
dispersed in PBS, incubated with CM-H2DCFHDA in wells without cells, present similar values
to PBS only, incubated with the indicator. Thus, GBMs do not interfere in the ROS quantification
method used.
4.4.2.4 Cell interaction with GBMs
TEM images (Figure 4.4(C)) show that GNP-C is almost completely exfoliated, interacting with
plasma membrane, being internalized without causing membrane damage, and being found inside
vesicles in fibroblast cytoplasm (Fig. 4.4(D)). GNP-C is found often in cytoplasm, being able to
interact with mitochondria (Fig. 4.4(C, D)), which may induce ROS production (Fig. 4.4(C)).
GNP-C also contacts the nucleus (Fig. 4.4(C)), despite apparently causing no damage.

Chapter 4
94 Artur M. Pinto – Jan 2017
Figure 4.3: A) HFF-1 cell viability after incubation with GBMs in DMEM+, at 24, 48 and
72 h. Cell mitochondrial metabolic activity is represented as a percentage in comparison
GBMs biocompatibility - effect of polymer surface adsorption
Artur M. Pinto – Jan 2017 95
with cells cultured in DMEM+ (100%). The results are presented as the mean and standard
deviation (n = 6). The red line at 70% marks the toxicity limit according to ISO 10993-
5:2009(E). The statistical analysis is presented in Table B1) Percentage of HFF-1 cell death
after 72 h of incubation with GBMs. Cell death percentage was corrected by subtraction of
the value for cells cultured in DMEM+ (negative control for cell death). The results are
presented as the mean and standard deviation (n = 3). Statistically significant differences
(p < 0.05) analysed within each concentration between all GBMs are represented by Greek
symbols. C) Intracellular reactive oxygen species levels (ROS) induced by GBMs (1, 10,
50 μg mL−1) when incubated with HFF-1 cells for 1 h. The negative control for ROS
production is PBS (considered 100%) and the positive control is H2O2 100 mM. The results
are presented as the mean and standard deviation (n = 3). No statistically significant
differences (p > 0.05) were observed between samples within each concentration.
GNP-C-PVA was more agglomerated, presenting larger volume than GNP-C (Fig. 4.4(E)), being
found more often outside the plasma membrane (Fig. 4.4(F)) than in cytoplasm. Internalized
GNP-C-HEC particles presented smaller length (0.5–1.5 μm) than GNP-C-PVA or GNP-C (0.5–
3 μm), being often found spread in cytoplasm (Fig. 4.4(G)). GNP-C-HEC was also observed in
contact with mitochondria (Fig. 4.4(H)). For all materials, the internalized particles ranged in size
from hundreds of nanometres to 3 μm.

Chapter 4
96 Artur M. Pinto – Jan 2017
Figure 4.4: TEM images of HFF-1 cells incubated for 72 h with 100 μg mL−1 GBMs.
DMEM+ − A [33], B (cyt − cytoplasm, nc − nucleus); GNP-C − C (a − particle interacting
with pm − plasma membrane, b − particles inside cytoplasm, c − particle in contact with
nucleus), D (particles inside cytoplasm, vs- vesicles); GNP-C-PVA − E (agglomerated
particles inside cytoplasm), F (particle outside plasma membrane); GNP-C-HEC − G
(particles spread in cytoplasm), H (particles interacting with mitochondria − mt). Scale bar
represents 0.5 μm, except for A − 2 μm.

GBMs biocompatibility - effect of polymer surface adsorption
Artur M. Pinto – Jan 2017 97
4.5 Discussion
To the best of our knowledge, the in vitro biological effects of GBMs modified by the polymers
evaluated in this work have not been completely characterized to date. Polymer presence at the
GNP-C surface was confirmed by several methods and quantified by TGA (Figure B2 –
Appendix B). The presence of these polymers increased O (at.%) in the final products in all cases,
this increment being above 10% for GNP-C-PVA and HEC. This higher hydrophilicity
contributed to more stable dispersion in water and culture medium despite the increased particle
size. The morphology of the GBMs was qualitatively evaluated by SEM (Fig. B1). Particle size
distributions after dispersion in aqueous medium were determined by dynamic light scattering to
evaluate the agglomeration state in conditions similar to those used in the biocompatibility assays.
After sonication, GNP-C yields a bimodal distribution with narrow peaks at 0.5 and 2 μm,
indicating very good deagglomeration into primary nanoplatelets.
Similar results are obtained when treating with the selected materials except for HEC and PVA. In
the first case, the final hydrodynamic diameter (HD) is approximately 8 μm, while for PVA HD it
is approximately 25 μm. The increased platelet agglomeration when combined with HEC or PVA
can be explained by the affinity of this polymer towards the GNP-C surface together with an
inter-particular bridging effect due to hydrogen bonding between the polymer's hydroxyl groups.
This effect appears to be dominant over steric stabilization and therefore leads to agglomeration.
As shown in supplemental material (Fig. B3), it was observed by optical microscopy that over
time all the materials sediment on the bottom of the wells, contacting the cells. Despite
agglomerates with considerable size being present, TEM images show that only small platelets
and agglomerates with diameter below 3 μm are internalized into fibroblasts.
Hemolysis in the presence of GNP-C (1.7%) was significantly decreased with surface adsorption
of PVA (0.05%) and HEC (0%) for the higher concentration tested (500 μg mL−1) with 3 h of
incubation. The published literature on this topic is scarce and shows that haemocompatibility is
dependent on the particular GBMs considered because interactions depend on the materials’
physicochemical properties (e.g., size, shape, chemical composition). [33] Due to having small size
and sharp edges that may damage erythrocytes, GNP-C causes some hemolysis, but to a low
extent (1.7%). Surface adsorption of PVA and HEC reduced this value even further, rendering the
material almost completely nonhaemolytic. Adsorption of polymers that present low chemical
affinity for GNP-C resulted in no significant differences (p > 0.05) in hemolysis, as for example
HA, whose percentage in relation to polymer is only 5.1 wt.% and hemolysis 1.6%. For the
purpose of discussion, comparisons can be made with Sasidharan et al. [34], who reported pristine
bilayer graphene (p-G) obtained by chemical oxidation of graphite and thermal exfoliation, to be
nonhaemolytic (hemolysis ≈ 0.2%) up to a tested concentration of 75 μg mL−1 with incubation of

Chapter 4
98 Artur M. Pinto – Jan 2017
3 h. However, Liao et al. [35] showed that GS − graphene sheets obtained from GO by
hydrothermal treatment caused about 15% hemolysis at the higher concentration tested of
200 μg mL−1 for the same incubation time. Because there are no in vitro studies regarding the
haemocompatibilty of GBMs modified with polymers, a comparison can be made with Yang et
al. [36], who observed nanographene sheets (NGS) functionalized with polyethylene glycol (PEG)
to be non-toxic to Balb/c mice over a period of 3 months at a concentration of 20 mg kg−1 injected
intravenously. Due to the reduced number of studies in this area, further testing is needed to better
understand GBMs biocompatibility.
GNP-C for 24 h is toxic at concentrations above 20 μg mL−1, however cell mitochondrial
metabolic activity recovers over time until 72 h, in line with our previous work. [37] For GNP-C-
HEC, no improvements in biocompatibility are observed compared to pristine GNP-C. GNP-C-
PVA is toxic at 24 h only above 50 μg mL−1, which constitutes an improvement in
biocompatibility compared with GNP-C. Moreover, at 48 and 72 h, it also presents better
performance than GNP-C, revealing no toxicity until the highest concentration tested of
100 μg mL−1. Feng et al. [23] had previously modified GO by surface adsorption
(ultrasounds + centrifugation) of PEI. GO (thickness ≈ 1 nm, length < 100 nm) entered HeLa cells
and caused a viability decrease of 32% (MTT assay) at a concentration of 100 μg mL−1 for 24 h.
GO-PEI (thickness ≈ 4 nm, length < 100 nm) only reduced viability by 20% under the same
conditions. Additionally, Wojtoniszak et al. [22] modified reduced GO − rGO (thickness ≈ 4
layers, length ≈ 100 nm) with PEG by simple mixing in PBS. rGO caused L929 fibroblast
viability decreases (WST-1 test) of 22% at 12.5 μg mL−1 for 24 h. For rGO-PEG, viability
decreases were reduced to 14% employing equal circumstances. Interestingly, at higher
concentrations, PEG was shown to not be as effective. Unfortunately, no further assays are
available to unveil the toxicity mechanisms. For this reason, we performed complementary tests.
LIVE/DEAD assays revealed that cell death is lower for GNP-C-PVA compared to pristine GNP-
C. It was already observed in resazurin assays that GNP-C-PVA presented better biocompatibility
than pristine GNP-C. Additionally, cell death is below 5% for all materials. These values are
inferior to the higher viability decreases observed in resazurin assays. A possible explanation for
the difference is that metabolic activity is decreased in some cells despite presenting intact
membranes and not being stained by propidium iodide, which only penetrates cells with
compromised membrane integrity. For this reason, Fig. 4.3(B) is also an evaluation of membrane
damage to HFF-1 cells. Generally, it shows that membrane damage increases with concentration
being low for all materials. For GNP-C, the highest value was 4.7%, with PVA and HEC surface
adsorption preventing membrane damage, presenting values of 1.4 and 1.2%, respectively.
Because low membrane damage is observed, GNP-C probably has mainly a non-membrane
disruptive internalization mechanism and intracellular toxicity. For this reason, ROS levels were

GBMs biocompatibility - effect of polymer surface adsorption
Artur M. Pinto – Jan 2017 99
determined. Despite no significant differences being observed between materials (p > 0.05), there
is a trend toward ROS production increasing with surface adsorption of HEC and decreasing with
adsorption of PVA compared to unmodified GNP-C. These findings may explain the reduced
membrane damage and early reversible metabolic activity decreases observed (respectively) in the
LIVE/DEAD and resazurin assays. To clarify membrane and cell interactions with GBMs,
imaging techniques were used.
GNP-C is almost completely exfoliated in liquid medium, interacting with plasma membrane and
being internalized without causing membrane damage. TEM images show that GNP-C-PVA was
more agglomerated, presenting larger size, and it was found more often outside the plasma
membrane than in cytoplasm. Internalized GNP-C-HEC particles presented smaller length (0.5–
1.5 μm) than GNP-C-PVA and GNP-C (0.5 − 3 μm), being often found spread in cytoplasm.
Thus, we can assume that surface adsorption of PVA increases particle size, decreasing
internalization, and HEC favours internalization of small particles compared with GNP-C. For
these reasons, GNP-HEC could have had higher interaction with mitochondria, inducing higher
ROS production and earlier toxicity. The same applies to GNP-C compared with GNP-C-PVA.
These phenomena were already reported by Lamel et al. [38] They observed that graphene oxide
(GO) and carboxyl graphene nanoplatelets (CXYG) penetrate through the plasma membrane of
Hep G2 (human hepatocellular carcinoma) cells into the cytosol, concentrating and becoming
encapsulated in intracellular vesicles. They also reported that exposure to GO (HD ≈ 0.4 μm) and
CXYG (HD ≈ 1.7 μm) nanoplatelets results in high intracellular ROS levels from perturbation of
mitochondrial structure and function.
4.6 Conclusions
GNP-C was modified by surface adsorption of PVA, HEC, PEG, PVP, chondroitin,
glucosamine and hyaluronic acid, leading to an increase of oxygen content on the
nanoplatelets' surface and, in the case of GNP-C-PVA and GNP-C-HEC, increasing apparent
particle size in aqueous medium.
All of the materials caused low hemolysis (<1.7%) up to 500 μg mL−1, usually decreasing
after polymer adsorption, with PVA and HEC leading to the best results.
GNP-C-PVA is non-cytotoxic at concentrations up to 100 μg mL−1, whereas GNP-C can
only be used at a maximum concentration of 50 μg mL−1. This difference can be explained
by PVA encapsulating and agglomerating GNP-C platelets, thereby decreasing the
internalization and interaction with HFF-1 cells that lead to ROS production.

Chapter 4
100 Artur M. Pinto – Jan 2017
HEC favoured internalization of small GNP-C particles, having the opposite effect regarding
ROS levels. For these reasons, modification with HEC, in contrast to PVA, was counter-
productive regarding increasing the biocompatibility of GNP-C with fibroblasts.

GBMs biocompatibility - effect of polymer surface adsorption
Artur M. Pinto – Jan 2017 101
4.7 References 1. M.J. Allen, V.C. Tung, R.B. Kaner, Honeycomb Carbon: A Review of Graphene, Chem
Rev 110 (2010) 132-145.
2. M. Batzill, The surface science of graphene: Metal interfaces, CVD synthesis,
nanoribbons, chemical modifications, and defects, Surf Sci Rep 67 (2012) 83-115.
3. W. Choi, I. Lahiri, R. Seelaboyina, Y.S. Kang, Synthesis of Graphene and Its
Applications: A Review, Crit Rev Solid State 35 (2010) 52-71.
4. H. Kim, A.A. Abdala, C.W. Macosko, Graphene/Polymer Nanocomposites,
Macromolecules 43 (2010) 6515-6530.
5. K.P. Loh, Q.L. Bao, P.K. Ang, J.X. Yang, The chemistry of graphene, J Mater Chem 20
(2010) 2277-2289.
6. O.V. Prezhdo, P.V. Kamat, G.C. Schatz, Virtual Issue: Graphene and Functionalized
Graphene, J Phys Chem C 115 (2011) 3195-3197.
7. C.N.R. Rao, K.S. Subrahmanyam, H.S.S.R. Matte, U. Maitra, K. Moses, A. Govindaraj,
Graphene: Synthesis, Functionalization and Properties, Int J Mod Phys B 25 (2011)
4107-4143.
8. V. Singh, D. Joung, L. Zhai, S. Das, S.I. Khondaker, S. Seal, Graphene based materials:
Past, present and future, Prog Mater Sci 56 (2011) 1178-1271.
9. R.J. Young, I.A. Kinloch, L. Gong, K.S. Novoselov, The mechanics of graphene
nanocomposites: A review, Compos Sci Technol 72 (2012) 1459-1476.
10. T. Kuila, S. Bose, A.K. Mishra, P. Khanra, N.H. Kim, J.H. Lee, Chemical
functionalization of graphene and its applications, Prog Mater Sci 57 (2012) 1061-1105.
11. X. Huang, Z.Y. Yin, S.X. Wu, X.Y. Qi, Q.Y. He, Q.C. Zhang, Q.Y. Yan, F. Boey, H.
Zhang, Graphene-Based Materials: Synthesis, Characterization, Properties, and
Applications, Small 7 (2011) 1876-1902.
12. K. Yang, S.A. Zhang, G.X. Zhang, X.M. Sun, S.T. Lee, Z.A. Liu, Graphene in Mice:
Ultrahigh In vivo Tumor Uptake and Efficient Photothermal Therapy, Nano Lett 10
(2010) 3318-3323.
13. V.C. Sanchez, A. Jachak, R.H. Hurt, A.B. Kane, Biological Interactions of Graphene-
Family Nanomaterials: An Interdisciplinary Review, Chem Res Toxicol 25 (2012) 15-
34.
14. H. Shen, L.M. Zhang, M. Liu, Z.J. Zhang, Biomedical Applications of Graphene,
Theranostics 2 (2012) 283-294.
15. A.M. Pinto, I.C. Goncalves, F.D. Magalhaes, Graphene-based materials
biocompatibility: A review, Colloid Surface B 111 (2013) 188-202.
16. A.M. Pinto, S. Moreira, I.C. Goncalves, F.M. Gama, A.M. Mendes, F.D. Magalhaes,
Biocompatibility of poly(lactic acid) with incorporated graphene-based materials,
Colloid Surface B 104 (2013) 229-238.
17. Y. Liu, Y. Zhang, T. Zhang, Y.J. Jiang, X.F. Liu, Synthesis, characterization and
cytotoxicity of phosphorylcholine oligomer grafted graphene oxide, Carbon 71 (2014)
166-175.
18. H.X. Wang, D.M. Sun, N.N. Zhao, X.C. Yang, Y.Z. Shi, J.F. Li, Z.Q. Su, G. Wei,
Thermo-sensitive graphene oxide-polymer nanoparticle hybrids: synthesis,
characterization, biocompatibility and drug delivery, J Mater Chem B 2 (2014) 1362-
1370.
19. H.Q. Bao, Y.Z. Pan, Y. Ping, N.G. Sahoo, T.F. Wu, L. Li, J. Li, L.H. Gan, Chitosan-
Functionalized Graphene Oxide as a Nanocarrier for Drug and Gene Delivery, Small 7
(2011) 1569-1578.
20. Y.Z. Pan, H.Q. Bao, N.G. Sahoo, T.F. Wu, L. Li, Water-Soluble Poly(N-
isopropylacrylamide)-Graphene Sheets Synthesized via Click Chemistry for Drug
Delivery, Adv Funct Mater 21 (2011) 2754-2763.
21. Z.Y. Xu, S. Wang, Y.J. Li, M.W. Wang, P. Shi, X.Y. Huang, Covalent
Functionalization of Graphene Oxide with Biocompatible Poly(ethylene glycol) for
Delivery of Paclitaxel, Acs Appl Mater Inter 6 (2014) 17268-17276.

Chapter 4
102 Artur M. Pinto – Jan 2017
22. M. Wojtoniszak, X.C. Chen, R.J. Kalenczuk, A. Wajda, J. Lapczuk, M. Kurzewski, M.
Drozdzik, P.K. Chu, E. Borowiak-Palen, Synthesis, dispersion, and cytocompatibility of
graphene oxide and reduced graphene oxide, Colloid Surface B 89 (2012) 79-85.
23. L.Z. Feng, S.A. Zhang, Z.A. Liu, Graphene based gene transfection, Nanoscale 3
(2011) 1252-1257.
24. A.M. Pinto, J. Cabral, D.A.P. Tanaka, A.M. Mendes, F.D. Magalhaes, Effect of
incorporation of graphene oxide and graphene nanoplatelets on mechanical and gas
permeability properties of poly(lactic acid) films, Polym Int 62 (2013) 33-40.
25. B.D. Ratner, A. Hoffman, F. Schoen, J. Lemons, Biomaterials Science: An Introduction
to Materials in Medicine, third ed., Academic Press, 2012.
26. B.A.C. Harley, L.J. Gibson, In vivo and in vitro applications of collagen-GAG
scaffolds, Chem Eng J 137 (2008) 102-121.
27. L.S. Nair, C.T. Laurencin, Biodegradable polymers as biomaterials, Prog Polym Sci 32
(2007) 762-798.
28. D. Puppi, F. Chiellini, A.M. Piras, E. Chiellini, Polymeric materials for bone and
cartilage repair, Prog Polym Sci 35 (2010) 403-440.
29. T. Kuilla, S. Bhadra, D.H. Yao, N.H. Kim, S. Bose, J.H. Lee, Recent advances in
graphene based polymer composites, Prog Polym Sci 35 (2010) 1350-1375.
30. A. Weyers, R.J. Linhardt, Neoproteoglycans in tissue engineering, Febs J 280 (2013)
2511-2522.
31. G. Tripodo, A. Trapani, M.L. Torre, G. Giammona, G. Trapani, D. Mandracchia,
Hyaluronic acid and its derivatives in drug delivery and imaging: Recent advances and
challenges, Eur J Pharm Biopharm 97 (2015) 400-416.
32. H.X. Wu, H.L. Shi, Y.P. Wang, X.Q. Jia, C.Z. Tang, J.M. Zhang, S.P. Yang,
Hyaluronic acid conjugated graphene oxide for targeted drug delivery, Carbon 69
(2014) 379-389.
33. "Reprinted from Carbon, 99, Artur M. Pinto, Carolina Gonçalves, Daniela M. Sousa,
Ana R. Ferreira, J. Agostinho Moreira, Inês C. Gonçalves, Fernão D. Magalhães,
Smaller particle size and higher oxidation improves biocompatibility of graphene-based
materials, Pages 318-29, Copyright (2015), with permission from Elsevier.".
34. A. Sasidharan, L.S. Panchakarla, A.R. Sadanandan, A. Ashokan, P. Chandran, C.M.
Girish, D. Menon, S.V. Nair, C.N.R. Rao, M. Koyakutty, Hemocompatibility and
Macrophage Response of Pristine and Functionalized Graphene, Small 8 (2012) 1251-
1263.
35. K.H. Liao, Y.S. Lin, C.W. Macosko, C.L. Haynes, Cytotoxicity of Graphene Oxide and
Graphene in Human Erythrocytes and Skin Fibroblasts, Acs Appl Mater Inter 3 (2011)
2607-2615.
36. K. Yang, J.M. Wan, S.A. Zhang, Y.J. Zhang, S.T. Lee, Z.A. Liu, In vivo
Pharmacokinetics, Long-Term Biodistribution, and Toxicology of PEGylated Graphene
in Mice, Acs Nano 5 (2011) 516-522.
37. A.M. Pinto, C. Gonçalves, D.M. Sousa, A.R. Ferreira, J.A. Moreira, I.C. Gonçalves,
F.D. Magalhães, Smaller particle size and higher oxidation improves biocompatibility
of graphene-based materials, Carbon 99 (2015) 318-29.
38. T. Lammel, P. Boisseaux, M.L. Fernandez-Cruz, J.M. Navas, Internalization and
cytotoxicity of graphene oxide and carboxyl graphene nanoplatelets in the human
hepatocellular carcinoma cell line Hep G2, Part Fibre Toxicol 10 (2013).
39. K. Kalaitzidou, H. Fukushima, L.T. Drzal, Mechanical properties and morphological
characterization of exfoliated graphite-polypropylene nanocomposites, Compos Part a-
Appl S 38 (2007) 1675-1682.
40. W.X. Li, Z.W. Xu, L. Chen, M.J. Shan, X. Tian, C.Y. Yang, H.M. Lv, X.M. Qian, A
facile method to produce graphene oxide-g-poly(L-lactic acid) as an promising
reinforcement for PLLA nanocomposites, Chem Eng J 237 (2014) 291-299.
41. C. Monteiro, M. Fernandes, M. Pinheiro, S. Maia, C.L. Seabra, F. Ferreira-da-Silva, F.
Costa, S. Reis, P. Gomes, C.L. Martins, Antimicrobial properties of membrane-active
dodecapeptides derived from MSI-78, Biochim Biophys Acta-Biomembr 1848 (2015)
1139–1146.

PLA/carbon-based nanomaterials composites – literature review
Artur M. Pinto – Jan 2017 103
Chapter 5
PLA/carbon-based nanomaterials
composites:
Literature review
This chapter was based in a paper to be submitted:
Poly(lactic acid) composites reinforced with carbon-based nanomaterials: a
review
A.M. Pinto1,2,3, C. Gonçalves1, I.C. Gonçalves2,3, F.D. Magalhães1
1 LEPABE - Faculdade de Engenharia, Universidade do Porto, rua Dr. Roberto Frias, 4200-465 Porto, Portugal;
2 INEB - National Institute of Biomedical Engineering, University of Porto, Rua do Campo Alegre, 823, 50-180 Porto,
Portugal;
3 i3S - Institute for Innovation and Health Research, University of Porto, Rua Alfredo Allen, 208, 4200-135 Porto, Portugal.

Chapter 5
104 Artur M. Pinto – Jan 2017

PLA/carbon-based nanomaterials composites – literature review
Artur M. Pinto – Jan 2017 105
5 PLA/CARBON-BASED NANOMATERIALS
COMPOSITES – LITERATURE REVIEW
5.1 Scope
Poly(lactic acid) (PLA) is a green alternative to petrochemical commodity plastics, used in
packaging, agricultural products, disposable materials and textiles, and automotive. It also is
approved by regulatory authorities for several biomedical applications. However, for some uses it
is required that some of its properties are improved, namely thermo-mechanical and electrical
properties. The incorporation of nanofillers is a common approach to attain this goal. The
outstanding properties of carbon-based nanomaterials (CBNs), caused a surge on research works
on PLA/CBNs composites. Since there is a great amount of information on these materials, it was
gathered, compared and conclusions withdraw from it. This chapter is focused on PLA/CNTs
(carbon nanotubes) and GBMs (graphene-based materials) composites production methods, and
the effects of CBNs on PLA properties, namely mechanical, thermal, electrical and biological
properties.
5.2 State of the art
5.2.1 Introduction
The growing environmental awareness and new rules and regulations are forcing the industries to
seek more ecologically friendly materials for their products. [1] In the last two decades, industrial
and academic research on polymer composites was pursued to provide added value properties to
the neat polymer without sacrificing its processability or adding excessive weight. [2]
Poly(lactic acid) (PLA) has had significant demand due to its versatile applications in packaging,
pharmaceutical, textiles, engineering, chemical industries, automotive, biomedical and tissue
engineering fields. [3] However, the relatively low glass transition temperature, low thermal
dimensional stability, and mechanical ductility limit the number of its applications. A significant
Chapter 5
106 Artur M. Pinto – Jan 2017
body of research has dealt with the use of fillers for improving the properties of PLA. [4-6] In this
context, carbon based nanomaterials (CBNs), offer the potential to combine PLA properties with
several of their unique features, such as high mechanical strength, electrical conductivity, thermal
stability and bioactivity. [7-12] Carbon nanotubes (CNTs) and graphene-based materials (GBMs)
are state of the art and very promising representatives of these materials. CNTs have exceptional
mechanical properties, aspect ratio, electrical and thermal conductivities, and chemical stability.
However, their production methods are usually complex and expensive, often leaving toxic metal
residues. [13-16] Hence, GBMs provide an alternative option to produce functional composites due
to their excellent properties and the natural abundance of their precursor, graphite. Moreover,
GBMs can be produced by simple and inexpensive physico-chemical methods (Figure 5.1). [17-20]
In the last years there has been a surge of research works on PLA/CNTs and PLA/GBMs
composites. Due to the large amount of information available, there is the need to congregate,
compare and withdraw conclusions.
Several recent reviews have addressed PLA [3, 21-26] and CBNs [26-43] synthesis/production,
applications and properties, however, there is no such work available focused on PLA/CBNs
composites. This reason, this work presents some introductory information about PLA and CBNs,
namely CNTs and GBMs, followed by a comprehensive comparison and discussion on the current
progress regarding the production of PLA/CBNs composites and the resulting properties, namely
mechanical, electrical, thermal and biological.
5.2.2 Materials
5.2.2.1 Poly (lactic acid)
PLA is a thermoplastic aliphatic polyester commonly produced by polymerization of lactic acid
monomer. As lactic acid is a chiral molecule, existing in l and d isomers, the term “poly(lactic
acid)” refers to a family of polymers: poly-l-lactic acid (PLLA), poly-d-lactic acid (PDLA), and
poly-d,l-lactic acid (PDLLA). PLA can be polymerized by diverse methods, like
polycondensation, ring opening polymerization, azeotropic dehydration condensation, and
enzymatic polymerization. Direct polymerization and ring opening polymerization are the most
used. Controlling polymerization parameters is important, since PLA properties vary with isomer
composition, temperature, and reaction time used. [3, 21, 24, 25, 44-47]
The increasing interest on PLA has to do with aspects that lack in other polymers for the same
applications, regarding renewability, biocompatibility, processability, and energy saving. [25] PLA

PLA/carbon-based nanomaterials composites – literature review
Artur M. Pinto – Jan 2017 107
is derived from renewable and biodegradable resources such as corn and rice, and its degradation
products are non-toxic. Thus, PLA finds application as biodegradable matrix for surgical implants
and in drug delivery systems. [3] Furthermore, PLA is a green alternative to petrochemical
commodity plastics, used in packaging, agricultural products, disposable materials and textiles,
and automotive. [21]
The use of PLA has some shortcomings, related to poor chemical modifiability, mechanical
ductility, slow degradation [45], and relatively high price [24]. To overcome some of these issues,
some approaches are commonly used, like blending with other polymers [48-55], functionalization
[56-60], and addition of nanofillers [5, 6, 47, 61-66]. The last is an interesting choice, since with small
filler amounts it is possible to enhance desired features, keeping PLA’s key properties intact. The
most used nanofillers are nanoclays [4, 67-76], nanosilicas [5, 64, 65, 69, 77, 78], and carbon
nanomaterials [6, 73, 79-84].
3.2.2.2. Carbon-based nanomaterials
There are several types of carbon-based nanomaterials (carbon nanotubes, graphene-based
materials, fullerenes, nanodiamonds) and most have been tested to improve PLA properties. This
review is focused on the most widely tested and available: CNTs and GBMs. The high specific
area of these materials allows for low loadings to be sufficient to tune key properties concerning
mechanical, thermal, and electrical performance.
3.2.2.2.1. CBNs production methods and modifications
Graphene is the elementary structure of graphite, being a one carbon atom thick sheet, composed
of sp2 carbon atoms arranged in a flat honeycomb structure composed of two equivalent sub-
lattices of carbon atoms bonded together with σ bonds (in plane) and a π bond (out-of-plane),
which contributes to a delocalized network of electrons. [36, 43, 85] These unique characteristics
explain its unmatched electronic, mechanical, optical and thermal properties. For that reason, this
material has been studied to be applied in many fields, such as electronics [86-91], energy [92-95],
membrane [96-99], composite [17, 18, 20, 100], and biomedical technology [10, 101-103].
The intrinsic properties of graphene, and GBMs in general, are affected by the production or
modification methods. For example, structural integrity of graphene sheets is disrupted by

Chapter 5
108 Artur M. Pinto – Jan 2017
oxidation and some other chemical modifications. The dimensions (diameter and thickness) of the
final GBMs also depend on the raw materials and methods employed. [10, 30, 31, 43, 86] Thus, those
should be chosen according to desired applications.
GBMs can be obtained by top-down and bottom-up approaches. [100] The first involves exfoliating
graphite to obtain few or single layer graphene sheets. [35, 104] The second, consists in assembling
graphene from deposition of carbon atoms from other sources. [105, 106] The main difficulty in top-
down methods is to overcome the van der Waals forces that hold the graphene layers together in
graphite, preventing reagglomeration and avoiding damages in the honeycomb carbon structure.
[107, 108]
Some examples of such methods are micromechanical exfoliation, direct sonication,
electrochemical exfoliation, and superacid dissolution. Figure 5.1 summarizes the paths for
obtaining different GBMs from top-down approaches. Bottom-up methods include chemical
vapor deposition (CVD), arc discharge, and epitaxial growth on silicon carbide. [100]
Figure 5.1: Evolution Scheme showing the relation between different types of GBMs and
their top-down production methods.
The structure of CNTs can be conceptualized by wrapping graphene into a cylinder. Typically,
CNTs are classified as either single-walled carbon nanotubes (SWCNTs) or multi-walled carbon
nanotubes (MWCNTs). SWCNTs exhibit better electrical properties, while MWCNTs display
better resistance to chemicals. [109]
CNTs can be produced using different methods, which mainly involve gas phase processes [110,
111], like CVD, arc discharge, and laser ablation [112]. The most commonly used and efficient

PLA/carbon-based nanomaterials composites – literature review
Artur M. Pinto – Jan 2017 109
methods are the ones involving CVD, in which a carbon source is deposited on a catalyst that
causes it to decompose into carbon atoms forming CNTs. This method has the advantages of
allowing mild and controllable synthesis in large scale, with reduced costs. [113] CNTs are strong,
flexible, electrically conductive, and can be functionalized. [114] Potential applications of CNTs
have been reported such as in composite materials [115], electrochemical devices [116], hydrogen
storage [117], field emission devices [118], nanometer-sized electronic devices, sensors and probes
[119]. Determining the toxicity of CNTs has been one of the most pressing questions in
nanotechnology. [120] There is still some controversy on this subject, thus continued research is
needed to assure that these materials are safe for biomedical applications. [121, 122] Parameters
such as structure, size distribution, surface area, surface chemistry, surface charge and
agglomeration state, as well as the sample purity, have considerable impact on CNTs properties.
[114]
In the research works reported in this review, CBNs are both commercial products or lab-made by
the authors. Most CNTs are commercial, because their main production method is CVD, which
requires expensive equipment. The suppliers often make available the dimensions of the materials
and sometimes the type of CVD used. On the other hand, GBMs are usually produced by
researchers from graphitic precursors, using top-down methods involving chemical oxidation and
exfoliation, namely the Saudenmaier and modified Hummers methods (Figure 5.2). Commercial
GBMs are also used, with suppliers giving information about dimensions, and sometimes
production methods. These involve chemical oxidation and exfoliation processes, using
sonication and microwaves. Commercial products offer insured reproducibility and widespread
availability. Moreover, with the optimization of the production processes, the costs of GBMs are
coming closer to its precursor, graphite. [10]
CBNs have been extensively used in polymer composites. In order to take advantage of their large
surface area maximizing its effectiveness as filler, the degree of dispersion must be the highest
possible, leading to attainment of reasonable quantities of deagglomerated single units.
Functionalization is often used to improve compatibility with the polymer matrix. However, this
can disrupt the sp2 hybridisation of the graphene sheets and subsequently hinder their properties.
[123] Some examples of CBNs modifications used on the research works reported in this review
are compiled in Figure 5.3. Some of these involve simple chemical oxidation, prior to surface
modification with isocyanates, polymers (ethylene glycol, poly(caprolactone), methyl
methacrylate, poly(vinyl pyrrolidone), and PLA)), polyols, silanes or amines. The impact of these
on the composite properties is discussed in section 5.2.4.

Chapter 5
110 Artur M. Pinto – Jan 2017
Figure 5.2: Scheme showing the different types of modifications performed on CBNs prior
to incorporation in PLA.

PLA/carbon-based nanomaterials composites – literature review
Artur M. Pinto – Jan 2017 111
Figure 5.3: Scheme showing the different production methods of PLA/CBNs composites.

Chapter 5
112 Artur M. Pinto – Jan 2017
5.2.3 Production of PLA/CBNs composites
Three methods are most frequently used to obtain a dispersion of CBNs into a polymer matrix:
solution mixing, melt blending, and in situ polymerization. [18, 100]
5.2.3.1 Solution mixing
Solution mixing is a simple procedure, requiring no special equipment, and allowing for
straightforward scale-up. This method typically consists of three steps: i) dispersion of the
nanomaterial in a suitable solvent using sonication or mechanical stirring, ii) dissolution of the
polymer in the previous dispersion, under appropriate stirring, and iii) removal of the solvent by
distillation or lyophilization. Often the dispersion is cast into a flat mold, and then the solvent is
evaporated. Flat composite slabs are therefore obtained. For this reason, the procedure is often
called “solvent casting”. As an alternative, the dispersion may be cast onto a low surface energy
material (e.g. PTFE coated surface) using a blade applicator. After solvent evaporation, thin
composite films are obtained. The viscosity of the dispersion needs to be adjusted for this
procedure, which can be done by changing the concentration of polymer. [124] If production of
fibers is desired, the third step can be replaced by electrospinning. This technique allows
obtaining fibers that are much smaller in diameter (ranging from micrometers to nanometers) than
those produced by conventional techniques. The basis of electrospinning is to charge the polymer
solution in the spinneret tip with a high voltage, so that the induced charges cause the polymer
solution to eject and travel towards the ground collector. [23]
Complete solvent removal is a critical issue when using solution mixing to prepare composites,
since toxicity concerns may arise when organic solvents are used. In addition, presence of residual
solvent induces plasticization of the polymer matrix, which may alter significantly its mechanical
properties. [125-127]
PLA is soluble in organic solvents such as chlorinated solvents, benzene, tetrahydrofuran (THF),
dimethyl formamide (DMF) and dioxane, but insoluble in ethanol, methanol, and aliphatic
hydrocarbons. CBNs are hydrophobic, thus not being easily dispersed in polar solvents, however,
they can be oxidized or modified with hydrophilic groups, in order to allow dispersion in this sort
of solvents. Solubility limitations can also be overcome to a certain point by using ultrasonication
to produce short-time metastable dispersions of CBNs in organic solvents, which can then be
mixed with polymer solutions. [128]

PLA/carbon-based nanomaterials composites – literature review
Artur M. Pinto – Jan 2017 113
Chloroform is the most used solvent to prepare PLA/CNTs composites. [129-134] McCullen et al.
[135] concluded that a combination of chloroform and DMF is beneficial. Some authors obtained
good results with THF [84, 136], and dichloromethane [137, 138]. Sometimes the introduction of new
functional groups may originate incompatibility with the polymer matrix. To elude this problem,
improvement of CNTs dispersion by surfactant addition (e.g., polyoxyethylene 8 lauryl, dodecyl
octaethylene) may be used, which allows preserving the chemical structure of the nanofiller. [139]
GBMs have been often incorporated in PLA by solution mixing using chloroform [126, 140-142] or
DMF [143-149] as solvents. Agglomeration of CBNs may take place during solvent evaporation.
Composite formation by electrospinning allows minimizing this problem, but leads to formation
of fibers and not films. [23, 135]
5.2.3.2 Melt-blending
Melt blending is an economically attractive, environmentally friendly and highly scalable method
for preparing nanocomposites. This strategy involves direct addition of the nanomaterial into the
molten polymer, allowing optimization of the state of dispersion by adjusting operating
parameters such as mixing speed, time and temperature. Due to the absence of solvent, the only
compatibility issue is placed in terms of the nanofiller towards the polymer matrix. [23, 47] The
drawbacks of this procedure are the low bulk density of CBNs, that makes the feeding of the
melt-mixer a troublesome task and the lower degree of dispersion that is usually attained when
compared to solvent mixing. [128, 150]
Most published research works use a lab-scale melt mixer to melt PLA and mix it with the
nanofillers. Typical processing conditions correspond to temperatures between 160 and 180 ºC
[151-157], mixing times of 5 to 10 minutes [151-153, 155, 156, 158], and rotation speeds between 50 and
100 rpm [151-155, 157-160]. After mixing, the composite materials are almost always moulded into
flat sheets with controlled thickness in a hot press, however, other methods are also used (e.g.,
injection moulding and piston spinning). Typically, the pressing is performed between 160 and
190 ºC for 2 to 5 minutes, under 110 to 150 Kgf cm-2 pressure. [151, 156-161]
In addition to melt blending not being as effective as the solution mixing method or in situ
polymerization in terms of the ability to achieve good filler dispersion, damage to the nanofillers
or polymer may occur under severe conditions. Some studies have shown that processing
conditions can have an impact on the molecular weight of PLA. [162] This can be mainly attributed
Chapter 5
114 Artur M. Pinto – Jan 2017
to the presence of impurities such as acidic species, peroxide groups, metallic ions or other
residual products that can increase the degradation of PLA during melt mixing. [163]
5.2.3.3 In situ polymerization
In situ polymerization for production of polymer composites generally involves mixing the filler
in neat monomer, or a solution of monomer, in the presence of catalysts and under proper reaction
conditions. [164] The polymer chains grow on the filler surface, forming covalently bonded grafts.
In situ polymerization generally results in more homogeneous particle dispersion than melt
blending. [165] Contrary to CNTs, that usually are post-treated, graphene and GBMs already
present some chemical groups that can be used in further functionalization, such as grafting
polymer chains via atom transfer radical polymerization. Examples of in situ polymerization on
GBMs include polymers such as polyaniline (PANI), polyurethane (PU), polystyrene (PS),
poly(methyl methacrylate) (PMMA) and polydimethylsiloxane (PDMS). [20]
Concerning PLA in situ polymerization, only a few approaches have been presented in the
literature. Ring opening polymerization of l-lactide in presence of GBMs has been reported by
Yang et al. [166] and Promoda et al [167]. No significant studies were found for PLA/CNTs
composites.
The abovementioned methods can be used both for GBMs and CNTs, for that reason, the methods
used in the research works reported in this review were congregated in Figure 5.3. Since the
methods were already discussed, further details are only given in Tables 5.1-4 and described on
the discussion of the results in those presented, in section 5.2.4, for studies that show important
achievements in PLA properties improvement.
5.2.4 Properties of PLA/CBNs Composites
As mentioned above, PLA has potential to replace petrochemical plastics if its mechanical and
thermal properties are improved. Also, its bio-origins can be an advantage, when considering
biomedical applications. For those reasons, numerous researchers have studied the different
properties and applications of PLA alone and in combination with other materials that are able to
tune key properties regarding its specific applications. [47] Here the effect of the incorporation of
some of those materials in PLA will be discussed, namely CNTs which are known for two

PLA/carbon-based nanomaterials composites – literature review
Artur M. Pinto – Jan 2017 115
decades with established large scale production methods, and GBMs, which present a growing
interest from scientific community, and are cheaper and comparable in properties to CNTs. [167]
5.2.4.1 Mechanical Properties
CBNs present remarkable mechanical properties and when well dispersed in polymer matrices
often improve their mechanical performance. Physico-chemical interactions between fillers and
polymer phase contribute to load transfer and distribution along the CBNs network. Table 5.1
shows that solution mixing is the most commonly reported method for incorporation of CBNs in
PLA. The most frequently used solvents are chloroform, DMF and THF. The filler concentrations
most often tested are between 0.1 – 2 wt.%. Maximum improvements in Young’s modulus (E),
storage modulus (E’), and tensile strength (σmax) are found for concentrations between 0.25 - 5
wt.% for CNTs, and between 0.1 - 1 wt.% for GBMs. The larger observed improvement in E,
relative to unfilled PLA, was of 372%, obtained with 0.25 wt.% MWCNTs incorporated by
sonication in a PLA/chloroform dispersion, followed by compression moulding of the dried
mixture. [129] For GBMs, the best performance was an increase of 156 % with incorporation of 0.4
wt.% GNP-M, also by sonication, but followed by film casting by doctor blading. [126] The
maximum increase on E’ was of 1500 %, and was achieved with incorporation of 0.5 wt.% rGO-
KH792 in PLLA, by simple stirring, casting on PTFE mould, and vacuum drying the resultant
films at 120 °C for 48h. [149] However, this increase only occurs around PLA transition
temperature (60-65 °C). At ambient temperature, the best result was an increase of 67 % with
incorporation of 3 wt.% A-SWCNTs-Si (acid treated and grafted with 3-isocyanatoporpyl
triethoxysilane) in PLA by sonication, followed by drying and compression moulding at 190 °C.
[136] The maximum increase in σ was of 129 wt.%, obtained with incorporation of 0.4 wt.% GNP-
M in PLA by sonication and film casting by doctor blading. [126] For CNTs the best result was an
increase of 47 % obtained with MWCNT grafted with PLA, and then incorporated at a loading of
1 wt.% in PLA by sonication in chloroform, separation, drying and compression moulding at 180
ºC. [132] When considering CNTs without modification, the best result reported is an increase of
9% for 1.2 wt.% MWCNTs incorporated in PLA by solution mixing, followed by drying and
compression moulding at 180 ºC with a pressure of 1000 Kg. [133]
Melt-blending is less frequently reported than solution mixing for production of PLA/CBNs
composites, probably due to the lower availability of the necessary equipment. Results show that
it tends to be not as effective improving mechanical properties, as solution mixing. The best
performance in terms of E (↑88%) and E’ (↑76%) was reported by Lin et al. [151] for an

Chapter 5
116 Artur M. Pinto – Jan 2017
incorporation of 3 wt.% MWCNT grafted with stearyl alcohol (MWCNT-C18OH) in PLA by melt
blending (180 °C, 5 min, 50 rpm), using Ti(OBu)4 for transesterification, followed by
compression moulding at the same temperature. When PLA was not transesterified, E and E’
increases were of 74 and 44 %, respectively. The maximum increase in σmax (40 %) was obtained
incorporating 0.08 wt.% rGO using a twin-screw mixer (175 °C, 8 min, 60 rpm), followed by
compression moulding at 180 °C. [159]
In-situ polymerization is the least used technique. It has been reported by Pramoda et al. [167], who
performed PLA ring-opening polymerization in presence of 1 wt.% of GO functionalized with
butanediol and GO modified with POSS silsesquioxane. In the first case, improvements of 1 %
and 14 % in E and hardness were obtained, respectively. In the second, the performance was
increased by 33 % and 45 %, in the same order.
Comparing the results for CNTs and GBMs, we can conclude that both can effectively improve
PLA mechanical properties, whether by solution mixing and melt blending. However, use of
GBMs usually implies lower amounts of GBMs than of CNTs. Several chemical modifications
have been tried to improve compatibility with the polymer matrix, with ineffective results is some
cases. Functionalization with carboxyl groups is the most common and effective procedure to
improve CNTs compatibility with PLA matrix. [138] On the other hand, no relation has been
observed between CBNs morphological properties (size, length, and diameter) and the mechanical
performance of the composites.

Chapter 5 PLA/carbon-based nanomaterials composites – literature review
Artur M. Pinto – Jan 2017 117
Table 5.1: Mechanical properties of PLA/CBNs composites in comparison with non-modified PLA. Production methods and CBNs characteristics.
Method Procedure for composite preparation CBNs characteristics CBNs loading (wt.%)
Mechanical properties
relative to neat polymer
E: maximum Young’s modulus improvement
E’: maximum storage modulus improvement
σmax: maximum tensile strength improvement
References
Solution mixing
Sonication in chloroform and DMF,
electrospinning
Diameter (d) 15±5 nm
Length (l) 5-20 µm
95 % purity
Produced by plasma enhanced
CVD
MWCNT: 0.25, 0.5, 1 ΔE↑372 (0.25 wt.%) [135]
Sonication in chloroform, drying and
compression moulding (200 ºC, 150
Kgf/cm2, 15 min)
d not given
l ± 2000 µm MWCNT: 0.5, 3, 5, 10 ΔE↑50 (5 wt.%) [129]
Sonication in chloroform, film casting.
Unzipped CNTs
Diameter 30 nm
l = 10 µm
95 % purity
uCNT: 1, 2, 3, 4, 5 ΔE'↑4(3 wt.%) [130]
PLA was modified with benzoyl chloride
and pyridine (PLAm), then acid chloride
groups were added by reaction with
thionyl chloride and triethylamine, then
fMWCNTs were added and the mixture
centrifuged and filtered to remove excess
filler and salts. Finally, sonication in
chloroform and film casting was
performed.
MWCNT functionalized with
COOH using Fenton reactant
and then reacted with SOCl2
and ethylene glycol
(fMWCNT).
d = 9.5 nm
l = 1.5 µm
95 % purity
Not clear ΔE↑17, σmax↑8 % (comparing to PLAm) [131]
Sonication in chloroform, coagulation
with methanol, filtration, vacuum drying,
and compression moulding (180 ºC)
MWCNT (thermal CVD, d =
10-15 nm, l = 10-20 µm, 95 %
purity)
MWCNT carboxyl-
functionalized (MWCNT-
COOH) by H2SO4 1:3 HNO3,
3h, 120 °C
MWCNT grafted with PLA
(MWCNT-g-PLA): MWCNTs-
COOH + l-lactide, 12 h, 150
°C, + tin(II) chloride, 20h, 180
°C, under vacuum, filtration,
MWCNT: 1
MWCNT-COOH: 1
MWCNT-g-PLA:0.1, 0.2,
0.5, 1, 5
MWCNT-g-PLA: ΔE↑32Δσmax↑47 % (1
wt.%)
[132]

Chapter 5 PLA/carbon-based nanomaterials composites – literature review
118 Artur M. Pinto – Jan 2017
vacuum drying
Solution mixing in chloroform, drying
and compression molding (180 ºC).
MWCNT,
MWCNT grafted with PLLA
after reaction with SOCl2 and
ethylene glycol (MWCNT-g-
PLLA)
Dimensions not given
95 % purity
MWCNT and MWCNT-g-
PLLA: 0.1, 0.2, 0.4, 0.6,
0.8, 1.2
MWCNT: ΔE↑46Δσmax↑9 % (1.2 wt.%)
MWCNT-g-PLLA: ΔE↑86Δσmax↑13 % (1.2
wt.%)
[133]
Solution mixing in chloroform, filtered,
washed, dried under vacuum, and
compression moulded (180 ºC, 500 psi).
MWCNT, MWCNT-COOH
(both as in [101]), and
MWCNT grafted with PLA
chains of 122-530 g mol-1 by
ring open polymerization
(MWCNT-g-PLA530).
d = 10-15 nm
l = 10-20 µm
95 % purity
MWCNT-COOH: 1
MWCNT-g-PLA530: 1
MWCNT-COOH: ΔE↑4Δσmax = 9 %
MWCNT-g-PLA530: ΔE↑44 Δσmax = 44 % [134]
Solution mixing in THF, vacuum drying,
thermal compression
SWCNT (d < 2 nm, l = 5-15
µm, 95 % purity) treated with
3:1 H2SO4/HNO3 (A-
SWCNT), and functionalized
(1:2 v/v) with 3-
isocyanatoporpyl
triethoxysilane (IPTES) - A-
SWCNT-Si
SWCNT, A-SWCNT and
A-SWCNT-Si: 0.1, 0.3,
0.5, 1, 3
SWCNT: ΔE'↑20 %
A-SWCNT: ΔE'↑33 %
A-SWCNT-Si: ΔE'↑67 %
(3 wt.% for all conditions)
[136]
Sonication in dichloromethane and THF,
vacuum drying, and compression molding
(190 ºC)
MWCNT (d = 9-20 nm, l = 5
µm) functionalized with 3:1
H2SO4/HNO3 (MWCNT-
COOH)
MWCNT-COOH: 0.5, 1,
2.5
MWCNT: 2.5
MWCNT-COOH: ΔE↑80 %, ΔE'↑35%, Δσmax
↑28% (2.5 % wt.%)
MWCNT: ΔE↑25 %, ΔE'↓6%, Δσmax (not
reported)
(2.5 wt.%)
[138]
Melt blending
Internal mixer (180 ºC, 50 rpm, 5 min)
with and without transesterification with
Ti(OBu)4, compression molding (180 ºC)
MWCNT (l = 1-10 µm)
functionalized with HNO3 (120
ºC, 40 min) - MWCNT-
COOH, and modified with
DCC and stearyl alcohol
(MWCNT-C18OH)
PC: MWCNT/PLA
PC-18: MWCNT-
C18OH/PLA
PC-18T: MWCNT-
C18OH/PLA
transesterified
0.5, 1.5, 3
(3 wt.%)
PC: ΔE↑73%, ΔE'↑34%
PC-18: ΔE↑74%, ΔE'↑44%
PC-18T: ΔE↑88%, ΔE'↑76%
[151]
Twin-screw extrusion (150-190 ºC, 100
rpm), injection molding (160-190 ºC)
High-crystalline PLA (HC-PLA) and
low-crystalline PLA (LC-PLA) were
tested
MWCNT (l = 5-20 µm, d = 40-
60 nm) fuctionalized with
maleic anhydride (MWCNT-g-
MA) at 80 ºC, 4h, + benzoyl
peroxide
LC-PLA/MWCNT, HC-
PLA/MWCNT and
MWCNT-g-MA: 0.25, 0.5,
0.75, 1, 2, 4
LC-PLA/MWCNT: σmax↑23 %
HC-PLA/MWCNT: σmax↑13 %
MWCNT-g-MA: σmax↑27 %
(4 wt.% for all conditions)
[154]

Chapter 5 PLA/carbon-based nanomaterials composites – literature review
Artur M. Pinto – Jan 2017 119
Twin-screw extrusion (180 ºC, 150 rpm, 5
min), compression molding at 180 ºC
d = 6-13 nm, l = 2.5-20 µm,
specific surface area = 220
m2g-1
produced by CVD
MWCNT: 1.5, 3, 5 MWCNT: E'↑28 %, σmax↑27% (5 wt.%) [156]
Twin-screw extrusion (160 ºC-190 ºC) Carboxyl-functionalized
d = 10-11 nm, l = 12-15 µm MWCNT-COOH: 1 E andσmax↑8(1 wt.%) [168]
Method Procedure for composite preparation CBNs characteristics CBNs loading (wt.%)
Mechanical properties
relative to neat polymer
E: maximum Young’s modulus improvement
E’: maximum storage modulus improvement
σmax: maximum tensile strength improvement
References
Solution mixing
Sonication in chloroform, casting and
doctor blading
GO was pre-dispersed in acetone while
GNP was directly dispersed in
chloroform
GNP grade M (commercial
product)
t = 6-8 nm, d ≈ 5 µm.
GO (MHM)
d ≈ 100 nm
GO and GNP: 0.2, 0.4, 0.6 GO: E↑115σmax↑95 % (0.3 wt.%)
GNP: E↑156σmax↑129 % (0.4 wt.%) [126]
Sonication in chloroform, filtration,
vacuum drying, compression moulding
(170 ºC, 10 min)
GO (from natural graphite, MHM
+ lyophilization) d ≈ 300 nm
GO-g-PLLA (GO + l-lactide
(Sn(oct)2), filtration, vacuum
drying)
GO and GO-g-PLLA: 0.5 GO: σmax↑51 %
GO-g-PLLA: σmax↑106 % [141]
Stirring and sonication in DMF,
coagulation with methanol, filtration,
and vacuum drying
GO (MHM) from expandable
graphite, chemically reduced with
hydrazine, and lyophilized (GNSs
– solvent free graphene
nanosheets)
t < 1 nm, d < 50 nm.
GNSs: 0.2 E’↑18 %σmax↑26 % [143]
Sonication in DMF, coagulation with
methanol, drying, compression
moulding (185 ºC)
TRG (commercial product, t =
few layer, d = hundreds of nm)
TRG/PLA/Py-PLA: Py-PLA-OH
(1-Pyrenemethanol + l-lactide,
Sn(oct)2) + TRG (10:1) –
sonication + PLA – coagulation
and drying
TRG and TRG/Py-PLA-
OH: 0.25, 1
trGO: E’↑1-3 %σmax↑8 %
trGO/Py-PLA: E’↑10-15 %σmax↑19 % [145]
Solution mixing in DMF, film casting.
GO prepared according to MHM,
reduced to rGO and functionalized
with N-(aminoethyl)-
aminopropyltrimethoxysilane
(KH792).
rGO-KH792: 0.1, 0.2, 0.5 E’↑1500 % around the Tg (0.5 wt.%) [149]

Chapter 5 PLA/carbon-based nanomaterials composites – literature review
120 Artur M. Pinto – Jan 2017
Melt blending
Twin-screw mixer (175 ºC, 60 rpm, 8
min), compression molding at 180 ºC
GO prepared by MHM and
reduced with hydrazine and
ammonia (rGO)
t = 0.4-0.6 nm, d 0.1-0.5 µm
rGO: 0.02, 0.04, 0.08, 0.2,
0.5, 1, 2
E’↑27 %,σmax↑40 % (0.08 wt.%)
E’↑54 %,σmax↓40 % (2 wt.%) [159]
Internal mixer (160 ºC, 25 rpm, 10
min), compression moulding (160 ºC,
10 min)
(Polymer was PLA/PEG 9:1 blend
GNP grade M15 (commercial
product)
t = 6-8 nm, d ≈ 15 µm
GNP-M15: 0.1, 0.3, 0.5,
0.7, 1
E’↑84 and 70σmax↑20 and 33 % (0.1 and
0.3 wt.%)
(relative to pristine PLA/PEG blend)
[158]
Internal mixer (180 ºC, 80 rpm, 10 min)
GO (MHM) + SDS, ultrasounds,
stirring 12h, 25 ºC
Methylmethacrylate (MMA),
stirring 12h + ammonium
persulfate (APS) 12h, 80 ºC +
reduction with dimethyl
hydrazine, 100 ºC, 2h (PFG -
polymer-functionalized graphene
nanoparticles)
t = 2.4 nm
PFG: 1, 2, 3, 4, 5 E↑80 %σmax↑10 % (5 wt.%) [155]
In-situ
polymerization
Sonication of l-lactide + filler in
toluene, addition of Tin(II)-2-
ethylhexanoate under N2, stirring at 110
°C, 3 days
Expanded graphite (MHM) to GO
GO-fuctionalized: GO + TDI
+1,4-butanediol, 80 °C, 24h
GO-g-POSS: GO + POSS –
polyhedral oligomeric
silsesquioxane + DMAP – 4-
(dimethylaminopyridine) + EDC –
N-(3-dimethylamino-propyl-N’-
ethylcarbodiimide), 2 days, room
temperature, N2
(dimensions not given)
GO-fuctionalized, GO-g-
POSS, GO+POSS
(physical mixture): 1
GO-fuctionalized:
E’↑1 %Hardness ↑ 14 %
GO-g-POSS:
E’↑33 Hardness ↑ 45 %
GO+POSS:
E’↑29 %Hardness ↑ 36 %
[167]

PLA/carbon-based nanomaterials composites – literature review
Artur M. Pinto – Jan 2017 ……….. 121
5.2.4.2 Electrical properties
Neat PLA is electrically insulating with a low electrical conductivity (σ ≈ 1 x 10-16 S m-1), and
high sheet resistance ρ□ ≈ 5 x 10¹² Ω/sq). [136, 151] Since CNTs and reduced forms of GBMs
present high electrical conductivity, they can be incorporated in PLA to improve its conductivity.
These sort of composites have potential to be used as electrical stimulating implants, since PLA is
used as a biodegradable matrix in orthopedic material. Other advantages of increasing PLA
conductivity are the possibility of using it as antistatic coating/material or for electromagnetic
shielding. [100] The minimum amount of filler required to form a conductive network within the
polymer is called percolation threshold, and should be as low as possible in order to keep
processing simple (relatively low viscosity of the melt) and low costs. Table 5.2 shows that, once
again, the most used method to incorporate CBNs on PLA for electrical properties evaluation is
solution mixing. The amount of fillers ranges from 0.01 to 10 wt.%. The best result, considering
electrical conductivity (σ) with CNTs was 3.5 x 10⁻³ S m-1, obtained incorporating 10 wt.%
MWCNT in PLA by sonication in chloroform, followed by drying and compression moulding at
200 ºC during 15 min. [129] Results are also often presented in terms of sheet resistance (ρ□), being
the lowest value reported by Shao et al. [169], of 1 x 10² Ω/sq achieved incorporating 5 wt.%
MWCNTs previously oxidized (treated with HCl and HNO3) in PLA by solution mixing,
followed by electrospinning of aligned nanofibers (d ≈ 250 nm). The alignment of the fibers
slightly improved sheet resistance, comparing with random meshes. Interestingly, Yoon et al. [134]
observed a considerable sheet resistance of 1 x 10⁵ Ω/sq, with incorporation of 1 wt.% MWCNT-
COOH, also oxidized by treatment with strong acids (H2SO4 and HNO3). For GBMs, the
maximum conductivity reported was 2.2 S m-1, higher than for CNTs, obtained incorporating 1.25
wt.% rGO-g (reduced with ammonia) in PLA by sonication in DMF. Interestingly, the solvent
used for dispersion of CNTs in PLA was always chloroform and for GBMs was always DMF.
Melt-blending is the second most used approach to disperse CBNs in PLA in order to improve its
electrical properties, being most often performed by twin-screw extrusion, followed by
compression moulding. The highest σ considering CNTs was 50 S m-1, which was reported by
Pötschke et al. [170]. These authors prepared MWCNTs mixtures by twin-screw extrusion,
followed by piston spinning at different speeds. They concluded that non-spinned mixtures with 5
wt.% MWCNTs in PLA presented the same conductivity as 3 wt.% mixtures after piston spinning
at a speed of 20 m min-1. Considering ρ□, the best performance was obtained incorporating 3 wt.%
MWCNT-C18OH (MWCNTs modified with DCC and stearyl alcohol) using and external mixer,
followed by compression moulding at 180 ºC during 5 min, resulting in a ρ□ of 1 x 10⁻¹ Ω/sq. [151]
This was the most effective modification performed, considering the sheet resistance values
Chapter 5
122 Artur M. Pinto – Jan 2017
obtained with incorporation of the same amount of non-modified MWCNT, which was 3 x 10⁵
Ω/sq. For GBMs, the higher σ was 2.6 x 10⁻² S m-1, resultant from dispersion using an internal
mixer at 180 ºC, of 5 wt.% PFG (graphene nanoparticles functionalized with
methylmethacrylate). [155] For rGO, a non-functionalized GBM, the best conductivity value was
obtained for 2 wt.% incorporation in PLA using a twin-screw extruder and compression
moulding. The value obtained was of 1 x 10⁻⁹ S m-1, being higher than for the other concentrations
tested. It can be compared, for example, with a σ of 1 x 10-13 S m-1 for 0.2 wt.%. [159] In most
works evaluated, electrical properties improve with the increase of filler amount.
In-situ polymerization is the least explored technique, despite interesting results being obtained by
Yang et al. [166], which incorporated 0.01 – 2 wt.% trGO (thermally reduced) in PLA by ring-
opening melt polymerization of l-lactide in presence of the filler. As example, σ obtained was 5 x
10-6 and 1.6 x 10⁻² S m-1 for 1.5 and 2 wt.%, respectively.
An interesting study by Chiu et. al. [84], shows that purification of MWCNT by sonication with
strong acids improved fillers compatibility and dispersibility in PLA, resulting in better electrical
conductivity. The values of σ for incorporations of 7 wt.% were 5 x 10⁻⁸ and 2 x 10⁻⁶ S m-1,
respectively for non-purified and purified MWCNT. Purification introduced polar functional
groups on the CNTs surface, allowing better dispersion, which resulted in more deagglomerated
particles that formed a wider conductive network on PLA matrix.

Chapter 5 PLA/carbon-based nanomaterials composites – literature review
Artur M. Pinto – Jan 2017 123
Table 5.2: Electrical properties of PLA/CBNs composites in comparison with non-modified PLA. Production methods and CBNs characteristics.
Method Procedure CBNs characteristics CBNs Content (wt.%)
Electrical Properties
σ: electrical conductivity
ρ□: sheet resistance
(PLA σ ≈ 1 x 10-16 S m-1, ρ□ ≈ 5 x 10¹²
Ω/sq) [106, 122]
References
Solution mixing
Sonication in chloroform, drying and
compression moulding (200 ºC, 150
Kgf/cm2, 15 min)
Diameter (d) not given
Length (l) = ± 2000 µm MWCNT: 0.5, 3, 5, 10
σ = 1.8 x 10⁻³ and 3.5 x 10⁻³ S m-1 (3 and 10
wt.%) [129]
Sonication in chloroform, coagulation
with methanol, filtration, vacuum
drying, and compression moulding
(180 ºC)
MWCNT (thermal CVD, d
= 10-15 nm, l = 10-20 µm,
95 % purity)
MWCNT carboxyl-functionalized (MWCNT-
COOH) by H2SO4 1:3
HNO3, 3h, 120 °C
MWCNT grafted with PLA
(MWCNT-g-PLA):
MWCNTs-COOH + l-
lactide, 12 h, 150 °C, +
tin(II) chloride, 20h, 180 °C, under vacuum,
filtration, vacuum drying
MWCNT: 1
MWCNT-COOH: 1
MWCNT-g-PLA:0.1, 0.2,
0.5, 1, 5
MWCNT: ρ□ = 1 x 10¹² Ω/sq (for 0.1 and
0.2 wt.% is similar to PLA), 1 x 10⁵ and 1 x
104 Ω/sq (0.5 wt.%, and 1-5 wt.%)
MWCNT-g-PLA: ρ□ = 1 x 10¹² Ω/sq (0.1-5
wt.% - always similar to PLA)
[132]
Solution mixing in chloroform, drying
and compression molding (180 ºC).
MWCNT,
MWCNT grafted with
PLLA after reaction with
SOCl2 and ethylene glycol
(MWCNT-g-PLLA)
Dimensions not given
95 % purity
MWCNT and MWCNT-g-
PLLA: 0.1, 0.2, 0.4, 0.6,
0.8, 1.2
MWCNT: σ = 2 x 10-13 S m-1 (0.1-0.4
wt.%), 3 x 10⁻⁹ S m-1 (0.6 wt.%), and 2 x
10-5 S m-1 (1.2 wt.%)
MWCNT-g-PLLA: σ = 2 x 10-13 S m-1 (0.1-
0.4 wt.%), 5 x 10-13 S m-1 (0.6 wt.%), and 3
x 10-8 S m-1 (1.2 wt.%)
Increases with filler amount
[133]
Solution mixing in chloroform,
filtered, washed, dried under vacuum,
and compression moulded (180 ºC,
500 psi).
MWCNT, MWCNT-COOH (both as in [101]), and
MWCNT grafted with PLA
chains of 122-530 g mol-1
by ring open polymerization
(MWCNT-g-PLA530).
d = 10-15 nm
l = 10-20 µm
MWCNT-COOH: 1
MWCNT-g-PLA122-530: 1
MWCNT-COOH: ρ□ = 1 x 10⁵ Ω/sq
MWCNT-g-PLA112-530: ρ□ = 2 x 10⁶, 2 x
1012, and 1 x 10¹² Ω/sq (122, 250, 530 g
mol-1)
[134]

Chapter 5 PLA/carbon-based nanomaterials composites – literature review
124 Artur M. Pinto – Jan 2017
95 % purity
Sonication in THF, vacuum drying,
thermal compression
MWCNTs (d = 8-15 nm, l =
50 µm) purified by
sonication with H2SO4 and
HNO3 at 50 ºC, filtration, and washing
MWCNT purified/non-
purified: 1, 3, 5, 7
MWCNT purified: σ = 4 x 10⁻⁹, 1 x 10⁻⁹,
and 2 x 10⁻⁶ S m-1 (1, 5, and 7 wt.%)
MWCNT non-purified: σ = 7 x 10-11, 2 x
10-8, and 5 x 10⁻⁸ S m-1 (1, 5, and 7 wt.%) Increases with filler amount
[84]
Solution mixing in THF, vacuum
drying, thermal compression
SWCNT (d < 2 nm, l = 5-15
µm, 95 % purity) treated
with 3:1 H2SO4/HNO3 (A-
SWCNT), and
functionalized (1:2 v/v)
with 3-isocyanatoporpyl
triethoxysilane (IPTES) - A-
SWCNT-Si
SWCNT, A-SWCNT and
A-SWCNT-Si: 0.1, 0.3, 0.5,
1, 3
SWCNT: σ = 2 x 10-16, 3 x 10⁻⁹, and 5 x 10-
8 S m-1 (0.3, 1, 3 wt.%)
A-SWCNT-Si: σ = 5 x 10-15, 5 x 10⁻⁸, and 2
x 10-6 S m-1 (0.3, 1, 3 wt.%)
Increases with filler amount
[136]
MWCNTs-ox (HCl, 2h at 25°C + HNO3, 4h at 110 ºC)
Nanofibers (MWCNTs-ox sonicated
in DMF 2h + SDS, adding to PLA in
dicloromethane, 1h sonication before
electrospinning)
MWCNTs (l = 10–20 µm, d = 10–20 nm)
Nanofibers (PLA ≈ 400 nm,
PLA/MWCNTs-ox ≈ 250
nm)
PLA/MWCNTs-ox (3
wt.%) random (R) and
aligned (A) nanofibers: 1, 2,
3, 4, 5 wt.%
PLA/MWCNTs-ox-R: ρ□ = 1 x 10⁴, 5 x 10²
Ω/sq (3 and 5 wt.%)
PLA/MWCNTs-ox-A: ρ□ = 5 x 10³, 1 x 10²
Ω/sq (3 and 5 wt.%)
Increases with both fillers amount
[169]
Melt blending
Internal mixer (180 ºC, 50 rpm, 5
min) with and without
transesterification with Ti(OBu)4,
compression molding (180 ºC)
MWCNT (l = 1-10 µm)
functionalized with HNO3
(120 ºC, 40 min) -
MWCNT-COOH, and
modified with DCC and
stearyl alcohol (MWCNT-
C18OH)
PC: MWCNT/PLA
PC-18: MWCNT-
C18OH/PLA
PC-18T: MWCNT-
C18OH/PLA transesterified 0.5, 1.5, 3
PC: ρ□ = 2 x 10⁷, 3 x 10⁶, and 3 x 10⁵ Ω/sq
(0.5, 1.5, 3 wt.%)
PC-18: ρ□ = 8 x 10⁵, 9 x 10⁴, and 1 x 10⁻¹
Ω/sq (0.5, 1.5, 3 wt.%)
PC-18T: ρ□ = 5 x 10¹², 9 x 10⁵, and 9 x 10⁻²
Ω/sq (0.5, 1.5, 3 wt.%)
[151]
Twin-screw extruder (180, 215 and
250 ºC; 100, 200 and 500 rpm; 5 min) 1st – masterbatch production
2nd – dilution of masterbatches and
composites production
d = 9.5 nm l = 1.5 µm
90 % purity
MWCNT: 0.5, 0.75, 1, 2 σ is below 2.5 x 10⁻¹ S m-1 (0.5-2 wt.%)
slightly decreasing with filler wt.% increase [153]
Twin-screw extrusion (150-190 ºC,
100 rpm), injection molding (160-190
ºC)
High-crystalline PLA (HC-PLA) and low-crystalline PLA (LC-PLA) were
tested
MWCNT (l = 5-20 µm, d =
40-60 nm) fuctionalized
with maleic anhydride
(MWCNT-g-MA) at 80 ºC, 4h, + benzoyl peroxide
LC-PLA/MWCNT, HC-
PLA/MWCNT and
MWCNT-g-MA: 0.25, 0.5, 0.75, 1, 2, 4
LC-PLA/MWCNT: ρ□ = 2 x 10¹³, 5 x 10³,
and 5 x 10² Ω/sq (0.5, 2, 4 wt.%)
HC-PLA/MWCNT: ρ□ = 1 x 10¹⁴, 9 x 10¹⁰,
and 8 x 10¹⁰ Ω/sq (0.5, 2, 4 wt.%)
LC-PLA/MWCNT-g-MA: ρ□ = 3 x 10², 2 x
102, and 7 x 101 Ω/sq (0.5, 2, 4 wt.%)
[154]
Twin-screw extrusion (180 ºC, 150
rpm, 5 min), compression molding at
d = 6-13 nm, l = 2.5-20 µm,
specific surface area = 220 MWCNT: 1.5, 3, 5
σ = 1 x 10⁻⁹, 1 x 10⁻², and 1 S m-1 (1.5, 3, 5
wt.%) [156]

Chapter 5 PLA/carbon-based nanomaterials composites – literature review
Artur M. Pinto – Jan 2017 125
180 ºC m2g-1
produced by CVD
Twin-screw extruder (180-220 ºC,
500 rpm)
Piston spinning (20, 50, 100 m min-1) to produce micro-fibres (220 ºC, 3
min)
d = 9.5 nm
l = 1.5 µm 90 % purity
MWCNT: 0.5, 1, 2, 3, 5
Extruded composites: σ = 4, 14, and 50 S
m-1 (2, 3, 5 wt.%)
Fibres (3 wt.%): σ = 50, 40, and 1 S m-1 (spinning speeds of 20, 50, and 100 m min-
1)
[170]
Method Procedure CBNs characteristics CBNs Content (wt.%)
Electrical Properties
ρ: electrical resistivity
σ: electrical conductivity
Rs: surface resistance R: surface resistivity
References
Solution mixing
Sonication in DMF, coagulation
with methanol, drying, compression
moulding (185 ºC)
TRG (commercial product, t =
few layer, d = hundreds of nm)
TRG/PLA/Py-PLA: Py-PLA-OH
(1-Pyrenemethanol + l-lactide,
Sn(oct)2) + TRG (10:1) –
sonication + PLA – coagulation
and drying
TRG and TRG/Py-
PLA-OH: 0.25, 1
TRG: = 1x10-16 and 1x10⁻⁶ S m-1 (0.25
and 1 wt.%)
TRG/Py-PLA-OH: = 1x10-16 and 1x10⁻⁷
S m-1 (0.25 and 1 wt.%)
[145]
Sonication in DMF, coagulation
with methanol, drying, and
compression molding (210 ºC)
GO: from graphite flakes
(modified Staudenmeier method) rGO-p: GO +
Polyvinylpyrrolidone (1:5),
sonication at 60 ºC
rGO-g: reduced by stirring with
glucose in ammonia solution at 95
ºC, 60 min
Dimension not given.
GO
rGO-p
rGO-g
(0.5-2.5 vol.%)
GO: = ↑ 6.5 x 10 -13 S m-1
rGO-p: = ↑ 4.7 x 10 -8 S m-1
rGO-g: = 2.2 S m-1
(for 1.25 vol.% for all)
Increases with filler amount
[146]
Melt blending
Twin-screw mixer (175 ºC, 60 rpm, 8 min), compression molding at 180
ºC
GO prepared according to MHM
and chemically reduced to rGO. Thickness 0.4-0.6 nm and lateral
dimension 0.1-0.5 mm.
rGO: 0.02, 0.04, 0.06, 0.2, 0.5, 1, 2
σ = 1 x 10-13 and 1 x 10⁻⁹ S m-1 (0.2 and 2 wt.%)
Increases with filler amount
[159]
Internal mixer (180 ºC, 80 rpm, 10
min)
GO (MHM) + SDS, ultrasounds,
stirring 12h, 25 ºC
Methylmethacrylate (MMA),
stirring 12h + ammonium
persulfate (APS) 12h, 80 ºC +
reduction with dimethyl
PFG: 1, 2, 3, 4, 5 = 2.6 x 10⁻² and 1 x 10-12 Sm-1 (1 and 5
wt.%)
Increases with filler amount
[155]

Chapter 5 PLA/carbon-based nanomaterials composites – literature review
126 Artur M. Pinto – Jan 2017
hydrazine, 100 ºC, 2h (PFG -
polymer-functionalized graphene
nanoparticles)
t = 2.4 nm
In-situ
polymerization
Ring-opening melt polymerization
of lactide in presence of trGO
GO prepared according to MHM
and thermally reduced to trGO.
Dimensions not given.
TrGO: 0.01, 0.1, 0.5, 1,
1.5, 2
= 5 x 10⁻⁶ and 1.6 x 10⁻² S m-1. (1.5 and 2
wt.%)
Increases with filler amount
[166]

PLA/carbon-based nanomaterials composites – literature review
Artur M. Pinto – Jan 2017 127
5.2.4.3 Thermal properties
Several works report changes on thermal properties of PLA by incorporation of CBNs. CNTs
incorporations range from 0.01 to 15 wt.%, while for GBMs lower amounts are needed 0.01 - 2
wt.% (Table 5.3). The most frequently used techniques to evaluate thermal properties in polymer
composites are thermogravimetric analysis (TGA), differential scanning calorimetry (DSC), and
dynamic mechanical analysis (DMA). TGA allows determination of thermal degradation
temperatures, and DSC and DMA phase transition temperatures (Tg – glass transition temperature,
Tm – melting temperature, and Tc – cold crystallization temperature).
When using solution mixing, the highest variation in terms of Tg was an increase of 10 °C,
obtained using 1 wt.% MWCNT purified by treatment with strong acids. Comparing with non-
purified filler at the same loading, the increase was 5 °C higher. This is explained by purified
MWCNT having stronger interfacial interactions with PLA matrix, imposing increased restriction
to the mobility of macromolecular chains, and therefore rising Tg. Also, Td (decomposition
temperature) presented an increase of 10 °C for purified materials. [84] For Tm, the higher increase
was of 16 °C for 0.3 and 1 wt.% MWCNT-PCL (functionalized with poly(caprolactone))
incorporated in PLA aligned fibers by sonication in dichloromethane and electrospinning. Also,
Tc decreased more than 10 °C, due to MWCNT inducing heterogeneous crystallization. [137]
However, the higher decrease in Tc (< 20 °C), was obtained by Moon et al. [129], with the
incorporation of 3 - 10 wt.% MWCNT, with a length of about 2000 µm. In literature, the
degradation temperatures of the polymeric materials determined by TGA are presented in
different terms. For example, as Tdi (beginning of thermal degradation), Td5 (decomposition
temperature for 5 wt.% loss), and Td50 (decomposition temperature for 50% weight loss). For Tdi,
the highest increase was of 20 °C, obtained incorporating 2.5 wt.% MWCNT-COOH
(carboxylated with strong acids) by sonication in PLA dispersed in dicloromethane and THF,
followed by vacuum drying and compression moulding. [138] Considering Td50, the best result was
an increase of 1 - 3 °C, in a work above described. [137]
GBMs incorporation also induces changes on thermal properties of PLA. For Tg, an increase of 7
°C was obtained sonicating 0.4 wt.% GNP in PLA films prepared by solvent mixing. [126] The
highest increases in Tm have been of 5 °C, for samples obtained by compression moulding of PLA
with 0.5 wt.% GO grafted with PLA, produced by vacuum drying a dispersion in chloroform. [141]
Significant decrease in Tc, of 20 °C, was observed for PLA with 2 wt.% GO, obtained by solvent
mixing. [144] Thermal stability of PLA has been shown to improve with addition of GBMs. 2
wt.% GONSs (graphene oxide nanosheets) increased Tdi by 16 ºC in samples produced by solvent
mixing. [147] Also, Td5 was increased by 11 °C sonication of 0.2 wt.% GNSs (graphene
nanosheets) in PLA dispersed in DMF, which was dried under vacuum. The authors explain these

Chapter 5
128 Artur M. Pinto – Jan 2017
increases by GNS forming a tortuous path, which delays the diffusion of oxygen and the escape of
volatile degradation products. and also char formation. [143] Finally, Td max (T of maximum
degradation rate) increased 33 °C PLA filled with TRG, produced by solution mixing. [145]
Chemical modifications of MWCNT were reported to increase thermal properties of the
composites. For example, directly comparing with PLA/MWCNT(non-modified), the
incorporation of 1 wt.% MWCNT grafted with PLA in the same PLA matrix, resulted in increases
of about 3 °C in Tg and decreases of 9 °C in Tc. [132] Treatment with strong acids followed by
silanization of SWCNT, [136] which were incorporated in PLA at loading ranging from 0.1 and 3
wt.% resulted in increases of about 5 °C in Tg.
Concerning composites produced by melt-blending, the highest increases in Tg were of 5 - 6 ºC,
reported for PLA micro-fibers with 3 wt.% MWCNT to PLA. [170] Also, Tc was observed to
decrease at most 12 ºC with incorporation of 0.5 and 2 wt.% MWCNT. [161] Chieng et al. [158],
studied the thermal properties of PLA/PEG (9:1) blends with addition of 0.1 – 1 wt.% GNP,
which resulted in e variations on Tg, Tm, and Tc. However, Tdi, Tmax, and T50, increased by 56, 53,
and 44 ºC, respectively, for 0.5 wt.% loadings.
In-situ polymerization of l-lactide in presence of TRG in amounts from 0.01 to 2 wt.% resulted in
considerable increases on Tg, Tm, and Tdmax. For example, at 2 wt.% loading, increases of 5, 14,
and 18 ºC were obtained, respectively. [166] In a different work reporting in-situ polymerization of
l-lactide, covalent functionalization of GO with both 1,4-butanediol, and polyhedral
silsesquioxane resulted in increases in Tg (18, 20 °C), Tc (15, 8 °C), Tm (7, 5 °C), and Td5 (23, 11
°C) comparing with PLA/GO composites at 1 wt.% loadings. [167]
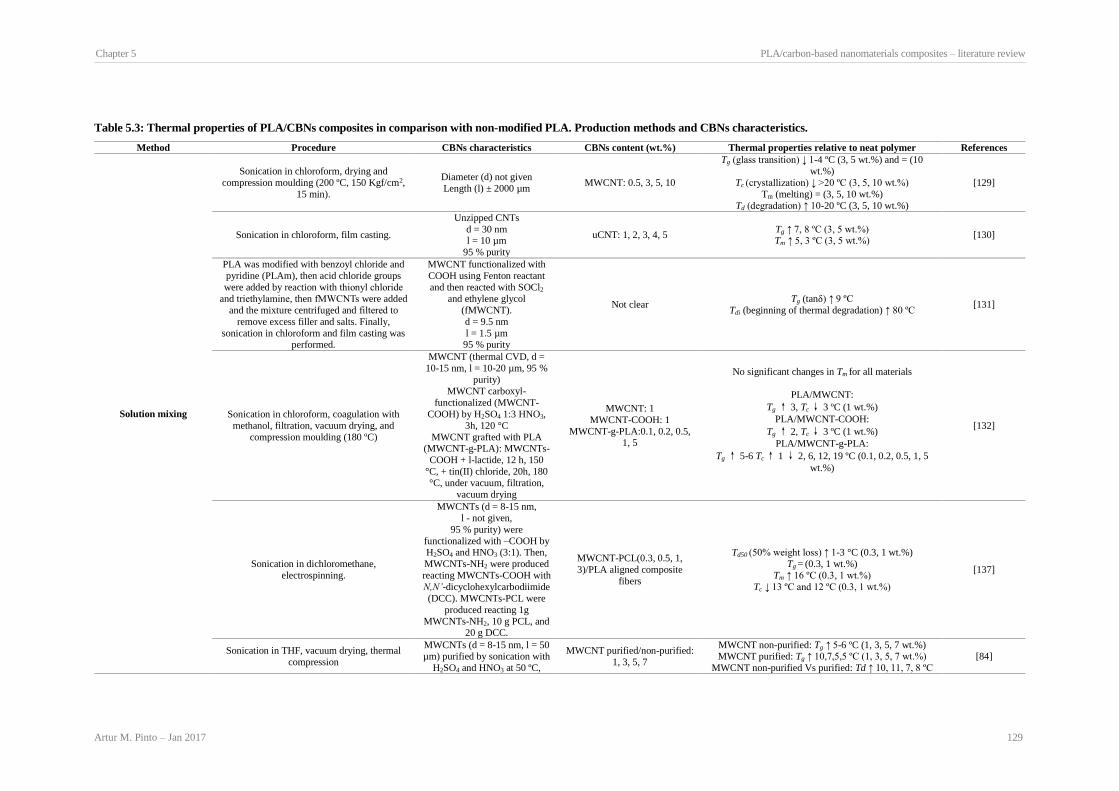
Chapter 5 PLA/carbon-based nanomaterials composites – literature review
Artur M. Pinto – Jan 2017 129
Table 5.3: Thermal properties of PLA/CBNs composites in comparison with non-modified PLA. Production methods and CBNs characteristics.
Method Procedure CBNs characteristics CBNs content (wt.%) Thermal properties relative to neat polymer References
Solution mixing
Sonication in chloroform, drying and
compression moulding (200 ºC, 150 Kgf/cm2,
15 min).
Diameter (d) not given
Length (l) ± 2000 µm MWCNT: 0.5, 3, 5, 10
Tg (glass transition) ↓ 1-4 ºC (3, 5 wt.%) and = (10
wt.%)
Tc (crystallization) ↓ >20 ºC (3, 5, 10 wt.%)
Tm (melting) = (3, 5, 10 wt.%)
Td (degradation) ↑ 10-20 ºC (3, 5, 10 wt.%)
[129]
Sonication in chloroform, film casting.
Unzipped CNTs
d = 30 nm l = 10 µm
95 % purity
uCNT: 1, 2, 3, 4, 5 Tg ↑ 7, 8 ºC (3, 5 wt.%) Tm ↑ 5, 3 ºC (3, 5 wt.%)
[130]
PLA was modified with benzoyl chloride and
pyridine (PLAm), then acid chloride groups
were added by reaction with thionyl chloride
and triethylamine, then fMWCNTs were added
and the mixture centrifuged and filtered to
remove excess filler and salts. Finally,
sonication in chloroform and film casting was performed.
MWCNT functionalized with
COOH using Fenton reactant
and then reacted with SOCl2
and ethylene glycol
(fMWCNT).
d = 9.5 nm
l = 1.5 µm 95 % purity
Not clear Tg (tanδ) ↑ 9 ºC
Tdi (beginning of thermal degradation) ↑ 80 ºC [131]
Sonication in chloroform, coagulation with
methanol, filtration, vacuum drying, and
compression moulding (180 ºC)
MWCNT (thermal CVD, d =
10-15 nm, l = 10-20 µm, 95 %
purity)
MWCNT carboxyl-
functionalized (MWCNT-
COOH) by H2SO4 1:3 HNO3,
3h, 120 °C
MWCNT grafted with PLA (MWCNT-g-PLA): MWCNTs-
COOH + l-lactide, 12 h, 150
°C, + tin(II) chloride, 20h, 180
°C, under vacuum, filtration,
vacuum drying
MWCNT: 1
MWCNT-COOH: 1
MWCNT-g-PLA:0.1, 0.2, 0.5, 1, 5
No significant changes in Tm for all materials
PLA/MWCNT:
Tg ↑ 3, Tc ↓ 3 ºC (1 wt.%)
PLA/MWCNT-COOH:
Tg ↑ 2, Tc ↓ 3 ºC (1 wt.%)
PLA/MWCNT-g-PLA:
Tg ↑ 5-6 Tc ↑ 1 ↓ 2, 6, 12, 19 ºC (0.1, 0.2, 0.5, 1, 5
wt.%)
[132]
Sonication in dichloromethane,
electrospinning.
MWCNTs (d = 8-15 nm,
l - not given,
95 % purity) were
functionalized with –COOH by H2SO4 and HNO3 (3:1). Then,
MWCNTs-NH2 were produced
reacting MWCNTs-COOH with
N,N’-dicyclohexylcarbodiimide
(DCC). MWCNTs-PCL were
produced reacting 1g
MWCNTs-NH2, 10 g PCL, and 20 g DCC.
MWCNT-PCL(0.3, 0.5, 1,
3)/PLA aligned composite
fibers
Td50 (50% weight loss) ↑ 1-3 °C (0.3, 1 wt.%)
Tg = (0.3, 1 wt.%)
Tm ↑ 16 ºC (0.3, 1 wt.%)
Tc ↓ 13 ºC and 12 ºC (0.3, 1 wt.%)
[137]
Sonication in THF, vacuum drying, thermal
compression
MWCNTs (d = 8-15 nm, l = 50 µm) purified by sonication with
H2SO4 and HNO3 at 50 ºC,
MWCNT purified/non-purified:
1, 3, 5, 7
MWCNT non-purified: Tg ↑ 5-6 ºC (1, 3, 5, 7 wt.%) MWCNT purified: Tg ↑ 10,7,5,5 ºC (1, 3, 5, 7 wt.%)
MWCNT non-purified Vs purified: Td ↑ 10, 11, 7, 8 ºC
[84]

Chapter 5 PLA/carbon-based nanomaterials composites – literature review
130 Artur M. Pinto – Jan 2017
filtration, and washing (1, 3, 5, 7 wt.%)
Solution mixing in THF, vacuum drying,
thermal compression
SWCNT (d < 2 nm, l = 5-15
µm, 95 % purity) treated with
3:1 H2SO4/HNO3 (A-SWCNT), and functionalized (1:2 v/v)
with 3-isocyanatoporpyl
triethoxysilane (IPTES) - A-
SWCNT-Si
SWCNT, A-SWCNT, and A-
SWCNT-Si: 0.1, 0.3, 0.5, 1, 3
Td5 (5 wt.% loss) ↓ for SWCNT (poor interfacial
interaction), = for A-SWCNT, and A-SWCNT-Si Tg: (higher that pure PLA) SWCNT < A-SWCNT < A-
SWCNT-Si (considering all loadings, increases are
below 5 °C)
[136]
Sonication in dichloromethane and THF,
vacuum drying, and compression molding
(190 ºC)
MWCNT (d = 9-20 nm, l = 5
µm) functionalized with 3:1
H2SO4/HNO3 (MWCNT-
COOH)
MWCNT-COOH: 0.5, 1, 2.5
MWCNT-COOH:
Tdi ↑ 10-20 ºC (0.5-2.5 wt.%)
Tg ↑ 0, 1, 2 ºC (0.5, 1, 2.5 wt.%)
Tc ↑ 1, 2, 4 ºC 0.5, 1, 2.5 wt.%)
Tm ↑ 3, 4, 5 ºC 0.5, 1, 2.5 wt.%)
[138]
Melt blending
Internal mixer (180 ºC, 50 rpm, 5 min) with
and without transesterification with Ti(OBu)4,
compression molding (180 ºC)
MWCNT (l 1-10 µm)
functionalized with HNO3 (120
ºC, 40 min) - MWCNT-COOH, and modified with DCC and
stearyl alcohol (MWCNT-
C18OH)
PC: MWCNT/PLA PC-18: MWCNT-C18OH/PLA
PC-18T: MWCNT-
C18OH/PLA transesterified
0.5, 1.5, 3
PC, PC-18 - No change in Tm PC-18T – 2 melting peaks, 1 bellow Tm for pristine PLA
(low Mw PLA from transesterification), other at the same
Tm
[151]
Sonication in THF, vacuum drying +
Microextruder (180 ºC, 50 rpm, 5 min)
MWCNTs (d = 9.5 nm, l = 1.5
µm) produced by catalytic
carbon vapor deposition
(CCVD)
MWCNT: 0.1, 1 Tg ↑ 1 ºC (0.1, 1 wt.%) [152]
Twin-screw extruder (180, 215 and 250 ºC;
100, 200 and 500 rpm; 5 min)
1st – masterbatch production
2nd – dilution of masterbatches and composites production
d = 9.5 nm
l = 1.5 µm
90 % purity
MWCNT: 0.5, 0.75, 1, 2, 7.5,
15 Similar Tg (7.5, 15 wt.%) [153]
Twin-screw extruder (210 ºC, 400 rpm),
compression molding (210 ºC)
d = 5-20 nm
l = 10 µm
Specific surface area = 100-700
m2g-1
CCVD
MWCNT: 0.5, 1, 2, 3, 5
Tg ↓ 1, 2 ºC (0.5, 1-5 wt.%)
Tc ↓ 12, 10, 12, 7, 6 ºC (0.5, 1, 2, 3, 5 wt.%)
Tm ↓ 1, 2 ºC (0.5-3, 5 wt.%)
[161]
Twin-screw extruder (180-220 ºC, 500 rpm)
Piston spinning to produce micro-fibres (220
ºC, 3 min)
d = 9.5 nm
l = 1.5 µm
90 % purity
MWCNT: 0.5, 1, 2, 3, 5 Tg: pellet = (3 wt.%)
Fibres ↑ 5-6 ºC (3 wt.%) [170]
Method Procedure CBNs characteristics CBNs content (wt.%) Thermal properties relative to neat polymer References
Solution mixing
Sonication in chloroform, casting and doctor
blading GO was pre-dispersed in acetone while GNP
was directly dispersed in chloroform
GNP grade M (commercial product)
t = 6-8 nm, d ≈ 5 µm. GO (MHM)
d ≈ 100 nm
GO and GNP: 0.2, 0.4, 0.6 GO: Tg ↑ 3, 4, 3 ºC (0.2, 0.4, 0.6 wt.%)
GNP: Tg ↑ 6, 7, 5 ºC (0.2, 0.4, 0.6 wt.%)
Similar Tm for both GO and GNP
[126]
Sonication in chloroform, filtration, vacuum
drying, compression moulding (170 ºC, 10
min)
GO (from natural graphite, MHM +
lyophilization) d ≈ 300 nm
GO-g-PLLA (GO + l-lactide
(Sn(oct)2), filtration, vacuum drying)
GO and GO-g-PLLA: 0.5
PLA/GO: Tg ↑ 6 ºC
Tm ↑ 3 ºC
PLA/GO-g-PLLA: Tg ↑ 6 ºC
Tm ↑ 5 ºC
[141]

Chapter 5 PLA/carbon-based nanomaterials composites – literature review
Artur M. Pinto – Jan 2017 131
Stirring and sonication in DMF, coagulation with methanol, filtration, and vacuum drying
GO (MHM) from expandable
graphite, chemically reduced with
hydrazine, and lyophilized (GNSs – solvent free graphene nanosheets)
t < 1 nm, d < 50 nm.
GNSs: 0.2 Td5 ↑ 11 ºC. [143]
Sonication in DMF, film casting, vacuum
drying
GO prepared according to
Staudenmaier method (H2SO4 +
HNO3 + KClO3)
(dimensions not given)
GO: 0.5, 1, 2
(0.5, 1, 2 wt.%)
Tc ↓ 9, 15, 20 ºC
Tg similar
[144]
Sonication in DMF, coagulation with
methanol, drying, compression moulding (185 ºC)
TRG (commercial product, t = few
layer, d = hundreds of nm)
TRG/PLA/Py-PLA: Py-PLA-OH (1-Pyrenemethanol + l-lactide, Sn(oct)2)
+ TRG (10:1) – sonication + PLA –
coagulation and drying
TRG and TRG/Py-PLA-OH: 0.25, 1
TRG/PLA:
Td5 ↓ 32 ºC
Td max (max. degradation) ↑ 33 ºC
TRG/PLA/Py-PLA: Td5 ↓ 2 ºC
Td max ↑ 25 ºC
(loadings not clear)
[145]
Sonication in DMF, coagulation with water,
vacuum drying, compression moulding (200
ºC, 3 min)
Graphene oxide nanosheets - GONSs
(MHM) from expandable graphite
(t = few layer, d = 5-20 µm)
GONSs: 0.25, 0.5, 1, 2
(0.25, 0.5, 1, 2 wt.%)
Tm1 ↓ 1, 4, 0, 1 ºC
Tm2 ↓ 0, 1, 1, 1 ºC
Tc ↓ 3, 6, 2, 4 ºC
Tdi ↑ 2, 6, 11, 16 ºC
[147]
Sonication in DMF, film casting, vacuum
drying
GNS (commercial product)
t = 5-25 nm, d = 0.5-20 µm, specific surface area = 50 m2g-1
GNS: 1 Similar Tg and Tm1 and 2
Tc ↑ 3ºC [148]
Melt blending
Internal mixer (160 ºC, 25 rpm, 10 min),
compression moulding (160 ºC, 10 min)
(Polymer was PLA/PEG 9:1 blend)
GNP grade M15 (commercial
product)
t = 6-8 nm, d ≈ 15 µm
GNP-M15: 0.1, 0.3, 0.5, 0.7, 1
(relative to pristine PLA/PEG blend)
(0.1, 0.3, 0.5, 1 wt.%)
Tg ↓0, 0, 1, 1
Tm ↑ 2, 4 ↓ 1, 1
Tc ↑ 1, 2, 2, 1
Tdi , Td max, T50 ↑ 56, 53, 44 ºC (0.5 wt.%)
[158]
In-situ polymeriztion
Melt ring-opening polymerization of l-
lactide in presence of TRG (Sn(oct)2, 170 °C, 4h), filtration, vacuum drying
Natural graphite (MHM +
lyophilization) - GO
GO thermal reduction (1000 °C, 1 min) to TRG
t = few layers
TRG: 0.01, 0.1, 0.5, 1, 1.5, 2
(0.01, 0.1, 0.5, 1, 1.5, 2 wt.%)
Tg = ↑ 9, 6, 6, 7, 8, 5 ºC
Tm = ↑ 11, 12, 13, 14, 14, 14 ºC Td max = ↑ 4, 13, 10, 11, 16, 18 ºC
[166]
Sonication of l-lactide + filler in toluene,
addition of Tin(II)-2-ethylhexanoate under
N2, stirring at 110 °C, 3 days
Expanded graphite (MHM) to GO
GO-fuctionalized: GO + TDI +1,4-
butanediol, 80 °C, 24h
GO-g-POSS: GO + POSS –
polyhedral oligomeric silsesquioxane
+ DMAP – 4-
(dimethylaminopyridine) + EDC – N-(3-dimethylamino-propyl-N’-
ethylcarbodiimide), 2 days, room
temperature, N2
(dimensions not given)
GO-fuctionalized, GO-g-
POSS, GO+POSS (physical
mixture): 1
PLA/GO-functionalized:
Td5 ↑ 8, Tg ↓ 8, Tc ↑ 14, Tm ↓ 2 ºC
PLA/ GO-g-POSS:
Td5 ↑ 31, Tg ↑ 10, Tc ↑ 29, Tm ↑ 5 ºC
PLA/ GO+POSS: Td5 ↑ 19, Tg ↑ 12, Tc ↑ 22, Tm ↑ 3 ºC
[167]

Chapter 5
132 Artur M. Pinto – Jan 2017
5.2.4.4 Biological properties
Since CBNs generally present toxicity when isolated, i.e. when not incorporated in a polymer
matrix, [37, 171] biocompatibility of the composite must be tested when considering uses as
biomaterials. Table 5.4 shows that PLA/CBNs composites (films and nanofibers) do not tend to
decrease in vitro metabolic activity of several cell types, or cause increases up to 40% until 72 h
incubations. Also, the selection of production method used (spin coating, electrospinning, and
solvent mixing followed by casting or doctor blading), does not seem to influence cell
proliferation. For long term incubations, McCullen et al. [172] showed that scaffolds of PLA with 1
wt.% MWNTs do not to influence metabolic activity of adipose-derived human mesenchymal
stem cells (hMSCs) at 7 days. At 14 days, cells present increased metabolic activity and
longitudinal alignment induced by the scaffolds. Sherrell et al. [173] reported that PLGA (1:1) with
a surface layer of graphene applied by CVD to increase PC-12 cells average length of neurites by
2.5 fold when electrical stimulated. Also, hemocompatibility improvements were reported with
both incorporation of 0.4 wt.% GNP by solvent mixing followed by doctor blading [140] and 4
wt.% MWCNTs by extrusion followed by injection moulding [174] in PLA. In the last case,
MWCNTs alignment is associated with decreased platelet adhesion and activation. Thus,
alignment seems to be generally benefic for biocompatibility. The effectiveness of electrical
stimulation together with fiber alignment was confirmed by Shao et al. [169], which cultured
osteoblasts at the surface of PLA/MWCNTs-ox (3 wt.%) produced by solution mixing followed
by electrospinning. They observed maximum improvements, comparing with control PLA fibers
(d ≈ 400 nm), in cell elongation (190 %) and metabolic activity (20 %) for random nanofibers (d
≈ 250 nm) under DC 100 μA. For aligned fibers the previous values increased by 355 and 40 %,
respectively. Finally, An et al. [175] found PLA/PU 3 wt.%/GO 5 wt.% films and nanofibers to
completely suppress Escherichia coli and Staphylococcus aureus growth after 24h, not affecting
MC3T3-E1 cells metabolic activity.
In an in vivo study, Kanczler et al. [176] observed that PLA-CB 0.1 wt.% scaffolds seeded or not
with fetal femur-derived cells, when implanted in a murine critical-size femur segmental defect
model aided the regeneration of bone defect.
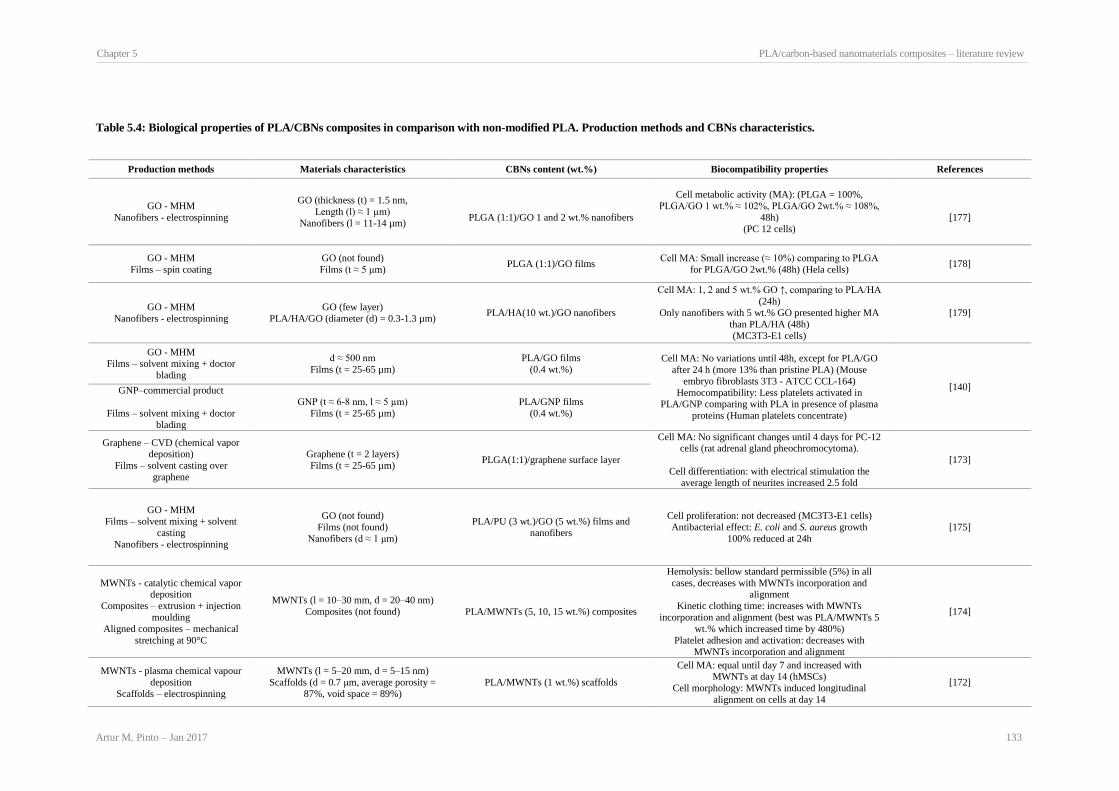
Chapter 5 PLA/carbon-based nanomaterials composites – literature review
Artur M. Pinto – Jan 2017 133
Table 5.4: Biological properties of PLA/CBNs composites in comparison with non-modified PLA. Production methods and CBNs characteristics.
Production methods Materials characteristics CBNs content (wt.%) Biocompatibility properties References
GO - MHM
Nanofibers - electrospinning
GO (thickness (t) = 1.5 nm,
Length (l) ≈ 1 µm)
Nanofibers (l = 11-14 µm)
PLGA (1:1)/GO 1 and 2 wt.% nanofibers
Cell metabolic activity (MA): (PLGA = 100%,
PLGA/GO 1 wt.% ≈ 102%, PLGA/GO 2wt.% ≈ 108%,
48h)
(PC 12 cells)
[177]
GO - MHM
Films – spin coating
GO (not found)
Films (t ≈ 5 μm) PLGA (1:1)/GO films
Cell MA: Small increase (≈ 10%) comparing to PLGA
for PLGA/GO 2wt.% (48h) (Hela cells) [178]
GO - MHM
Nanofibers - electrospinning
GO (few layer)
PLA/HA/GO (diameter (d) = 0.3-1.3 µm) PLA/HA(10 wt.)/GO nanofibers
Cell MA: 1, 2 and 5 wt.% GO ↑, comparing to PLA/HA
(24h)
Only nanofibers with 5 wt.% GO presented higher MA
than PLA/HA (48h)
(MC3T3-E1 cells)
[179]
GO - MHM
Films – solvent mixing + doctor
blading
d ≈ 500 nm
Films (t = 25-65 µm)
PLA/GO films
(0.4 wt.%) Cell MA: No variations until 48h, except for PLA/GO
after 24 h (more 13% than pristine PLA) (Mouse
embryo fibroblasts 3T3 - ATCC CCL-164)
Hemocompatibility: Less platelets activated in PLA/GNP comparing with PLA in presence of plasma
proteins (Human platelets concentrate)
[140] GNP–commercial product
Films – solvent mixing + doctor
blading
GNP (t ≈ 6-8 nm, l ≈ 5 µm)
Films (t = 25-65 µm)
PLA/GNP films
(0.4 wt.%)
Graphene – CVD (chemical vapor deposition)
Films – solvent casting over
graphene
Graphene (t = 2 layers)
Films (t = 25-65 µm) PLGA(1:1)/graphene surface layer
Cell MA: No significant changes until 4 days for PC-12 cells (rat adrenal gland pheochromocytoma).
Cell differentiation: with electrical stimulation the
average length of neurites increased 2.5 fold
[173]
GO - MHM
Films – solvent mixing + solvent
casting
Nanofibers - electrospinning
GO (not found)
Films (not found)
Nanofibers (d ≈ 1 μm)
PLA/PU (3 wt.)/GO (5 wt.%) films and
nanofibers
Cell proliferation: not decreased (MC3T3-E1 cells)
Antibacterial effect: E. coli and S. aureus growth
100% reduced at 24h
[175]
MWNTs - catalytic chemical vapor deposition
Composites – extrusion + injection
moulding
Aligned composites – mechanical
stretching at 90°C
MWNTs (l = 10–30 mm, d = 20–40 nm)
Composites (not found)
PLA/MWNTs (5, 10, 15 wt.%) composites
Hemolysis: bellow standard permissible (5%) in all
cases, decreases with MWNTs incorporation and alignment
Kinetic clothing time: increases with MWNTs
incorporation and alignment (best was PLA/MWNTs 5
wt.% which increased time by 480%)
Platelet adhesion and activation: decreases with
MWNTs incorporation and alignment
[174]
MWNTs - plasma chemical vapour
deposition
Scaffolds – electrospinning
MWNTs (l = 5–20 mm, d = 5–15 nm)
Scaffolds (d = 0.7 μm, average porosity =
87%, void space = 89%)
PLA/MWNTs (1 wt.%) scaffolds
Cell MA: equal until day 7 and increased with MWNTs at day 14 (hMSCs)
Cell morphology: MWNTs induced longitudinal
alignment on cells at day 14
[172]
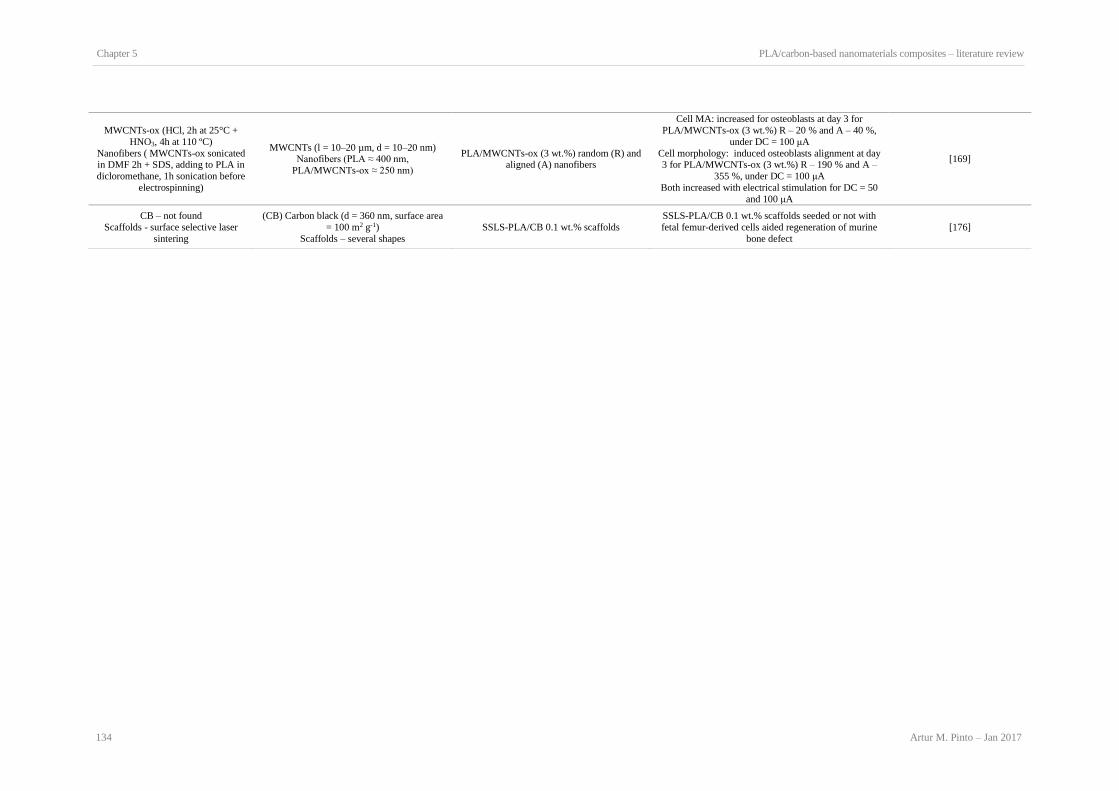
Chapter 5 PLA/carbon-based nanomaterials composites – literature review
134 Artur M. Pinto – Jan 2017
MWCNTs-ox (HCl, 2h at 25°C +
HNO3, 4h at 110 ºC)
Nanofibers ( MWCNTs-ox sonicated in DMF 2h + SDS, adding to PLA in
dicloromethane, 1h sonication before
electrospinning)
MWCNTs (l = 10–20 µm, d = 10–20 nm) Nanofibers (PLA ≈ 400 nm,
PLA/MWCNTs-ox ≈ 250 nm)
PLA/MWCNTs-ox (3 wt.%) random (R) and aligned (A) nanofibers
Cell MA: increased for osteoblasts at day 3 for
PLA/MWCNTs-ox (3 wt.%) R – 20 % and A – 40 %,
under DC = 100 μA
Cell morphology: induced osteoblasts alignment at day 3 for PLA/MWCNTs-ox (3 wt.%) R – 190 % and A –
355 %, under DC = 100 μA
Both increased with electrical stimulation for DC = 50
and 100 μA
[169]
CB – not found
Scaffolds - surface selective laser
sintering
(CB) Carbon black (d = 360 nm, surface area
= 100 m2 g-1)
Scaffolds – several shapes
SSLS-PLA/CB 0.1 wt.% scaffolds
SSLS-PLA/CB 0.1 wt.% scaffolds seeded or not with
fetal femur-derived cells aided regeneration of murine
bone defect
[176]

PLA/carbon-based nanomaterials composites – literature review
Artur M. Pinto – Jan 2017 135
5.3 Conclusions
Both CNTs and GBMs nanofillers are effective at improving PLA thermo-mechanical and
electrical properties, whether produced by solution mixing or melt blending. However, lower
amounts of GBMs (0.1-1 wt.%) are usually needed, comparing with CNTs (0.25-5 wt.%). Melt-
blending is less frequently reported than solution mixing for production of PLA/CBNs
composites, probably due to the lower availability of the necessary equipment. Moreover, results
show that melt blending tends to be not as effective at improving PLA properties. In-situ
polymerization is the least reported technique, with further research being needed to demonstrate
possible advantages over the previous approaches.
Several chemical modifications can be tried to improve compatibility with a polymer matrix.
Functionalization with carboxyls is the most common and effective procedure to improve CNTs
dispersibility and compatibility with PLA. Some authors refer that purification with strong acids
introduces polar groups in the carbon surface, which introduces positive interaction with PLA.
Besides simple chemical oxidation of CBNs, other chemical modifications include reaction with
isocyanates, polymers (ethylene glycol, poly(caprolactone), poly(methyl methacrylate),
poly(vinyl pyrrolidone), and PLA)), polyols, silanes or amines.
No relation can be determined between CBNs morphological properties (size, length, and
diameter) and the composites performance.
The alignment of PLA/CBNs fibres, was reported to improve their conductivity. Also, in most
works evaluated, electrical properties improved with the increase of the amount of CBNs
incorporated.
Production methods reported for PLA/CBNs composites for biomedical applications are spin
coating, electrospinning (most used), and solvent mixing followed by casting or doctor blading.
The process selection does not influence cell metabolic activity. Different studies reveal that
PLA/GBM composites (films and nanofibers) do not decrease the metabolic activity of cell lines,
and in some cases induce increases below 40% until 72 h incubations, comparing with non-filled
PLA. Improvements in hemocompatibility were achieved with incorporation of both CNTs and
GBMs. Also, both fiber alignment and electrical stimulation, improved cell metabolic activity and
elongation. Incorporation of GO has lead to suppression of Escherichia coli and Staphylococcus
aureus growth, without compromising the composite biocompatibility. However, there is still no
information on antimicrobial activity of these composites on other types of microorganisms or
with other types of GBMs.
Chapter 5
136 Artur M. Pinto – Jan 2017
Interesting fields for future work would be to further explore in-situ polymerization, since there
are few studies focused on that approach. Also, it is important to better understand how the fillers
physico-chemical properties, and their alignment inside a polymer matrix, affect the composites
properties. Emerging technologies, like 3D printing, will surely contribute for the conception of
materials with the desired properties for the broad potential applications of PLA/CBNs
composites.
PLA/carbon-based nanomaterials composites – literature review
Artur M. Pinto – Jan 2017 137
5.4 References
1. K. Oksman, M. Skrifvars, J.F. Selin, Natural fibres as reinforcement in polylactic acid
(PLA) composites, Compos Sci Technol 63 (2003) 1317-1324.
2. R.A. Vaia, H.D. Wagner, Framework for nanocomposites, Mater Today 7 (2004) 32-37.
3. A.J.R. Lasprilla, G.A.R. Martinez, B.H. Lunelli, A.L. Jardini, R. Maciel, Poly-lactic
acid synthesis for application in biomedical devices - A review, Biotechnol Adv 30
(2012) 321-328.
4. J.H. Chang, Y.U. An, G.S. Sur, Poly(lactic acid) nanocomposites with various
organoclays. I. Thermomechanical properties, morphology, and gas permeability, J
Polym Sci Pol Phys 41 (2003) 94-103.
5. V. Mittal, Polymer layered silicate nanocomposites: A review, Materials 2 (2009) 992-
1057.
6. J.M. Raquez, Y. Habibi, M. Murariu, P. Dubois, Polylactide (PLA)-based
nanocomposites, Prog Polym Sci 38 (2013) 1504-1542.
7. E. Bafekrpour, M. Salehi, E. Sonbolestan, B. Fox, Effects of micro-structural
parameters on mechanical properties of carbon nanotube polymer nanocomposites, Sci
Iran 21 (2014) 403-413.
8. J.N. Coleman, U. Khan, Y.K. Gun'ko, Mechanical reinforcement of polymers using
carbon nanotubes, Adv Mater 18 (2006) 689-706.
9. B. Fiedler, F.H. Gojny, M.H.G. Wichmann, M.C.M. Nolte, K. Schulte, Fundamental
aspects of nano-reinforced composites, Compos Sci Technol 66 (2006) 3115-3125.
10. A.M. Pinto, I.C. Goncalves, F.D. Magalhaes, Graphene-based materials
biocompatibility: A review, Colloid Surface B 111 (2013) 188-202.
11. S.C. Tjong, Structural and mechanical properties of polymer nanocomposites, Mat Sci
Eng R 53 (2006) 73-197.
12. X.L. Xie, Y.W. Mai, X.P. Zhou, Dispersion and alignment of carbon nanotubes in
polymer matrix: A review, Mat Sci Eng R 49 (2005) 89-112.
13. C.C. Ge, Y. Li, J.J. Yin, Y. Liu, L.M. Wang, Y.L. Zhao, C.Y. Chen, The contributions
of metal impurities and tube structure to the toxicity of carbon nanotube materials, Npg
Asia Mater 4 (2012).
14. X. Liu, L. Guo, D. Morris, A.B. Kane, R.H. Hurt, Targeted removal of bioavailable
metal as a detoxification strategy for carbon nanotubes, Carbon 46 (2008) 489-500.
15. Y. Liu, Y.L. Zhao, B.Y. Sun, C.Y. Chen, Understanding the Toxicity of Carbon
Nanotubes, Accounts Chem Res 46 (2013) 702-713.
16. G. Tejral, N.R. Panyala, J. Havel, Carbon nanotubes: toxicological impact on human
health and environment, J Appl Biomed 7 (2009) 1-13.
17. T.K. Das, S. Prusty, Graphene-Based Polymer Composites and Their Applications,
Polym-Plast Technol 52 (2013) 319-331.
18. X. Huang, X.Y. Qi, F. Boey, H. Zhang, Graphene-based composites, Chem Soc Rev 41
(2012) 666-686.
19. N.A. Kotov, Materials science: Carbon sheet solutions, Nature 442 (2006) 254-255.
20. T. Kuilla, S. Bhadra, D.H. Yao, N.H. Kim, S. Bose, J.H. Lee, Recent advances in
graphene based polymer composites, Prog Polym Sci 35 (2010) 1350-1375.
21. B. Gupta, N. Revagade, J. Hilborn, Poly(lactic acid) fiber: An overview, Prog Polym
Sci 32 (2007) 455-482.
22. Y.Z. Hu, W.A. Daoud, K.K.L. Cheuk, C.S.K. Lin, Newly Developed Techniques on
Polycondensation, Ring-Opening Polymerization and Polymer Modification: Focus on
Poly(Lactic Acid), Materials 9 (2016) 133-147.
23. L.T. Lim, R. Auras, M. Rubino, Processing technologies for poly(lactic acid), Prog
Polym Sci 33 (2008) 820-852.
24. K.M. Nampoothiri, N.R. Nair, R.P. John, An overview of the recent developments in
polylactide (PLA) research, Bioresource Technol 101 (2010) 8493-8501.

Chapter 5
138 Artur M. Pinto – Jan 2017
25. R.M. Rasal, A.V. Janorkar, D.E. Hirt, Poly(lactic acid) modifications, Prog Polym Sci
35 (2010) 338-356.
26. X.A. Pang, X.L. Zhuang, Z.H. Tang, X.S. Chen, Polylactic acid (PLA): Research,
development and industrialization, Biotechnol J 5 (2010) 1125-1136.
27. M.J. Allen, V.C. Tung, R.B. Kaner, Honeycomb Carbon: A Review of Graphene, Chem
Rev 110 (2010) 132-145.
28. A.A. Balandin, Thermal properties of graphene and nanostructured carbon materials,
Nat Mater 10 (2011) 569-581.
29. R.H. Baughman, A.A. Zakhidov, W.A. de Heer, Carbon nanotubes - the route toward
applications, Science 297 (2002) 787-792.
30. D.R. Dreyer, S. Park, C.W. Bielawski, R.S. Ruoff, The chemistry of graphene oxide,
Chemical Society Reviews 39 (2010) 228-240.
31. X.H. Lin, J.G. Gai, Synthesis and applications of large-area single-layer graphene, Rsc
Adv 6 (2016) 17818-17844.
32. B.H. Nguyen, V.H. Nguyen, Promising applications of graphene and graphene-based
nanostructures, Adv Nat Sci-Nanosci 7 (2016).
33. V.H. Nguyen, Recent advances in experimental basic research on graphene and
graphene-based nanostructures, Adv Nat Sci-Nanosci 7 (2016).
34. K.S. Novoselov, V.I. Fal'ko, L. Colombo, P.R. Gellert, M.G. Schwab, K. Kim, A
roadmap for graphene, Nature 490 (2012) 192-200.
35. S. Park, R.S. Ruoff, Chemical methods for the production of graphenes, Nat
Nanotechnol 4 (2009) 217-224.
36. C.N.R. Rao, A.K. Sood, K.S. Subrahmanyam, A. Govindaraj, Graphene: The New
Two-Dimensional Nanomaterial, Angew Chem Int Edit 48 (2009) 7752-7777.
37. V. Singh, D. Joung, L. Zhai, S. Das, S.I. Khondaker, S. Seal, Graphene based materials:
Past, present and future, Prog Mater Sci 56 (2011) 1178-1271.
38. D. Tasis, N. Tagmatarchis, A. Bianco, M. Prato, Chemistry of carbon nanotubes, Chem
Rev 106 (2006) 1105-1136.
39. E.T. Thostenson, Z.F. Ren, T.W. Chou, Advances in the science and technology of
carbon nanotubes and their composites: a review, Compos Sci Technol 61 (2001) 1899-
1912.
40. F. Yang, X. Wang, M.H. Li, X.Y. Liu, X.L. Zhao, D.Q. Zhang, Y. Zhang, J. Yang, Y.
Li, Templated Synthesis of Single-Walled Carbon Nanotubes with Specific Structure,
Accounts Chem Res 49 (2016) 606-615.
41. C.S. Yeung, W.Q. Tian, L.V. Liu, Y.A. Wang, Chemistry of Single-Walled Carbon
Nanotubes, J Comput Theor Nanos 6 (2009) 1213-1235.
42. F. Zhang, P.X. Hou, C. Liu, H.M. Cheng, Epitaxial growth of single-wall carbon
nanotubes, Carbon 102 (2016) 181-197.
43. Y.W. Zhu, S. Murali, W.W. Cai, X.S. Li, J.W. Suk, J.R. Potts, R.S. Ruoff, Graphene
and Graphene Oxide: Synthesis, Properties, and Applications, Adv Mater 22 (2010)
3906-3924.
44. D. Garlotta, A literature review of poly(lactic acid), J Polym Environ 9 (2001) 63-84.
45. L.-T.L. Rafael Auras, Susan E. M. Selke, Hideto Tsuji, Poly (lactic) acid: synthesis,
structures, properties, processing, and applications, first ed., John Wiley and Sons,
2010.
46. R.E. Drumright, P.R. Gruber, D.E. Henton, Polylactic acid technology, Advanced
Materials 12 (2000) 1841-1846.
47. M. Jamshidian, E.A. Tehrany, M. Imran, M. Jacquot, S. Desobry, Poly-Lactic Acid:
Production, Applications, Nanocomposites, and Release Studies, Compr Rev Food Sci
F 9 (2010) 552-571.
48. R.L. Shogren, W.M. Doane, D. Garlotta, J.W. Lawton, J.L. Willett, Biodegradation of
starch/polylactic acid/poly(hydroxyester-ether) composite bars in soil, Polym Degrad
Stabil 79 (2003) 405-411.
49. J.B. Zeng, K.A. Li, A.K. Du, Compatibilization strategies in poly(lactic acid)-based
blends, Rsc Adv 5 (2015) 32546-32565.

PLA/carbon-based nanomaterials composites – literature review
Artur M. Pinto – Jan 2017 139
50. T. Semba, K. Kitagawa, U.S. Ishiaku, H. Hamada, The effect of crosslinking on the
mechanical properties of polylactic acid/polycaprolactone blends, J Appl Polym Sci 101
(2006) 1816-1825.
51. H. Wang, X.Z. Sun, P. Seib, Mechanical properties of poly(lactic acid) and wheat starch
blends with methylenediphenyl diisocyanate, J Appl Polym Sci 84 (2002) 1257-1262.
52. H. Balakrishnan, A. Hassan, M.U. Wahit, A.A. Yussuf, S.B.A. Razak, Novel toughened
polylactic acid nanocomposite: Mechanical, thermal and morphological properties,
Mater Design 31 (2010) 3289-3298.
53. M.E. Broz, D.L. VanderHart, N.R. Washburn, Structure and mechanical properties of
poly(D,L-lactic acid)/poly(epsilon-caprolactone) blends, Biomaterials 24 (2003) 4181-
4190.
54. M.A. Abdelwahab, A. Flynn, B.S. Chiou, S. Imam, W. Orts, E. Chiellini, Thermal,
mechanical and morphological characterization of plasticized PLA-PHB blends, Polym
Degrad Stabil 97 (2012) 1822-1828.
55. G.H. Yew, A.M.M. Yusof, Z.A.M. Ishak, U.S. Ishiaku, Water absorption and enzymatic
degradation of poly(lactic acid)/rice starch composites, Polym Degrad Stabil 90 (2005)
488-500.
56. A. Pellis, E.H. Acero, V. Ferrario, D. Ribitsch, G.M. Guebitz, L. Gardossi, The Closure
of the Cycle: Enzymatic Synthesis and Functionalization of Bio-Based Polyesters,
Trends Biotechnol 34 (2016) 316-328.
57. A.M. Gumel, M.S.M. Annuar, T. Heidelberg, Current application of controlled
degradation processes in polymer modification and functionalization, J Appl Polym Sci
129 (2013) 3079-3088.
58. E. Hoveizi, M. Nabiuni, K. Parivar, S. Rajabi-Zeleti, S. Tavakol, Functionalisation and
surface modification of electrospun polylactic acid scaffold for tissue engineering, Cell
Biol Int 38 (2014) 41-49.
59. P. Kucharczyk, I. Poljansek, V. Sedlarik, V. Kasparkova, A. Salakova, J. Drbohlav, U.
Cvelbar, P. Saha, Functionalization of Polylactic Acid Through Direct Melt
Polycondensation in the Presence of Tricarboxylic Acid, J Appl Polym Sci 122 (2011)
1275-1285.
60. X.B. Yuan, C.S. Kang, Y.H. Zhao, M.Q. Gu, P.Y. Pu, N.J. Tian, J. Sheng, Surface
multi-functionalization of poly(lactic acid) nanoparticles and C6 glioma cell targeting in
vivo, Chinese J Polym Sci 27 (2009) 231-239.
61. A. Iwatake, M. Nogi, H. Yano, Cellulose nanofiber-reinforced polylactic acid, Compos
Sci Technol 68 (2008) 2103-2106.
62. J. Weiss, D.J. McClements, P. Takhistov, Functional materials in food nanotechnology,
Food Aust 59 (2007) 274-275.
63. K. Oksman, A.P. Mathew, D. Bondeson, I. Kvien, Manufacturing process of cellulose
whiskers/polylactic acid nanocomposites, Compos Sci Technol 66 (2006) 2776-2784.
64. S.S. Ray, P. Maiti, M. Okamoto, K. Yamada, K. Ueda, New polylactide/layered silicate
nanocomposites. 1. Preparation, characterization, and properties, Macromolecules 35
(2002) 3104-3110.
65. S.S. Ray, K. Yamada, M. Okamoto, A. Ogami, K. Ueda, New polylactide/layered
silicate nanocomposites. 3. High-performance biodegradable materials, Chem Mater 15
(2003) 1456-1465.
66. L. Yu, K. Dean, L. Li, Polymer blends and composites from renewable resources, Prog
Polym Sci 31 (2006) 576-602.
67. K. Das, D. Ray, I. Banerjee, N.R. Bandyopadhyay, S. Sengupta, A.K. Mohanty, M.
Misra, Crystalline Morphology of PLA/Clay Nanocomposite Films and Its Correlation
with Other Properties, J Appl Polym Sci 118 (2010) 143-151.
68. N. Bitinis, A. Sanz, A. Nogales, R. Verdejo, M.A. Lopez-Manchado, T.A. Ezquerra,
Deformation mechanisms in polylactic acid/natural rubber/organoclay
bionanocomposites as revealed by synchrotron X-ray scattering, Soft Matter 8 (2012)
8990-8997.
Chapter 5
140 Artur M. Pinto – Jan 2017
69. M. Nofar, A. Tabatabaei, C.B. Park, Effects of nano-/micro-sized additives on the
crystallization behaviors of PLA and PLA/CO2 mixtures, Polymer 54 (2013) 2382-
2391.
70. M. Keshtkar, M. Nofar, C.B. Park, P.J. Carreau, Extruded PLA/clay nanocomposite
foams blown with supercritical CO2, Polymer 55 (2014) 4077-4090.
71. B. Ayana, S. Suin, B.B. Khatua, Highly exfoliated eco-friendly thermoplastic starch
(TPS)/poly(lactic acid)(PLA)/clay nanocomposites using unmodified nanoclay,
Carbohyd Polym 110 (2014) 430-439.
72. S. Singh, A.K. Ghosh, S.N. Maiti, S. Raha, R.K. Gupta, S. Bhattacharya, Morphology
and rheological behavior of polylactic acid/clay nanocomposites, Polym Eng Sci 52
(2012) 225-232.
73. T.D. Hapuarachchi, T. Peijs, Multiwalled carbon nanotubes and sepiolite nanoclays as
flame retardants for polylactide and its natural fibre reinforced composites, Compos
Part a-Appl S 41 (2010) 954-963.
74. M.A. Busolo, P. Fernandez, M.J. Ocio, J.M. Lagaron, Novel silver-based nanoclay as
an antimicrobial in polylactic acid food packaging coatings, Food Addit Contam A 27
(2010) 1617-1626.
75. Q.K. Meng, M. Hetzer, D. De Kee, PLA/clay/wood nanocomposites: nanoclay effects
on mechanical and thermal properties, J Compos Mater 45 (2011) 1145-1158.
76. L. As'habi, S.H. Jafari, H.A. Khonakdar, R. Boldt, U. Wagenknecht, G. Heinrich,
Tuning the processability, morphology and biodegradability of clay incorporated
PLA/LLDPE blends via selective localization of nanoclay induced by melt mixing
sequence, Express Polym Lett 7 (2013) 21-39.
77. S.M. Lai, Y.T. Hsieh, Preparation and Properties of Polylactic Acid (PLA)/Silica
Nanocomposites, J Macromol Sci B 55 (2016) 211-228.
78. L. Basilissi, G. Di Silvestro, H. Farina, M.A. Ortenzi, Synthesis and characterization of
PLA nanocomposites containing nanosilica modified with different organosilanes II:
Effect of the organosilanes on the properties of nanocomposites: Thermal
characterization, J Appl Polym Sci 128 (2013) 3057-3063.
79. E. Mooney, J.N. Mackle, D.J.P. Blond, E. O'Cearbhaill, G. Shaw, W.J. Blau, F.P.
Barry, V. Barron, J.M. Murphy, The electrical stimulation of carbon nanotubes to
provide a cardiomimetic cue to MSCs, Biomaterials 33 (2012) 6132-6139.
80. M. Obarzanek-Fojt, Y. Elbs-Glatz, E. Lizundia, L. Diener, J.R. Sarasua, A. Bruinink,
From implantation to degradation - are poly (L-lactide)/multiwall carbon nanotube
composite materials really cytocompatible?, Nanomed-Nanotechnol 10 (2014) 1041-
1051.
81. G. Gorrasi, C. Milone, E. Piperopoulos, M. Lanza, A. Sorrentino, Hybrid clay mineral-
carbon nanotube-PLA nanocomposite films. Preparation and photodegradation effect on
their mechanical, thermal and electrical properties, Appl Clay Sci 71 (2013) 49-54.
82. P.R. Supronowicz, P.M. Ajayan, K.R. Ullmann, B.P. Arulanandam, D.W. Metzger, R.
Bizios, Novel current-conducting composite substrates for exposing osteoblasts to
alternating current stimulation, J Biomed Mater Res 59 (2002) 499-506.
83. B. Kumar, M. Castro, J.F. Feller, Poly(lactic acid)-multi-wall carbon nanotube
conductive biopolymer nanocomposite vapour sensors, Sensor Actuat B-Chem 161
(2012) 621-628.
84. W.M. Chiu, Y.A. Chang, H.Y. Kuo, M.H. Lin, H.C. Wen, A study of carbon
nanotubes/biodegradable plastic polylactic acid composites, J Appl Polym Sci 108
(2008) 3024-3030.
85. K.S. Novoselov, D. Jiang, F. Schedin, T.J. Booth, V.V. Khotkevich, S.V. Morozov,
A.K. Geim, Two-dimensional atomic crystals, P Natl Acad Sci USA 102 (2005) 10451-
10453.
86. P. Avouris, C. Dimitrakopoulos, Graphene: synthesis and applications, Mater Today 15
(2012) 86-97.
87. F. Schwierz, ELECTRONICS Industry-compatible graphene transistors, Nature 472
(2011) 41-42.
88. F. Schwierz, Graphene transistors, Nat Nanotechnol 5(7) (2010) 487-496.

PLA/carbon-based nanomaterials composites – literature review
Artur M. Pinto – Jan 2017 141
89. F. Schwierz, Graphene Transistors: Status, Prospects, and Problems, P Ieee 101 (2013)
1567-1584.
90. P. Avouris, Z.H. Chen, V. Perebeinos, Carbon-based electronics, Nat Nanotechnol 2
(2007) 605-615.
91. Q.L. Bao, K.P. Loh, Graphene Photonics, Plasmonics, and Broadband Optoelectronic
Devices, Acs Nano 6 (2012) 3677-3694.
92. H.L. Wang, Y.Y. Liang, H. Sanchez, Y. Yang, L.F. Cui, Y. Cui, H.J. Dai, Graphene-
based hybrid nanomaterials for energy storage applications, Abstr Pap Am Chem S 241
(2011).
93. M. Pumera, Graphene-based nanomaterials for energy storage, Energ Environ Sci 4
(2011) 668-674.
94. L.R. Radovic, C. Mora-Vilches, A.J.A. Salgado-Casanova, Catalysis: An old but new
challenge for graphene-based materials, Chinese J Catal 35 (2014) 792-797.
95. B.F. Machado, P. Serp, Graphene-based materials for catalysis, Catal Sci Technol 2
(2012) 54-75.
96. D.A. Dikin, S. Stankovich, E.J. Zimney, R.D. Piner, G.H.B. Dommett, G. Evmenenko,
S.T. Nguyen, R.S. Ruoff, Preparation and characterization of graphene oxide paper,
Nature 448 (2007) 457-460.
97. J.S. Bunch, S.S. Verbridge, J.S. Alden, A.M. van der Zande, J.M. Parpia, H.G.
Craighead, P.L. McEuen, Impermeable atomic membranes from graphene sheets, Nano
Lett 8 (2008) 2458-2462.
98. M.I. Katsnelson, Graphene: carbon in two dimensions, Mater Today 10 (2007) 20-27.
99. Y.B. Cui, S.I. Kundalwal, S. Kumar, Gas barrier performance of graphene/polymer
nanocomposites, Carbon 98 (2016) 313-333.
100. H. Kim, A.A. Abdala, C.W. Macosko, Graphene/polymer nanocomposites,
Macromolecules 43 (2010) 6515-6530.
101. L.Z. Feng, Z.A. Liu, Graphene in biomedicine: opportunities and challenges,
Nanomedicine-Uk 6 (2011) 317-324.
102. C.H. Lu, H.H. Yang, C.L. Zhu, X. Chen, G.N. Chen, A Graphene Platform for Sensing
Biomolecules, Angew Chem Int Edit 48 (2009) 4785-4787.
103. T. Kuila, S. Bose, P. Khanra, A.K. Mishra, N.H. Kim, J.H. Lee, Recent advances in
graphene-based biosensors, Biosens Bioelectron 26 (2011) 4637-4648.
104. J.J. Shao, D.Y. Zheng, Z.J. Li, Q.H. Yang, Top-down fabrication of two-dimensional
nanomaterials: Controllable liquid phase exfoliation, New Carbon Mater 31 (2016) 97-
114.
105. L.B. Tang, X.M. Li, R.B. Ji, K.S. Teng, G. Tai, J. Ye, C.S. Wei, S.P. Lau, Bottom-up
synthesis of large-scale graphene oxide nanosheets, J Mater Chem 22 (2012) 5676-
5683.
106. Y. Zhang, L.Y. Zhang, C.W. Zhou, Review of Chemical Vapor Deposition of Graphene
and Related Applications, Accounts Chem Res 46 (2013) 2329-2339.
107. R.S. Edwards, K.S. Coleman, Graphene synthesis: relationship to applications,
Nanoscale 5 (2013) 38-51.
108. A. Ciesielski, P. Samori, Graphene via sonication assisted liquid-phase exfoliation,
Chem Soc Rev 43 (2014) 381-398.
109. P.K.S. Vivekanand Prajapati, Arunabha Banik, Carbon nanotubes and its applications,
International Journal of Pharmaceutical Sciences and Research 3 (2010) 1099-1107.
110. M. Terrones, Science and technology of the twenty-first century: Synthesis, properties
and applications of carbon nanotubes, Annu Rev Mater Res 33 (2003) 419-501.
111. M.F.L. De Volder, S.H. Tawfick, R.H. Baughman, A.J. Hart, Carbon Nanotubes:
Present and Future Commercial Applications, Science 339 (2013) 535-539.
112. A.G. Mamalis, L.O.G. Voglander, A. Markopoulos, Nanotechnology and
nanostructured materials: trends in carbon nanotubes, Precis Eng 28 (2004) 16-30.
113. Q. Zhang, J.Q. Huang, M.Q. Zhao, W.Z. Qian, F. Wei, Carbon Nanotube Mass
Production: Principles and Processes, Chemsuschem 4 (2011) 864-889.
Chapter 5
142 Artur M. Pinto – Jan 2017
114. N. Saito, Y. Usui, K. Aoki, N. Narita, M. Shimizu, K. Hara, N. Ogiwara, K. Nakamura,
N. Ishigaki, H. Kato, S. Taruta, M. Endo, Carbon nanotubes: biomaterial applications,
Chem Soc Rev 38 (2009) 1897-1903.
115. A.B. Dalton, S. Collins, J. Razal, E. Munoz, V.H. Ebron, B.G. Kim, J.N. Coleman, J.P.
Ferraris, R.H. Baughman, Continuous carbon nanotube composite fibers: properties,
potential applications, and problems, J Mater Chem 14 (2004) 1-3.
116. J. Wang, Carbon-nanotube based electrochemical biosensors: A review, Electroanal 17
(2005) 7-14.
117. F.L. Darkrim, P. Malbrunot, G.P. Tartaglia, Review of hydrogen storage by adsorption
in carbon nanotubes, Int J Hydrogen Energ 27 (2002) 193-202.
118. J.M. Bonard, H. Kind, T. Stockli, L.A. Nilsson, Field emission from carbon nanotubes:
the first five years, Solid State Electron 45 (2001) 893-914.
119. M. Paradise, T. Goswami, Carbon nanotubes - Production and industrial applications,
Mater Design 28 (2007) 1477-1489.
120. E.B. Malarkey, V. Parpura, Applications of carbon nanotubes in neurobiology,
Neurodegener Dis 4 (2007) 292-299.
121. L. Lacerda, A. Bianco, M. Prato, K. Kostarelos, Carbon nanotubes as nanomedicines:
From toxicology to pharmacology, Adv Drug Deliver Rev 58 (2006) 1460-1470.
122. K. Riehemann, Nanotoxicity: How the Body Develops A Way to Reduce the Toxicity
of Carbon Nanotubes, Small 8 (2012) 1970-1972.
123. Y. Si, E.T. Samulski, Synthesis of water soluble graphene, Nano Lett 8 (2008) 1679-
1682.
124. M. Moniruzzaman, K.I. Winey, Polymer nanocomposites containing carbon nanotubes,
Macromolecules 39 (2006) 5194-5205.
125. M. Tait, A. Pegoretti, A. Dorigato, K. Kalaitzidou, The effect of filler type and content
and the manufacturing process on the performance of multifunctional carbon/poly-
lactide composites, Carbon 49 (2011) 4280-4290.
126. A.M. Pinto, J. Cabral, D.A.P. Tanaka, A.M. Mendes, F.D. Magalhães, Effect of
incorporation of graphene oxide and graphene nanoplatelets on mechanical and gas
permeability properties of poly(lactic acid) films, Polymer International 62 (2013) 33-
40.
127. J.H. Du, H.M. Cheng, The Fabrication, Properties, and Uses of Graphene/Polymer
Composites, Macromol Chem Phys 213 (2012) 1060-1077.
128. X. Huang, Z.Y. Yin, S.X. Wu, X.Y. Qi, Q.Y. He, Q.C. Zhang, Q.Y. Yan, F. Boey, H.
Zhang, Graphene-Based Materials: Synthesis, Characterization, Properties, and
Applications, Small 7 (2011) 1876-1902.
129. S.I. Moon, F. Jin, C. Lee, S. Tsutsumi, S.H. Hyon, Novel carbon nanotube/poly(L-lactic
acid) nanocomposites; Their modulus, thermal stability, and electrical conductivity,
Macromol Symp 224 (2005) 287-295.
130. L.H. He, J. Sun, X.X. Wang, X.H. Fan, Q.L. Zhao, L.F. Cai, R. Song, Z. Ma, W.
Huang, Unzipped multiwalled carbon nanotubes-incorporated poly(L-lactide)
nanocomposites with enhanced interface and hydrolytic degradation, Mater Chem Phys
134 (2012) 1059-1066.
131. P.G. Seligra, F. Nuevo, M. Lamanna, L. Fama, Covalent grafting of carbon nanotubes
to PLA in order to improve compatibility, Compos Part B-Eng 46 (2013) 61-68.
132. J.T. Yoon, Y.G. Jeong, S.C. Lee, B.G. Min, Influences of poly(lactic acid)-grafted
carbon nanotube on thermal, mechanical, and electrical properties of poly(lactic acid),
Polym Advan Technol 20 (2009) 631-638.
133. H.S. Kim, Y.S. Chae, B.H. Park, J.S. Yoon, M. Kang, H.J. Jin, Thermal and electrical
conductivity of poly(L-lactide)/multiwalled carbon nanotube nanocomposites, Curr
Appl Phys 8 (2008) 803-806.
134. J.T. Yoon, S.C. Lee, Y.G. Jeong, Effects of grafted chain length on mechanical and
electrical properties of nanocomposites containing polylactide-grafted carbon
nanotubes, Compos Sci Technol 70 (2010) 776-782.
135. S.D. McCullen, K.L. Stano, D.R. Stevens, W.A. Roberts, N.A. Monteiro-Riviere, L.I.
Clarke, R.E. Gorga, Development, optimization, and characterization of electrospun

PLA/carbon-based nanomaterials composites – literature review
Artur M. Pinto – Jan 2017 143
poly(lactic acid) nanofibers containing multi-walled carbon nanotubes, J Appl Polym
Sci 105 (2007) 1668-1678.
136. W.M. Chiu, H.Y. Kuo, P.A. Tsai, J.H. Wu, Preparation and Properties of Poly (Lactic
Acid) Nanocomposites Filled with Functionalized Single-Walled Carbon Nanotubes, J
Polym Environ 21 (2013) 350-358.
137. Y.X. Kong, J. Yuan, Z.M. Wang, J. Qiu, Study on the preparation and properties of
aligned carbon nanotubes/polylactide composite fibers, Polym Composite 33 (2012)
1613-1619.
138. K. Chrissafis, K.M. Paraskevopoulos, A. Jannakoudakis, T. Beslikas, D. Bikiaris,
Oxidized Multiwalled Carbon Nanotubes as Effective Reinforcement and Thermal
Stability Agents of Poly(lactic acid) Ligaments, J Appl Polym Sci 118 (2010) 2712-
2721.
139. L. Vaisman, H.D. Wagner, G. Marom, The role of surfactants in dispersion of carbon
nanotubes, Adv Colloid Interfac 128 (2006) 37-46.
140. A.M. Pinto, S. Moreira, I.C. Goncalves, F.M. Gama, A.M. Mendes, F.D. Magalhaes,
Biocompatibility of poly(lactic acid) with incorporated graphene-based materials,
Colloid Surface B 104 (2013) 229-238.
141. W.X. Li, Z.W. Xu, L. Chen, M.J. Shan, X. Tian, C.Y. Yang, H.M. Lv, X.M. Qian, A
facile method to produce graphene oxide-g-poly(L-lactic acid) as an promising
reinforcement for PLLA nanocomposites, Chem Eng J 237 (2014) 291-299.
142. W.X. Li, C.B. Shi, M.J. Shan, Q.W. Guo, Z.W. Xu, Z. Wang, C.Y. Yang, W. Mai, J.R.
Niu, Influence of silanized low-dimensional carbon nanofillers on mechanical,
thermomechanical, and crystallization behaviors of poly(L-lactic acid) composites - A
comparative study, J Appl Polym Sci 130 (2013) 1194-1202.
143. Y.W. Cao, J.C. Feng, P.Y. Wu, Preparation of organically dispersible graphene
nanosheet powders through a lyophilization method and their poly(lactic acid)
composites, Carbon 48 (2010) 3834-3839.
144. H.S. Wang, Z.B. Qiu, Crystallization behaviors of biodegradable poly(L-lactic
acid)/graphene oxide nanocomposites from the amorphous state, Thermochim Acta 526
(2011) 229-236.
145. X.Z. Tong, F. Song, M.Q. Li, X.L. Wang, I.J. Chin, Y.Z. Wang, Fabrication of
graphene/polylactide nanocomposites with improved properties, Compos Sci Technol
88 (2013) 33-38.
146. Y.X. Shen, T. Jing, W.J. Ren, J.W. Zhang, Z.G. Jiang, Z.Z. Yu, A. Dasari, Chemical
and thermal reduction of graphene oxide and its electrically conductive polylactic acid
nanocomposites, Compos Sci Technol 72 (2012) 1430-1435.
147. H.D. Huang, P.G. Ren, J.Z. Xu, L. Xu, G.J. Zhong, B.S. Hsiao, Z.M. Li, Improved
barrier properties of poly(lactic acid) with randomly dispersed graphene oxide
nanosheets, J Membrane Sci 464 (2014) 110-118.
148. D.F. Wu, Y.X. Cheng, S.H. Feng, Z. Yao, M. Zhang, Crystallization Behavior of
Polylactide/Graphene Composites, Ind Eng Chem Res 52 (2013) 6731-6739.
149. P.P. Chen, Y. Wang, T. Wei, Z. Meng, X.D. Jia, K. Xi, Greatly enhanced mechanical
properties and heat distortion resistance of poly(L-lactic acid) upon compositing with
functionalized reduced graphene oxide, J Mater Chem A 1 (2013) 9028-9032.
150. R. Verdejo, M.M. Bernal, L.J. Romasanta, M.A. Lopez-Manchado, Graphene filled
polymer nanocomposites, J Mater Chem 21 (2011) 3301-3310.
151. W.Y. Lin, Y.F. Shih, C.H. Lin, C.C. Lee, Y.H. Yu, The preparation of multi-walled
carbon nanotube/poly(lactic acid) composites with excellent conductivity, J Taiwan Inst
Chem E 44 (2013) 489-496.
152. S. Barrau, C. Vanmansart, M. Moreau, A. Addad, G. Stoclet, J.M. Lefebvre, R.
Seguela, Crystallization Behavior of Carbon Nanotube-Polylactide Nanocomposites,
Macromolecules 44 (2011) 6496-6502.
153. T. Villmow, P. Potschke, S. Pegel, L. Haussler, B. Kretzschmar, Influence of twin-
screw extrusion conditions on the dispersion of multi-walled carbon nanotubes in a
poly(lactic acid) matrix, Polymer 49 (2008) 3500-3509.

Chapter 5
144 Artur M. Pinto – Jan 2017
154. C.F. Kuan, H.C. Kuan, C.C.M. Ma, C.H. Chen, Mechanical and electrical properties of
multi-wall carbon nanotube/poly(lactic acid) composites, J Phys Chem Solids 69 (2008)
1395-1398.
155. L. Lei, J.H. Qiu, E. Sakai, Preparing conductive poly(lactic acid) (PLA) with
poly(methyl methacrylate) (PMMA) functionalized graphene (PFG) by admicellar
polymerization, Chem Eng J 209 (2012) 20-27.
156. G. Gorrasi, A. Sorrentino, Photo-oxidative stabilization of carbon nanotubes on
polylactic acid, Polym Degrad Stabil 98 (2013) 963-971.
157. A.M. Ali, S.H. Ahmad, Mechanical Characterization And Morphology Of Polylactic
Acid /Liquid Natural Rubber Filled With Multi Walled Carbon Nanotubes, Aip Conf
Proc 1571 (2013) 83-89.
158. B.W. Chieng, N.A. Ibrahim, W.M.Z.W. Yunus, M.Z. Hussein, Poly(lactic
acid)/Poly(ethylene glycol) Polymer Nanocomposites: Effects of Graphene
Nanoplatelets, Polymers-Basel 6 (2014) 93-104.
159. C.L. Bao, L. Song, W.Y. Xing, B.H. Yuan, C.A. Wilkie, J.L. Huang, Y.Q. Guo, Y. Hu,
Preparation of graphene by pressurized oxidation and multiplex reduction and its
polymer nanocomposites by masterbatch-based melt blending, J Mater Chem 22 (2012)
6088-6096.
160. A.M. Ali, S.H. Ahmad, Effect of Processing Parameter and Filler Content on Tensile
Properties of Multi-walled Carbon Nanotubes Reinforced Polylactic Acid
Nanocomposite, 2012 National Physics Conference, Perfik 1528 (2013) 254-259.
161. S.Y. Kim, K.S. Shin, S.H. Lee, K.W. Kim, J.R. Youn, Unique Crystallization Behavior
of Multi-Walled Carbon Nanotube Filled Poly(lactic acid), Fiber Polym 11 (2010)
1018-1023.
162. M. Murariu, A.L. Dechief, L. Bonnaud, Y. Paint, A. Gallos, G. Fontaine, S. Bourbigot,
P. Dubois, The production and properties of polylactide composites filled with
expanded graphite, Polym Degrad Stabil 95 (2010) 889-900.
163. F. Hassouna, A. Laachachi, D. Chapron, Y. El Mouedden, V. Toniazzo, D. Ruch,
Development of new approach based on Raman spectroscopy to study the dispersion of
expanded graphite in poly(lactide), Polym Degrad Stabil 96 (2011) 2040-2047.
164. J.R. Potts, D.R. Dreyer, C.W. Bielawski, R.S. Ruoff, Graphene-based polymer
nanocomposites, Polymer 52 (2011) 5-25.
165. H. Kim, S. Kobayashi, M.A. AbdurRahim, M.L.J. Zhang, A. Khusainova, M.A.
Hillmyer, A.A. Abdala, C.W. Macosko, Graphene/polyethylene nanocomposites: Effect
of polyethylene functionalization and blending methods, Polymer 52 (2011) 1837-1846.
166. J.H. Yang, S.H. Lin, Y.D. Lee, Preparation and characterization of poly(L-lactide)-
graphene composites using the in situ ring-opening polymerization of PLLA with
graphene as the initiator, J Mater Chem 22 (2012) 10805-10815.
167. K.P. Pramoda, C.B. Koh, H. Hazrat, C.B. He, Performance Enhancement of Polylactide
by Nanoblending With POSS and Graphene Oxide, Polym Composite 35 (2014) 118-
126.
168. M.S.Z. Desa, A. Hassan, A. Arsad, The Effect of Natural Rubber Toughening on
Mechanical Properties of Poly(lactic Acid)/Multiwalled Carbon Nanotube
Nanocomposite, Adv Mater Res-Switz 747 (2013) 639-642.
169. S.J. Shao, S.B. Zhou, L. Li, J.R. Li, C. Luo, J.X. Wang, X.H. Li, J. Weng, Osteoblast
function on electrically conductive electrospun PLA/MWCNTs nanofibers,
Biomaterials 32 (2011) 2821-2833.
170. P. Potschke, T. Andres, T. Villmow, S. Pegel, H. Brunig, K. Kobashi, D. Fischer, L.
Haussler, Liquid sensing properties of fibres prepared by melt spinning from poly(lactic
acid) containing multi-walled carbon nanotubes, Compos Sci Technol 70 (2010) 343-
349.
171. A. Magrez, S. Kasas, V. Salicio, N. Pasquier, J.W. Seo, M. Celio, S. Catsicas, B.
Schwaller, L. Forro, Cellular toxicity of carbon-based nanomaterials, Nano Lett 6
(2006) 1121-1125.
172. S.D. McCullen, D.R. Stevens, W.A. Roberts, L.I. Clarke, S.H. Bernacki, R.E. Gorga,
E.G. Loboa, Characterization of electrospun nanocomposite scaffolds and
PLA/carbon-based nanomaterials composites – literature review
Artur M. Pinto – Jan 2017 145
biocompatibility with adipose-derived human mesenchymal stem cells, Int J Nanomed 2
(2007) 253-263.
173. P.C. Sherrell, B.C. Thompson, J.K. Wassei, A.A. Gelmi, M.J. Higgins, R.B. Kaner,
G.G. Wallace, Maintaining Cytocompatibility of Biopolymers Through a Graphene
Layer for Electrical Stimulation of Nerve Cells, Adv Funct Mater 24 (2014) 769-776.
174. Z.Q. Li, X.W. Zhao, L. Ye, P. Coates, F. Caton-Rose, M. Martyn, Structure and blood
compatibility of highly oriented PLA/MWNTs composites produced by solid hot
drawing, J Biomater Appl 28 (2014) 978-989.
175. X.L. An, H.B. Ma, B. Liu, J.Z. Wang, Graphene Oxide Reinforced Polylactic
Acid/Polyurethane Antibacterial Composites, J Nanomater (2013).
176. J.M. Kanczler, S.H. Mirmalek-Sani, N.A. Hanley, A.L. Ivanov, J.J.A. Barry, C. Upton,
K.M. Shakesheff, S.M. Howdle, E.N. Antonov, V.N. Bagratashvili, V.K. Popov, R.O.C.
Oreffo, Biocompatibility and osteogenic potential of human fetal femur-derived cells on
surface selective laser sintered scaffolds, Acta Biomater 5 (2009) 2063-2071.
177. O.J. Yoon, C.Y. Jung, I.Y. Sohn, H.J. Kim, B. Hong, M.S. Jhon, N.E. Lee,
Nanocomposite nanofibers of poly(D, L-lactic-co-glycolic acid) and graphene oxide
nanosheets, Compos Part a-Appl S 42 (2011) 1978-1984.
178. O.J. Yoon, I.Y. Sohn, D.J. Kim, N.E. Lee, Enhancement of thermomechanical
properties of poly(D,L-lactic-co-glycolic acid) and graphene oxide composite films for
scaffolds, Macromol Res 20 (2012) 789-794.
179. H.B. Ma, W.X. Su, Z.X. Tai, D.F. Sun, X.B. Yan, B. Liu, Q.J. Xue, Preparation and
cytocompatibility of polylactic acid/hydroxyapatite/graphene oxide nanocomposite
fibrous membrane, Chinese Sci Bull 57 (2012) 3051-3058.
Chapter 6
146 Artur M. Pinto – Jan 2017

Physical-chemical properties and biocompatibility of PLA/GBMs composites – Production by solvent-mixing
Artur M. Pinto – Jan 2017 147
Chapter 6
Physical-chemical properties and
biocompatibility of PLA/GBMs
composites:
Production by solvent-mixing
This chapter was based in the following published paper:

Chapter 6
148 Artur M. Pinto – Jan 2017

Physical-chemical properties and biocompatibility of PLA/GBMs composites – Production by solvent-mixing
Artur M. Pinto – Jan 2017 149
6 PHYSICAL-CHEMICAL PROPERTIES AND
BIOCOMPATIBILITY OF PLA/GBMS
COMPOSITES - PRODUCTION BY
SOLVENT-MIXING
6.1 Scope
There is a need to improve some of poly(lactic acid) (PLA) properties for several biomedical
applications, being mechanical performance the most pressing. Due to its particular physical-
chemical properties, graphene-based materials (GBMs) are able to interact with polymer matrices
when incorporated as fillers, even when used in low amounts, usually improving composites
performance and leaving the base polymer key properties intact. This chapter, describes the
preparation by solvent mixing followed by doctor blading, and characterization of PLA films and
composite PLA films incorporating two GBMs – graphene oxide (GO) and graphene
nanoplatelets (GNP). The materials were prepared and characterized regarding not only
biocompatibility, but also surface topography, chemistry, and wettability.
6.2 State of the art
Aliphatic polyesters with reactive groups have attracted attention because of the demand of
synthetic biopolymers with tuneable properties, including features such as hydrophilicity,
biodegradation rates, bioadhesion, drug/targeting moiety attachment, etc. Poly(lactic acid) (PLA)
has been widely investigated for biomedical applications because it is biodegradable,
bioresorbable, and biocompatible. [1, 2] This polymer has several applications in tissue and
surgical implant engineering, like production of: bioresorbable artificial ligaments, hernia repair
meshes, scaffolds, screws, surgical plates, and suture yarns. [3, 4] PLA is also used in production of
nano/microparticles for drug delivery, and in packaging of pharmaceutical products. [5] To make
this material more attractive for some applications, as an effective alternative to petrochemical

Chapter 6
150 Artur M. Pinto – Jan 2017
plastics, some properties should be improved, namely mechanical performance. [6] To attain these
objectives different approaches have been tried according to the required applications. Some
commonly used strategies are adjustment of crystallinity [7], incorporation of plasticizers [8],
blends with other polymers [6] and addition of nanofillers. The latter is an interesting option, since
with the addition of small weight percentages (wt.%) target properties can, in principle, be
improved, while maintaining other key PLA properties intact. Good dispersion and interfacial
interaction with the polymer matrix is paramount in order for these improvements to be
significant. Most of the nanofillers reported are nanoclays [9], carbon nanotubes [10], and
nanosilicas [11].
Graphene, the elementary structure of graphite, is an atomically thick sheet composed of
sp2 carbon atoms arranged in a flat honeycomb structure. It possesses remarkable mechanical
strength and an extremely high surface area. [12] Since graphene is hydrophobic, stable dispersions
in water can only be obtained with addition of proper surfactants. [13] Graphene oxide (GO) is
similar to graphene, but presents oxygen-containing functional groups. The presence of these
polar groups reduces the thermal stability of the nanomaterial, but may be important to promote
interaction and compatibility with a particular polymer matrix. [12, 14]
GO and graphene have been reported as efficient drug carriers [15, 16], as well as PLA [17].
Development of hybrid vehicles for drug targeting can take advantage of both materials properties
and originate synergistic effects. [18] In addition, several graphene based biosensors are being
developed. [19] Recent studies show that graphene substrates promote adherence of human
mesenchymal stromal cells and osteoblasts [20], which can lead to better performance on tissues
regeneration using scaffolds containing graphene and graphene oxide. Due to their great potential,
several approaches are under study for future applications of these nanomaterials in biomedical
engineering and biotechnology. [21]
There are only a few studies regarding the biological effects of graphene and graphene
derivatives. [22-28] Moreover, in some cases contradictory results are reported. [22, 28] Some of the
materials tested have identical designations, but in fact are obtained from different products and
by different methods, leading to divergent conclusions. Most studies refer concentration
dependent toxicity. [23-26] Effective mechanical reinforcement of polymeric materials using very
small loadings of GO and graphene nanoplatelets (GNP) has been described by several authors.
[29-31] Therefore, toxicological effects may not occur if the amount of nanofillers exposed or
released from the polymer is sufficiently low to avoid attaining toxic concentrations.

Physical-chemical properties and biocompatibility of PLA/GBMs composites – Production by solvent-mixing
Artur M. Pinto – Jan 2017 151
The synthesis of GNP and GO does not require metal catalysis, contrarily to the production of
carbon nanotubes, a chemically similar material that has attracted significant interest. Thus,
cytotoxicity and inflammation caused by residual metals does not occur for GNP and GO. [32]
An appropriate cellular response to implanted surfaces is essential for tissue regeneration and
integration. It is well described that implanted materials are immediately coated with proteins
from blood and interstitial fluids, and it is through this adsorbed layer that cells sense foreign
surfaces. Although several studies have been made, it is not yet clear which material properties
(e.g. topography, chemical composition, wettability, surface charge) favor in vitro protein
adsorption and cell adhesion and proliferation. [33] Graphene and graphene oxide can affect
protein adsorption and cell adhesion and proliferation, according to their intrinsic morphology and
wettability. The adhesion and activation of platelets is also affected by the abovementioned
factors. Presence of carbon nanotubes at the surface of PLA films was reported to decrease
thrombogenicity. [34] In addition, the starting materials and methods used in the production of
graphene-based materials, as well as the presence of toxic functional groups and contaminants,
can affect biocompatibility.
In a previous study [35], we showed that incorporation of small amounts (0.4 wt.%) of GO and
GNP in PLA significantly increases tensile strength and Young's modulus. Thus, this type of
composites have a potential use in the production of surgical implants with improved mechanical
performance. However, it is paramount to assure that these biomaterials do not present toxicity
problems. In this work surface properties of PLA/GO and PLA/GNP thin films are characterized.
Biocompatibility of the composite films is evaluated through cytotoxicity and cell proliferation
assays. Platelet adhesion and activation studies are used to assess hemocompatibility of the films.
6.3 Materials and methods
6.3.1 Materials
Poly(lactic acid) (PLA) 2002 D (4% d-lactide, 96% l-lactide content, molecular weight
121,400 g mol−1), was obtained from Natureworks (Minnetonka, USA). Graphene nanoplatelets
(GNP) grade M5, were purchased from XG Sciences (Lansing, USA), with the following
characteristics: average thickness of 6–8 nm, maximum length 5 μm, and surface area between
120 and 150 m2 g−1. GNP production is based on exfoliation of sulfuric acid-based intercalated
graphite by rapid microwave heating, followed by ultrasonic treatment. [36, 37]
Carbon graphite micropowder, with purity above 99% and a diameter between 7 and 11 μm was
purchased from American Elements, Los Angeles, USA.
Chapter 6
152 Artur M. Pinto – Jan 2017
6.3.2 Preparation of GO
Graphene oxide (GO) was prepared according to a modified Hummer's method. Briefly, 100 mL
of H2SO4 were added to 3 g of graphite at room temperature and the solution was cooled using an
ice bath, followed by gradual addition of 14 g of KMnO4. Then 300 mL of distilled water were
added, followed by addition of H2O2 (to reduce KMnO4 excess) until oxygen release stopped. The
solid was filtered and washed with water. After overnight resting, the resultant solution was
decanted and the remaining product was centrifuged at 2000 rpm, during 5 min (this process was
repeated four times). The solid was recovered and dried at 110 °C for 48 h. [38]
6.3.3 Preparation of PLA/GO films
Nanocomposite thin films with GO and GNP were prepared by doctor blade casting of solvent
dispersions, as described in our previous work. [35] GO was dispersed in acetone using an
ultrasonic bath (Bandelin Sonorex RK 512 H) during 5 h and then added to a PLA/chloroform
solution and again sonicated for 15 min. Concentration of GO relative to PLA was 0.4 wt.%,
since in a previous work we have verified that this was the optimum loading for mechanical
performance improvement in terms of tensile strength and Young's modulus. [35] Thin films (25–
65 μm) were made by spreading the PLA/GO dispersion on a PTFE coated plate using a blade
applicator. Solvent was completely removed by drying in a vacuum oven.
6.3.4 Preparation of PLA/GNP films
GNP were dispersed in chloroform using ultrasound sonication during 2 h and then dispersed in a
PLA/chloroform solution. Concentration of GNP relative to PLA was 0.4 wt.%, for the
abovementioned reason. Thin films (25–65 μm) were prepared and dried according to same
procedures as the PLA/GO nanocomposites.
6.3.5 Films surface characterization
6.3.5.1 Contact angle and surface free energy measurements
A OCA 20 (Dataphysics) goniometer was used to measure the contact angles of ultrapure water,
ethane-1,2-diol and hexadecane on pristine PLA, PLA/GO and PLA/GNP films, by sessile drop
method. Data were collected with SCA 20 v2 software. Equilibrium contact angles (considered at
60 s) were measured for 5 μL droplet volumes. Determinations were made on 3 different locations
for each condition. The total surface free energy and the polar and dispersive components of the
films were evaluated by the OWRK Method using SCA 20 software. Polar and dispersive
components of the surface tension of the liquids that were used are 46.80 and 26.00 mN m−1 for

Physical-chemical properties and biocompatibility of PLA/GBMs composites – Production by solvent-mixing
Artur M. Pinto – Jan 2017 153
water, 21.30 and 26.30 mN m−1 for ethane-1,2-diol and 0.00 and 27.47 mN m−1 for hexadecane,
respectively.
6.3.5.2 Reflected light microscopy
Reflected light microscopy images of PLA, PLA/GO and PLA/GNP films were obtained with a
Zeiss axiophot microscope, equipped with a Zeiss axiocam ICc 3. The specified spatial resolution
is 370 nm.
6.3.5.3 X-ray photoelectron spectroscopy (XPS)
PLA, PLA/GO and PLA/GNP thin films and GNP, graphite and GO powders were analyzed with
an Escalab 200 VG Scientific spectrometer working in ultra-high vacuum (1 × 10⁻⁶ Pa) and using
achromatic Al Kα radiation (1486.6 eV). The analyzer pass energy was 50 eV for survey spectra
and 20 eV for high-resolution spectra. The spectrometer was calibrated using (Au 3d5/2 at
368.27 eV). The core levels for O 1s and C 1s were analyzed. The photoelectron take-off angle
(the angle between the surface of the sample and the axis of the energy analyzer) was 90°. The
electron gun used focused on the specimen in an area close to 100 mm2. Analyzed samples were
not conductive, for these reason spectra energy was displaced and a corrective shift based on the
C 1s peak (285 eV) was performed. Curve fitting of the spectra was performed with the software
XPS peak version 4.1.
6.3.5.4 Topography characterization
A stylus profilometer Hommel T8000, equipped with a pick-up-set taster TKL 300/17, was used
to obtain a three-dimensional characterization of the topography of rectangular surface areas with
1.5 mm × 1.5 mm of PLA, PLA/GO and PLA/GNP films. Determinations were made on 3
different locations for each film. Roughness parameters determined were: Sa – arithmetic average
height of the surface (Sa=1/A∬a|Z(x,y)|dxdy, A – area) and Sp, Sv, and Sz which are parameters
evaluated from the absolute highest and lowest points found on the surface, being: Sp – the
maximum peak height, which is the height of the highest point; Sv – the maximum valley depth –
which is the depth of the lowest point (expressed as a negative number); Sz– the maximum height
of the surface. Thus, Sz = Sp − Sv (ISO 25178-2). [39, 40] The specified space resolution is 100 nm
in x, y and z.
6.3.6 In vitro biocompatibility assays
In vitro assays were performed using mouse embryo fibroblasts 3T3 (ATCC CCL-164), grown in
Dulbecco's modified Eagle's media supplemented with 10% newborn calf serum (Invitrogen) and

Chapter 6
154 Artur M. Pinto – Jan 2017
penicillin/streptomycin (1 mg mL−1) (Sigma–Aldrich) [DMEM+], at 37.0 °C, in a fully
humidified air containing 5% CO2 (Infrared auto Flow). The cells were fed every 2–3 days. The
cells were detached when 90% confluence was reached using a 0.25% (w/v) trypsin-EDTA
solution (Sigma) and resuspended in culture medium at cellular density according to the assay.
All assays were performed in triplicate and repeated at least 3 times. Results are presented as
mean and standard deviation (SD).
6.3.6.1 Cell adhesion and proliferation at the surface of PLA, PLA/GO,
and PLA/GNP films
Films (Ø 13 mm) constituted by PLA, PLA/GO and PLA/GNP were sterilized by immersion in
ethanol (70%, v/v) and then washed with PBS (Phosphate Buffered Saline) before cells seeding at
5 × 10⁴ cells/well and incubated. Polystyrene disc (PS) was used as positive control. Fibroblasts
proliferation was evaluated using 1-(4,5-dimethylthiazol-2-yl)-3,5-diphenylformazan (MTT,
Sigma), a colorimetric assay that gives a measure of the mitochondrial metabolic activity. Before
the addition of MTT solution (0.5 mg mL−1 in PBS) films were changed to a new plate containing
new medium. MTT assays were performed at 24, 48 and 72 h after cell seeded. The absorbance
was measured at 570 nm and the cell proliferation inhibition index (CPII) was calculated as
follows: CPII = 100 – (OD 570 nm of test culture/ OD 570 nm of control culture (PS) x 100).
6.3.6.2 Direct contact assay
A fibroblast suspension containing 3 × 10⁴ cells mL−1 was plated into each well of a six-well
plate. After reaching a state of subconfluence (after 24 h), samples of PLA, PLA/GO and
PLA/GNP films (Ø 13 mm) were placed on the wells, in direct contact with cells. After 48 h
incubation, the cell morphology and viability was assessed, using the
LIVE/DEAD®Viability/Cytotoxicity Kit for mammalian cells fluorescence (Invitrogen) labeling.
Positive and negative controls (discs of latex and agar gel) were also used.
6.3.6.3 Platelet adhesion and activation
The adhesion of platelets to the surface of Ø 14 mm disks of PLA, PLA/GO and PLA/GNP films
were evaluated by counting and observation of morphological features using scanning electron
microscopy (SEM). Wells of 24-well plates were blocked by adding BSA (bovine serum albumin)
1% (w/v) in each well followed by 1 h incubation at 37 °C, and then rinsing with PBS (0.01 M,
pH 7.4). Films were sterilized in ethanol 70% (v/v) for 20 min, and then rinsed with PBS. To
evaluate the effect of serum proteins in platelet adhesion and activation, the samples, PS
[poly(styrene)] – control, PLA, PLA/GO and PLA/GNP were first incubated with two different
pre-immersion solutions: PBS or human plasma 1% (provided by the Portuguese Blood Institute)
in a 24-well plate for 30 min at 37 °C, and afterwards rinsed with PBS. The human platelets
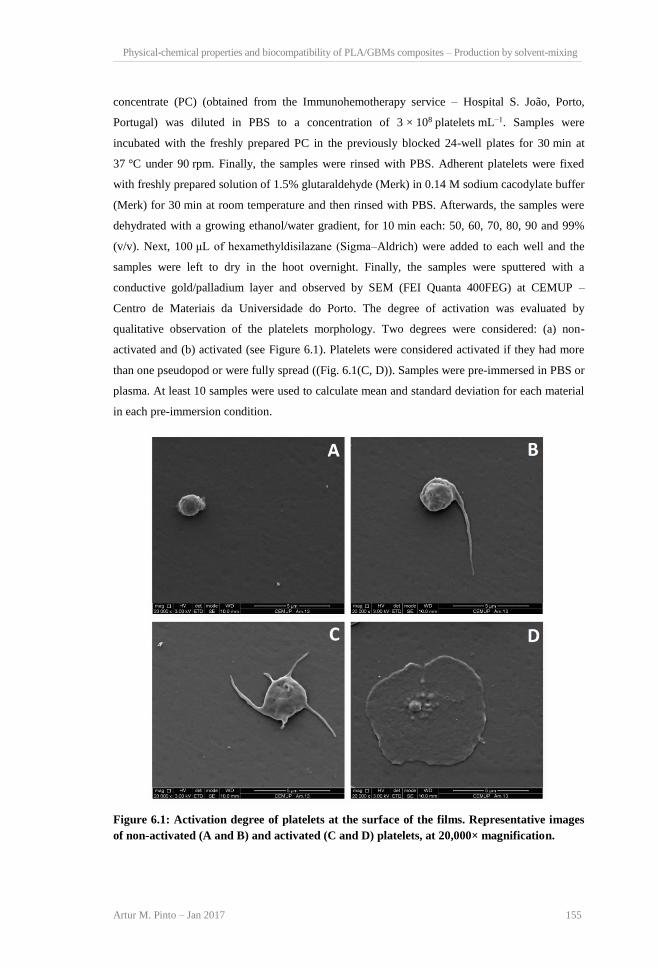
Physical-chemical properties and biocompatibility of PLA/GBMs composites – Production by solvent-mixing
Artur M. Pinto – Jan 2017 155
concentrate (PC) (obtained from the Immunohemotherapy service – Hospital S. João, Porto,
Portugal) was diluted in PBS to a concentration of 3 × 10⁸ platelets mL−1. Samples were
incubated with the freshly prepared PC in the previously blocked 24-well plates for 30 min at
37 °C under 90 rpm. Finally, the samples were rinsed with PBS. Adherent platelets were fixed
with freshly prepared solution of 1.5% glutaraldehyde (Merk) in 0.14 M sodium cacodylate buffer
(Merk) for 30 min at room temperature and then rinsed with PBS. Afterwards, the samples were
dehydrated with a growing ethanol/water gradient, for 10 min each: 50, 60, 70, 80, 90 and 99%
(v/v). Next, 100 μL of hexamethyldisilazane (Sigma–Aldrich) were added to each well and the
samples were left to dry in the hoot overnight. Finally, the samples were sputtered with a
conductive gold/palladium layer and observed by SEM (FEI Quanta 400FEG) at CEMUP –
Centro de Materiais da Universidade do Porto. The degree of activation was evaluated by
qualitative observation of the platelets morphology. Two degrees were considered: (a) non-
activated and (b) activated (see Figure 6.1). Platelets were considered activated if they had more
than one pseudopod or were fully spread ((Fig. 6.1(C, D)). Samples were pre-immersed in PBS or
plasma. At least 10 samples were used to calculate mean and standard deviation for each material
in each pre-immersion condition.
Figure 6.1: Activation degree of platelets at the surface of the films. Representative images
of non-activated (A and B) and activated (C and D) platelets, at 20,000× magnification.

Chapter 6
156 Artur M. Pinto – Jan 2017
6.3.7 Statistical analysis
Statistical analysis was made by analysis of variance (ANOVA). Multiple means comparison was
performed between samples to identify significant differences, which were considered
for p < 0.05. In suitable cases independent two samples Student's t-test was used. Significant
differences were also considered for p < 0.05.
6.4 Results and discussion
6.4.1 Topographical characterization
The 3D topography images shown in Figure 6.2 compare the surfaces of pristine PLA films with
PLA/GO and PLA/GNP composite films surfaces. The peaks seen in Fig. 6.2(B) correspond to
agglomerates (1–2 μm), since individual GO sheets are too small to be detected by this technique
(sizes in the order of tenths of micron). [35] On the other hand, GNP particles have nominal
lengths close to 5 μm, allowing for the observation of both individual and agglomerated particles
Fig. 6.2(C). The peaks are distributed throughout the entire surface. A grooved pattern was
observed on the surfaces of all samples. Reflected light microscopy was used to identify the cause
of this pattern (discussed next).
Table 6.1 shows that films with GO and GNP incorporation present higher positive values
of Sp and St than pristine PLA films, due to presence of fillers at the surface. PLA/GNP films
presented negative values of Sv higher than PLA/GO films. This may be an indication of GNP
having less compatibility with the polymer matrix than GO, thus being less embedded in it,
existing more pronounced depressions surrounding GNP than GO particles. GO has more
functional groups with oxygen than GNP (shown in Section 6.4.2), which form hydrogen bonds
with similar groups in PLA. Differences in Sa between samples are not considerable because only
a very small weight percentage of nanofillers are dispersed in the films.
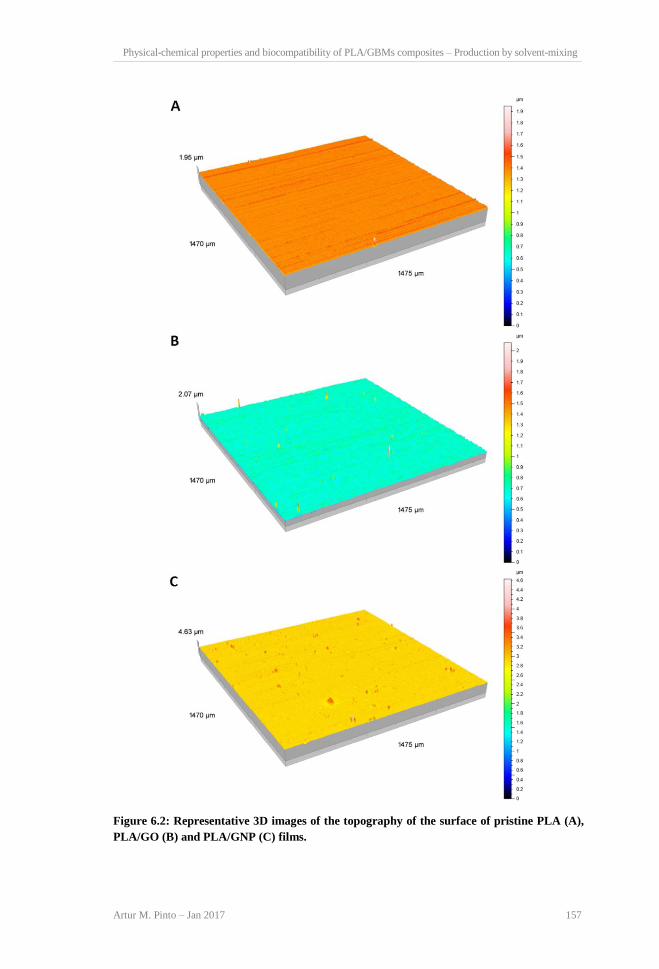
Physical-chemical properties and biocompatibility of PLA/GBMs composites – Production by solvent-mixing
Artur M. Pinto – Jan 2017 157
Figure 6.2: Representative 3D images of the topography of the surface of pristine PLA (A),
PLA/GO (B) and PLA/GNP (C) films.

Chapter 6
158 Artur M. Pinto – Jan 2017
Table 6.1: Roughness parameters for PLA, PLA/GO and PLA/GNP films. Sa – arithmetic
average height of the surface, Sp – maximum peak height, Sv – maximum valley depth, Sz –
maximum height of the surface. Results are presented as mean and standard deviation (in
parenthesis) for n = 3.
Roughness parameters
Samples Sa / nm Sp / nm Sv / nm Sz / nm
PLA 43 (11) 730 (124) -711 (427) 1441 (346)
PLA/GO 43 (6) 1623 (370) -816 (203) 2439 (565)
PLA/GNP 37 (6) 1211 (476) -1797 (963) 3008 (1424)
Reflected light microscopy images (Figure 6.3) show that the surface of the films presents
grooves with pitches between 0.5 and 2 μm for all conditions. These grooves are in the same
direction as the spreading of the films. This might occur due to imprinting of a micropattern
present in the doctor blade during spreading. Rapid solvent evaporation in these thin films hinders
surface leveling and originates this morphology. GO and GNP are visible in Fig. 6.3(B,C) as dark
and bright spots, respectively.
6.4.2 Chemical characterization
Chemical properties of nanofillers used in a composite are relevant in two important contexts: (i)
compatibility with the polymer matrix, and (ii) biological effects when exposed at the film surface
or released due to matrix biodegradation. XPS results (Figure 6.4 and Table 6.2) show that, both
graphite and GNP present a low degree of oxidation (atomic percentage of oxygen – O 1s
(at.%) < 9%). This was expected since graphite is mainly constituted by carbon atoms and GNP is
obtained from graphite by microwave and ultrasonic treatment (see Section 6.3.1). XPS data also
reveal that oxidation of graphite by modified Hummer's method, to produce graphene oxide,
increases the O 1s (at.%) in the final product (GO) by about 15%. The most ubiquitous oxygen
functional groups identified in GO are ethers.

Physical-chemical properties and biocompatibility of PLA/GBMs composites – Production by solvent-mixing
Artur M. Pinto – Jan 2017 159
Figure 6.3: Reflected light microscopy of the surface of PLA (A), PLA/GO (B) and
PLA/GNP (C) films.
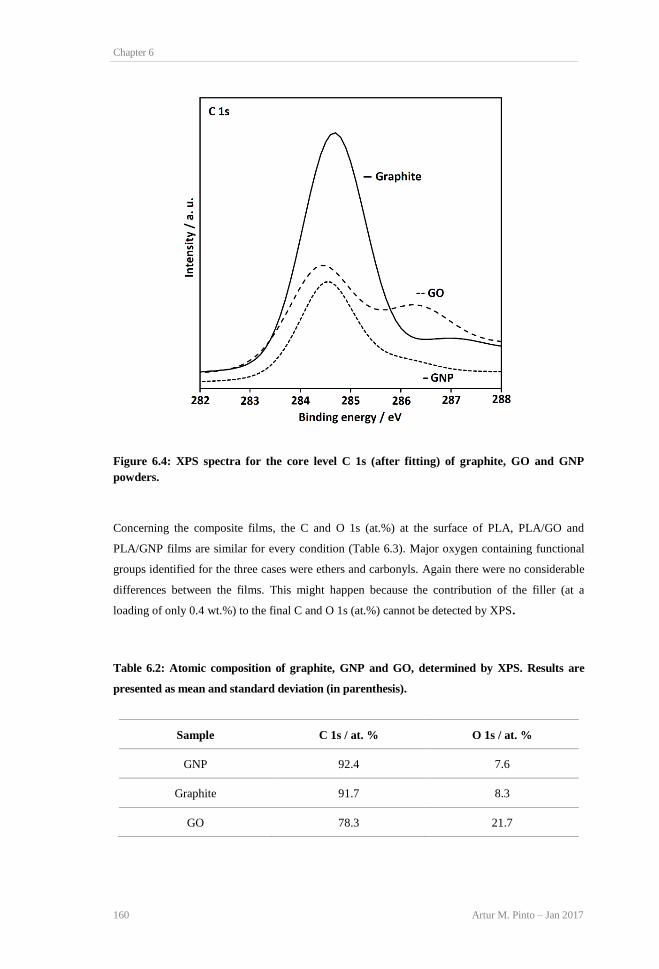
Chapter 6
160 Artur M. Pinto – Jan 2017
Figure 6.4: XPS spectra for the core level C 1s (after fitting) of graphite, GO and GNP
powders.
Concerning the composite films, the C and O 1s (at.%) at the surface of PLA, PLA/GO and
PLA/GNP films are similar for every condition (Table 6.3). Major oxygen containing functional
groups identified for the three cases were ethers and carbonyls. Again there were no considerable
differences between the films. This might happen because the contribution of the filler (at a
loading of only 0.4 wt.%) to the final C and O 1s (at.%) cannot be detected by XPS.
Table 6.2: Atomic composition of graphite, GNP and GO, determined by XPS. Results are
presented as mean and standard deviation (in parenthesis).
Sample C 1s / at. % O 1s / at. %
GNP 92.4 7.6
Graphite 91.7 8.3
GO 78.3 21.7

Physical-chemical properties and biocompatibility of PLA/GBMs composites – Production by solvent-mixing
Artur M. Pinto – Jan 2017 161
Table 6.3: Atomic composition analysis by XPS of the surface of PLA, PLA/GO and PLA/GNP
films. Results are presented as mean and standard deviation (in parenthesis) for n = 3.
Sample C 1s / at. % O 1s / at. %
PLA 62.1 (2.36) 37.9 (2.36)
PLA/GNP 63.7 (2.73) 37.8 (2.63)
PLA/GO 61.7 (0.74) 38.3 (0.74)
6.4.3 Wettability of the films surface
Contact angle measurements (Table 6.4) show that the water contact angle of PLA/GO films
decreased about 9° comparing with pristine PLA films. This shows that the presence of GO at the
film surface increases its hydrophilicity. Hydrogen bond interactions between oxygen-containing
groups in GO and water can explain this behavior. Hexadecane completely wetted the surface of
PLA/GO films (Figure 6.5(E)), while at the surface of pristine PLA films it presented a contact
angle close to 27°. Hydrophobic interactions with hexadecane might be established with the
honeycomb sp2 carbon atoms. This suggests that the presence of GO particles induces an
amphiphilic behavior of the surface.
Table 6.4: Contact angles at 60 s of H2O, ethane-1,2-diol and hexadecane on PLA, PLA/GO
and PLA/GNP films. Results are presented as mean and standard deviation (in parenthesis)
for n = 3.
Samples
Contact angles / ⁰
H2O Ethane-1,2-
diol Hexadecane
PLA 87.2 (0.36) 56.9 (2.14) 26.7 (3.37)
PLA/GO 78.1 (2.06) 55.2 (3.38) 0 (0.00)
PLA/GNP 89.6 (0.97) 65.3 (0.94) 0 (0.00)

Chapter 6
162 Artur M. Pinto – Jan 2017
Figure 6.5: Contact angle images for: A – water on PLA, B – ethane-1,2-diol on PLA, C –
hexadecane on PLA, D – hexadecane on PLA/GO and E – hexadecane on PLA/GNP film
surface.
The water contact angle of PLA/GNP film increased 2.3°, comparing to pristine PLA films,
showing a small hydrophobic effect. As occurred for PLA/GO films, hexadecane completely
wetted the surface of PLA/GNP films (Fig. 6.5(D)). However, the contact angle for ethane-1,2-
diol increased, probably due to the presence of much less oxygen functional groups in GNP
particles than in GO sheets at the film surface.
All the above-mentioned findings suggest that the presence of the fillers at the film surface,
despite not changing the surface composition significantly (shown in Section 6.4.2), affect its
wettability. This might occur because of direct interaction of the liquids with partially exposed
fillers at the PLA surface. Wang and co-workers measured water contact angles on poly(vinyl
alcohol)/graphene dry films and observed that 0.5 wt.% graphene loading increased the contact
angle from 36° to 93°. [41]
Figure 4.6 shows surface free energy values computed from the contact angle measurements. The
total surface free energy of PLA increases about 12% with the incorporation of 0.4 wt.% GO.
However, for the same incorporated amount of GNP, no changes are observed. Additionally, as
expected, the polar component of PLA films increases about 59% with addition of GO and
decreases 56% with incorporation of GNP. These results are in accordance with the discussion
presented above for the contact angles.

Physical-chemical properties and biocompatibility of PLA/GBMs composites – Production by solvent-mixing
Artur M. Pinto – Jan 2017 163
Figure 6.6: Dispersive and polar components of the total surface free energy of PLA,
PLA/GO and PLA/GNP films.
6.4.4 In vitro biocompatibility assessment
In order to evaluate the cytotoxicity of the films, we have studied the effects of these materials in
a mouse embryo fibroblast culture, namely in terms of cell adhesion and proliferation on the
films, morphological features and cell death.
After 24 h of culture, fibroblasts adhesion and proliferation on the PLA/GO films (CPII ca. 17%)
was significantly higher than for pristine PLA (CPII ca. 31%) ones (p < 0.05) (Figure 6.7). This
can be due to the presence of GO at the surface increasing its hydrophilicity or creating a more
suitable surface morphology for protein adsorption and cell adhesion. Higher surface
hydrophilicity favors vitronectin adhesion and allows the maintenance of fibronectin
functionality. Furthermore, cell proliferation requires the reorganization of surface-adsorbed
fibronectin, which occurs in hydrophilic surfaces and is often impaired in more hydrophobic
surfaces. Increase in surface roughness may lead to higher fibronectin adsorption due to the
increase of surface area. Interestingly, Ruiz et al. [28] observed that mammalian colorectal
adenocarcinoma HT-29 cells attached and proliferated more efficiently in GO coated glass slides,
than in control (glass slides). After 48 and 72 h, the proliferation rate at the surface of PLA/GO

Chapter 6
164 Artur M. Pinto – Jan 2017
films seems to decrease and no significant differences are observed comparing to PLA films
(p > 0.05). Also, no significant differences (p > 0.05) are observed in CPII between PLA and
PLA/GO comparing to PLA/GNP films, until 72 h. Thus, the presence of GNP at films surface
does not seem to affect cell adhesion and proliferation.
Figure 6.7: Cell proliferation inhibition index for mouse embryo fibroblasts, cultured on
PLA, PLA/GO and PLA/GNP films. Results are presented as mean and error bars
represent SD. *Significantly different (p < 0.05).
Yoon et al. [42] reported that the proliferation and viability of neuronal cells (PC 12) on poly(d,l-
lactic-co-glycolic acid) [PLGA]/GO (2 wt.%) nanocomposite scaffolds increased by 8% in
comparison to pristine PLGA scaffolds. However, Lahiri et al. [25], showed that the viability of
osteoblasts (ATCC, Manassas, VA, USA) grown at the surface of ultra-high molecular weight
poly (ethylene)–GNP nanocomposite films (0.1 wt.%) decreased about 6, 14 and 17% comparing
to pristine polymer after, respectively, 1, 3 and 5 days of incubation.
The cytotoxicity of the films was also assessed using a direct contact method. For that purpose,
the films were used together with a positive and negative control (latex rubber and agar,
respectively). Each sample was placed on top of a sub-confluent cellular layer on a six-well plate,
as described in the material and methods section.
Figure 6.8 shows the results obtained with the fluorescence labeling of the cell layers. As
expected, the latex rubber is cytotoxic. Thus, the majority of cells were floating in the medium
and some of those that remained attached were also dead (red labeled – Fig. 6.8(B)). No
differences in morphology were found for the cells on the films surface and on the negative

Physical-chemical properties and biocompatibility of PLA/GBMs composites – Production by solvent-mixing
Artur M. Pinto – Jan 2017 165
control (agar – Fig. 6.8(A)). Moreover, all of the cells remained alive, as shown by the green
fluorescence (Fig. 6.8(A, C–F)). These results suggest that films can be considered non-toxic.
Figure 6.8: Fluorescence microscopy of mouse embryo fibroblasts after 48 h incubation in
the direct contact assay: A – Agar (negative control); B – positive control (latex rubber); C
and D – PLA; E – PLA/GO and F – PLA/GNP.
6.4.5 Platelet adhesion and activation
Since PLA is a biomaterial commonly used in surgery (e.g. orthopedy, dental medicine, hernia
repair meshes), it should present low thrombogenicity in order to prevent the formation of post-
operative blood cloths. [5] Adhesion and activation of platelets at the surface of PLA, PLA/GO
and PLA/GNP films were evaluated by counting and qualitative observation of morphological
features using SEM (see Section 6.3.6.4). To evaluate the effect of serum proteins on platelet

Chapter 6
166 Artur M. Pinto – Jan 2017
adhesion and activation the samples were pre-immersed either in PBS or human plasma
1%. Figure 6.9 shows that significantly less (p < 0.05) platelets adhered to PLA and PLA/GNP
when samples were previously treated with human plasma comparing to those pre-immersed in
PBS. This may occur due to adsorption of non-thrombogenic proteins, such as albumin, at the
surface of the films preventing platelet adhesion. Moreover, when in presence of plasma proteins,
the number of activated platelets in PLA/GNP films is significantly lower (p < 0.05) than that in
PLA and PLA/GO films (Figure 6.9 and 6.10). This can be explained by the presence of
hydrophobic GNP (see Section 6.4.3) at the surface of the films, favoring protein adsorption at the
material surface. This blocks platelet activation in case of these proteins being albumin, which is
generally the first to adhere because of its abundance in plasma and its small size. [44]
A decrease of platelet adhesion and activation after pre immersion in plasma has been previously
described for surfaces that preferentially adsorb albumin over other plasma proteins. [45, 46] Also,
Koh et al. observed decreases in platelet adhesion and activation in (PLGA) poly(lactic-co-
glycolic-acid) films pre-immersed in fibrinogen and non-stimulated rich plasma, whose surface
was coated with multi-walled nanotubes, comparing to PLGA films without MWCNTs at the
surface.

Physical-chemical properties and biocompatibility of PLA/GBMs composites – Production by solvent-mixing
Artur M. Pinto – Jan 2017 167
Figure 6.9: Platelet adhesion on PLA, PLA/GO and PLA/GNP films surface, pre-immersed
in PBS or plasma. Degree of activation of the platelets adhered to the surface of the films
pre-immersed in PBS or in plasma. A – activated, NA – non activated. Results are presented
as mean and error bars represent standard deviation. *Significantly different (p < 0.05).
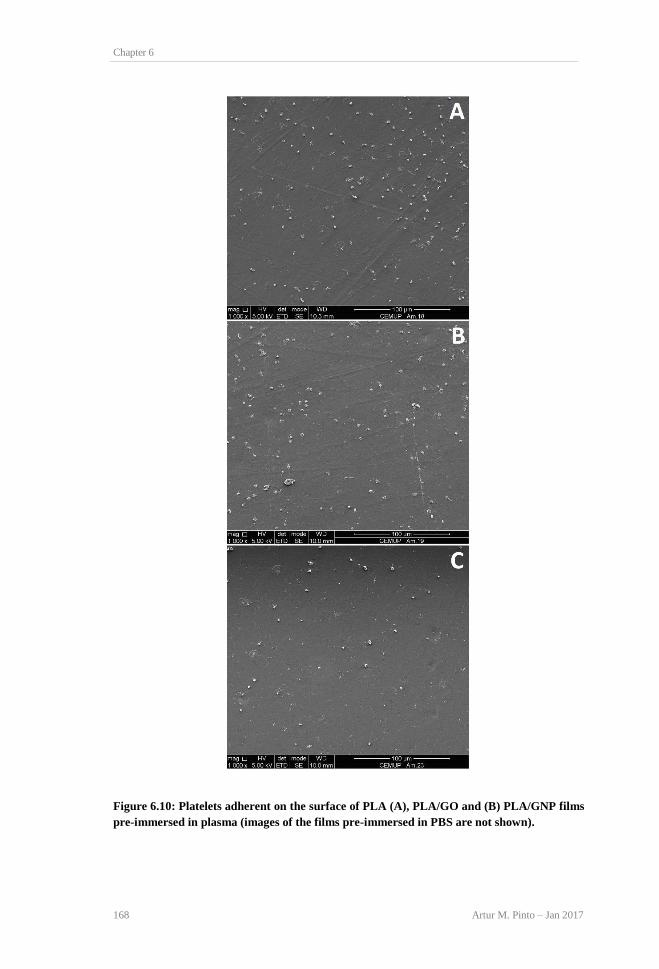
Chapter 6
168 Artur M. Pinto – Jan 2017
Figure 6.10: Platelets adherent on the surface of PLA (A), PLA/GO and (B) PLA/GNP films
pre-immersed in plasma (images of the films pre-immersed in PBS are not shown).

Physical-chemical properties and biocompatibility of PLA/GBMs composites – Production by solvent-mixing
Artur M. Pinto – Jan 2017 169
6.5 Conclusions
Incorporation of 0.4 wt.% loadings of GO and GNP changed the surface topography and
wettability of PLA composite films. However, no considerable variation in cell proliferation
at the surface of the films was observed, except for those containing GO after 24 h
incubation, which presented a CPII inferior to pristine PLA films (p < 0.05).
The presence of GO on the films surface may favor cell adhesion and proliferation due to
creation of a more suitable surface morphology or to the increase in surface hydrophilicity.
In the direct contact assay differences in morphology were not found for cells on the films
surfaces or on the negative control (agar) surfaces. Moreover, all cells remained alive. Thus,
it can be concluded that the films showed no cytotoxicity.
The number of activated platelets in PLA/GNP films is significantly lower than for pristine
PLA films (p < 0.05) in the presence of plasma.
These results indicate that small amounts of GO and GNP can be safely incorporated in PLA
to improve its mechanical properties for biomedical applications. Additionally, GO has
apparently a positive effect on cell adhesion and proliferation, leading to faster tissue
regeneration. GNP incorporation, on the other hand, decreases thrombogenicity, which might
reduce post operative complications caused by blood clots formation.
Chapter 6
170 Artur M. Pinto – Jan 2017
6.6 References
1. R.E. Drumright, P.R. Gruber, D.E. Henton, Polylactic acid technology, Adv Mater 12
(2000) 1841-1846.
2. H. Tian, Z. Tang, X. Zhuang, X. Chen, X. Jing, Biodegradable synthetic polymers:
Preparation, functionalization and biomedical application, Prog Polym Sci 37 (2012)
237-280.
3. S. Ramakrishna, J. Mayer, E. Wintermantel, K.W. Leong, Biomedical applications of
polymer-composite materials: A review, Compos Sci Technol 61 (2001) 1189-1224.
4. I. Armentano, M. Dottori, E. Fortunati, S. Mattioli, J.M. Kenny, Biodegradable polymer
matrix nanocomposites for tissue engineering: A review, Polymer Degrad Stab 95
(2010) 2126-2146.
5. B.D. Ratner, A.S. Hoffman, F. Schoen, J. Lemons, Biomaterials Science: an
introduction to materials in medicine, third ed., Academic Press, 2012.
6. L. Cabedo, J.L. Feijoo, M.P. Villanueva, J.M. Lagarón, E. Giménez, Optimization of
biodegradable nanocomposites based on aPLA/PCL blends for food packaging
applications, Macromol Symp 233 (2006) 191-197.
7. S.D. Park, M. Todo, K. Arakawa, M. Koganemaru, Effect of crystallinity and loading-
rate on mode i fracture behavior of poly(lactic acid), Polymer 47 (2006) 1357-1363.
8. M. Murariu, A. Da Silva Ferreira, M. Pluta, L. Bonnaud, M. Alexandre, P. Dubois,
Polylactide (PLA)-CaSO4 composites toughened with low molecular weight and
polymeric ester-like plasticizers and related performances, Eur Polym J 44 (2008) 3842-
3852.
9. J.H. Chang, Y.U. An, G.S. Sur, Poly(lactic acid) nanocomposites with various
organoclays. I. Thermomechanical properties, morphology, and gas permeability, J
Polym Sci Part B: Polym Phys 41 (2003) 94-103.
10. C.S. Wu, H.T. Liao, Study on the preparation and characterization of biodegradable
polylactide/multi-walled carbon nanotubes nanocomposites, Polymer 48 (2007) 4449-
4458.
11. V. Mittal, Polymer layered silicate nanocomposites: A review, Materials 2 (2009) 992-
1057.
12. H. Kim, A.A. Abdala, C.W. Macosko, Graphene/polymer nanocomposites,
Macromolecules 43 (2010) 6515-6530.
13. A.M. Pinto, J. Martins, J.A. Moreira, A.M. Mendes, F.D. Magalhães, Dispersion of
graphene nanoplatelets in PVAc latex and effect on adhesive bond strength, Polym Int
62 (2013) 928-935.
14. D.R. Dreyer, S. Park, C.W. Bielawski, R.S. Ruoff, The chemistry of graphene oxide,
Chem Soc Rev 39 (2010) 228-240.
15. L. Zhang, J. Xia, Q. Zhao, L. Liu, Z. Zhang, Functional graphene oxide as a nanocarrier
for controlled loading and targeted delivery of mixed anticancer drugs, Small 6 (2010)
537-544.
16. K. Yang, S. Zhang, G. Zhang, X. Sun, S.T. Lee, Z. Liu, Graphene in mice: Ultrahigh in
vivo tumor uptake and efficient photothermal therapy, Nano Lett 10 (2010) 3318-3323.
17. A. Kumari, S.K. Yadav, S.C. Yadav, Biodegradable polymeric nanoparticles based drug
delivery systems, Colloid Surface B 75 (2010) 1-18.
18. H. Bai, C. Li, G. Shi, Functional composite materials based on chemically converted
graphene, Adv Mater 23 (2011) 1089-1115.
19. Marin Pumera, Electrochemistry of gaphene: New horizons for sensing and energy
storage, Chem Rec 9 (2009) 211-223.
20. M. Kalbacova, A. Broz, J. Kong, M. Kalbac, Graphene substrates promote adherence of
human osteoblasts and mesenchymal stromal cells, Carbon 48 (2010) 4323-4329.
21. Y. Wang, Z. Li, J. Wang, J. Li, Y. Lin, Graphene and graphene oxide:
Biofunctionalization and applications in biotechnology, Trends Biotechnol 29 (2011)
205-212.

Physical-chemical properties and biocompatibility of PLA/GBMs composites – Production by solvent-mixing
Artur M. Pinto – Jan 2017 171
22. X. Zhang, J. Yin, C. Peng, W. Hu, Z. Zhu, W. Li, C. Fan, Q. Huang, Distribution and
biocompatibility studies of graphene oxide in mice after intravenous administration,
Carbon 49 (2011) 986-995.
23. Y. Chang, S.T. Yang, J.H. Liu, E. Dong, Y. Wang, A. Cao, Y. Liu, H. Wang, In vitro
toxicity evaluation of graphene oxide on A549 cells, Toxicol Lett 200 (2011) 201-210.
24. P. Begum, R. Ikhtiari, B. Fugetsu, Graphene phytotoxicity in the seedling stage of
cabbage, tomato, red spinach, and lettuce, Carbon 49 (2011) 3907-3919.
25. D. Lahiri, R. Dua, C. Zhang, I. De Socarraz-Novoa, A. Bhat, S. Ramaswamy, A.
Agarwal, Graphene nanoplatelet-induced strengthening of ultrahigh molecular weight
polyethylene and biocompatibility in vitro, Acs Appl Mater Inter 4 (2012) 2234-2241.
26. M. Wojtoniszak, X. Chen, R.J. Kalenczuk, A. Wajda, J. Łapczuk, M. Kurzewski, M.
Drozdzik, P.K. Chu, E. Borowiak-Palen, Synthesis, dispersion, and cytocompatibility of
graphene oxide and reduced graphene oxide, Colloid Surface B 89 (2012) 79-85.
27. J. Wang, P. Sun, Y. Bao, J. Liu, L. An, Cytotoxicity of single-walled carbon nanotubes
on PC12 cells, Toxicol Vitro 25 (2011) 242-250.
28. O.N. Ruiz, K.A.S. Fernando, B. Wang, N.A. Brown, P.G. Luo, N.D. McNamara, M.
Vangsness, Y.P. Sun, C.E. Bunker, Graphene oxide: a nonspecific enhancer of cellular
growth, ACS Nano 5 (2011) 8100-8107.
29. Y. Pan, T. Wu, H. Bao, L. Li, Green fabrication of chitosan films reinforced with
parallel aligned graphene oxide, Carbohydr Polym 83 (2011) 1908-1915.
30. P. Song, Z. Cao, Y. Cai, L. Zhao, Z. Fang, S. Fu, Fabrication of exfoliated graphene-
based polypropylene nanocomposites with enhanced mechanical and thermal properties,
Polymer 52 (2011) 4001-4010.
31. Y. Cao, J. Feng, P. Wu, Preparation of organically dispersible graphene nanosheet
powders through a lyophilization method and their poly(lactic acid) composites, Carbon
48 (2010) 3834-3839.
32. S.C. Tjong, Editorial corner - a personal view Graphene and its derivatives: Novel
materials for forming functional polymer nanocomposites, Express Polym Lett 6 (2012)
437.
33. C.J. Wilson, R.E. Clegg, D.I. Leavesley, M.J. Pearcy, Mediation of biomaterial-cell
interactions by adsorbed proteins: A review, Tissue Eng 11 (2005) 1-18.
34. L.B. Koh, I. Rodriguez, J.J. Zhou, Platelet adhesion studies on nanostructured
poly(lactic-co-glycolic-acid)–carbon nanotube composite, J Biomed Mater Res A 86 A
(2008) 394-401.
35. A.M. Pinto, J. Cabral, D.A.P. Tanaka, A.M. Mendes, F.D. Magalhães, Effect of
incorporation of graphene oxide and graphene nanoplatelets on mechanical and gas
permeability properties of poly(lactic acid) films, Polym Int 62 (2013) 33-40.
36. H. Fukushima, Graphite nanoreinforcements in polymer nanocomposites, Ph.D. Thesis,
Michigan State University, 2003.
37. K. Kalaitzidou, H. Fukushima, L.T. Drzal, Mechanical properties and morphological
characterization of exfoliated graphite-polypropylene nanocomposites, Compos Part a-
Appl S 38 (2007) 1675-1682.
38. D. Tanaka, A.M. Mendes, Composite graphene-metal oxide platelet method of
preparation and applications, International Patent No. PCT/IB2010/055598, 2010.
39. E.S. Gadelmawla, M.M. Koura, T.M.A. Maksoud, I.M. Elewa, H.H. Soliman,
Roughness parameters, J Mater Process Technol 123 (2002) 133-145.
40. M. Sedlaček, B. Podgornik, J. Vižintin, Correlation between standard roughness
parameters skewness and kurtosis and tribological behaviour of contact surfaces, Tribol
Int 48 (2012) 102-112.
41. J. Wang, X. Wang, C. Xu, M. Zhang, X. Shang, Preparation of graphene/poly(vinyl
alcohol) nanocomposites with enhanced mechanical properties and water resistance,
Polym Int 60 (2011) 816-822.
42. O.J. Yoon, C.Y. Jung, I.Y. Sohn, H.J. Kim, B. Hong, M.S. Jhon, N.E. Lee,
Nanocomposite nanofibers of poly(d, l-lactic-co-glycolic acid) and graphene oxide
nanosheets, Compos Part a-Appl S 42 (2011) 1978-1984.
Chapter 6
172 Artur M. Pinto – Jan 2017
43. A.C. Vieira, J.C. Vieira, J.M. Ferra, F.D. Magalhães, R.M. Guedes, A.T. Marques,
Mechanical study of PLA-PCL fibers during in vitro degradation, J Mech Behav
Biomed Mater 4 (2011) 451-460.
44. L. Vroman, A.L. Adams, Identification of adsorbed protein films by exposure to
antisera and water vapor, J Biomed Mater Res 3 (1969) 669-671.
45. I.C. Gonçalves, M.C.L. Martins, J.N. Barbosa, P. Oliveira, M.A. Barbosa, B.D. Ratner,
Platelet and leukocyte adhesion to albumin binding self-assembled monolayers, J Mater
Sci-Mater Med 22 (2011) 2053-2063.
46. I.C. Gonçalves, M.C.L. Martins, M.A. Barbosa, E. Naeemi, B.D. Ratner, Selective
protein adsorption modulates platelet adhesion and activation to oligo(ethylene glycol)-
terminated self-assembled monolayers with C18 ligands, J Biomed Mater Res Part A 89
(2009) 642-653.

Physical-chemical properties and biocompatibility of PLA/GBMs composites – production by melt-blending
Artur M. Pinto – Jan 2017 173
Chapter 7
Physical-chemical properties and
biocompatibility of PLA/GBMs
composites:
Production by melt-blending
This chapter was based in the following published paper:
Chapter 7
174 Artur M. Pinto – Jan 2017
Physical-chemical properties and biocompatibility of PLA/GBMs composites – production by melt-blending
Artur M. Pinto – Jan 2017 175
7 PHYSICAL-CHEMICAL PROPERTIES AND
BIOCOMPATIBILITY OF PLA/GBMS
COMPOSITES - PRODUCTION BY MELT-
BLENDING
7.1 Scope
Melt-blending is a commonly used method for polymer processing and fillers incorporation in
polymer matrices. Comparing with solvent mixing followed by doctor blading, this method
presents the advantage of not requiring the use of potentially toxic solvents. As mentioned in the
previous chapter, there is the need to improve PLA mechanical properties for biomedical
applications, as for example orthopaedical uses. In this chapter, graphene nanoplatelets are
investigated as reinforcement filler for PLA. The parameters for production of PLA/GNP
composites by melt-blending were optimized regarding mechanical performance, namely the
effect of varying filler loading, mixing temperature, time, and intensity. Electron microscopy
observations and Raman spectroscopy studies were used to understand why changing those
variables affect mechanical properties. The biocompatibility of the composites was studied using
human fibroblasts as an in vitro model.
7.2 State of the art
The biointeractions of graphene-based materials depend on their physico-chemical properties. In
the last two decades, polymer composites have been studied as a strategy to provide added value
properties to neat polymer without sacrificing its processability or adding excessive weight.
Particular attention has been given to reinforcement with nanosized materials, which have the
potential to present improved or even new properties when compared to conventional filled
polymers. [1]

Chapter 7
176 Artur M. Pinto – Jan 2017
Poly(lactic acid) (PLA) has great worldwide demand due to versatile applicability in packaging,
pharmaceutical, textiles, automotive, biomedical, and tissue engineering. [2] It has been widely
investigated for biomedical applications due to its biodegradability, bioresorbability, and
biocompatibility. [3, 4] Several applications have been described in tissue and surgical implant
engineering, for production of bioresorbable artificial ligaments, hernia repair meshes, scaffolds,
screws, surgical plates, and suture yarns. [5] PLA is also used in production of nano/microcapsules
for drug delivery, and in packaging of pharmaceutical products. [6] Improvement and tuning of its
properties has been reported by incorporation of plasticizers, blending with other polymers, and
addition of nanofillers. [7-9]
Carbon-based fillers offer the potential to combine several unique properties, such as mechanical
strength, electrical conductivity, thermal stability, and physical and optical properties, required for
a spectrum of applications. [10-12] Graphene, in particular, has been playing a key role in modern
science and technology. Its remarkable properties and the natural abundance of its precursor,
graphite, make it an interesting option for production of functional composites. [13] Graphene is a
one-atom-thick planar sheet of sp2-bonded carbon atoms densely packed in a honeycomb crystal
lattice. It possesses very high mechanical strength, surface area per unit mass, and thermal and
electrical conductivities. In the last years, there has been a surge in research work involving this
material, with reported applications in diverse fields, including biomedical engineering and
biotechnology. [14-20] On the other hand, not many studies are yet available concerning
biocompatibility of graphene and graphene-based materials (GBM). These often show
contradictory results. [21-26] In our recent study, graphene nanoplatelets with smaller size (GNP-C)
revealed to be biocompatible with human fibroblasts (HFF-1) until a concentration of 50 μg mL−1,
opposing to larger GNP-M, which are toxic above 20 μg mL−1. [27] Since several authors have
shown that effective reinforcement of polymeric matrices can be obtained with small loadings of
GBM [28-32], toxic concentrations achievement can be prevented. Additionally, graphene oxide
(GO) and graphene nanoplatelets (GNP), grade M (GNP-M), have shown not to affect mouse
embryo fibroblasts metabolic activity when incorporated in PLA at a loading of 0.4 wt.%. [33]
Many graphene-related materials have been reported in literature as potentially interesting fillers
for polymer reinforcement. One commercial product that has been receiving particular attention,
and is the object of study in this paper, is GNP: stacks of few graphene layers obtained by rapid
heating of intercalated graphite. The platelets surface consists of mostly defect-free graphene,
while oxygen is present in the sheet edges, in the form of, for instance, hydroxyl or carboxyl
groups. Even though different grades are available for this material, grade M, with average
platelet thickness of 6–8 nm and maximum length of 5 μm, is the most often tested in the
available literature. [31]

Physical-chemical properties and biocompatibility of PLA/GBMs composites – production by melt-blending
Artur M. Pinto – Jan 2017 177
Several studies exist on reinforcement of PLA with GBM. Even though performance
improvements are reported, quantitative results are usually distinct, owing mainly to differences
in chemical and morphological nature of GBM, filler incorporation and processing methods, and
filler loadings. Cao et al. observed an 18% increase in Young's modulus with addition of only 0.2
wt.% of reduced graphene oxide. [30] The composite was prepared by solution mixing, followed
by flocculation and drying. Pinto et al. showed that small loadings of GO and GNP-M (0.4 wt.%)
in PLA thin films produced by solvent evaporation significantly improved mechanical and gas
permeation barrier properties. [31] Tensile strength and Young's modulus were increased by about
15% and 85%, respectively. Chieng et al. investigated PLA/PEG melt blends with GNP-M
loadings of 0.3 wt.%, obtaining increases of 33%, 69%, and 22% in tensile strength, Young's
modulus, and elongation at break. [34] Bao et al. prepared PLA/graphene composites by melt
blending and observed 58% improvement in storage modulus at 0.2 wt.% loading. [35] Yang et al.
prepared poly(l-lactic acid) (PLLA)/thermally reduced graphene oxide composites via in situ ring-
opening polymerization of lactide. The composite materials obtained, with loadings up to 2 wt.%,
showed improved thermal stability, electrical conductivity, and crystallization rate. [36] In the
work of Kim and Jeong, exfoliated graphite was incorporated in PLLA at different loadings by
melt blending. [37] At 2 wt.% loading, tensile strength increased by about 13% and Young's
modulus by 33%. Wenxiao et al. studied PLLA composites containing different low-dimensional
carbonaceous fillers, with constant filler content of 0.5 wt.%. The fillers were pristine and
silanized multiwalled carbon nanotubes (MWNTs) and exfoliated graphene. [38] All composites
were prepared by solution mixing. It was found that tensile strength, elongation at break, and
Young's modulus showed similar improvements when using carbon nanotubes or graphene (about
20%, 39%, and 33%, respectively). Silane modification of both fillers further improved
elongation at break and Young's modulus, without sacrificing tensile strength. More recently,
Wenxiao et al. successfully grafted GO with PLLA by in situ polycondensation. [39] This material
was incorporated in PLLA by solution mixing, and the composite with 0.5 wt.% loading showed
improvements in flexural and tensile strengths of 114% and 106%, respectively.
In this study, a recently made available commercial grade of GNP (grade C), made of thinner and
shorter platelets than existing grades, is investigated for the first time as reinforcement filler for
PLA. Melt blending is used for preparing the composite material as this is an economically
attractive and industrially scalable method for efficiently dispersing nanofillers in thermoplastic
polymers. The effects of blending conditions (mixing time, intensity, and temperature) and filler
loading on the composite properties are analyzed, and the best conditions identified. This is an
important aspect since results are often dependent on processing conditions, and this type of
analysis is often absent from the literature. Melt blending is an environmentally friendly method

Chapter 7
178 Artur M. Pinto – Jan 2017
for filler incorporation that does not involve use of solvents. It avoids concerns with human health
during processing and with toxicity of remaining solvent residues.
The quality of filler dispersion in the PLA matrix is investigated by SEM and Raman
spectroscopy, and is seen to have a major influence on mechanical properties. For the first time,
the biocompatibility of PLA/GNP-C composites is studied, namely, in terms of effects on cell
metabolic activity and morphology.
7.3 Materials and methods
7.3.1 Materials
Poly(lactic acid) (PLA) 2003D (4% d-lactide, 96% l-lactide content) was purchased from
Natureworks (Minnetonka, USA).
GNP, grade C750 (GNP-C), was acquired from XG Sciences (Lansing, USA), with the following
characteristics, according to the manufacturer: average thickness lower than 2 nm and surface area
of 750 m2g−1. The platelet diameters have a distribution that ranges from tenths of micrometer up
to 1–2 μm. GNP production is based on exfoliation of sulphuric acid-based intercalated graphite
by rapid microwave heating, followed by ultrasonic treatment. [64]
7.3.2 Preparation of PLA/GNP composites
The PLA/GNP composites were prepared by melt blending in a Thermo Haake Polylab internal
mixer (internal mixing volume 60 cm3) at different temperatures (180, 200, 225, and 250 °C)
mixing times (10, 15, and 20 min) and rotor speeds (25, 50, and 75 rpm). The GNP contents
tested were 0.1, 0.25, and 0.5 wt.%. After removal from the mixer, the composites were molded
in a hot press at 190°C for 2 min, under a pressure of 150 kg cm-2, into sheets with approximately
0.5 mm thickness. After pressing, the sheets were rapidly cooled in water at room temperature.
Samples with different dimensions were cut from these sheets, depending on the characterization
test.
7.3.3 X-ray photoelectron spectroscopy (XPS)
GNP-C powder was analyzed with an Escalab 200 VG Scientific spectrometer working in
ultrahigh vacuum (1 × 10⁻⁶ Pa) and using achromatic Al Kα radiation (1486.6 eV). The analyzer
pass energy was 50 eV for survey spectra and 20 eV for high-resolution spectra. The spectrometer

Physical-chemical properties and biocompatibility of PLA/GBMs composites – production by melt-blending
Artur M. Pinto – Jan 2017 179
was calibrated using (Au 3d5/2 at 368.27 eV). The core levels for O 1s and C 1s were analyzed.
The photoelectron takeoff angle (the angle between the surface of the sample and the axis of the
energy analyzer) was 90°. The electron gun focused on the specimen in an area close to 100 mm2.
7.3.4 Fourier transform Infrared Spectroscopy (FTIR)
PLA and PLA/GNP-C FTIR spectra were obtained between 600 and 4000 cm−1, with 100 scans
and a resolution of 4 cm−1, using a spectrometer ABB MB3000 (ABB, Switzerland) equipped
with a deuterated triglycine sulphate detector and using a MIRacle single reflection horizontal
attenuated total reflectance (ATR) accessory (PIKE Technologies, USA) with a diamond/Se
crystal plate.
7.3.5 Tensile properties
Tensile properties of the composites (dimensions of 60 × 15 mm, thickness of 300–500 μm) were
measured using a Mecmesin Multitest-1d motorized test frame, at room temperature. Loadings
were recorded with a Mecmesin BF 1000N digital dynamometer at a strain rate of 10 mm min−1.
The test parameters were in agreement with ASTM D 882-02. At least 10 samples were tested for
each composite.
7.3.6 Thermal analysis
Glass transition temperatures (Tg) and melting temperatures (Tm) of samples were determined
with a Setaram DSC 131 device. The thermograms were recorded between 30 and 200 °C at a
heating range of 10°C min−1 under nitrogen flow. Only the second heating thermograms were
collected. Sample amounts ranged from 10 to 12 mg.
Thermal stability of samples was determined with a Netzsh STA 449 F3 Jupiter simultaneous
thermal analysis device. Sample amounts ranged from 10 to 12 mg. The thermograms were
recorded between 25 and 800 °C at a heating rate of 10°C min−1 under nitrogen flow.
The degree of crystallinity was determined as follows: , where
ΔHc is the cold crystallization enthalpy, ΔHm is the melting enthalpy, and Δ is the melting
enthalpy of purely crystalline poly(l-lactide). [65]
Chapter 7
180 Artur M. Pinto – Jan 2017
7.3.7 Scanning Electron Microscopy (SEM)
The morphology of the PLA/GNP composites was observed using SEM (FEI Quanta 400FEG,
with acceleration voltage of 3 kV) at Centro de Materiais da Universidade do Porto. Composites
selected for SEM analysis were fractured transversely under liquid nitrogen, applied on carbon
tape, and sputtered with Au/Pa (10 nm film). The number of agglomerates per unit of area (mm2)
as a function of agglomerate length, for different GNP-C loadings, was evaluated by direct
measurements from 5 SEM images collected for each material, using ImageJ 1.45 software.
7.3.8 Raman spectroscopy
The unpolarized Raman spectra of GNP-C powder, PLA, and PLA/GNP-C composites were
obtained under ambient conditions, in several positions for each sample. The linear polarized
514.5 nm line of an Ar+ laser was used as excitation. The Raman spectra were recorded in a
backscattering geometry by using a confocal Olympus BH-2 microscope with a 50× objective in a
volume of 10 μm3. The spatial resolution is about 2 μm. The laser power was kept below 15 mW
on the sample to avoid heating. The scattered radiation was analyzed using a Jobin–Yvon T64000
triple spectrometer, equipped with a charge-coupled device. The spectral resolution was better
than 4 cm−1.
The spectra were quantitatively analyzed by fitting a sum of damped oscillator to the experimental
data, according to the equation [66]:
(1)
N
j ojoj
ojoj
ojATnBTI1
22222
2
)()),(1()(),(
Here n(ω,T) is the Bose-Einstein factor: Aoj, Ωoj, and τoj are the strength, wave number, and
damping coefficient of the jth oscillator, respectively, and B(ω) is the background. In this work,
the background was well simulated by a linear function of the frequency, which enables us to
obtain reliable fits of Eq. (1) to the experimental data.
The fitting procedure was performed for all Raman bands collected from the same sample, but in
different positions. This procedure allows us to determine the average and standard deviation
(SD) values of the phonon parameters, namely, the wave number and intensity.
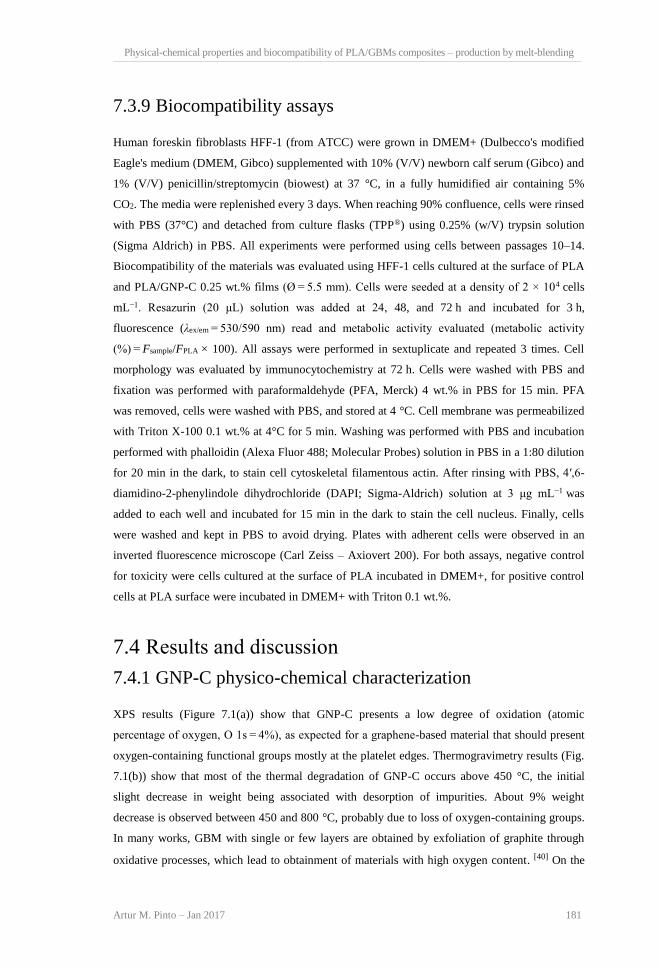
Physical-chemical properties and biocompatibility of PLA/GBMs composites – production by melt-blending
Artur M. Pinto – Jan 2017 181
7.3.9 Biocompatibility assays
Human foreskin fibroblasts HFF-1 (from ATCC) were grown in DMEM+ (Dulbecco's modified
Eagle's medium (DMEM, Gibco) supplemented with 10% (V/V) newborn calf serum (Gibco) and
1% (V/V) penicillin/streptomycin (biowest) at 37 °C, in a fully humidified air containing 5%
CO2. The media were replenished every 3 days. When reaching 90% confluence, cells were rinsed
with PBS (37°C) and detached from culture flasks (TPP®) using 0.25% (w/V) trypsin solution
(Sigma Aldrich) in PBS. All experiments were performed using cells between passages 10–14.
Biocompatibility of the materials was evaluated using HFF-1 cells cultured at the surface of PLA
and PLA/GNP-C 0.25 wt.% films (Ø = 5.5 mm). Cells were seeded at a density of 2 × 10⁴ cells
mL−1. Resazurin (20 μL) solution was added at 24, 48, and 72 h and incubated for 3 h,
fluorescence (λex/em = 530/590 nm) read and metabolic activity evaluated (metabolic activity
(%) = Fsample/FPLA × 100). All assays were performed in sextuplicate and repeated 3 times. Cell
morphology was evaluated by immunocytochemistry at 72 h. Cells were washed with PBS and
fixation was performed with paraformaldehyde (PFA, Merck) 4 wt.% in PBS for 15 min. PFA
was removed, cells were washed with PBS, and stored at 4 °C. Cell membrane was permeabilized
with Triton X-100 0.1 wt.% at 4°C for 5 min. Washing was performed with PBS and incubation
performed with phalloidin (Alexa Fluor 488; Molecular Probes) solution in PBS in a 1:80 dilution
for 20 min in the dark, to stain cell cytoskeletal filamentous actin. After rinsing with PBS, 4′,6-
diamidino-2-phenylindole dihydrochloride (DAPI; Sigma-Aldrich) solution at 3 μg mL−1 was
added to each well and incubated for 15 min in the dark to stain the cell nucleus. Finally, cells
were washed and kept in PBS to avoid drying. Plates with adherent cells were observed in an
inverted fluorescence microscope (Carl Zeiss – Axiovert 200). For both assays, negative control
for toxicity were cells cultured at the surface of PLA incubated in DMEM+, for positive control
cells at PLA surface were incubated in DMEM+ with Triton 0.1 wt.%.
7.4 Results and discussion
7.4.1 GNP-C physico-chemical characterization
XPS results (Figure 7.1(a)) show that GNP-C presents a low degree of oxidation (atomic
percentage of oxygen, O 1s = 4%), as expected for a graphene-based material that should present
oxygen-containing functional groups mostly at the platelet edges. Thermogravimetry results (Fig.
7.1(b)) show that most of the thermal degradation of GNP-C occurs above 450 °C, the initial
slight decrease in weight being associated with desorption of impurities. About 9% weight
decrease is observed between 450 and 800 °C, probably due to loss of oxygen-containing groups.
In many works, GBM with single or few layers are obtained by exfoliation of graphite through
oxidative processes, which lead to obtainment of materials with high oxygen content. [40] On the

Chapter 7
182 Artur M. Pinto – Jan 2017
other hand, GNP-C is exfoliated by rapid microwave heating, followed by ultrasonic treatment;
therefore, oxygen content is only associated to structural defects at the edges of basal planes. For
comparison, Haubner et al. observed that pristine graphite presents an oxygen content of 1.4%
and weight loss below 5% when heated until 800°C. [41]
Figure 7.1: (a) XPS spectrum for atomic composition of GNP-C powder; (b) TGA curve for
GNP-C powder.
7.4.2 FTIR analysis
Figure 7.2 shows the spectra typical for PLA presenting peaks from 3000 to 2850 cm−1,
correspondent to alkyl C-H stretches. The C=O stretching region appears around 1750 cm−1. A
band at 1450 cm−1attributed to CH3 is found. The C-H deformation and asymmetric bands are
present at 1380 and 1355 cm−1. The C-O stretching modes of the ester groups are present around
1178 cm−1. A band correspondent to C-O-C asymmetric stretching is present around 1078 cm−1,
and C-O alkoxy stretching vibration mode is at 1060 cm−1. Also, a band correspondent to C-
CH3 vibrations is present around 1041 cm−1. Bands at 865 and 754 cm−1 are attributed to the
amorphous and crystalline phase of PLA, respectively. [42, 43]
Physical-chemical properties and biocompatibility of PLA/GBMs composites – production by melt-blending
Artur M. Pinto – Jan 2017 183
Figure 7.2: FTIR spectra for PLA and PLA/GNP-C 0.25 wt.% (180 °C, 20 min, and 50
rpm).
FTIR spectra for PLA and PLA/GNP-C 0.25 wt.% are similar. The low filler content makes it
difficult to detect characteristic bands. Kong et al. also observed that incorporation of small
amounts (0.3–3 wt.%) of carbon fillers (MWNTs) in the polyester poly(caprolactone) did not
change the pristine polymer FTIR spectra. [44]
7.4.3 Mechanical characterization
By adjusting operation parameters in melt blending, one can try to obtain a compromise between
maximizing filler exfoliation and minimizing thermal/oxidative PLA degradation. In the
literature, typical conditions for PLA melt processing correspond to temperatures of 160–180 °C,
mixing times of 10–20 min, and rotation speeds around 50 rpm. [3, 34, 45] In this work, PLA/GNP-
C blends were initially prepared by mixing at 180°C during 20 min and at 50 rpm. The resulting
composites were characterized in terms of Young's modulus, tensile strength, and toughness (area
under stress–strain curve, AUC). Figure 7.3 shows that Young's modulus and tensile strength are
maximum for a loading of 0.25 wt.%, with 20% increase in tensile strength, 12% increase in
Young's modulus, and 16% increase in toughness. In comparison, Chartarrayawadee et al. [46]
observed an increase of 32% in tensile strength with the incorporation of 1 wt.% graphene oxide
and stearic acid (1:1 ratio) in PLA. Also, Li et al. [47] reported an increase in tensile strength of
39% with the incorporation of 1 wt.% graphene sheets in PLA. On the other hand, Narimissa et
al. [48] observed PLA/GNP-M 1 wt.% composites to have similar tensile strength and Young's
modulus as pristine PLA, becoming brittle at 3 wt.% loading.

Chapter 7
184 Artur M. Pinto – Jan 2017
Figure 7.3: Effect of increasing nanofiller content on mechanical properties of PLA/GNP-C
composites under the same processing conditions (180 °C, 20 min, and 50 rpm): (a) Young's
modulus; (b) tensile strength; (c) toughness. Error bars represent standard deviations
computed from measurements on at least 10 samples.
Figure 7.3 shows the decrease in mechanical performance when loading is raised to 0.5 wt.%,
which can be attributed to increased platelet agglomeration introducing defects in the polymer
matrix. The relation between agglomeration and loading level will be discussed further below.
Toughness improves for 0.1 and 0.25 wt.% loadings, when compared to pristine PLA, but the two
results are undistinguishable. Elongation at break results was of about 3.8%, with no significant
differences observed between PLA and its composites.
The effects of varying mixing time and rotation speed were analyzed for the optimal loading of
0.25 wt.%. Figure 7.4 compares the results obtained for mixing times of 10, 15, and 20 min, and
rotation speeds of 25 and 50 rpm. At 75 rpm, a brittle material was obtained, probably due to PLA
degradation under high shear. The results show that the best processing conditions correspond to
Physical-chemical properties and biocompatibility of PLA/GBMs composites – production by melt-blending
Artur M. Pinto – Jan 2017 185
20 min and 50 rpm. Lower mixing time or rotation speed probably yield worse GNP dispersion
and hence lower mechanical performances. A higher mixing temperature of 200 °C was tested,
but yielded very brittle materials, probably due to thermoxidative degradation of PLA. These
results show that tuning of melt blending operation conditions can have an impact on the final
properties of the nanocomposite, as it directly affects the quality of nanofiller dispersion and then
possibility of polymer degradation.
Since the best processing conditions for PLA and PLA/GNP-C were determined to be 180 °C, 20
min, and 50 rpm, only the materials produced using these conditions were further characterized on
physicochemical and biological studies.
7.4.4 Thermal analysis
Differential scanning calorimetry (DSC) was performed for all PLA/GNP-C loadings tested. The
results are shown in Fig. 7.5. Glass transition occurs in the range 60–65 °C, followed by a small
hysteresis peak, associated with physical relaxation. Melting takes place at around 155 °C,
preceded by a broad cold-crystallization peak. It is interesting to note that PLA presents two
combined melting peaks, which can be ascribed to differences in crystal morphology (e.g.,
lamellar thickness). [49] As GNP-C content increases, the higher temperature peak diminishes in
intensity, indicating that polymer–nanoplatelet interaction leads to crystallinity uniformization.
Table 7.1 shows the estimated values of glass transition temperature (Tg) and melting temperature
(Tm) for all samples tested. As the material is loaded with GNP-C, both Tg and Tm do not change
significantly in relation to pristine PLA. An increase in Tg is often expected as a consequence of
segment mobility being restricted due to filler-induced chain confinement. However, other studies
have reported similar behavior for PLA loaded with nanofillers, concomitantly with observation
of mechanical reinforcement. [35, 39] A decrease in Tm would be observed if phase separation had
occurred. [50, 51]
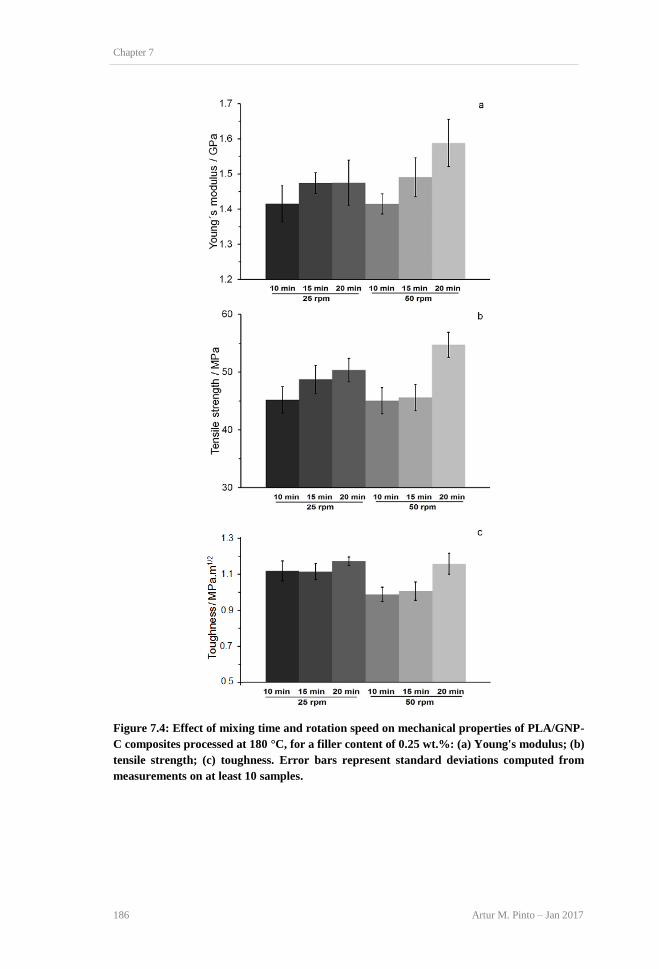
Chapter 7
186 Artur M. Pinto – Jan 2017
Figure 7.4: Effect of mixing time and rotation speed on mechanical properties of PLA/GNP-
C composites processed at 180 °C, for a filler content of 0.25 wt.%: (a) Young's modulus; (b)
tensile strength; (c) toughness. Error bars represent standard deviations computed from
measurements on at least 10 samples.
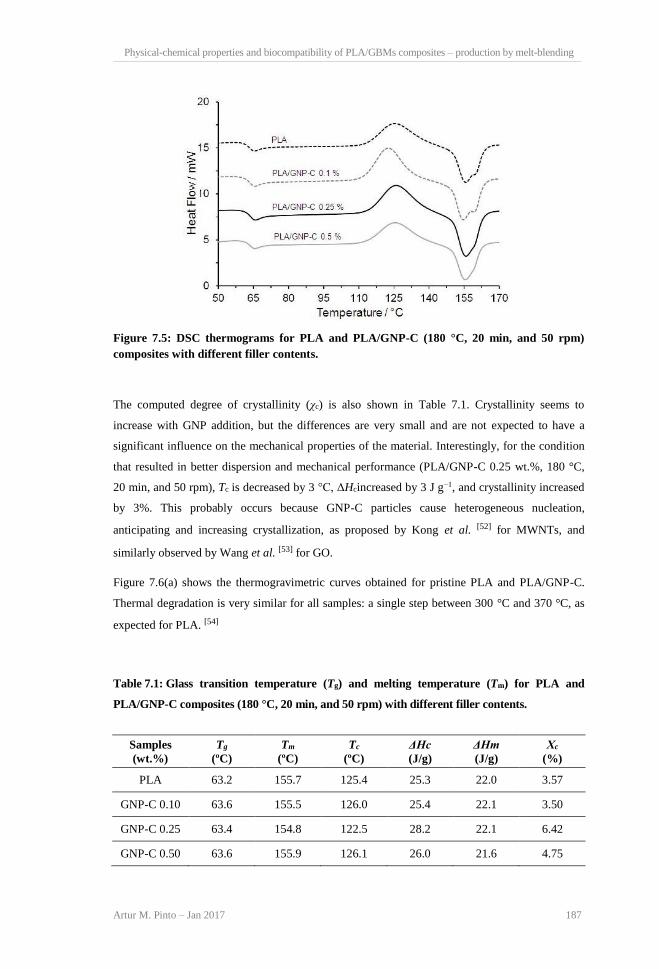
Physical-chemical properties and biocompatibility of PLA/GBMs composites – production by melt-blending
Artur M. Pinto – Jan 2017 187
Figure 7.5: DSC thermograms for PLA and PLA/GNP-C (180 °C, 20 min, and 50 rpm)
composites with different filler contents.
The computed degree of crystallinity (χc) is also shown in Table 7.1. Crystallinity seems to
increase with GNP addition, but the differences are very small and are not expected to have a
significant influence on the mechanical properties of the material. Interestingly, for the condition
that resulted in better dispersion and mechanical performance (PLA/GNP-C 0.25 wt.%, 180 °C,
20 min, and 50 rpm), Tc is decreased by 3 °C, ΔHcincreased by 3 J g−1, and crystallinity increased
by 3%. This probably occurs because GNP-C particles cause heterogeneous nucleation,
anticipating and increasing crystallization, as proposed by Kong et al. [52] for MWNTs, and
similarly observed by Wang et al. [53] for GO.
Figure 7.6(a) shows the thermogravimetric curves obtained for pristine PLA and PLA/GNP-C.
Thermal degradation is very similar for all samples: a single step between 300 °C and 370 °C, as
expected for PLA. [54]
Table 7.1: Glass transition temperature (Tg) and melting temperature (Tm) for PLA and
PLA/GNP-C composites (180 °C, 20 min, and 50 rpm) with different filler contents.
Samples
(wt.%)
Tg
(ºC)
Tm
(ºC)
Tc
(ºC)
ΔHc
(J/g)
ΔHm
(J/g)
Χc
(%)
PLA 63.2 155.7 125.4 25.3 22.0 3.57
GNP-C 0.10 63.6 155.5 126.0 25.4 22.1 3.50
GNP-C 0.25 63.4 154.8 122.5 28.2 22.1 6.42
GNP-C 0.50 63.6 155.9 126.1 26.0 21.6 4.75

Chapter 7
188 Artur M. Pinto – Jan 2017
Fig. 7.6(b), which represents the weight loss derivative (dTG) curves, allows a better
differentiation between the results. The peak maximum values increase with graphene loading,
indicating faster degradation rates. Similar behavior has been reported by Bao et al. [35] for
PLA/graphene composites, which was attributed to the high thermal conductivity of graphene
being the dominant contribution at low loadings. As a consequence, facilitated heat transfer
overcomes the mass transfer barrier effect that often leads to improved thermal stabilities when
lamellar fillers are used. In our particular case, the relatively small diameter of the GNP-C
platelets may contribute to it being a less effective barrier, as the effect of path tortuosity is small.
For a loading of 0.5 wt.%, the onset of degradation is shifted toward higher temperatures, which
may indicate that at this concentration, diffusion of pyrolysis products is more effectively
restrained.
Figure 7.6: (a) TGA; (b) −dTG curves for PLA and PLA/GNP-C composites with different
filler contents (180 °C, 20 min, and 50 rpm).
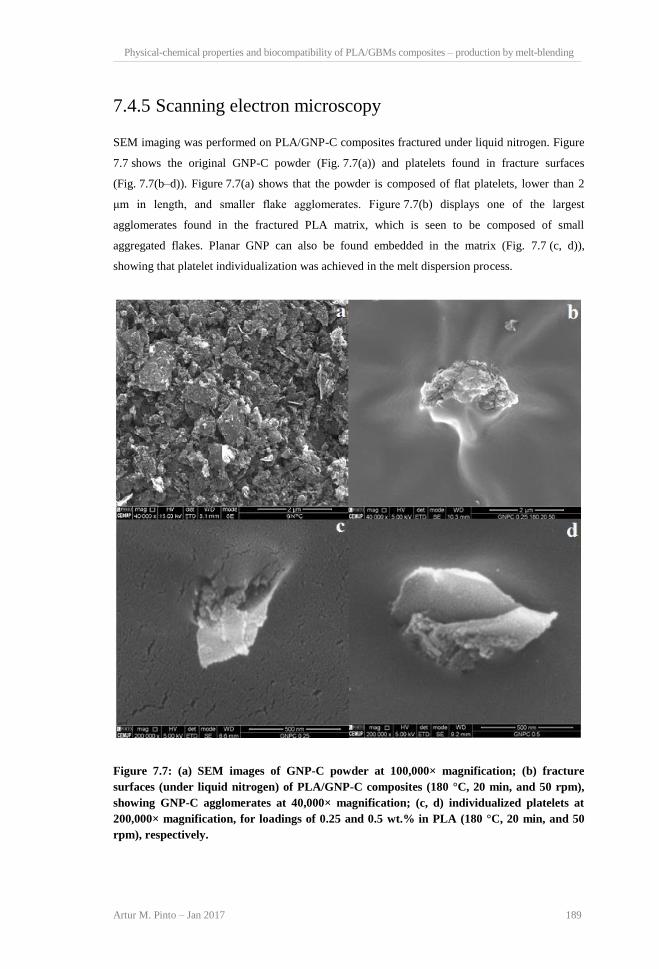
Physical-chemical properties and biocompatibility of PLA/GBMs composites – production by melt-blending
Artur M. Pinto – Jan 2017 189
7.4.5 Scanning electron microscopy
SEM imaging was performed on PLA/GNP-C composites fractured under liquid nitrogen. Figure
7.7 shows the original GNP-C powder (Fig. 7.7(a)) and platelets found in fracture surfaces
(Fig. 7.7(b–d)). Figure 7.7(a) shows that the powder is composed of flat platelets, lower than 2
μm in length, and smaller flake agglomerates. Figure 7.7(b) displays one of the largest
agglomerates found in the fractured PLA matrix, which is seen to be composed of small
aggregated flakes. Planar GNP can also be found embedded in the matrix (Fig. 7.7 (c, d)),
showing that platelet individualization was achieved in the melt dispersion process.
Figure 7.7: (a) SEM images of GNP-C powder at 100,000× magnification; (b) fracture
surfaces (under liquid nitrogen) of PLA/GNP-C composites (180 °C, 20 min, and 50 rpm),
showing GNP-C agglomerates at 40,000× magnification; (c, d) individualized platelets at
200,000× magnification, for loadings of 0.25 and 0.5 wt.% in PLA (180 °C, 20 min, and 50
rpm), respectively.

Chapter 7
190 Artur M. Pinto – Jan 2017
As previously discussed, agglomeration at the higher loadings is the probable cause for the
observed degradation of mechanical properties above 0.25 wt.% GNP-C content. To obtain a
better notion of the incidence of agglomeration in these composites, different SEM images of
fracture surfaces (at 5,000× magnification) were inspected, and the number of agglomerates with
different average sizes was computed per unit area of sample section, for the three loadings tested.
Figure 7.8 shows the cumulative plots obtained and representative images. Very few agglomerates
were found with sizes above 0.8 μm, and therefore these were ignored in the calculations. From
Fig. 7.8, the composites with 0.1 and 0.25 wt.% loadings show similar results. However, for 0.5
wt.%, there is a noticeably higher concentration of agglomerates of all sizes. This is consistent
with the observed decrease in mechanical performance. At this loading interplatelet interactions
promote higher agglomeration, which cannot be efficiently overcome by melt mixing. The
agglomerates work as defects in the polymer matrix, facilitating crack initiation during
mechanical deformation. [55]
Figure 7.8: (a) Cumulative plots of number of agglomerates per unit of area (mm2) as a
function of agglomerate length, for different GNP-C loadings (180 °C, 20 min, and 50 rpm);
(b) SEM images of fracture of surfaces for 5,000× magnification.

Physical-chemical properties and biocompatibility of PLA/GBMs composites – production by melt-blending
Artur M. Pinto – Jan 2017 191
7.4.6 Raman spectroscopy
As observed in Figure 7.9, the Raman spectrum of pristine PLA exhibits a well-defined band at
1458 cm−1, in the 1200–1700 cm−1 spectral range. The Raman spectrum of the “as-received”
GNP-C powder exhibits the strong D- and G-bands, located at 1345 cm−1 and at 1575 cm−1,
respectively, as well as the weak D′-band at 1615 cm−1. [56, 57] The G-band is assigned to the in-
plane TO and LO vibrations of the carbon lattice, while the D and D′ bands arise from double
resonance processes involving the in-plane TO phonon with defects and edge structure of the
graphene sheets. The Raman spectrum of PLA/GNP-C 0.5 wt.%, presented here as representative
example, exhibits a band at 1458 cm−1, from PLA matrix, and two sets of bands located at the left
and right sides of this one, which deserve detailed attention.
Figure 7.9: Representative unpolarized Raman spectra for PLA, GNP-C powder, and
PLA/GNP-C 0.5 wt.% 20 min, recorded at ambient conditions.
Figure 7.10 shows the best fit of Eq. (1) to the spectrum of PLA/GNP-C 0.5 wt.%. Both low and
high frequency sets can be deconvoluted into three main bands. The existence of several bands in
the spectral range where the D-band is expected and where the PLA matrix does not exhibit any
Raman band, evidencing structural disorder in the samples due to the exfoliation degree of GNP.
In fact, the width of the D bands increases in the composites, evidencing disorder, as reported by
Ramirez et al. [56] The two bands, not presented in pristine GNP-C or PLA matrix spectra, appear
in the composite sample: peak 3 at 1390 cm−1and peak 5 at 1525 cm−1. The existence of these
bands is an evidence of physical interaction between polymer matrix and GNP-C, originating new
modes in the system. Moreover, the frequency upshifts, of about 5 and 10 cm−1 observed for

Chapter 7
192 Artur M. Pinto – Jan 2017
peaks 2 and 6, respectively, when GNP-C is incorporated in PLA, corroborates the filler–matrix
interaction and compression of the filler by the polymer matrix upon cooling. [58]
Figure 7.10: Example of Raman spectrum fitting according to Eq. (1) to PLA/GNP-C 0.5
wt.% 20 min. Bands 1–3 are attributed to D band and 5–6 to G band of GNP-C, while band
4 arises from PLA matrix.
Figure 7.11 shows the representative Raman spectra of PLA and PLA/GNP-C composites with
different filler amounts, mixed during 10 (Fig. 7.11 (a)) and 20 min (Fig. 7.11 (b)). In both cases,
as the graphene concentration increases, the intensity of Raman bands assigned to GNP-C
increases. The Raman signals recorded for different sample positions did not show significant
differences, pointing out the homogeneity of the graphene distribution within the polymer matrix,
considering both individualized platelets and agglomerates.
From the fitting procedure, we have calculated the intensity of the observed Raman bands. It is
well established that the ratio between the intensities of the D- and G-bands, ID/IG, is widely used
for characterizing the level of defect in graphene. [59] Moreover, the intensity of a Raman band
depends on the scattering cross-section of the corresponding mode and on the number of scatters
per unit volume. Therefore, the ratio between the intensities of two aforementioned modes gives
qualitative information regarding the ratio between the corresponding scatters concentration. [60]

Physical-chemical properties and biocompatibility of PLA/GBMs composites – production by melt-blending
Artur M. Pinto – Jan 2017 193
Figure 7.11: Unpolarized Raman spectra of PLA and PLA/GNP-C 0.1, 0.25, and 0.5 wt.%
for (a) 10 and (b) 20 min mixing times.
Figure 7.12 shows the ratio between the intensities relative to the D and G bands (peaks 2 and 6),
for the as-received GNP-C powder and to the PLA/GNP-C composites, for 10 and 20 min mixing
times. In both cases, as the GNP-C concentration increases, the ratio I2/I6 tends to increase, which
is interpreted as an evidence for the increasing disorder in graphene, associated with defects
arising from the interaction between graphene sheets and the polymeric matrix, and from the
agglomerates of graphene in the matrix, as it is well evidenced by the SEM images. For a
sufficiently high filler loading (0.5 wt.%), the content of agglomerated material introduces defects
that can have a negative impact on the mechanical performance of the composite. This
detrimental action surpasses the reinforcement effect, in agreement with the results of mechanical
testing. This interpretation of the ID/IG ratio is consistent with the fact that, for the same GNP-C
initial concentration, the ratio decreases with increasing mixing time, evidencing that longer
mixing induces more efficient deagglomeration of the nanoplatelets within the PLA matrix.
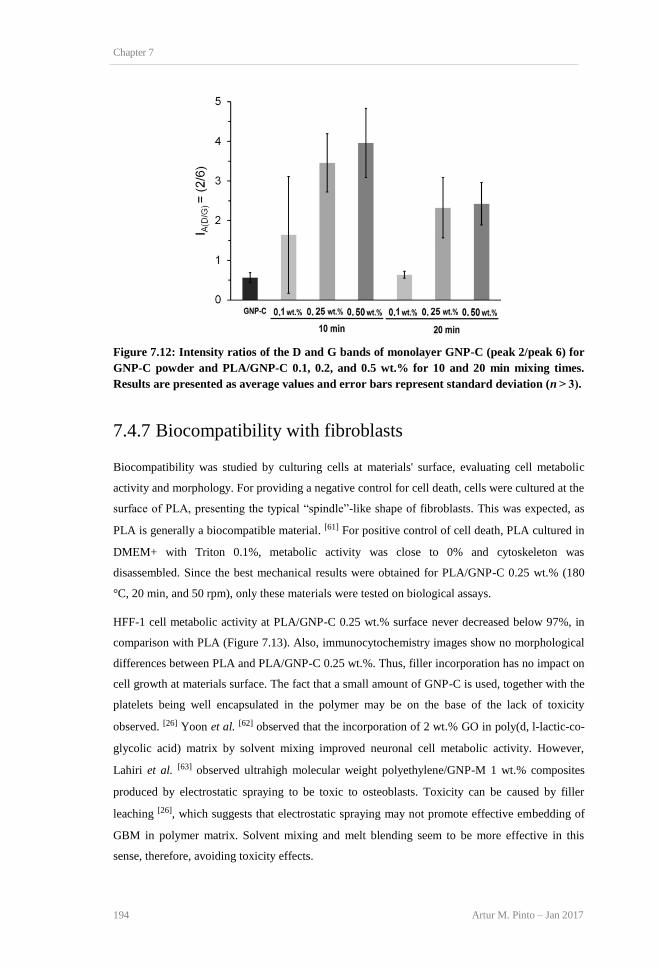
Chapter 7
194 Artur M. Pinto – Jan 2017
Figure 7.12: Intensity ratios of the D and G bands of monolayer GNP-C (peak 2/peak 6) for
GNP-C powder and PLA/GNP-C 0.1, 0.2, and 0.5 wt.% for 10 and 20 min mixing times.
Results are presented as average values and error bars represent standard deviation (n > 3).
7.4.7 Biocompatibility with fibroblasts
Biocompatibility was studied by culturing cells at materials' surface, evaluating cell metabolic
activity and morphology. For providing a negative control for cell death, cells were cultured at the
surface of PLA, presenting the typical “spindle”-like shape of fibroblasts. This was expected, as
PLA is generally a biocompatible material. [61] For positive control of cell death, PLA cultured in
DMEM+ with Triton 0.1%, metabolic activity was close to 0% and cytoskeleton was
disassembled. Since the best mechanical results were obtained for PLA/GNP-C 0.25 wt.% (180
°C, 20 min, and 50 rpm), only these materials were tested on biological assays.
HFF-1 cell metabolic activity at PLA/GNP-C 0.25 wt.% surface never decreased below 97%, in
comparison with PLA (Figure 7.13). Also, immunocytochemistry images show no morphological
differences between PLA and PLA/GNP-C 0.25 wt.%. Thus, filler incorporation has no impact on
cell growth at materials surface. The fact that a small amount of GNP-C is used, together with the
platelets being well encapsulated in the polymer may be on the base of the lack of toxicity
observed. [26] Yoon et al. [62] observed that the incorporation of 2 wt.% GO in poly(d, l-lactic-co-
glycolic acid) matrix by solvent mixing improved neuronal cell metabolic activity. However,
Lahiri et al. [63] observed ultrahigh molecular weight polyethylene/GNP-M 1 wt.% composites
produced by electrostatic spraying to be toxic to osteoblasts. Toxicity can be caused by filler
leaching [26], which suggests that electrostatic spraying may not promote effective embedding of
GBM in polymer matrix. Solvent mixing and melt blending seem to be more effective in this
sense, therefore, avoiding toxicity effects.

Physical-chemical properties and biocompatibility of PLA/GBMs composites – production by melt-blending
Artur M. Pinto – Jan 2017 195
Figure 7.13: Metabolic activity of HFF-1 cells cultured at the surface of PLA/GNP-C 0.25
wt.% (180 °C, 20 min, and 50 rpm) in DMEM+, at 24, 48, and 72 h. Cell metabolic activity is
represented as percentage in comparison with cells cultured at PLA surface in DMEM+
(100%). Results are presented as mean and standard deviation (n = 6). The red line at 70%
marks the toxicity limit, according to ISO 10993-5:2009(E). For positive control of cell
death, cells were cultured at PLA surface in DMEM+/Triton 0.1%, with metabolic activity
being close to 0% (data not shown). For representative immunofluorescence images of HFF-
1 at 72 h, cells were stained with DAPI (nuclei) blue and phalloidin (F-actin in cytoskeleton)
green. Bottom line presents the phase-contrast images of materials surface. Scale bar
represents 100 μm.

Chapter 7
196 Artur M. Pinto – Jan 2017
7.5 Conclusions
The purpose of this chapter was to evaluate the mechanical and thermal properties of PLA
filled with GNP-C, which presents particularly small platelet diameters and thicknesses. The
effects of blending conditions (mixing time, intensity, and temperature) and nanofiller
loading on the composite properties were analyzed. Both factors were observed to have a
major effect on the material's performance.
The best processing conditions were found to be mixing for 20 min at 50 rpm and 180 °C.
The optimum loading was 0.25 wt.%, resulting in 20% increase in tensile strength, 12%
increase in Young's modulus, and 16% increase in toughness. At higher loadings, defects due
to filler agglomeration cause decay in mechanical performance. The higher incidence of
agglomeration at 0.5 wt.% loading was demonstrated by SEM and Raman analysis, in what
we believe are novel approaches for the use of these techniques in composite
characterization.
Thermal analysis (DSC and TGA) showed no differences in glass transition or degradation
temperature between pristine PLA and the composites. However, an increase in rate of
thermal degradation with GNP-C loading was identified, which was interpreted in terms of a
dominant effect of enhanced heat transfer over mass transfer barrier, in agreement with other
reported works.
Melt mixing intensity and duration were found to have an impact on the mechanical
properties of PLA/GNP-C composites.
Raman spectroscopy analysis, based on intensity ratios of D and G bands, confirmed that
longer mixing times yield better dispersion of GNP. Evidence of effective interaction
between the nanofiller and the polymer matrix was found in the form of frequency shifts and
appearance of new Raman bands.
HFF-1 cells metabolic activity and morphology were not affected by the incorporation of
0.25 wt.% GNP-C in PLA.
The increased mechanical performance of these composites, achieved at low filler loadings,
associated with their biocompatibility, provides interesting perspectives for use in
biomaterial applications.

Physical-chemical properties and biocompatibility of PLA/GBMs composites – production by melt-blending
Artur M. Pinto – Jan 2017 197
7.6 References
1. R. Vaia, H. Wagner, Framework for nanocomposites, Materials 72 (2004) 32-37.
2. A.J.R. Lasprilla, G. A. R. Martinez, B. H. Lunelli, A.L. Jardini, R.M. Filho, Poly-lactic
acid synthesis for application in biomedical devices – A review, Biotechnol Adv 30
(2012) 321-328.
3. B.W. Chieng, N.A. Ibrahim, W.M. Yunus, Optimization of Tensile Strength of Poly
(Lactic Acid)/Graphene Nanocomposites using Response Surface Methodology, Polym-
Plast Technol 51 (2012) 791-799.
4. B.W. Chieng, N.A. Ibrahim, W.M. Yunus, M.Z. Hussein, V.S. Silverajah, Graphene
Nanoplatelets as Novel Reinforcement Filler in Poly(lactic acid)/ Epoxidized Palm Oil
Green Nanocomposites: Mechanical Properties, Int J Mol Sci 13 (2012) 10920-10934.
5. I. Armentano, M. Dottori, E. Fortunati, S. Mattiolo, J.M. Kenny, Biodegradable
polymer matrix nanocomposites for tissue engineering: a review, Polym Degrad Stabil
95 (2010) 2126-2146.
6. B. D. Ratner, A. Hoffman, F. Schoen, J. Lemons, Biomaterials Science, third ed.,
Academic Press, 2012.
7. L. Cabedo, J. Feijoo, M. Villanueva, J. Lagarón, Optimization of biodegradable
nanocomposites based in a PLA/PCL blends for food packaging applications,
Macromol Symp 233 (2006) 191-197.
8. S. Park, M. Todo, K. Arakawa, M. Koganemaru, Effect of crystallinity and loading-rate
on mode I fracture bahaviour of poly(lactic acid), Polymer 47 (2006) 1357-1363.
9. M. Murariu, A. Ferreira, M. Pluta, L. Bonnaud, M. Alexandre, P. Dubois, Polylactide
(PLA)-CaSO4 composites toughened with low molecular weight and polymeric ester-
like plasticizers and related performances, Eur Polym J 44 (2008) 3842-3852.
10. S. Tjong, Structural and mechanical properties of polymer nanocomposites, Mater Sci
Eng R-Rep 53 (2006) 73-197.
11. M. Nosonovsky, B. Bhushan, Multiscale friction mechanisms and hierarchical surfaces
in nano- and bio-tribology, Mater Sci Eng R-Rep 58 (2007) 162-193.
12. A. Dasari, Z. Yu, Y. Mai, Fundamental aspects and recent progress on wear/scratch
damage in polymer nanocomposites, Mater Sci Eng R-Rep 63 (2009) 31-80.
13. N. Kotov, Materials science: Carbon sheet solutions, Nature 442 (2006) 254-255.
14. L. Zhang, Q. Zhao, L. Liu, Z. Zhang, Functional graphene oxide as a nanocarrier for
controlled loading and target delivery of mixed anticancer drugs, Small 6 (2010) 537-
544.
15. K. Yang, S. Zhang, G. Zhang, X. Sun, S. Lee, Z. Liu, Graphene in mice: ultrahigh in
vivo tumor uptake and efficient photothermal therapy, Nano Lett 10 (2010) 3318-3323.
16. A. Kumari, S. Yadav, S. Yadav, Biodegradable polymeric nanoparticles based drug
delivery systems, Colloid Surface B 75 (2010) 1-18.
17. H. Bai, L. Chun, S. Gaoquan, Functional Composite Materials Based on Chemically
Converted Graphene, Adv Mater 23 (2011) 1089-1115.
18. M. Pumera, Electrochemistry of graphene: new horizons for sensing and energy
storage, The Chem Rec 9 (2009) 211-223.
19. M. Kalbaconva, A. Broz, J. Kong, K. Martin, Graphene substrates promote adherence
of human osteoblasts and mesenchymal stromal cells, Carbon 48 (2010) 4323-4329.
20. Y. Wang, Z. Li, Y. Lin, Graphene and graphene oxide: biofunctionalization and
applications in biotechnology, Trends Biotechnol 29 (2011) 205-212.
21. X. Zhang, J. Yin, C. Peng, W. Hu, Z. Zhua, W. Li, C. Fan, Q. Huang, Distribution and
biocompatibility studies of graphene oxide in mice after intravenous administration,
Carbon 49 (2011) 986-995.

Chapter 7
198 Artur M. Pinto – Jan 2017
22. Y. Chang, S. Yang, J. Liu, E. Dong, Y. Wang, A. Cao, Y. Liu, H. Wang, In vitro
toxicity evaluation of graphene oxide on A549 cells, Toxicol Lett 200 (2011) 201-210.
23. P. Begun, R. Ikhtiari, B. Fugetsu, Graphene phytotoxicity in the seedling stage of
cabbage, tomato, red spinach, and lettuce, Carbon 49 (2011) 3907-3919.
24. D. Lahiri, R. Dua, C. Zhang, I. Socarraz-Novoa, A. Bhat, S. Ramaswammy, A.
Agarwal, Graphene nanoplatelet-induced strengthening of UltraHigh molecular weight
polyethylene and biocompatibility in vitro, ACS Appl Mater Interfaces 4 (2012) 2234-
2241.
25. J. Wang, P. Sun, Y. Bao, J. Liu, L. An, Cytotoxicity of single-walled carbon nanotubes
on PC12 cells, Toxicol in vitro 25 (2011) 242-250.
26. A.M. Pinto, I.C. Gonçalves, F.D. Magalhães, Graphene-based materials
biocompatibility: A review, Colloid Surface B 111 (2013) 188-202.
27. A.M. Pinto, C. Gonçalves, D.M. Sousa, A.R. Ferreira, J.A. Moreira, I.C. Gonçalves,
F.D. Magalhães, Smaller particle size and higher oxidation improves biocompatibility
of graphene-based materials, Carbon 99 (2015) 318-329.
28. Y. Pan, T. Wu, H. Bao, L. Li, Green fabrication of chitosan films reinforced with
parallel aligned graphene oxide, Carbohyd Polym 83 (2011) 1908-1915.
29. P. Song, Z. Cao, Y. Cai, L. Zhao, Z. Fang, S. Fu, Fabrication of exfoliated graphene-
based polypropylene nanocomposites with enhanced mechanical and thermal properties,
Polymer 52 (2011) 4001-4010.
30. Y. Cao, P. Wu, Preparation of organically dispersible graphene nanosheet powders
through a lyophilisation method and their poly(lactic acid) composites, Carbon 48
(2010) 3834-3839.
31. A.M. Pinto, J. Cabral, D.P. Tanaka, A.M. Mendes, F.D. Magalhães, Effect of
incorporation of graphene oxide and graphene nanoplatelets on mechanical and gas
permeability properties of poly(lactic acid) films, Polym Int 62 (2012) 33-40.
32. X. Li, Y. Xiao, A. Berget, M. Longery, J. Che, Preparation of polylactide/graphene
composites from liquid-phase exfoliated graphite sheets, Polym Composite 35 (2013)
396-403.
33. A.M. Pinto, S. Moreira, I.C. Gonçalves, A.M. Mendes, F.D. Magalhães,
Biocompatibility of poly (lactic acid) with incorporated graphene-based materials,
Colloid Surface B 104 (2013) 229-238.
34. B.W. Chieng, N.A. Ibrahim, W.M. Yunus, M. Hussein, Poly(lactic acid)/Poly(ethylene
glycol) Polymer Nanocomposites: Effects of Graphene Nanoplatelets, Polymers 6
(2014) 93-104.
35. C. Bao, L. Song, W. Xing, B. Yuan, C. Wilkie, J. Huang, Y. Guo, Y. Hu, Preparation of
graphene by pressurized oxidation and multiplex reduction and its polymer
nanocomposites by masterbatch-based melt blending, J Mater Chem 22 (2012) 6088-
6096.
36. J.H. Yang, S.H. Lin, Y.D. Lee, Preparation and characterization of poly(L-lactide)-
graphene composites using the in situ ring-opening polymerization of PLLA with
graphene as the initiator, J Mater Chem 22 (2012) 10805.
37. I. Kim, Y.G. Jeong, Polylactide/Exfoliated Graphite nanocomposites with Enhanced
Thermal Stability, Mechanical modulus, and Electrical Conductivity, J Polym Sci B
Poly Phys 48 (2010) 850-858.
38. L. Wenxiao, S. Chengbo, S. Mingjing, G. Qiwei, X. Zhiwei, W. Zhen, Y. Cauyun, M.
Wei, N. Jiarong, Influence of Silanized Low-Dimensional Carbon Nanofillers on
Mechanical, Thermomechanical, and Crystallization behaviours of Poly(L-lactic acid)
Composites – A Comparative Study, J Appl Polym Sci 130 (2013) 1194-1202.
39. L. Wenxiao, X. Zhiwei, C. Lei, S. Mingjing, T. Xu, Y. Caiyun, L. Hanming, Q.
Xiaoming, A facile method to produce graphene oxide-g-poly(L-lactic acid) as an
promising reinforcement for PLLA nanocomposites, Chem Eng J 237 (2014) 291-299.

Physical-chemical properties and biocompatibility of PLA/GBMs composites – production by melt-blending
Artur M. Pinto – Jan 2017 199
40. K. Loh, Q. Bao, P. Ang, J. Yang, The chemistry of graphene, J Mater Chem 20 (2010)
2277-2289.
41. K. Haubner, J. Morawski, P. Olk, L. Eng, C. Ziegler, B. Adolphi, E. Jaehne, The route
to functional graphene oxide, ChemPhysChem 10 (2010) 2131-2139.
42. R. Auras, L. Lim, S. Selke, H. Tsuji, Poly(Lactic Acid): Synthesis, Structures,
Properties, Processing, and Applications, first ed., John Wiley & Sons, 2010.
43. C. Bilbao-Sainz, B. Chiou, D. Valenzuela-Medina, W. Du, K. Gregorski, T. Williams,
D. Wood, G. Glenn, W. Orts, Solution blow spun poly(lactic acid)/hydroxypropyl
methylcellulose nanofibers with antimicrobial properties, Eur Polym J 54 (2014) 1-10.
44. Y. Kong, J. Yuan, Z. Wang, J. Qju, Study on the preparation and properties of aligned
carbon nanotubes/polylactide composite fibers, Polym Composite 33 (2012) 1613-1619.
45. Z. Antar, J. Feller, H. Noel, P. Glouannec, K. Elleuch, Thermoelectric behaviour of
melt processed carbon nanotube/ graphite/ poly(lactic acid) conductive biopolymer
nanocomposites (CPC), Mater Lett 67 (2012) 210-214.
46. W. Chartarrayawadee, R. Molloy, A. Ratchawet, N. Janmee, M. Butsamran, K. Panpai,
Fabrication of poly(lactic acid)/graphene oxide/stearic acid composites with improved
tensile strength, Polym composite (2015) Article in press, DOI: 10.1002/pc.23809.
47. X. Li, Y. Xiao, A. Bergeret, M. Longerey, J. Che, Preparation of polylactide/graphene
composites from liquid-phase exfoliated graphite sheets, Polym Composite 35 (2014)
396–403.
48. E. Narimissa, R.K. Gupta, H.J. Choi, N. Kao, M. Jollands, Morphological, mechanical,
and thermal characterization of biopolymer composites based on polylactide and
nanographite platelets, Polym Composite 33 (2012) 1505–1515.
Chapter 7
200 Artur M. Pinto – Jan 2017
Physical-chemical properties and biocompatibility of PLA/GBMs composites – effect of biodegradation
Artur M. Pinto – Jan 2017 201
Chapter 8
Physical-chemical properties and
biocompatibility of PLA/GBMs
composites:
Effect of biodegradation
This chapter was based in the following published paper:

Chapter 8
202 Artur M. Pinto – Jan 2017

Physical-chemical properties and biocompatibility of PLA/GBMs composites – effect of biodegradation
Artur M. Pinto – Jan 2017 203
8 PHYSICAL-CHEMICAL PROPERTIES AND
BIOCOMPATIBILITY OF PLA/GBMs
COMPOSITES - EFFECT OF
BIODEGRADATION
8.1 Scope
Physico-chemical characterization of biomaterials is important because it can impact on its
performance, both by leading to “undesirable effects” or changing/preventing “the clinically
relevant performance”. In the case of poly(lactic acid) PLA, this characterization is of outmost
relevance, since it is a biodegradable polymer, so its properties considerably change after
implantation. PLA has potential to be used for several biomedical applications, as for example
orthopaedical uses, in which mechanical properties are relevant. For that reason, it is important to
assure that they do not decrease at an excessive rate, hampering the implants clinical function.
Graphene nanoplatelets (GNP) potential to be used as fillers to improve PLA mechanical
performance has already been demonstrated in the previous chapters and their lack of adverse
effects on cell lines proliferation at PLA/GNP composites surface shown. However, along
biodegradation toxic products can be released, as well as GNP particles. The last were shown to
have potential to be toxic in high concentrations, which will be hardly achieved by leaching from
the polymer matrix, since the filler loading required to improve mechanical properties is very low.
Despite that, two different grades of GNP were incorporated in PLA using the conditions that
resulted in better mechanical performance, as described in Chapter 7. The produced composites
were characterized after being subject to hydrolytic degradation in physiological conditions.
Materials were analyzed by Fourier transform infrared spectroscopy (FTIR), X-ray diffraction
(XRD), size exclusion chromatography (GPC-SEC), scanning electron microscopy (SEM),
thermogravimetric analysis (TGA), tensile testing, creep-recovery testing, and biocompatibility
assays.

Chapter 8
204 Artur M. Pinto – Jan 2017
8.2 State of the art
Poly(lactic acid) (PLA) has been widely investigated for biomedical applications because it is
biodegradable, bioresorbable, biocompatible and easily processable. [1,3] In addition, PLA-based
products are approved for biomedical applications and contact with body fluids by Food and Drug
Administration (FDA). [3] This polymer has several applications in bioengineering, like the
production of bioresorbable artificial ligaments, hernia repair meshes, scaffolds, screws, surgical
plates, and suture yarns. [4, 5] PLA can also be used in the production of drug delivery systems,
and in the packaging of pharmaceutical products. [6] To make this material more effective in
several applications, namely orthopaedic, some properties can be improved, being mechanical
performance usually the most relevant. [7] Approaches like adjustment of crystallinity [8],
incorporation of plasticizers [9], blends with other polymers [7] and addition of nanofillers have
been tested. Reinforcement with small amounts of nanofillers is an interesting option because it
allows improvement of target properties without changing PLA’s main characteristics. The most
frequently reported nanofillers are nanoclays [10], carbon nanotubes [11], and nanosilicas [12].
Graphene is a single layer of sp2 carbon atoms arranged in a honeycomb structure and possesses
extraordinary mechanical strength and an extremely high specific surface area. [13] Graphene
nanoplatelets (GNPs) are a commercial product with reduced cost when compared to single layer
graphene. GNPs are constituted by few stacked graphene layers, possessing oxygen-containing
functional groups along the edges. [14] They present high aspect ratio, thus being able to form a
percolated network with large interfacial interaction between nanoplatelets and polymer matrix,
resulting in effective load transfer and increased strength. [15] In a previous study, we have shown
that GNPs, at loadings below 1 wt.%, can provide effective mechanical reinforcement of PLA. [16]
However, in that work the composite films were prepared by solvent-mixing technique, which
may raise issues related to the toxicity of solvent residues that may remain in the materials, which
are often difficult to remove, and to occupational health concerns in industrial production. [17]
Melt blending, on the other hand, is a solvent-free and easily up-scalable processing method,
which has been adopted for the current work. Several authors have used this technique for
production of PLA composites filled with GNP or other graphene-related materials in recent
years, reporting improvements in mechanical performance at loadings below 1 wt.%. [18-21]
Narimissa et al. [22] observed that higher loadings are unbeneficial and the composites become
brittle.
To our knowledge, there are no studies regarding the behaviour of PLA filled with graphene-
based materials along biodegradation time. This is a pertinent issue when use as implanted

Physical-chemical properties and biocompatibility of PLA/GBMs composites – effect of biodegradation
Artur M. Pinto – Jan 2017 205
medical devices is intended. PLA biodegrades mainly by simple hydrolysis of the ester linkages,
forming monomeric lactic acid that is eliminated through the Krebs cycle. [23] Poly (l-lactide) acid
(PLLA), which presents better mechanical properties, degrades more slowly than the d-
lactide, with complete degradation occurring between 10 months to 4 years, depending on factors
like molecular weight, crystallinity, material geometry and location in the body. Degradation
leads to gradual decreases in molecular weight and mechanical performance. [24] For some
orthopaedic applications, like prosthetic ligaments, one important concern regarding PLA is to
maintain mechanical properties for long time periods, preventing rupture by fatigue and excessive
laxity due to creep, while the natural ligament is rebuilding itself. [25]
A study by Wan et al. compared PLA loaded with carbon fibre to pristine PLA, and reported that
the composite material had better mechanical properties along degradation than the unloaded
polymer. [26] However, not all fillers are able to improve the mechanical performance of PLA
along degradation time. [27] Since this subject has not been addressed for graphene-based
materials (GBMs), the current work focuses on characterization of the mechanical and thermal
behaviour of PLA filled with two grades of graphene nanoplatelets (GNP-M and GNP-C) along
6 months degradation. In addition, the biocompatibility of the composites and of their degradation
products is studied in terms of effects on metabolic activity, cell death and morphology of human
fibroblasts (HFF-1).
8.3 Materials and methods
8.3.1 Materials
Poly(lactic acid) (PLA) 2003D (4% d-lactide, 96% l-lactide content), was purchased from
Natureworks (Minnetonka, USA).
Graphene nanoplatelets (GNP), grade C750 (GNP-C) and M-5 (GNP-M) were acquired from XG
Sciences (Lansing, USA). The manufacturer reports the following characteristics. GNP-C:
average thickness lower than 2 nm and surface area of 750 m2 g−1; the platelet diameters have a
distribution that ranges from tenths of micrometer up to 1–2 μm. GNP-M: average thickness of 6–
8 nm, diameter of about 5 μm and surface area between 120 and 150 m2 g−1. Production of these
GNP grades is based on exfoliation of sulphuric acid-based intercalated graphite by rapid
microwave heating, followed by ultrasonic treatment. [28]
Chapter 8
206 Artur M. Pinto – Jan 2017
8.3.2 Preparation and degradation of PLA and PLA/GNP
composites
Composites of PLA filled with GNP-M and GNP-C at 0.25 wt.% loadings were prepared by melt
blending in a Thermo Haake Polylab internal mixer (internal mixing volume 60 cm3) at 180 °C,
with 20 min mixing time and with a rotor speed of 50 rpm. The conditions used had been
previously optimized in terms of filler loading, mixing temperature and duration, and rotor
speed. [29] After removal from the mixer, the composites were moulded in a hot press at 190 °C
for 2 min, under a pressure of 150 kg cm-2, into sheets with approximately 0.5 mm thickness.
After pressing, the sheets were rapidly cooled in water at room temperature. PLA without GNP
addition was processed in the same way to be used as a control. Samples with different
dimensions were cut from these sheets, depending on the characterization test.
Samples with dimensions of 60 × 15 mm and thickness of approximately 0.5 mm, were immersed
in 50 mL PBS in sterile conditions in plastic flasks (3 per flask) and incubated for 2, 4 and
6 months at 37 °C under 100 rpm.
8.3.3 Physico-chemical characterization
8.3.3.1 Scanning Electron Microscopy (SEM)
The morphology of the samples was observed using SEM (FEI Quanta 400FEG, with an
acceleration voltage of 3 kV) at Centro de Materiais da Universidade do Porto. Composites
selected for SEM analysis were fractured transversely under liquid nitrogen, applied on carbon
tape and sputtered with Au/Pa (10 nm film).
8.3.3.2 Fourier transform infrared spectroscopy (FTIR)
FTIR was used to evaluate the effect of fillers incorporation and biodegradation on materials’
chemical composition. Spectra were obtained between 600 and 4000 cm−1, with 100 scans and a
resolution of 4 cm−1, using a spectrometer ABB MB3000 (ABB, Switzerland) equipped with a
deuterated triglycine sulphate detector and using a MIRacle single reflection horizontal attenuated
total reflectance (ATR) accessory (PIKE Technologies, USA) with a diamond/Se crystal plate.
Physical-chemical properties and biocompatibility of PLA/GBMs composites – effect of biodegradation
Artur M. Pinto – Jan 2017 207
8.3.3.3 X-ray diffraction analysis (XRD)
XRD was used to evaluate the effect of fillers incorporation and biodegradation on materials’
crystalline structure. Samples were scanned using a Philips XPert diffractometer in the range of
diffraction angle 2θ, according to a Bragg-Brentano geometry. The anticathode used was cobalt
with a wavelength of 0.178896 nm. Samples in the form of films were analysed as they were, and
GNP-M and C powders were gently placed in an aluminium sample holder.
8.3.3.4 Gel permeation chromatography and size exclusion
chromatography (GPC-SEC)
In order to evaluate materials degradation along 6 months in PBS, samples were dried in an oven
at 50 °C during 48 h and stored in a desiccator. Samples were dispersed in chloroform during 24 h
(in a fridge at 4 °C), at a concentration of 5 mg mL−1, sonicated for 5 min, filtered and 300 μL
injected for GPC-SEC analysis. Calibration was performed with Shodex SM-105 set of
polystyrene standards (1.27 × 10³ < Mw < 3.04 × 10⁶), at the same concentration as the studied
samples. Data were processed using the program Multioffline (Polymer Laboratories) and
molecular weight (Mw) determined. At least 3 replicates were performed for each sample. The
equipment used was the PLA-GPC 50 Plus with a chloroform flow of 1 mL min−1, oven
temperature of 30 °C, using a column Viscotek T4000 Org GPC/SEC (300 × 8.0 mm) and a pre-
column Viscotek Tguard Org Guard (10 × 4.6 mm).
8.3.3.5 Thermal analysis
Thermal stability of samples was determined with a Netzsh STA 449 F3 Jupiter device. Sample
amounts ranged from 10 to 12 mg. The thermograms were recorded between 30 and 800 °C at a
heating rate of 10 °C min−1 under nitrogen flow.
8.3.4 Mechanical properties characterization
Tensile properties of the samples (60 × 15 × 0.5 mm) were measured using a Mecmesin Multitest-
1d motorized test frame, at room temperature. Loadings were recorded with a Mecmesin BF

Chapter 8
208 Artur M. Pinto – Jan 2017
1000 N digital dynamometer at a strain rate of 10 mm min−1. The test parameters were in
agreement with ASTM D 882-02. At least five samples were tested for each composite.
Creep/recovery tests were performed with a DMA 242 E Artemis (Netzsch) equipment in tension
mode at 37 °C. Samples (12 × 6 × 0.5 mm) were subjected to a static force of 6.0 N during 10 min
with a recovery mode also lasting 10 min. Multi-cycle measurements were carried out using the
same conditions for 10 cycles of creep/recovery, each with the duration of 10 min.
8.3.5 Biocompatibility evaluation
Human foreskin fibroblasts HFF-1 (from ATCC) were grown in DMEM (Dulbecco’s modified
Eagle’s medium (DMEM, Gibco) supplemented with 10% (V/V) newborn calf serum (Gibco) and
1% (V/V) penicillin/streptomycin (biowest) at 37 °C, in a fully humidified air containing 5%
CO2. The media were replenished every 3 days. When reaching 90% confluence, cells were rinsed
with PBS (37 °C) and detached from culture flasks (TPP®) using 0.25% (w/V) trypsin solution
(Sigma Aldrich) in PBS.
Biocompatibility of the materials was evaluated by the direct contact test, and by the elution test
method. In the direct contact test, cells were cultured on the surface of PLA, PLA/GNP-M and C
0.25 wt.% films (Ø = 5.5 mm). For the elution test method a monolayer of cells, after 24 h cell
growth, was exposed to materials’ extracts obtained after 6 months incubation in PBS (50 μL in
150 μL DMEM) at 37 °C and 100 rpm, as described in 8.3.2. In both assays, cells were seeded in
96 well plates (7500 cells per well). All experiments were performed using cells between
passages 10–14.
Negative control (DMEM) for metabolic activity decrease, toxicity or changed morphology, for
all biocompatibility assays was performed incubating cells in DMEM. Positive control for
metabolic activity decrease, toxicity or changed morphology, was performed incubating cells in
DMEM with 0.1% Triton X-100 (Triton 0.1%). For the elution test method, performed to test
degradation products biocompatibility, DMEM control consists in replacing culture media by
50 μL PBS incubated 6 months in the same conditions as other samples (PBS 6 M), in 150 μL
DMEM+.
8.3.5.1 Cytotoxicity

Physical-chemical properties and biocompatibility of PLA/GBMs composites – effect of biodegradation
Artur M. Pinto – Jan 2017 209
For cell metabolic activity evaluation, at 24, 48, and 72 h incubation with materials or materials
extracts, 20 μL resazurin solution were added and incubated for 3 h, fluorescence
(λex/em = 530/590 nm) read, and values determined as follows: Metabolic activity
(%) = Fsample/FDMEM × 100. All assays were performed in sextuplicate and repeated 3 times.
Cell viability/membrane integrity was evaluated by LIVE/DEAD assay. Hoechst 33342 permeates
membrane and stains nucleic acids. Calcein also permeates the membrane and is metabolized in
the cytoplasm by intracellular esterases originating a green highly fluorescent derivative. The cell
membrane has a residual permeability to propidium iodide, which only enters cells whose
membrane integrity is compromised, staining nucleic acids. After cells being incubated for 72 h
on the surface of the materials or in presence of extracts from the materials, DMEM was removed
and cells incubated with Hoechst 33342 (Molecular Probes) and Calcein (Molecular Probes), both
at 2.5 μg mL−1in PBS for 15 min, at 37 °C in the dark. Then, propidium iodide (PI) (Sigma
Aldrich) in PBS was added to each well to a final concentration of 1.25 μg mL−1 and images
acquired in an inverted fluorescence microscope (Carl Zeiss – Axiovert 200).
8.3.5.2 Immunocytochemistry
Cell morphology was evaluated by immunocytochemistry after cells being incubated for 72 h on
the surface of the materials or in presence of extracts from the materials. Cells were washed with
PBS and fixation was performed with paraformaldehyde (PFA - Merck) 4 wt.% in PBS for
15 min. PFA was removed, cells washed with PBS and stored at 4 °C. Cell cytoskeletal
filamentous actin can be visualized by binding of fluorescent phalloidin and the nucleus can be
stained with 4′,6-Diamidino-2-phenylindole dihydrochloride (DAPI) that intercalates with nucleic
acids. Cell membrane was permeabilized with triton X-100 0.1 wt.% at 4 °C for 5 min. Washing
was performed with PBS and incubation performed with phalloidin (Alexa Fluor 488; Molecular
Probes) solution in PBS in a 1:80 dilution for 20 min in the dark. After rinsing with PBS, DAPI
(Sigma Aldrich) solution at 3 μg mL−1 was added to each well and incubated for 15 min in the
dark. Finally, cells were washed and kept in PBS to avoid drying. Plates with adherent cells were
observed in the Carl Zeiss – Axiovert 200.
8.3.6 Statistical analysis
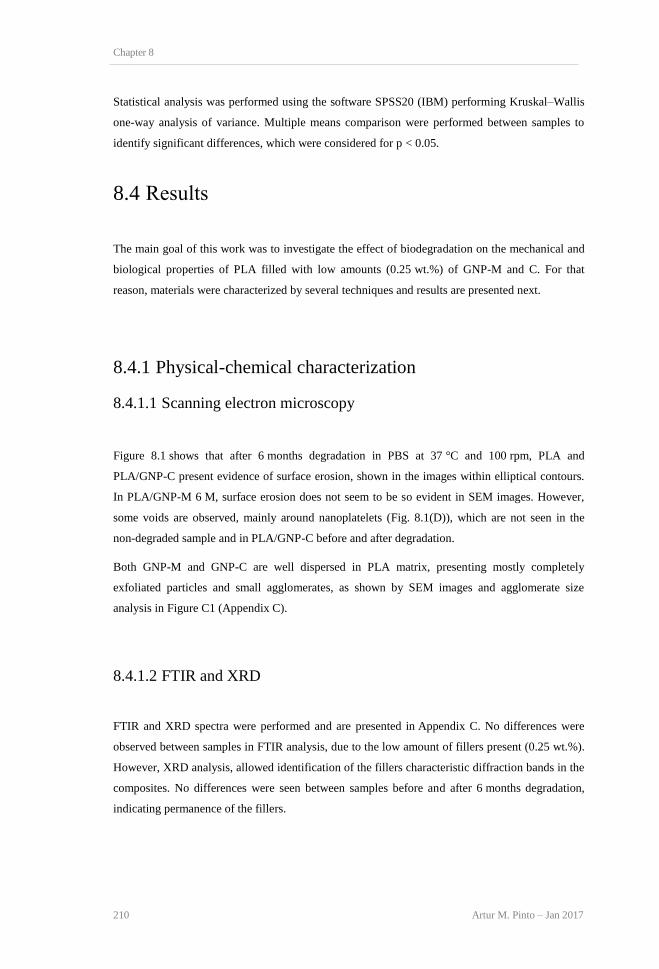
Chapter 8
210 Artur M. Pinto – Jan 2017
Statistical analysis was performed using the software SPSS20 (IBM) performing Kruskal–Wallis
one-way analysis of variance. Multiple means comparison were performed between samples to
identify significant differences, which were considered for p < 0.05.
8.4 Results
The main goal of this work was to investigate the effect of biodegradation on the mechanical and
biological properties of PLA filled with low amounts (0.25 wt.%) of GNP-M and C. For that
reason, materials were characterized by several techniques and results are presented next.
8.4.1 Physical-chemical characterization
8.4.1.1 Scanning electron microscopy
Figure 8.1 shows that after 6 months degradation in PBS at 37 °C and 100 rpm, PLA and
PLA/GNP-C present evidence of surface erosion, shown in the images within elliptical contours.
In PLA/GNP-M 6 M, surface erosion does not seem to be so evident in SEM images. However,
some voids are observed, mainly around nanoplatelets (Fig. 8.1(D)), which are not seen in the
non-degraded sample and in PLA/GNP-C before and after degradation.
Both GNP-M and GNP-C are well dispersed in PLA matrix, presenting mostly completely
exfoliated particles and small agglomerates, as shown by SEM images and agglomerate size
analysis in Figure C1 (Appendix C).
8.4.1.2 FTIR and XRD
FTIR and XRD spectra were performed and are presented in Appendix C. No differences were
observed between samples in FTIR analysis, due to the low amount of fillers present (0.25 wt.%).
However, XRD analysis, allowed identification of the fillers characteristic diffraction bands in the
composites. No differences were seen between samples before and after 6 months degradation,
indicating permanence of the fillers.

Physical-chemical properties and biocompatibility of PLA/GBMs composites – effect of biodegradation
Artur M. Pinto – Jan 2017 211
8.4.1.3 GPC-SEC
Figure 8.2 presents average molecular weight (��w) evolution along 6 months degradation for
PLA, and for PLA/GNP-M and PLA/GNP-C at 0.25 wt.% loading.
Figure 8.1: SEM images of PLA 0 M (A), PLA 6 M (B), PLA/GNP-M 0.25 wt.% 0 M (C),
PLA/GNP-M 0.25 wt.% 6 M (D), PLA/GNP-C 0.25 wt.% 0 M (E), and PLA/GNP-C
0.25 wt.% 6 M (F), broken under liquid nitrogen. Magnification is 4000×. Scale bar
represents 30 μm. Elliptical contours point out surface erosion and possible bulk
degradation.
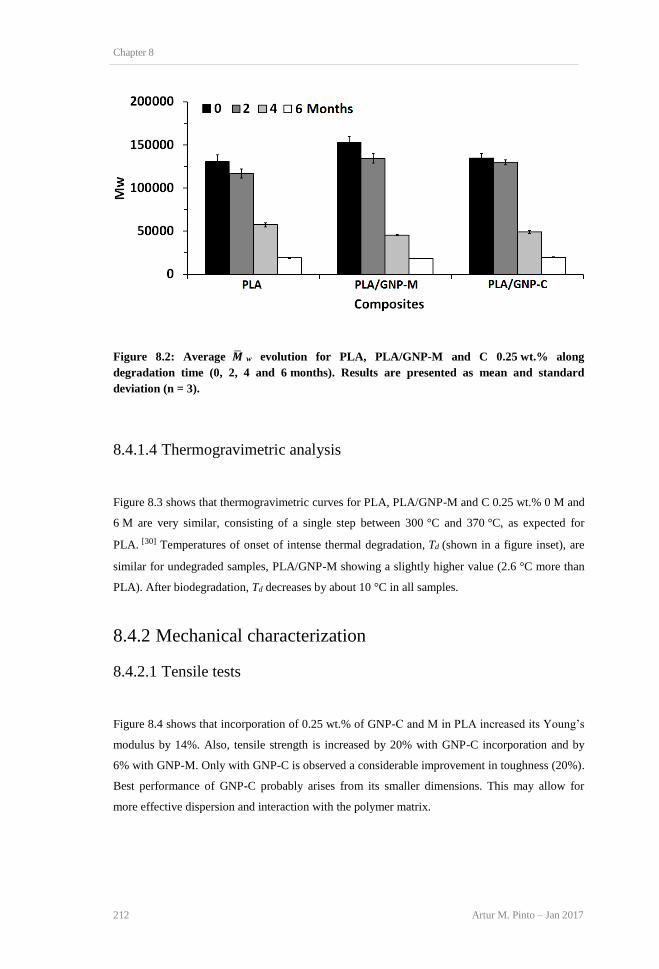
Chapter 8
212 Artur M. Pinto – Jan 2017
Figure 8.2: Average �� w evolution for PLA, PLA/GNP-M and C 0.25 wt.% along
degradation time (0, 2, 4 and 6 months). Results are presented as mean and standard
deviation (n = 3).
8.4.1.4 Thermogravimetric analysis
Figure 8.3 shows that thermogravimetric curves for PLA, PLA/GNP-M and C 0.25 wt.% 0 M and
6 M are very similar, consisting of a single step between 300 °C and 370 °C, as expected for
PLA. [30] Temperatures of onset of intense thermal degradation, Td (shown in a figure inset), are
similar for undegraded samples, PLA/GNP-M showing a slightly higher value (2.6 °C more than
PLA). After biodegradation, Td decreases by about 10 °C in all samples.
8.4.2 Mechanical characterization
8.4.2.1 Tensile tests
Figure 8.4 shows that incorporation of 0.25 wt.% of GNP-C and M in PLA increased its Young’s
modulus by 14%. Also, tensile strength is increased by 20% with GNP-C incorporation and by
6% with GNP-M. Only with GNP-C is observed a considerable improvement in toughness (20%).
Best performance of GNP-C probably arises from its smaller dimensions. This may allow for
more effective dispersion and interaction with the polymer matrix.

Physical-chemical properties and biocompatibility of PLA/GBMs composites – effect of biodegradation
Artur M. Pinto – Jan 2017 213
Figure 8.3: TGA curves and temperatures of onset of intense thermal degradation (Td) for
PLA and composites before and after 6 months degradation in PBS at 37 °C and 100 rpm.
After 6 months degradation in PBS, no significant changes are observed in Young’s modulus for
all materials tested. However, decreases in tensile strength, elongation at break, and toughness are
considerably higher for PLA (2.6, 2.5, and 10-fold, respectively) comparing with PLA/GNP-M
(1.6, 1.8, and 3.3-fold), and PLA/GNP-C (1.4, 1.4 and 1.7-fold). Thus, the incorporation of both
fillers is improving PLA mechanical properties after 6 months degradation, being GNP-C the
most effective material in this sense.
8.4.2.2 Creep and recovery tests
Figure 8.5 shows that the materials present similar behaviour, with a relatively large instantaneous
increase of the strain upon load application, followed by a steady creep, and rapid strain recovery
after load removal. PLA after 6 months biodegradation presents the highest permanent creep
strain (ε∞), with a value of 0.029%, comparing with 0.016% for the non-degraded polymer. The
GNP-filled samples display similar ε∞ before and after biodegradation, varying between 0.01 and
0.014%.
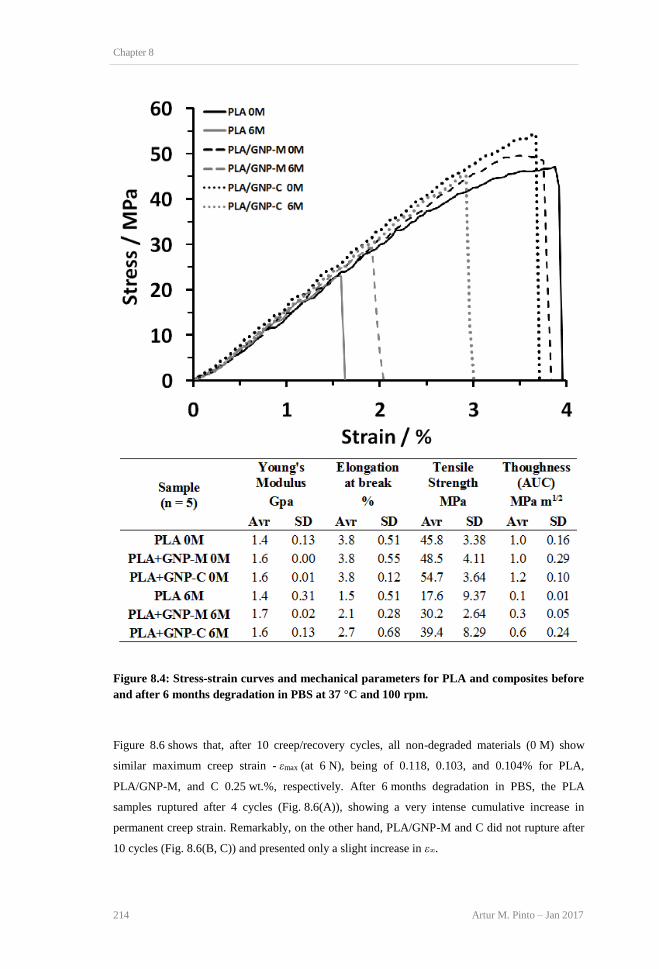
Chapter 8
214 Artur M. Pinto – Jan 2017
Figure 8.4: Stress-strain curves and mechanical parameters for PLA and composites before
and after 6 months degradation in PBS at 37 °C and 100 rpm.
Figure 8.6 shows that, after 10 creep/recovery cycles, all non-degraded materials (0 M) show
similar maximum creep strain - εmax (at 6 N), being of 0.118, 0.103, and 0.104% for PLA,
PLA/GNP-M, and C 0.25 wt.%, respectively. After 6 months degradation in PBS, the PLA
samples ruptured after 4 cycles (Fig. 8.6(A)), showing a very intense cumulative increase in
permanent creep strain. Remarkably, on the other hand, PLA/GNP-M and C did not rupture after
10 cycles (Fig. 8.6(B, C)) and presented only a slight increase in ε∞.
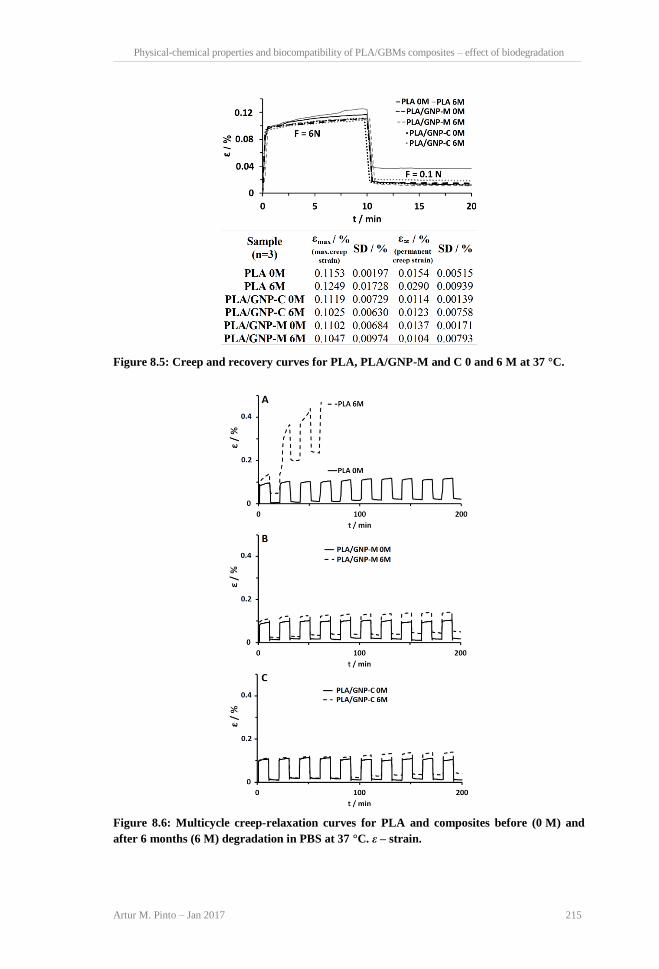
Physical-chemical properties and biocompatibility of PLA/GBMs composites – effect of biodegradation
Artur M. Pinto – Jan 2017 215
Figure 8.5: Creep and recovery curves for PLA, PLA/GNP-M and C 0 and 6 M at 37 °C.
Figure 8.6: Multicycle creep-relaxation curves for PLA and composites before (0 M) and
after 6 months (6 M) degradation in PBS at 37 °C. ε – strain.

Chapter 8
216 Artur M. Pinto – Jan 2017
8.4.3 Biocompatibility with human fibroblasts
Biocompatibility of PLA, PLA/GNP-M, and C 0.25 wt.% composites, and of their degradation
products after 6 months biodegradation in PBS at 37 °C at 100 rpm, was studied in terms of
effects on metabolic activity, cell death and morphology of human fibroblasts (HFF-1). Results
are presented below.
8.4.3.1 Biocompatibility of PLA and PLA/GNP materials
As presented in Figure 8.7(A), HFF-1 cells metabolic activity at PLA surface was 75% at 24 and
48 h, and 94% at 72 h, comparing with negative control for metabolic activity decrease - cells
incubated in DMEM. These differences are statistically significant (p < 0.05) at 24 and 48 h.
Also, positive control for metabolic activity decrease - cells incubated with Triton 0.1% in
DMEM, as expected presented almost no metabolic activity (<5% - data not shown). In
comparison with PLA, cell metabolic activity was maintained for PLA/GNP-M and PLA/GNP-C
(p > 0.05). Considering that a sample has cytotoxic potential if its metabolic activity is reduced to
less than 70% comparing to negative control for metabolic activity ISO 10993-5:2009(E) [32], it
can be observed from Fig. 8.7(A), that the incorporation of both fillers has no significant toxic
impact on metabolic activity of cells cultured at material’s surface, because it is always higher
than 70%.
Fig. 8.7(B) shows representative images for HFF-1 cells fluorescently labelled for LIVE/DEAD
assay. As expected, positive control of cell death (cells incubated with PLA/Triton 0.1 wt.% in
DMEM + for 72 h) unveils cell death close to 100%. Negative control was performed incubating
cells with DMEM, presenting mostly live cells with scarce dead cells. In agreement with
metabolic activity results, no considerable differences are observed between DMEM and PLA at
72 h (Fig. 8.7(B)). Also, there are no more dead cells at the surface of PLA/GNP-M and C than at
PLA surface.
Cells cultured at material’s surface were stained and observed after 72 h incubation in DMEM.
Immunofluorescence images (Fig. 8.7(C)) show that toxicity positive control cells, which were
incubated with triton 0.1%, presented disassembled cytoskeleton. Negative toxicity control,
performed with cells cultured in DMEM, exhibiting the typical “spindle” like shape of fibroblasts.
Also, cells incubated at the surface of PLA, PLA/GNP-M and C 0.25 wt.% had a normal
morphology, similar to negative control.

Physical-chemical properties and biocompatibility of PLA/GBMs composites – effect of biodegradation
Artur M. Pinto – Jan 2017 217
Figure 8.7: (A) HFF-1 cells viability at the surface of PLA, PLA/GNP-M and C 0.25 wt.%
cultured in DMEM, at 24, 48 and 72 h. Cell metabolic activity is represented as a percentage
in comparison with negative control for metabolic activity decrease - DMEM (100%).
Positive control for metabolic activity decrease – Triton 0.1% presented metabolic activity
below 5% (data not shown). Results are presented as the mean and standard deviation
(n = 6). The red line at 70%, marks the toxicity limit, according to ISO 10993-
5:2009(E). [31] * Statistically significantly different from the negative control (p < 0.05). All
samples were different from positive control – Triton 0.1% (p < 0.05). (B) LIVE/DEAD
Chapter 8
218 Artur M. Pinto – Jan 2017
staining of HFF-1 cells incubated at the surface PLA, PLA/GNP-M and C 0.25 wt.% for
72 h. Triton 0.1% in DMEM was used as toxicity positive control and DMEM as negative
control. Cytoplasm is stained with calcein – green, all nuclei with Hoechst 33342, and cells
with membrane integrity compromised were stained in the nucleus with propidium iodide
(PI) – red. The bottom line presents a phase-contrast image of the materials surface. Scale
bar represents 100 μm. (C) Immunofluorescence images of HFF-1 cells after 72 h culture at
the surface of PLA, PLA/GNP-M and C 0.25 wt.%. Triton 0.1% in DMEM was used as
positive control for changed morphology, and cells grown in DMEM as negative control.
Cells were stained with DAPI (nuclei) - blue and Phalloidin (F-actin in cytoskeleton) - green.
Scale bar represents 100 μm.
8.4.3.2 Biocompatibility of the degradation products
Negative control for metabolic activity decrease (DMEM 6 M) was performed with 50 μL PBS
6 M (37 °C, 100 rpm, 6 months) in 150 μL DMEM presenting similar cell metabolic activity to
degradation products of PLA after 6 months in PBS (PLA 6 M), tested in the same conditions,
which shows that those are not toxic. Metabolic activity of cells exposed to PLA 6 M comparing
with DMEM 6 M, were of 105, 96, and 100%, for 24, 48 and 72 h, respectively (Figure 8.8(A)),
with no significant differences being found overtime (p > 0.05). Also, degradation products of
PLA/GNP-M and C 0.25 wt.% 6 M are not toxic, comparing with DMEM 6 M (p > 0.05). For
PLA/GNP-M and C 6 M, respectively, metabolic activities comparing with PLA 6 M were of 84
and 93, 92 and 104, and 88 and 120%, for 24, 48 and 72 h, in the previous order.
Fig. 8.8(B) shows example images for HFF-1 cells fluorescently labelled for LIVE/DEAD assay.
Negative control for cell death (DMEM 6 M) was performed as described for metabolic activity
assay and presented mostly live cells with few red stained dead cells (Fig. 8.8(B)). Comparing
with cells incubated with 6 months degradation products of PLA 6 M, PLA/GNP-M and C 6 M
0.25 wt.%, no more dead cells were observed.
Cells morphology was evaluated by immunocytochemistry (Fig. 8(C)). Toxicity positive control
cells (Triton 0.1%) cytoskeleton was disassembled (results not shown - similar to Fig. 8.8(C)).
Negative control (DMEM 6 M), PLA 6 M, PLA/GNP-M and C 6 M 0.25 wt.% exhibited the
typical “spindle” like shape of fibroblasts.

Physical-chemical properties and biocompatibility of PLA/GBMs composites – effect of biodegradation
Artur M. Pinto – Jan 2017 219
Figure 8.8: (A) HFF-1 cells viability after incubation with 6 months degradation products of
PLA 6 M, PLA/GNP-M and C 6 M 0.25 wt.% cultured in DMEM+, at 24, 48 and 72 h. Cell
metabolic activity is represented as percentage in comparison with negative control for

Chapter 8
220 Artur M. Pinto – Jan 2017
metabolic activity decrease (100%) – DMEM 6 M – cells exposed to 50 μL PBS 6 M
(incubated 6 months at 37 °C at 100 rpm) in 150 μL DMEM. Positive control for metabolic
activity decrease – Triton 0.1% presented a metabolic activity below 5% (data not shown).
Results are presented as the mean and standard deviation (n = 6). The red line at 70%,
marks the toxicity limit, according to ISO 10993-5:2009(E). [31] There are no statistically
significant differences (p > 0.05) between samples, and between samples and negative
control (DMEM). (B) LIVE/DEAD staining of HFF-1 cells incubated with 6 months
degradation products of PLA 6 M, PLA/GNP-M and C 6 M 0.25 wt.% for 72 h. Triton 0.1%
was used as toxicity positive control (images not shown – similar to Fig. 8.7(B)). Negative
control was DMEM 6 M (50 μL PBS 6 M + 150 μL DMEM). Cytoplasm is stained with
calcein – green, all nuclei with Hoechst 33342, and cells with membrane integrity
compromised were stained in the nucleus with propidium iodide (PI) – red. Scale bar
represents 100 μm. (C) Representative immunofluorescence images of HFF-1 cells after
incubation for 72 h with PLA 6 M and PLA/GNP-M and C 6 M 0.25 wt.% degradation
products. Triton 0.1% was used as positive control for changed morphology (images not
shown – similar to Fig. 8.7(C)). Negative control was DMEM 6 M (50 μL PBS 6 M + 150 μL
DMEM). Cells were stained with DAPI (nuclei) - blue and Phalloidin (F-actin in
cytoskeleton) - green. Scale bar represents 100 μm.
8.5 Discussion
PLA and PLA/GNP-M and C 0.25 wt.% composites were studied in terms of chemical, physical,
mechanical and biocompatibility characteristics, before and after 6 months degradation. This time
period was considered because PLA is known to show an appreciable loss in strength during the
first 6 months of hydrolytic degradation, even though significant changes in mass only are
observed for much longer stages. [32] Maintaining the integrity of PLA mechanical properties
within the first 6 months of degradation is important regarding its biomedical applications,
namely orthopaedic, as discussed in the introduction.
FTIR spectra for PLA and composites (shown in Appendix C), before and after degradation, were
similar, indicating unchanged chemical structures. It must be noted that the low filler content does
not allow the detection of characteristic bands of GNP. Kong et al. also observed that
incorporation of small amounts (0.3–3 wt.%) of multiwalled carbon nanotubes in polyester
poly(caprolactone) did not change the pristine polymer FTIR spectra. [33] On the other hand, XRD
analysis of the composites revealed characteristic peaks corresponding to GNP-M and C. No
differences were observed after degradation, indicating that the fillers remained in the material.
SEM imaging of samples biodegraded for 6 months indicated evidence of surface erosion for
PLA and PLA/GNP-C. PLA samples with very low thickness (e.g. fibres) are expected to exhibit

Physical-chemical properties and biocompatibility of PLA/GBMs composites – effect of biodegradation
Artur M. Pinto – Jan 2017 221
bulk hydrolytic erosion due to fast water diffusion within the material compared to water-
mediated hydrolysis. [24] However, for the 500 μm thickness of the slabs tested in our work,
hydrolysis seems to have occurred more intensely near the surface. Effective polymer
biodegradation in all materials was confirmed by GPC-SEC, in terms of ��w decreased along time.
The intense decrease in molecular weight observed between 2 and 4 months may be due to bulk
erosion becoming more intense after water penetration in the material core. From this time range,
samples containing GNP-M and C presented higher decreases in molecular weight than pristine
PLA, which can be explained by defects caused by larger GNP agglomerates facilitating water
diffusion within PLA and subsequent degradation. The fact that only GNP-M samples showed
evidence of bulk degradation can be due to GNP-M agglomerates having larger sizes, resulting in
larger voids inside PLA matrix. Kontou et al. observed that after 3 months biodegradation,
PLA/montmorillonite and PLA/silica nanocomposites presented higher degradation rates than
pristine PLA. [34] They also propose that filler agglomerates create voids and cracks in PLA where
degradation can start. In contrast, Fukushima et al. [35, 36] observed that the addition of nanoclays
Cloisite 30B and Sepiolite S9 delayed the degradation of PLA at 37 °C due to induction of
polymer crystallization and/or by uptaking water, therefore preventing hydrolysis of the polymer
matrix.
Thermal properties of the materials are often influenced by fillers addition. It is interesting to note
that, before degradation, PLA/GNP-M yielded slightly higher molecular weight and
higher Td than PLA and PLA/GNP-C. One may hypothesize that this is due to GNP-M improving
thermal homogenization of the melt, minimizing the occurrence of hot-spots and consequent
polymer degradation during melt-blending and/or compression moulding. Liu et al. [37] reported a
similar effect with the incorporation of hydroxyapatite in PLA.
Tensile tests on the non-degraded materials revealed that the presence of the fillers improved
mechanical properties: Young’s modulus increased by about 14% with both fillers, while tensile
strength increased by 20% using GNP-C and by 6% using GNP-M. The smaller particle size of
GNP-C in relation to GNP-M, and consequent higher concentration of peripheral oxygen-
containing groups per surface area, may play a key role in improving filler/matrix compatibility
and thus providing the better mechanical performance observed at the same low loading.
Reinforcement of PLA with small amounts (<1 wt.%) of GNP-M15, using melt-blending and
adding epoxidized palm oil as a plasticizer, had been shown by Chienge et al. [38] to lead to
increases of about 27% in tensile strength. In a previous work, we have reinforced thin films of
PLA with GNP-M5. For a loading of 0.2 wt.%, close to the one used in the current work, Young’s
modulus and tensile strength increased by 6% and 5%, respectively, in unplasticized films, and by
7% and 21% in plasticized films. The optimal improvement was observed for 0.4 wt.%

Chapter 8
222 Artur M. Pinto – Jan 2017
loading. [17] However, solvent-mixing was used for preparing the composite, while melt-blending
was used here, taking into account the focus on the development of biocompatible materials.
An important finding in the current work is that incorporation of both GNP materials, at low
loadings, prevents significant decrease of PLA mechanical properties after 6 months degradation,
namely in terms of tensile strength, elongation at break and toughness. In addition, GNP-C
incorporation seems to have a more beneficial effect than GNP-M, especially in terms of
toughness.
Materials under cyclic loading typically fail at lower stress than under static conditions. Also, this
can induce physical ageing in viscoelastic materials like PLA. [39] Evaluation of mechanical
properties under these circumstances may be particularly important when orthopaedic applications
are considered, like bioabsorbable artificial ligaments. [25] The cyclic creep/recovery tests
performed in this work showed a significant decay in PLA performance after 6 months
degradation, while PLA/GNP-M and C displayed behaviours equivalent to the non-degraded
samples. The GNP fillers are therefore significantly counteracting the very negative effect of
biodegradation on PLA’s creep stability. This remarkable effect can be attributed to the fillers’
interaction with the PLA matrix, since the molecular weights have been observed to not be
significantly different for all materials after degradation. This may provide a strategy for tuning
PLA’s creep stability in biosorbable bioimplants. The effect of platelet-like fillers on improving
polymer creep stability has already been described by Faraz et al. [39] for clay platelets.
Zandiatashbar el al. [40] have also observed improvement in epoxy creep behaviour for graphene
loadings between 0.1–0.5 wt.%. In addition, Rafiee et al. [41] observed that low loadings (0.05–
0.5 wt.%) of graphene prevented crack propagation in epoxy polymers, increasing fracture
toughness. Interestingly, for the maximum number of cycles considered in our work, the
beneficial effect of GNP addition is only evident after biodegradation. It is possible that a
difference would be observable in non-degraded samples for a higher number of cycles.
Often, when encapsulated in a polymer matrix, graphene-based materials are not toxic. [42]
However, their biological effects should be studied to ensure safe use. Also, as the matrix
degrades, filler leaching takes place. Since GNP-M and GNP-C can be toxic at high
concentrations, respectively of 20 and 50 μg mL−1 [43], it is relevant to assure that no toxicity
occurs in biological degradation conditions, despite the fact that the amount of GNP present in the
composites is quite low (0.25 wt.%). The interaction of human fibroblasts with the materials’
surfaces was studied. In addition, cells were incubated with the degradation products resultant
from 6 months incubation is PBS at 37 °C and 100 rpm. To our knowledge, there are no studies
available simulating a prolonged extraction of these materials in physiological conditions,
mimicking what occurs during clinical use, providing an assessment of the hazard potential. No
Physical-chemical properties and biocompatibility of PLA/GBMs composites – effect of biodegradation
Artur M. Pinto – Jan 2017 223
toxicity was observed since there are no statistically significant differences (p > 0.05) between
samples (PLA 6 M, PLA/GNP-M and C 6 M), and between samples and negative control
(DMEM 6 M). Moreover, for all conditions, cells present low cell death and normal morphology,
when in contact with the degradation products. The same is observed for direct contact assay, in
which cells incubated at the surface of non-degraded materials. PLA at 24 and 48 h, presented
lower metabolic activity (p < 0.05) than negative control (DMEM), however, at 72 h both present
similar values (p > 0.05). This can occur due to PLA surface presenting less favourable
physicochemical properties (e.g. too hydrophobic) [44] than control surface, which is optimized for
cell culture, allowing faster cell attachment and growth in the first 48 h. Since our goal is to
compare PLA biological properties, before and after incorporation of the fillers, more important
was the fact that no significant differences (p > 0.05) were found between PLA and PLA/GNP-M
and C 0.25 wt.%. These results are similar to those we obtained for thinner PLA/GNP-M
0.4 wt.% films produced by solvent mixing followed by doctor blading [17], except that in that
case the effect of degradation was not studied. Yoon [45, 46] and Ma [47] et al. had already shown
incorporation of graphene oxide in low amounts (<2 wt.%) not to decrease PLA or PLGA, and
PLA/hydroxyapatite biocompatibility. Both latter authors used solvents to produce the
composites. On the other hand, Lahiri et al. [15] used electrostatic deposition to produce ultra-high
molecular weight polyethylene/GNP-M composites. Filler incorporation resulted in viability
decreases of 14% at 72 h with the addition of 0.1 wt.% GNP-M5, and of 69% with the
incorporation of 1 wt.%. The observed toxicity may have been caused by excessive GNP
concentration at the surface and/or rapid leaching, as a result of the production method used.
8.6 Conclusions
It was shown that addition of graphene nanoplatelets (grades GNP-M and GNP-C) to PLA at
low loadings (0.25 wt.%) by melt-mixing, not only produces composites with improved
mechanical properties, but also leads to a much lower decay in performance after 6 months
hydrolytic degradation when compared to unfilled PLA.
GNP-C incorporation seems to have a more beneficial effect than GNP-M, especially when
concerning the toughness of the composites after the degradation period. In addition, the
composites revealed high stability under cyclic creep-recovery testing, while unfilled PLA
exhibited a significant cumulative increase in permanent creep strain and ruptured after 4
cycles. This result is particularly relevant in the context of use in orthopaedic implants and

Chapter 8
224 Artur M. Pinto – Jan 2017
suture yarns. The nano-fillers were shown not to impair the polymer degradation process,
actually evidencing some acceleration of the molecular weight decrease.
Comparing with unfilled PLA, PLA/GNP-M and PLA/GNP-C composites allow similar
HFF-1 cell adhesion and growth at the surface before degradation, and after 6 months
degradation in physiological conditions, do not release toxic products towards human
fibroblasts.
Physical-chemical properties and biocompatibility of PLA/GBMs composites – effect of biodegradation
Artur M. Pinto – Jan 2017 225
8.7 References
1. R.E. Drumright, P.R. Gruber, D.E. Henton, Polylactic acid technology, Adv Mater 12
(2000) 1841-1846.
2. H.Y. Tian, Z.H. Tang, X.L. Zhuang, X.S. Chen, X.B. Jing, Biodegradable synthetic
polymers: Preparation, functionalization and biomedical application, Prog Polym Sci 37
(2012) 237-280.
3. L.W. Xiao, B.; Yang, G.; Gauthier, M., Poly(Lactic Acid)-Based Biomaterials:
Synthesis, Modification and Applications, in: D.N. Ghista (Ed.), Biomedical Science,
Engineering and Technology, INTECH, 2012.
4. I. Armentano, M. Dottori, E. Fortunati, S. Mattioli, J.M. Kenny, Biodegradable polymer
matrix nanocomposites for tissue engineering: A review, Polym Degrad Stabil 95
(2010) 2126-2146.
5. S. Ramakrishna, J. Mayer, E. Wintermantel, K.W. Leong, Biomedical applications of
polymer-composite materials: a review, Compos Sci Technol 61 (2001) 1189-1224.
6. B.D. Ratner, A. Hoffman, F. Schoen, J. Lemons, Biomaterials Science: An Introduction
to Materials in Medicine, third ed., Academic Press, 2012.
7. L. Cabedo, J.L. Feijoo, M.P. Villanueva, J.M. Lagaron, E. Gimenez, Optimization of
biodegradable nanocomposites based on aPLA/PCL blends for food packaging
applications, Macromol Symp 233 (2006) 191-197.
8. S.D. Park, M. Todo, K. Arakawa, M. Koganemaru, Effect of crystallinity and loading-
rate on mode I fracture behavior of poly(lactic acid), Polymer 47 (2006) 1357-1363.
9. M. Murariu, A.D. Ferreira, M. Pluta, L. Bonnaud, M. Alexandre, P. Dubois, Polylactide
(PLA)-CaSO4 composites toughened with low molecular weight and polymeric ester-
like plasticizers and related performances, Eur Polym J 44 (2008) 3842-3852.
10. J.H. Chang, Y.U. An, G.S. Sur, Poly(lactic acid) nanocomposites with various
organoclays. I. Thermomechanical properties, morphology, and gas permeability, J
Polym Sci Pol Phys 41 (2003) 94-103.
11. C.S. Wu, H.T. Liao, Study on the preparation and characterization of biodegradable
polylactide/multi-walled carbon nanotubes nanocomposites, Polymer 48 (2007) 4449-
4458.
12. V. Mittal, Polymer Layered Silicate Nanocomposites: A Review, Materials 2 (2009)
992-1057.
13. B.K. Kim, Graphene and graphene/polymer nanocomposites, Express Polym Lett 6
(2012) 772-772.
14. A.M. Pinto, J. Martins, J.A. Moreira, A.M. Mendes, F.D. Magalhaes, Dispersion of
graphene nanoplatelets in poly(vinyl acetate) latex and effect on adhesive bond strength,
Polym Int 62 (2013) 928-935.
15. D. Lahiri, R. Dua, C. Zhang, I. de Socarraz-Novoa, A. Bhat, S. Ramaswamy, A.
Agarwal, Graphene Nanoplatelet-Induced Strengthening of UltraHigh Molecular
Weight Polyethylene and Biocompatibility In vitro, Acs Appl Mater Inter 4 (2012)
2234-2241.
16. A.M. Pinto, J. Cabral, D.A.P. Tanaka, A.M. Mendes, F.D. Magalhaes, Effect of
incorporation of graphene oxide and graphene nanoplatelets on mechanical and gas
permeability properties of poly(lactic acid) films, Polym Int 62 (2013) 33-40.
17. A.M. Pinto, S. Moreira, I.C. Goncalves, F.M. Gama, A.M. Mendes, F.D. Magalhaes,
Biocompatibility of poly(lactic acid) with incorporated graphene-based materials,
Colloid Surface B 104 (2013) 229-238.
18. S. Lashgari, M. Karrabi, I. Ghasemi, H. Azizi, M. Messori, K. Paderni, Shape memory
nanocomposite of poly(L-lactic acid)/graphene nanoplatelets triggered by infrared light
and thermal heating, Express Polym Lett 10 (2016) 349-359.
19. L. Lei, J.H. Qiu, E. Sakai, Preparing conductive poly(lactic acid) (PLA) with
poly(methyl methacrylate) (PMMA) functionalized graphene (PFG) by admicellar
polymerization, Chem Eng J 209 (2012) 20-27.

Chapter 8
226 Artur M. Pinto – Jan 2017
20. C.L. Bao, L. Song, W.Y. Xing, B.H. Yuan, C.A. Wilkie, J.L. Huang, Y.Q. Guo, Y. Hu,
Preparation of graphene by pressurized oxidation and multiplex reduction and its
polymer nanocomposites by masterbatch-based melt blending, J Mater Chem 22 (2012)
6088-6096.
21. B.W. Chieng, N.A. Ibrahim, W.M.Z.W. Yunus, M.Z. Hussein, Y.Y. Then, Y.Y. Loo,
Effects of Graphene Nanoplatelets and Reduced Graphene Oxide on Poly(lactic acid)
and Plasticized Poly(lactic acid): A Comparative Study, Polymers-Basel 6 (2014) 2232-
2246.
22. E. Narimissa, R.K. Gupta, H.J. Choi, N. Kao, M. Jollands, Morphological, mechanical,
and thermal characterization of biopolymer composites based on polylactide and
nanographite platelets, Polym Composite 33 (2012) 1505-1515.
23. C.M. Agrawal, Fabrication and Characterization of PLA-PGA Orthopedic Implants,
Tissue Engineering 1 (1995) 245.
24. A.C. Vieira, J.C. Vieira, J.M. Ferra, F.D. Magalhaes, R.M. Guedes, A.T. Marques,
Mechanical study of PLA-PCL fibers during in vitro degradation, J Mech Behav
Biomed 4 (2011) 451-460.
25. A.C. Vieira, R.M. Guedes, A.T. Marques, Development of ligament tissue
biodegradable devices: A review, J Biomech 42 (2009) 2421-2430.
26. Y.Z. Wan, Y.L. Wang, X.H. Xu, Q.Y. Li, In vitro degradation behavior of carbon fiber-
reinforced PLA composites and influence of interfacial adhesion strength, J Appl Polym
Sci 82 (2001) 150-158.
27. Q. Zhou, M. Xanthos, Nanoclay and crystallinity effects on the hydrolytic degradation
of polylactides, Polym Degrad Stabil 93 (2008) 1450-1459.
28. K. Kalaitzidou, H. Fukushima, L.T. Drzal, Mechanical properties and morphological
characterization of exfoliated graphite-polypropylene nanocomposites, Compos Part a-
Appl S 38 (2007) 1675-1682.
29. C. Gonçalves, A.M. Pinto, A.V. Machado, J.A. Moreira, I.C. Gonçalves, F.D.
Magalhães, Biocompatible reinforcement of poly(lactic acid) with graphene
nanoplatelets, Polym Composite (2016) Article in press. DOI: 10.1002/pc.24050.
30. K. Das, D. Ray, I. Banerjee, N.R. Bandyopadhyay, S. Sengupta, A.K. Mohanty, M.
Misra, Crystalline Morphology of PLA/Clay Nanocomposite Films and Its Correlation
with Other Properties, J Appl Polym Sci 118 (2010) 143-151.
31. International Standards Organization. ISO 10993-5. Biological evaluation of medical
devices. Tests for in vitro cytotoxicity. Geneva: International Standards Organization,
2009.
32. L.S. Nair, C.T. Laurencin, Biodegradable polymers as biomaterials, Prog Polym Sci 32
(2007) 762-798.
33. Y.X. Kong, J. Yuan, Z.M. Wang, J. Qiu, Study on the preparation and properties of
aligned carbon nanotubes/polylactide composite fibers, Polym Composite 33 (2012)
1613-1619.
34. E. Kontou, P. Georgiopoulos, M. Niaounakis, The role of nanofillers on the degradation
behavior of polylactic acid, Polym Composite 33 (2012) 282-294.
35. K. Fukushima, C. Abbate, D. Tabuani, M. Gennari, G. Camino, Biodegradation of
poly(lactic acid) and its nanocomposites, Polym Degrad Stabil 94 (2009) 1646-1655.
36. R. Al-Itry, K. Lamnawar, A. Maazouz, Improvement of thermal stability, rheological
and mechanical properties of PLA, PBAT and their blends by reactive extrusion with
functionalized epoxy, Polym Degrad Stabil 97 (2012) 1898-1914.
37. X.X. Liu, T.X. Wang, L.C. Chow, M.S. Yang, J.W. Mitchell, Effects of Inorganic
Fillers on the Thermal and Mechanical Properties of Poly(lactic acid), Int J Polym Sci
(2014).
38. B.W. Chieng, N.A. Ibrahim, W.M.Z.W. Yunus, M.Z. Hussein, V.S.G. Silverajah,
Graphene Nanoplatelets as Novel Reinforcement Filler in Poly(lactic acid)/Epoxidized
Palm Oil Green Nanocomposites: Mechanical Properties, Int J Mol Sci 13 (2012)
10920-10934.
Physical-chemical properties and biocompatibility of PLA/GBMs composites – effect of biodegradation
Artur M. Pinto – Jan 2017 227
39. M.I. Faraz, N.A.M. Besseling, A.V. Korobko, S.J. Picken, Characterization and
Modeling of Creep Behavior of a Thermoset Nanocomposite, Polym Composite 36
(2015) 322-329.
40. A. Zandiatashbar, C.R. Picu, N. Koratkar, Control of Epoxy Creep Using Graphene,
Small 8 (2012) 1676-1682.
41. M.A. Rafiee, J. Rafiee, I. Srivastava, Z. Wang, H.H. Song, Z.Z. Yu, N. Koratkar,
Fracture and Fatigue in Graphene Nanocomposites, Small 6 (2010) 179-183.
42. A.M. Pinto, I.C. Goncalves, F.D. Magalhaes, Graphene-based materials
biocompatibility: A review, Colloid Surface B 111 (2013) 188-202.
43. A.M. Pinto, C. Goncalves, D.M. Sousa, A.R. Ferreira, J.A. Moreira, I.C. Goncalves,
F.D. Magalhaes, Smaller particle size and higher oxidation improves biocompatibility
of graphene-based materials, Carbon 99 (2016) 318-329.
44. X.D. Yang, H.M. Li, M. Chen, X.H. Zou, L.Y. Zhu, C.J. Wei, G.Q. Chen, Enhanced
insulin production from murine islet beta cells incubated on poly(3-hydroxybutyrate-co-
3-hydroxyhexanoate), J Biomed Mater Res A 92A (2010) 548-555.
45. O.J. Yoon, C.Y. Jung, I.Y. Sohn, H.J. Kim, B. Hong, M.S. Jhon, N.E. Lee,
Nanocomposite nanofibers of poly(D, L-lactic-co-glycolic acid) and graphene oxide
nanosheets, Compos Part a-Appl S 42 (2011) 1978-1984.
46. O.J. Yoon, I.Y. Sohn, D.J. Kim, N.E. Lee, Enhancement of thermomechanical
properties of poly(D,L-lactic-co-glycolic acid) and graphene oxide composite films for
scaffolds, Macromol Res 20 (2012) 789-794.
47. H.B. Ma, W.X. Su, Z.X. Tai, D.F. Sun, X.B. Yan, B. Liu, Q.J. Xue, Preparation and
cytocompatibility of polylactic acid/hydroxyapatite/graphene oxide nanocomposite
fibrous membrane, Chinese Sci Bull 57 (2012) 3051-3058.

Chapter 8
228 Artur M. Pinto – Jan 2017

Advances in GBMs and their composites with focus on biomedical application
Artur M. Pinto – Jan 2017 229
Chapter 9
General discussion

Chapter 9 – General discussion
230 Artur M. Pinto – Jan 2017
Advances in GBMs and their composites with focus on biomedical application
Artur M. Pinto – Jan 2017 231
9 GENERAL DISCUSSION
9.1 Scope
Despite results already have been discussed in each chapter of this thesis, a brief general
discussion of the most relevant results is performed in this section, in the light of the most
recently available literature reports. The points discussed are the effects of GBMs physical-
chemical properties on biocompatibility, the effect of their surface modification with polymers,
and the effect of encapasulating them in a polymer matrix. The production methods, mechanical
performance before and after degradation, and biocompatibility of PLA/GBMs composites are
also discussed. Finally, pertinent questions, potential applications, and promising approaches are
discussed taking into account the most recent reports found in literature.
9.2 Discussion
From the results presented on chapter 3 and 4, we can conclude that all GBMs (in powder form)
tested caused low hemolysis (< 2.5 %) even when considering very high concentrations as 500 µg
mL-1. Smaller size, oxidation, and surface adsorption of PVA and HEC further reduced the
hemolysis ratio. This can be explained by those materials presenting less sharp edges to cause
membrane damages on erythrocytes. Comparison was already performed with works that also
state the low hemolytic potential of some GBMs [1] and its further reduction by introduction of
oxygen-containing functional groups [2] or surface adsorption of a polymer [3] at their surface. A
recent study presents an interesting approach to further evaluation of GBMs hemocompatibility. It
reports the use of a microfluidic system for the evaluation of blood clot formation under dynamic
flow. It reveals that both albumin and fibrinogen adsorb well on the surface of GO, and that GO
can be functionalized with albumin to enhance its antithrombotic effect. [4] On chapter 6, it is
demonstrated that when in presence of plasma proteins, the number of activated platelets in
PLA/GNP-M films is significantly lower than that in PLA and PLA/GO films. This can be
explained by the presence of hydrophobic GNP at the surface of the films, favoring protein
adsorption at the material surface. This blocks platelet activation in case of these proteins being

Chapter 9 – General discussion
232 Artur M. Pinto – Jan 2017
albumin, which is generally the first to adhere because of its abundance in plasma and its small
size. These results are supported by a recent study that states and demonstrates that mono or few
layer graphene coated nitinol substrates, present a reduced fibrinogen/albumin ratio relative to
pristine nitinol, which is correlated with low platelet adhesion and thrombus formation. [5] A
different work reports that a mixed matrix membrane of GO-polyvinylpyrrolidone in a
polyetherimide matrix, greatly enhances protein adsorption resistance, suppressing platelet
adhesion, lowering complement activation, and prolonging clotting time. [6] It was also reports
that the incorporation of GO-g-2-methacryloyloxyethyl phosphorylcholine in polyurethane results
in improved resistance to nonspecific protein adsorption and platelet adhesion. [7] These later
works point out interesting strategies to further improve the antithrombotic properties of the
PLA/GNP composites that we produced.
Chapters 3 and 4 also show that GNP-C, which exhibits smaller sizes, is generally more
biocompatible in vitro than GNP-M. The sharper and longer edges of GNP-M platelets cause
membrane damages on cells, being cytotoxic above 20 μg mL−1. GNP-C, despite being
internalized without causing membrane damages, increases ROS levels, being toxic above
50 μg mL−1. The complete oxidation of GNP-M (GNP-M-ox-1:6) folds its sharp edges, assuring
biocompatibility until the highest concentration tested (100 μg mL−1). GNP-M-ox-1:6 has an
oxygen content of 24% (attributed mostly to carboxyls and hydroxyls) and is dispersible in water
by sonication, revealing potential to be used for biomedical purposes. Generally, oxidation is
more important than size, since more oxidized GNP-M performs better than smaller GNP-C.
GNP-C-PVA can be used at concentrations up to 100 μg mL−1, whereas GNP-C can only be used
up to concentrations of 50 μg mL−1. This difference can be explained by PVA encapsulating and
agglomerating GNP-C platelets, thereby decreasing the internalization and interaction with HFF-1
cells that lead to ROS production. HEC favours internalization of small GNP-C particles, having
the opposite effect regarding ROS levels. For these reasons, modification with HEC, in contrast to
PVA, is counter-productive regarding increasing the biocompatibility of GNP-C with fibroblasts.
Comparison was already performed with related works in which it was also observed that
oxidation [3] and adsorption of polymers [8, 9] at the surface of GBMs usually improve their
biocompatibility. In Chapter 2, it was stated that “an interesting aspect that is lacking from
existing studies has to do with the effect of particle size (length and thickness) on the
biocompatibility of GBMs with similar chemical properties. In addition, there are no references in
the literature regarding the effect of GBMs surface charge on biocompatibility.” Fortunately, new
data has arisen more recently. A comprehensive study reports preparation of small (HD = 330
nm), larger GO (HD = 2007 nm), and graphene coated with BSA (HD = 1179 nm) or pluronic
(PF108) (HD = 2007 nm) to enable dispersion in aqueous solution. In vitro characterization
revealed that none of the GBMs caused toxicity (reduction of cell viability below 70%), but both
GOs triggered the production of inflammation mediators in cell lines. Also, all GBMs, except

Advances in GBMs and their composites with focus on biomedical application
Artur M. Pinto – Jan 2017 233
graphene coated with PF108, induce pulmonary fibrosis when administered by oropharyngeal
aspiration in mice at 2 mg Kg-1, with large GO providing the strongest response. [10] A different
study also shows that small sized GO (hydrodynamic diameter (HD) = 243 nm) presents lower
toxicity in mice for intravenous multiple-low-dose exposure, than large GO (HD = 914 nm). [11]
In vitro studies revealed that GO with different sizes and thickness caused no toxicity when in
contact with cells, up to the highest concentrations tested (80 µg mL-1 or higher). [12, 13] However,
GNP with larger diameter, thickness, and lower surface charge, caused toxicity above 40 µg mL-1.
Also, considerable increases were observed in ROS productions, being those higher for GOs,
which presented smaller sizes than GNP. [12] The observations from abovementioned works,
regarding lower toxicity of smaller GBMs, are consistent with what is observed in Chapter 3 and
4, regarding lower toxicity of smaller sized GNP-C, in comparison with GNP-M. The finding that
GBMs that are non-toxic to cell lines can induce inflammation, both in vitro and in vivo, [10]
indicates that the GBMs that we tested should be evaluated in similar assays.
Chapter 2 states that “encapsulation [of GBMs] in a polymer matrix modifies biological
interactions”. This was studied on Chapter 6 by incorporating GO and GNP-M in PLA by solvent
casting, with improvement of mechanical and biological properties of the polymer matrix being
achieved, and no toxicity caused by the embed fillers being observed. Chapters 7 and 8 explore a
melt-blending approach for production of PLA/GBMs composites, which does not require the use
of potentially toxic solvents. Firstly, the best filler loading, mixing time, and mixing intensity are
identified. Then, physical-chemical characterization of PLA/GNP-C and M 0.25 wt.% composites
is performed, with focus on mechanical performance, before and after degradation in PBS at 37
°C during 6 months, and biocompatibility of the biomaterials and their degradation products
tested in vitro. It is observed that GBMs incorporation in PLA not only produces composites with
improved mechanical properties, but also leads to a much lower decay in performance after
6 months hydrolytic degradation when compared to unfilled PLA. GNP-C incorporation seems to
have a more beneficial effect than GNP-M, especially when concerning the toughness of the
composites after the degradation period. In addition, the composites reveal high mechanical
stability under cyclic creep-recovery testing, while unfilled PLA exhibits a significant cumulative
increase in permanent creep strain and ruptures after only 4 cycles. This result is particularly
relevant in the context of use in orthopaedic implants and suture yarns. The nano-fillers are shown
not to impair the polymer degradation process, actually evidencing some acceleration of the
molecular weight decrease. Comparing with unfilled PLA, PLA/GNP-M and PLA/GNP-C
composites allow similar HFF-1 cell adhesion and growth at the surface before degradation, and
after 6 months degradation in PBS, do not release toxic products towards human fibroblasts. A
recent study confirms that GNP-C improves PLA stiffness and elasticity. However, the
composites are produced by solution mixing followed by compression moulding, and the amounts
of fillers tested are much higher than those we used: 3 and 6 wt.%. Also, surface modification of

Chapter 9 – General discussion
234 Artur M. Pinto – Jan 2017
GNP-C with 12-aminododecanoic acid, a zwitterionic surfactant, enhances the composites
performance by improving GNP-C dispersion and interaction with PLA matrix. [14] Thus, this is
an approach to take in consideration for further improvement of the mechanical performance of
our materials. Another work uses GNP-C, at 1 and 5 wt.% loadings, to improve the stiffness of
Bioflex™, a commercial biodegradable polymer-blend based on PLA and a copolyester. [15] A
different study shows that with the incorporation of low amounts of GNP-M (0.3 wt.%), the
tensile strength of PLA plasticized with epoxidized palm oil (EPO) is increased. This occurs
because GNP-M is uniformly dispersed in the PLA/EPO matrix, with no aggregation being
observed. [16] The same authors show a slight reduction of the number of gram positive and
negative bacteria at the composites surface, comparing with PLA. [17] This underlines the
potential of GBMs as antibacterial fillers for PLA and other biopolymers, and reinforces the idea
that we can do further work in this field. State of the art approaches report the production of
polymer/graphene 3D printable composites. [18-20] One of those studies shows that 3D printed
PLA/graphene 10 wt.% composites show improved mechanical and thermomechanical properties
compared to PLA. This technology is promising regarding production of materials with tailored
properties for several applications, including orthopedics and tissue engineering. [18] A
comprehensive study demonstrates that a polylactide-co-glycolide/graphene (d = 5-20 µm, t = 3-8
layers) 3D composite material is mechanically robust and flexible, presenting considerable
electrical conductivity. These scaffolds support human mesenchymal stem cell (hMSC) adhesion,
viability, proliferation, and neurogenic differentiation with significant upregulation of glial and
neuronal genes. Also, in vivo experiments indicate that the materials are biocompatible until 30
days implantation, with no evidence of graphene particles presence in the kidney, liver, or spleen.
Surgical tests using a human cadaver nerve model revealed that the materials present exceptional
handling characteristics, can be intraoperatively manipulated, and applied to fine surgical
procedures. [19] An interesting question regarding biodegradable polymer/GBMs composites is the
fate that GBMs might have after the polymer matrix is degraded. An in vivo study in mouse,
developed until 3 months, reports biodegradation by macrophages of carboxyl-functionalized
single layer graphene with a lateral size between 150 and 200 nm, which aggregates, 24 hours
post injection, into larger clusters up to 10 µm. Despite this positive insight regarding the
possibility of some GBMs being naturally degraded by the body, further studies are needed to
understand the mechanisms that lead to biodegradation, which characteristics of the GBMs make
them more prone to it, like for example, surface properties, dimensions, and concentrations. This
knowledge would allow the selection and modification of GBMs properties to maximize their
long-term biocompatibility, which would surely result in valuable outcomes, both regarding their
potential applications as fillers of composite materials or when freely dispersed as particles.
Advances in GBMs and their composites with focus on biomedical application
Artur M. Pinto – Jan 2017 235
Previously it was mentioned that GNP-C particles present less toxicity than GNP-M to human
cells. Also, oxidation and surface modification of GNP-C with PVA was proposed for further
reduction of its toxicity. Since PLA/GNP-C composites perform better in terms of mechanical
properties than PLA/GNP-M ones, testing GNP-C-ox, and GNP-C-ox-PVA as fillers for PLA
may be an interesting approach. Despite there being no evidence of in vitro toxicity of the
PLA/GBMs composites that we produced, it is uncertain if the GBMs would trigger in vitro or in
vivo inflammation after being released, while the matrix degrades. For that reason, it is always
important to further improve the biocompatibility/biotolerability of the GBMs, while
simultaneously conferring surface properties that allow good dispersibility within the polymer
matrix.

Chapter 9 – General discussion
236 Artur M. Pinto – Jan 2017
References
1. A. Sasidharan, L.S. Panchakarla, A.R. Sadanandan, A. Ashokan, P. Chandran, C.M. Girish,
D. Menon, S.V. Nair, C.N.R. Rao, M. Koyakutty, Hemocompatibility and Macrophage
Response of Pristine and Functionalized Graphene, Small 8 (2012) 1251-1263.
2. D. Xu, N.L. Zhou, J.A. Shen, Hemocompatibility of Carboxylic Graphene Oxide, Chem J
Chinese U 31 (2010) 2354-2359.
3. K.H. Liao, Y.S. Lin, C.W. Macosko, C.L. Haynes, Cytotoxicity of Graphene Oxide and
Graphene in Human Erythrocytes and Skin Fibroblasts, Acs Appl Mater Inter 3(7) (2011)
2607-2615.
4. Kenry, K.P. Loh, C.T. Lim, Molecular Hemocompatibility of Graphene Oxide and Its
Implication for Antithrombotic Applications, Small 11 (2015) 5105-5117.
5. R. Podila, T. Moore, F. Alexis, A.M. Rao, Graphene coatings for enhanced hemo-
compatibility of nitinol stents, Rsc Adv 3 (2013) 1660-1665.
6. N.J. Kaleekkal, A. Thanigaivelan, M. Durga, R. Girish, D. Rana, P. Soundararajan, D.
Mohan, Graphene Oxide Nanocomposite Incorporated Poly(ether imide) Mixed Matrix
Membranes for in vitro Evaluation of Its Efficacy in Blood Purification Applications, Ind
Eng Chem Res 54 (2015) 7899-7913.
7. S.X. Jin, N.L. Zhou, D. Xu, Y. Wu, Y.D. Tang, C.Y. Lu, J. Zhang, J. Shen, Synthesis and
anticoagulation activities of polymer/functional graphene oxide nanocomposites via
Reverse Atom Transfer Radical Polymerization (RATRP), Colloid Surface B 101 (2013)
319-324.
8. M. Wojtoniszak, X.C. Chen, R.J. Kalenczuk, A. Wajda, J. Lapczuk, M. Kurzewski, M.
Drozdzik, P.K. Chu, E. Borowiak-Palen, Synthesis, dispersion, and cytocompatibility of
graphene oxide and reduced graphene oxide, Colloid Surface B 89 (2012) 79-85.
9. L.Z. Feng, S.A. Zhang, Z.A. Liu, Graphene based gene transfection, Nanoscale 3 (2011)
1252-1257.
10. X. Wang, M.C. Duch, N. Mansukhani, Z.X. Ji, Y.P. Liao, M.Y. Wang, H.Y. Zhang, B.B.
Sun, C.H. Chang, R.B. Li, S.J. Lin, H. Meng, T. Xia, M.C. Hersam, A.E. Nel, Use of a Pro-
Fibrogenic Mechanism-Based Predictive Toxicological Approach for Tiered Testing and
Decision Analysis of Carbonaceous Nanomaterials, Acs Nano 9 (2015) 3032-3043.
11. J.H. Liu, T.C. Wang, H.F. Wang, Y.G. Gu, Y.Y. Xu, H. Tang, G. Jia, Y.F. Liu,
Biocompatibility of graphene oxide intravenously administrated in mice-effects of dose,
size and exposure protocols, Toxicol Res-Uk 4 (2015) 83-91.
12. M. Kucki, P. Rupper, C. Sarrieu, M. Melucci, E. Treossi, A. Schwarz, V. Leon, A.
Kraegeloh, E. Flahaut, E. Vazquez, V. Palermo, P. Wick, Interaction of graphene-related
materials with human intestinal cells: an in vitro approach, Nanoscale 8 (2016) 8749-8760.
13. D.A. Jasim, N. Lozano, K. Kostarelos, Synthesis of few-layered, high-purity graphene
oxide sheets from different graphite sources for biology, 2d Mater 3 (2016).
14. M. Keramati, I. Ghasemi, M. Karrabi, H. Azizi, M. Sabzi, Dispersion of Graphene
Nanoplatelets in Polylactic Acid with the Aid of a Zwitterionic Surfactant: Evaluation of
the Shape Memory Behavior, Polym-Plast Technol 55 (2016) 1039-1047.
15. L. Botta, R. Scaffaro, M.C. Mistretta, F.P. La Mantia, Biopolymer Based Nanocomposites
Reinforced with Graphene Nanoplatelets, Aip Conf Proc 1736 (2016).
16. B.W. Chieng, I.N. Azowa, Y.Y. Then, Y.Y. Loo, Plasticized and Nanofilled Poly(lactic
acid) Nanocomposites: Mechanical, Thermal and Morphology Properties, Materials Science
Forum 846 (2016) 429-433.
17. B.W. Chieng, N.A. Ibrahim, W.M.Z. Yunus, M.Z. Hussein, Y.Y. Then, Y.Y. Loo,
Reinforcement of graphene nanoplatelets on plasticized poly(lactic acid) nanocomposites:
Mechanical, thermal, morphology, and antibacterial properties, J Appl Polym Sci 132
(2015).
18. K. Prashantha, F. Roger, Multifunctional properties of 3D printed poly(lactic
acid)/graphene nanocomposites by fused deposition modeling, J Macromol Sci A 54 (2017)
24-29.

Advances in GBMs and their composites with focus on biomedical application
Artur M. Pinto – Jan 2017 237
19. A.E. Jakus, E.B. Secor, A.L. Rutz, S.W. Jordan, M.C. Hersam, R.N. Shah, Three-
Dimensional Printing of High-Content Graphene Scaffolds for Electronic and Biomedical
Applications, Acs Nano 9 (2015) 4636-4648.
20. X.J. Wei, D. Li, W. Jiang, Z.M. Gu, X.J. Wang, Z.X. Zhang, Z.Z. Sun, 3D Printable
Graphene Composite, Sci Rep-Uk 5 (2015).

Chapter 10 – General conclusions and Future work
238 Artur M. Pinto – Jan 2017
Advances in GBMs and their composites with focus on biomedical applications
Artur M. Pinto – Jan 2017 239
Chapter 10
General conclusions and
Future work

Chapter 10 – General conclusions and Future work
240 Artur M. Pinto – Jan 2017

Advances in GBMs and their composites with focus on biomedical applications
Artur M. Pinto – Jan 2017 241
10 CONCLUSIONS AND FUTURE WORK
10.1 General conclusions
• The effect of size and thickness on GBMs in vitro biocompatibility was evaluated using
two different GNP grades. GNP-M platelets were larger and sharper, causing membrane
damages on cells in concentrations higher than 20 mg mL-1. GNP-C is internalized due
to its small size, inducing ROS production that leads to mild toxicity in concentrations
higher than 50 mg mL-1, from which the cells can recover along time. GNP-M toxic
effects can be avoided by extensive oxidation (GNP-M-ox-1:6), which folds its sharp
edges, preventing membrane damages. GNP-M-ox-1:6 has an oxygen content of 24%
(mostly carboxyls and hydroxyls) and is dispersible in water by sonication, revealing
potential to be used for biomedical purposes.
• All the GBMs tested cause low haemolysis (<2.5%) up to 500 μg mL−1. This decreases
further after oxidation and polymer adsorption, the best results being obtained with
PVA and HEC.
• Surface adsorption of PVA to GNP-C platelets encapsulates and agglomerates them,
thereby decreasing the internalization and interaction with cells that lead to ROS
production and toxicity. When coated with HEC, small GNP-C particles present higher
internalization, which increases ROS levels and toxicity. For these reasons, PVA
surface adsorption improves GNP-C biocompatibility, while the use of HEC is counter-
productive.
• A method for evaluation of GBMs degree of dispersion in PLA matrix by Raman
spectroscopy was developed and implemented.
• Incorporation of 0.4 wt.% loadings of GO and GNP-M in PLA by solvent mixing
followed by doctor blading changes the surface topography, and wettability of the

Chapter 10 – General conclusions and Future work
242 Artur M. Pinto – Jan 2017
composite films. Additionally, the incorporation of GO in PLA films, slightly increases
the metabolic activity of cells adhered at their surface. GNP-M incorporation, on the
other hand, decreases platelet activation at the films surface. This might be relevant for
bioapplications that involve contact with blood.
• The dispersion of GNP-M and C in PLA by melt-blending, in amounts as low as 0.25
wt.%, improves its mechanical properties under cyclic creep-recovery testing after
degradation under physiological conditions during 6 months. This is relevant for several
PLA applications, as for example production of orthopaedic implants and suture yarns.
PLA/GNP-C composites present a general better mechanical performance than
PLA/GNP-M composites.
• The incorporation of 0.25 wt.% loadings of GNP-M and C in PLA films, produced by
melt-blending, does not cause toxiciy to HFF-1 cells in direct contact with their
surfaces. Both before degradation, and after 6 months degradation in physiological
conditions. Also, the degradation products of those composites are not toxic for human
fibroblasts.
10.2 Ongoing and Future work
• Following the promising results obtained with PLA/GNP-M composites, in vivo
biocompatibility studies in BALB/c mice have already been initiated at University of
Washington in Prof. Buddy Ratner’s Lab. PLA, PLA/GNP-M and C 0.25 wt.%
composites were implanted subcutaneously in mice during 3 weeks. The materials were
explanted and embed in paraffin. This work was not included in this thesis since the
histological analysis is not yet available. After analyzing these results it will be decided
if long term assays are needed to access biocompatibility of the composites, and
particularly of GBMs that may eventually be released from PLA matrix as it degrades.
• Since GNP-M complete oxidation improves its biocompatibility, it would be an
interesting approach to apply on GNP-C. Also, modification with PVA, which is
effective for GNP-C, could be tried after its oxidation for further improvement of its
biocompatibility. If those materials prove non-toxic and non-inflammatory, they can be

Advances in GBMs and their composites with focus on biomedical applications
Artur M. Pinto – Jan 2017 243
tested as fillers of PLA. Despite there being no evidence of in vitro toxicity of the
PLA/GBMs composites that we produced, it is uncertain if the GBMs would trigger in
vitro or in vivo inflammation after being released, while the matrix degrades. For that
reason, it is always important to further improve the biocompatibility/biotolerability of
the GBMs, and if possible simultaneously conferring them surface properties that allow
better dispersion and compatibility with the polymer matrix, which would reflect on
increased mechanical performance.
• GBMs have been described to have antibacterial effect, and a study reports that
PLA/GNP-M plasticized with epoxidized palm oil has antibacterial activity against both
gram negative and gram positive bacteria. Thus, testing the antibacterial properties of
GBMs, and modifying them to increase it, as well as producing and optimizing
PLA/GBMs composites for the same effect is one of our future goals.
• Recent studies report the production of polymer/GBMs composite 3D printed
structures. This technology is promising regarding production of materials with tailored
properties for several applications, including in orthopedics and tissue engineering.
• Since incorporation of GBMs has been described to confer electrical conductivity to
PLA, development of electrically conductive PLA composites materials to stimulate
tissue regeneration is an interesting perspective, even more so when associated with 3D
printing of biomaterials.
11 Appendices
244 Artur M. Pinto – Jan 2017
Advances in GBMs and their composites with focus on biomedical applications
Artur M. Pinto – Jan 2017 245
11 APPENDICES
APPENDIX A
SUPPLEMENTARY MATERIAL FOR CHAPTER 3
SMALLER PARTICLE SIZE AND HIGHER OXIDATION IMPROVES
BIOCOMPATIBILITY OF GRAPHENE-BASED MATERIALS
247
APPENDIX B
SUPPLEMENTARY MATERIAL FOR CHAPTER 4
POLYMER SURFACE ADSORPTION AS A STRATEGY TO IMPROVE THE
BIOCOMPATIBILITY OF GRAPHENE NANOPLATELETS
257
APPENDIX C
SUPPLEMENTARY MATERIAL FOR CHAPTER 8
EFFECT OF BIODEGRADATION ON THERMO-MECHANICAL PROPERTIES AND
BIOCOMPATIBILITY OF POLY(LACTIC ACID)/GRAPHENE NANOPLATELETS
COMPOSITES
267

11 Appendices
246 Artur M. Pinto – Jan 2017
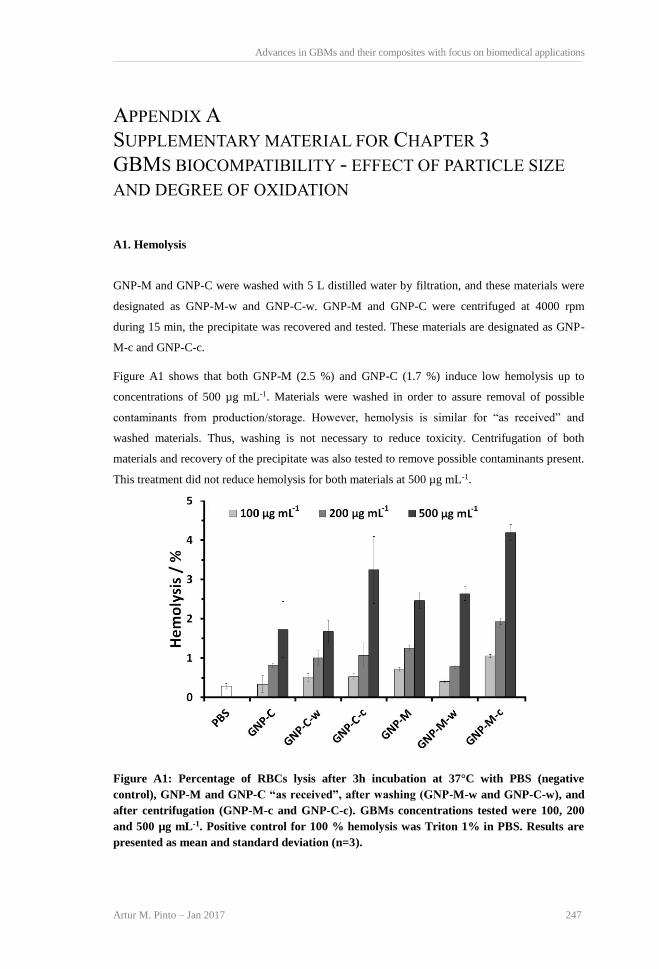
Advances in GBMs and their composites with focus on biomedical applications
Artur M. Pinto – Jan 2017 247
APPENDIX A
SUPPLEMENTARY MATERIAL FOR CHAPTER 3
GBMS BIOCOMPATIBILITY - EFFECT OF PARTICLE SIZE
AND DEGREE OF OXIDATION
A1. Hemolysis
GNP-M and GNP-C were washed with 5 L distilled water by filtration, and these materials were
designated as GNP-M-w and GNP-C-w. GNP-M and GNP-C were centrifuged at 4000 rpm
during 15 min, the precipitate was recovered and tested. These materials are designated as GNP-
M-c and GNP-C-c.
Figure A1 shows that both GNP-M (2.5 %) and GNP-C (1.7 %) induce low hemolysis up to
concentrations of 500 µg mL-1. Materials were washed in order to assure removal of possible
contaminants from production/storage. However, hemolysis is similar for “as received” and
washed materials. Thus, washing is not necessary to reduce toxicity. Centrifugation of both
materials and recovery of the precipitate was also tested to remove possible contaminants present.
This treatment did not reduce hemolysis for both materials at 500 µg mL-1.
Figure A1: Percentage of RBCs lysis after 3h incubation at 37°C with PBS (negative
control), GNP-M and GNP-C “as received”, after washing (GNP-M-w and GNP-C-w), and
after centrifugation (GNP-M-c and GNP-C-c). GBMs concentrations tested were 100, 200
and 500 µg mL-1. Positive control for 100 % hemolysis was Triton 1% in PBS. Results are
presented as mean and standard deviation (n=3).

11 Appendices
248 Artur M. Pinto – Jan 2017
A2. Cell morphology
Phase contrast images were obtained for each incubation time and concentration. Examples
images for 24, 48, 72h for 10 and 50 µg mL-1 are shown in Figure A2. Materials deposited in
wells bottom and are in contact with the cells, however it is imperceptible whether they penetrate
cell membrane or not. To clarify this question, HFF-1 cells incubated with materials were
analysed by TEM (see section 3.4.1.2.2.2). The increase of materials concentration, leads to more
accumulation at cell membrane (Fig. A2). GNP-C, possesses agglomerates with smaller size after
sedimentation, than GNP-M. Also, GNP-M-ox-1:3 and GNP-M-ox-1:6 have larger agglomerates
in well bottom and in contact with cells than GNP-M, with less isolated particles being observed.

Advances in GBMs and their composites with focus on biomedical applications
Artur M. Pinto – Jan 2017 249
Figure A2: Optical microscopy images of HFF-1 cells in DMEM+ and incubated with 10
and 50 µg mL-1 (left and right column, respectively) of GNP-C, GNP-M, GNP-M-ox-1:3 and
1:6 for 72h. Scale bar represents 100 µm.

11 Appendices
250 Artur M. Pinto – Jan 2017
A3. Cytotoxicity
Figure A3: Fluorescence intensities from resazurin assay for HFF-1 cells incubated with
DMEM+ (control) and GBMs from 1-100 µg mL-1 for 24, 48 and 72h. Results are presented
as mean and standard deviation (n=6). PhC images show the density of cells incubated in
DMEM+ at 24, 48, and 72h. Scale bar represents 100 µm. Immunofluorescence images show
cell density for cells incubated with DMEM+ and 100 µg mL-1 GBMs at 24 and 72h. Scale
bar represents 200 µm.

Advances in GBMs and their composites with focus on biomedical applications
Artur M. Pinto – Jan 2017 251
Figure A4: LIVE/DEAD staining of HFF-1 cells incubated with 100 µg mL-1 GBMs for 72h.
Triton 0.1 wt.% in DMEM+ was used as toxicity positive control and cells cultured in
DMEM+ as negative control. Cytoplasm is stained with calcein – green. Cells with
membrane integrity compromised were stained in the nucleus with propidium iodide – red.
Scale bar represents 200 µm.
Figure A5: Ki-67 expression (Ki-67+ - positive) for HFF-1 cells incubated with GBMs in
DMEM+ at 24, 48, and 72h. Results are presented as mean and standard deviation (n=3).

11 Appendices
252 Artur M. Pinto – Jan 2017
Significant differences (p < 0.05) comparing with control without GBMs (DMEM+) are
represent by Ø. Example of the images used to calculate Ki-67 expression (Ki-67+ - green, all
nuclei - red) for HFF-1 cells incubated with DMEM+ and respective negative control
without primary antibody (- control) at 24, 48 and 72h. Scale bar represents 200 µm.
Figure A6: Mitochondrial membrane potential (ΔΨm - MMP) as % of negative control for
MMP decrease – HFF-1 cells cultured in DMEM+, for positive control for MMP decrease -
cells exposed to CCCP 20 µM for 15 min (ΔΨm = 19.7%), and GBMs for concentrations
between 10-100 µg mL-1, for 48h. Results are presented as mean and standard deviation
(n=3). Statistically significant differences, analysed within each concentration are
represented by c – GNP-C, m – GNP-M, 1:3 – GNP-M-ox-1:3, 1:6 – GNP-M-ox-1:6.
Symbols represented above a sample concentration indicate that sample is different (p <
0.05) from samples represented by the symbols for that concentration. Samples different
from DMEM+ are signalled for each concentration as Ø (p < 0.05). Immunofluorescence
images of HFF-1 cells incubated with controls performed with culture medium (DMEM+,
48h) and CCCP 20 µM for 15 min. Nuclei are stained with Hoechst 33342.
Figure A6, shows that only cells incubated with the protonophore carbonyl cyanide m-
chlorophenylhydrazone (CCCP) 20 µM for 15 min, present very low red staining, because CCCP
uncouples mitochondrial electron transfer decreasing membrane potential. This compound
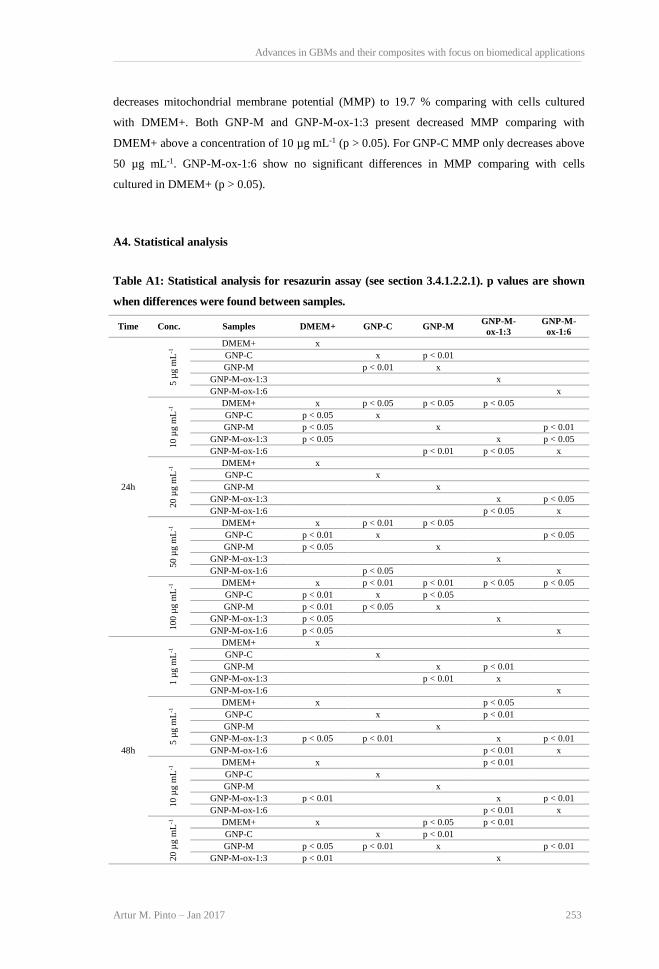
Advances in GBMs and their composites with focus on biomedical applications
Artur M. Pinto – Jan 2017 253
decreases mitochondrial membrane potential (MMP) to 19.7 % comparing with cells cultured
with DMEM+. Both GNP-M and GNP-M-ox-1:3 present decreased MMP comparing with
DMEM+ above a concentration of 10 µg mL-1 (p > 0.05). For GNP-C MMP only decreases above
50 µg mL-1. GNP-M-ox-1:6 show no significant differences in MMP comparing with cells
cultured in DMEM+ (p > 0.05).
A4. Statistical analysis
Table A1: Statistical analysis for resazurin assay (see section 3.4.1.2.2.1). p values are shown
when differences were found between samples.
Time Conc. Samples DMEM+ GNP-C GNP-M GNP-M-
ox-1:3
GNP-M-
ox-1:6
24h
5 µ
g m
L-1
DMEM+ x
GNP-C
x p < 0.01
GNP-M
p < 0.01 x
GNP-M-ox-1:3
x
GNP-M-ox-1:6
x
10
µg
mL
-1 DMEM+ x p < 0.05 p < 0.05 p < 0.05
GNP-C p < 0.05 x
GNP-M p < 0.05
x
p < 0.01
GNP-M-ox-1:3 p < 0.05
x p < 0.05
GNP-M-ox-1:6
p < 0.01 p < 0.05 x
20
µg
mL
-1 DMEM+ x
GNP-C
x
GNP-M
x
GNP-M-ox-1:3
x p < 0.05
GNP-M-ox-1:6
p < 0.05 x
50
µg
mL
-1 DMEM+ x p < 0.01 p < 0.05
GNP-C p < 0.01 x
p < 0.05
GNP-M p < 0.05
x
GNP-M-ox-1:3
x
GNP-M-ox-1:6
p < 0.05
x
10
0 µ
g m
L-1
DMEM+ x p < 0.01 p < 0.01 p < 0.05 p < 0.05
GNP-C p < 0.01 x p < 0.05
GNP-M p < 0.01 p < 0.05 x
GNP-M-ox-1:3 p < 0.05
x
GNP-M-ox-1:6 p < 0.05
x
48h
1 µ
g m
L-1
DMEM+ x
GNP-C
x
GNP-M
x p < 0.01
GNP-M-ox-1:3
p < 0.01 x
GNP-M-ox-1:6
x
5 µ
g m
L-1
DMEM+ x
p < 0.05
GNP-C
x
p < 0.01
GNP-M
x
GNP-M-ox-1:3 p < 0.05 p < 0.01
x p < 0.01
GNP-M-ox-1:6
p < 0.01 x
10
µg
mL
-1 DMEM+ x
p < 0.01
GNP-C
x
GNP-M
x
GNP-M-ox-1:3 p < 0.01
x p < 0.01
GNP-M-ox-1:6
p < 0.01 x
20
µg
mL
-1
DMEM+ x
p < 0.05 p < 0.01
GNP-C
x p < 0.01
GNP-M p < 0.05 p < 0.01 x
p < 0.01
GNP-M-ox-1:3 p < 0.01
x

11 Appendices
254 Artur M. Pinto – Jan 2017
GNP-M-ox-1:6
p < 0.01
x
50 µ
g m
L-1
DMEM+ x
p < 0.01 p < 0.01
GNP-C
x p < 0.01
GNP-M p < 0.01 p < 0.01 x
p < 0.01
GNP-M-ox-1:3 p < 0.01
x
GNP-M-ox-1:6
p < 0.01
x
100 µ
g m
L-1
DMEM+ x p < 0.05 p < 0.01 p < 0.01
GNP-C p < 0.05 x
GNP-M p < 0.01
x
p < 0.01
GNP-M-ox-1:3 p < 0.01
x p < 0.01
GNP-M-ox-1:6
p < 0.01 p < 0.01 x
72h
1 µ
g m
L-1
DMEM+ x
GNP-C
x p < 0.05
GNP-M
p < 0.05 x p < 0.05 p < 0.01
GNP-M-ox-1:3
p < 0.05 x
GNP-M-ox-1:6
p < 0.01
x
5 µ
g m
L-1
DMEM+ x p < 0.05
GNP-C p < 0.05 x p < 0.01
GNP-M
p < 0.01 x
p < 0.05
GNP-M-ox-1:3
x
GNP-M-ox-1:6
p < 0.05
x
10
µg
mL
-1 DMEM+ x
p < 0.05 p < 0.05
GNP-C
x p < 0.05
GNP-M p < 0.05 p < 0.05 x
p < 0.01
GNP-M-ox-1:3 p < 0.05
x p < 0.01
GNP-M-ox-1:6
p < 0.01 p < 0.01 x
20
µg
mL
-1 DMEM+ x
GNP-C
x
GNP-M
x
p < 0.05
GNP-M-ox-1:3
x
GNP-M-ox-1:6
p < 0.05
x
50
µg
mL
-1 DMEM+ x
p < 0.01 p < 0.01 p < 0.05
GNP-C
x p < 0.01 p < 0.05 p < 0.01
GNP-M p < 0.01 p < 0.01 x
p < 0.01
GNP-M-ox-1:3 p < 0.01 p < 0.05
x p < 0.01
GNP-M-ox-1:6 p < 0.05 p < 0.05 p < 0.01 p < 0.01 x
10
0 µ
g m
L-1
DMEM+ x
p < 0.01 p < 0.01 p < 0.05
GNP-C
x p < 0.01 p < 0.05 p < 0.05
GNP-M p < 0.01 p < 0.01 x
p < 0.01
GNP-M-ox-1:3 p < 0.01 p < 0.05
x p < 0.01
GNP-M-ox-1:6 p < 0.05 p < 0.05 p < 0.01 p < 0.01 x

Advances in GBMs and their composites with focus on biomedical applications
Artur M. Pinto – Jan 2017 255
A5. Biocompatibility with HPMEC cells
Figure A7: HPMEC cells viability after incubation with GBMs in M199+, at 24, and 72 h.
Cell metabolic activity is represented as percentage in comparison with cells cultured in
M199+ (100 %). Results are presented as mean and standard deviation (n=6). The red line
at 70%, marks the toxicity limit, according to ISO 10993-5:2009(E). Statistically significant
differences, analysed within each concentration between all GBMs are represented by c –
GNP-C, m – GNP-M, 1:3 – GNP-M-ox-1:3 (differences were only found comparing with
GNP-M-ox-1:6); Differences comparing with M199+ are represented by Ø. Significant
differences were considered for p < 0.05.
Considering that a sample has cytotoxic potential if its metabolic activity is reduced to less than
70 % comparing to negative control for metabolic activity decrease - cells incubated with M199+
[ISO 10993-5:2009(E)], it can be observed from Figure A7 that GNP-C is toxic at 24 h for
concentrations above 20 µg mL-1. However, cell metabolic activity recovered over time, and at 72
h toxicity is only observed above 50 µg mL-1. For GNP-M and GNP-M-ox-1:3, toxicity occurs at
24 h above 10 µg mL-1. At 72 h, toxicity is observed above 20 µg mL-1 for GNP-M-ox-1:3 and at
10 µg mL-1 for GNP-M. GNP-M-ox-1:6 reveals no toxicity until the higher concentration tested
of 100 µg mL-1 (p < 0.05). These results are in agreement with results from resazurin assay for
HHF-1 cells, since GNP-M and GNP-M-ox-1:3 are the most toxic materials, while GNP-M-ox-
1:6 shows no toxicity. Also, GNP-C shows initial mild toxicity which is almost recovered over
time.

11 Appendices
256 Artur M. Pinto – Jan 2017
Figure A8: Optical microscopy images of HPMEC cells in culture medium (M199+) at 24
and 72h, and incubated for 72h with 10 and 50 µg mL-1 (left and right column, respectively)
of GNP-C, GNP-M, GNP-M-ox-1:3 and 1:6. Scale bar represents 100 µm.
Advances in GBMs and their composites with focus on biomedical applications
Artur M. Pinto – Jan 2017 257
APPENDIX B
SUPPLEMENTARY MATERIAL FOR CHAPTER 4
GBMS BIOCOMPATIBILITY - EFFECT OF POLYMER
SURFACE ADSORPTION
B1. Materials and methods
X-ray photoelectron spectroscopy (XPS) The XPS analysis of GBMs powders tablets (d = 10
mm) was performed at CEMUP (Centro de Materiais da Universidade do Porto) using a
ESCALAB 200A, VG Scientific (UK) with PISCES software for data acquisition and analysis.
For analysis, an achromatic Al (K) X-ray source (1486.6 eV) operating at 15kV (300 W) was
used, and the spectrometer, calibrated with reference to Ag 3d5/2 (368.27 eV), was operated in
constant analyser energy mode with a pass energy of 20 eV for regions of interest, and 50 eV in
survey. The core levels for O 1s and C 1s were analysed. The photoelectron take-off angle (the
angle between the surface of the sample and the axis of the energy analyser) was 90°. The
electron gun used focused on the specimen in an area close to 100 mm2. Data acquisition was
performed with a pressure lower than 1x10⁶ Pa. The effect of the electric charge was corrected by
the reference of the carbon peak (285 eV). The deconvolution of spectra was performed with the
XPSPEAK41 program, in which a peak fitting was performed using Gaussian-Lorentzian peak
shape and Shirley type background subtraction.
Raman spectroscopy The unpolarized Raman spectra of GBMs powders were obtained under
ambient conditions, in several positions for each sample. The linear polarized 514.5 nm line of an
Ar+ laser was used as excitation. The Raman spectra were recorded in a backscattering geometry
by using a confocal Olympus BH-2 microscope with a 50x objective. The spatial resolution is
about 2 μm, and laser power was 15 mW. The scattered radiation was analysed using a Jobin–
Yvon T64000 triple spectrometer, equipped with a charge-coupled device. The diameter of
analysis was 10 µm and the spectral resolution better than 4 cm–1.
The spectra were quantitatively analysed by fitting a sum of damped oscillator to the experimental
data, according to the equation:
(1)
N
j ojoj
ojoj
ojATnBTI1
22222
2
)()),(1()(),(
11 Appendices
258 Artur M. Pinto – Jan 2017
Here n(ω,T) is the Bose-Einstein factor: Aoj, Ωoj, and τoj are the strength, wave number and
damping coefficient of the j-th oscillator, respectively, and B(ω) is the background. In this work,
the background was well simulated by a linear function of the frequency, which enable us to
obtain reliable fits of the equation (1) to the experimental data. The fitting procedure was
performed for all Raman bands collected from the same sample, but in different positions. This
procedure allows us to determine the average and standard deviation (SD) values of the phonon
parameters, namely the wave number and intensity. [1]
Thermogravimetric analysis (TGA) The thermal stability of the samples was determined with a
Netzsh STA 449 F3 Jupiter device. Sample amounts ranged from 10 to 12 mg. The thermograms
were recorded between 50 and 800 °C at a heating rate of 10 °C min-1 under nitrogen flow.
Scanning electron microscopy (SEM) The morphology of GBMs was observed at CEMUP
using SEM (FEI Quanta 400FEG, with an acceleration voltage of 3 kV). Powders of the
nanomaterials were applied on conductive carbon strips for visualization.
Immunocytochemistry Cells in each well exposed to 50 µg mL-1 of GBMs (at 100 µg mL-1
GBMs interfere with staining and images had worse quality) were washed with PBS. Then,
fixation was performed with paraformaldehyde (PFA - Merck) 4 wt.% in PBS for 15 minutes.
PFA was removed, the cells washed with PBS and stored at 4 °C. Cell cytoskeletal filamentous
actin can be visualized by binding of fluorescent phalloidin and the nucleus can be stained with
4′,6-Diamidino-2-phenylindole dihydrochloride (DAPI) that intercalates with nucleic acids. Cell
membrane was permeabilized with triton X-100 0.1 wt.% at 4 °C for 5 min. Washing was
performed with PBS and incubation performed with a phalloidin (Alexa Fluor 488; Molecular
Probes) solution in PBS in a 1:80 dilution, during 20 min in the dark. After rinsing with PBS, a
DAPI (Sigma Aldrich) solution at a concentration of 3 µg mL-1 was added to each well and
incubated for 15 min in the dark. Finally, the cells were washed and kept in PBS to avoid drying.
Plates with adherent cells were observed in an inverted fluorescence microscope (Carl Zeiss –
Axiovert 200).
B2. Results
B2.1. Physical-chemical characterization
Figure B1(A) shows a nanoplatelet of pristine GNP-C. After adsorption of PVA or HEC, platelet
agglomerates become more evident, as shown in Fig. B1(B, C), for GNP-C-PVA and GNP-C-
HEC, respectively. Polymer presence on the GNP-C surface was confirmed by other methods as
shown below.

Advances in GBMs and their composites with focus on biomedical applications
Artur M. Pinto – Jan 2017 259
Figure B1: SEM images of dry powder of GNP-C (A – 100 000x), GNP C-PVA (B – 40
000x), and GNP-C-HEC (C – 20 000x).
XPS results (Figure B2(A)) reveal that treatment of GNP-C (which has atomic percentage of
oxygen – O (at.%) < 4 %) with polymers increases the final O (at.%). The highest increases are
for GNP-C-PVA and HEC, being above 10 %. These results confirm the adsorption of all
polymers onto the GNP-C surface.
As seen in Figure B2(B), the Raman spectra obtained for the GBMs powders are similar. The D-
band, located between 1270–1450 cm−1, is assigned to the carbon lattice disorder typical of crystal
edges and defects in the graphene network. The G-band close to 1580 cm-1 is associated with sp2
hybridization. [2, 3] From the fitting procedure, we have calculated the intensity of the observed
Raman bands. It is well established that the ratio between the intensities of the D- and G-bands,
ID/G, can be used to characterize the defect degree in graphene materials and to evaluate
multilayered graphene crystallite size. [2] Usually, the D band is absent or weak on the surface of
graphene sheets and intense at their edges. [3] GNP modified with all polymers presents a less
intense D-band than pristine GNP-C. This occurs because the latter is less agglomerated and is
not covered with polymer, thus, more edges are present in the analysis site, which leads to a more
intense signal. [3] This result further confirms the presence of polymers at the GNP-C surface,
already evidenced before by laser diffraction, SEM and XPS.
Thermograms for the GBMs are shown in Figure B2(C). GNP-C modified with polymers starts to
lose weight at lower temperatures (approximately 250 °C) than pristine GNP-C, which presents
little weight loss (GNP-C = 13.8 wt.%), mostly above 400 °C. These temperatures seem to be in
the range of the temperature of onset of intense degradation for the polymers used. [4, 5] As an
example, GNP-C-PVA and HEC lose, respectively, approximately 35 and 29 wt.% until 800 °C.
Taking into account the mass lost by pristine GNP-C up to that temperature, it can be concluded
that the total amount of PVA and HEC polymers on the GNP-C surface is 21 % and 15 %,
respectively.

11 Appendices
260 Artur M. Pinto – Jan 2017
Figure B2: A) XPS spectra and atomic composition of GBMs powders for the core level C
1s. B) Representative unpolarized Raman spectra and intensity ratio of the (D/G) bands for
GBMs powders. The results are presented as the mean and standard deviation (n=3). C)
TGA curves and weight loss for GBMs powders.

Advances in GBMs and their composites with focus on biomedical applications
Artur M. Pinto – Jan 2017 261
B2.2. GBMs dispersion in culture medium
Phase contrast images were obtained for each incubation time and concentration tested. Example
images for DMEM+ at 24 and 72 h, and for all GBMs at 72 h for concentrations of 10 and 50 µg
mL-1 are shown in Figure B3. The materials deposited in well bottoms and are in contact with the
cells, however it is imperceptible whether they penetrate the cell membrane or not. To clarify this
question, HFF-1 cells incubated with materials were analyzed by TEM (Figure 4.4 – Chapter 4).
An increase of materials concentration leads to more accumulation at the cell membrane (Fig).
GNP-C possesses agglomerates with smaller size after sedimentation than GNP-C-PVA or HEC.
Moreover, GNP-C-PVA has larger agglomerates than GNP-C-HEC, and both results are in
agreement with laser scattering results (Fig. 4.1 – Chapter 4).
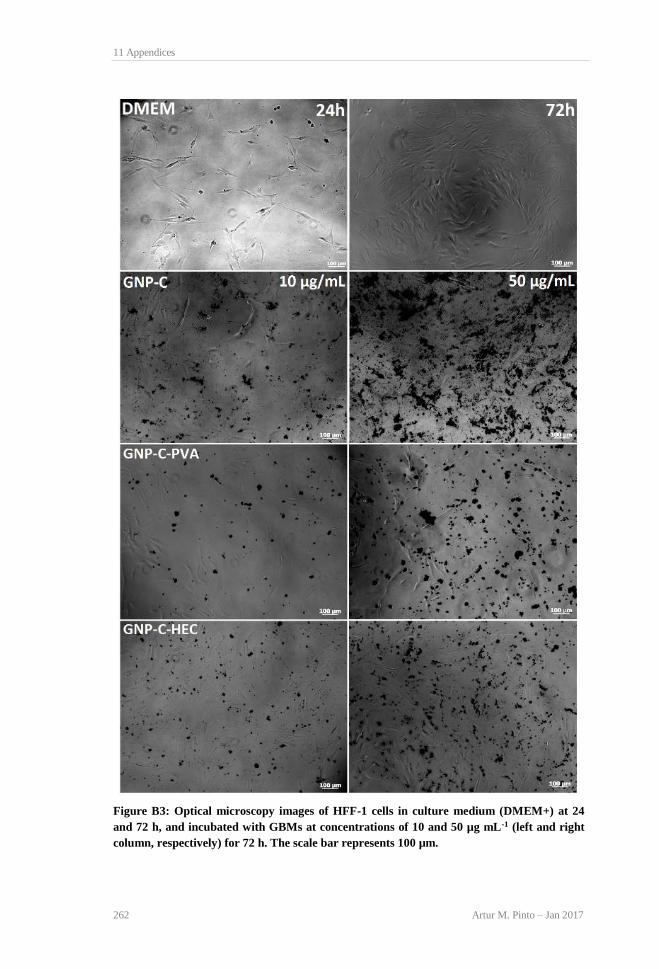
11 Appendices
262 Artur M. Pinto – Jan 2017
Figure B3: Optical microscopy images of HFF-1 cells in culture medium (DMEM+) at 24
and 72 h, and incubated with GBMs at concentrations of 10 and 50 µg mL-1 (left and right
column, respectively) for 72 h. The scale bar represents 100 µm.

Advances in GBMs and their composites with focus on biomedical applications
Artur M. Pinto – Jan 2017 263
S 3. Cytotoxicity
Figure B4: LIVE/DEAD staining of HFF-1 cells incubated with 100 µg mL-1 GBMs for 72 h.
Triton 0.1 wt.% in DMEM+ was used as a toxicity positive control and cells cultured in
DMEM+ as a negative control. Cytoplasm is stained with calcein – green. Cells with
compromised membrane integrity were stained in the nucleus with propidium iodide – red.
The scale bar represents 200 µm.
B2.4 Cell morphology
After the resazurin assays, cells in each well exposed to 50 µg mL-1 of GBMs were stained and
observed (at 100 µg mL-1 GBMs interfere with staining and images had lower quality).
Immunofluorescence images (Figure B5) show that for toxicity positive controls (triton 0.1 % and
DMSO 10 % in DMEM+), the cell cytoskeleton was disassembled. A control was performed with
cells cultured in DMEM+, which exhibited typical “spindle” like shape of fibroblasts. After 72 h
of incubation with 50 µg mL-1 GNP-C, GNP-C-PVA or HEC, cells exhibit normal morphology
similar to the negative control. These results are in agreement with those observed in the
cytotoxicity assays (see Chapter 4) at 72 h for all materials because in these conditions, no
considerable metabolic decrease or cell death is observed.

11 Appendices
264 Artur M. Pinto – Jan 2017
Figure B5: Representative immunofluorescence images of HFF-1 cells after 72 h incubation
with 50 µg mL-1 GBMs. Triton 0.1 % and DMSO 10 % in DMEM+ were used as a positive
control and cells grown in DMEM+ as a negative control. Cells were stained with DAPI
(nucleus) blue and Phalloidin (F-actin in cytoskeleton) - green. The scale bar represents 200
µm.
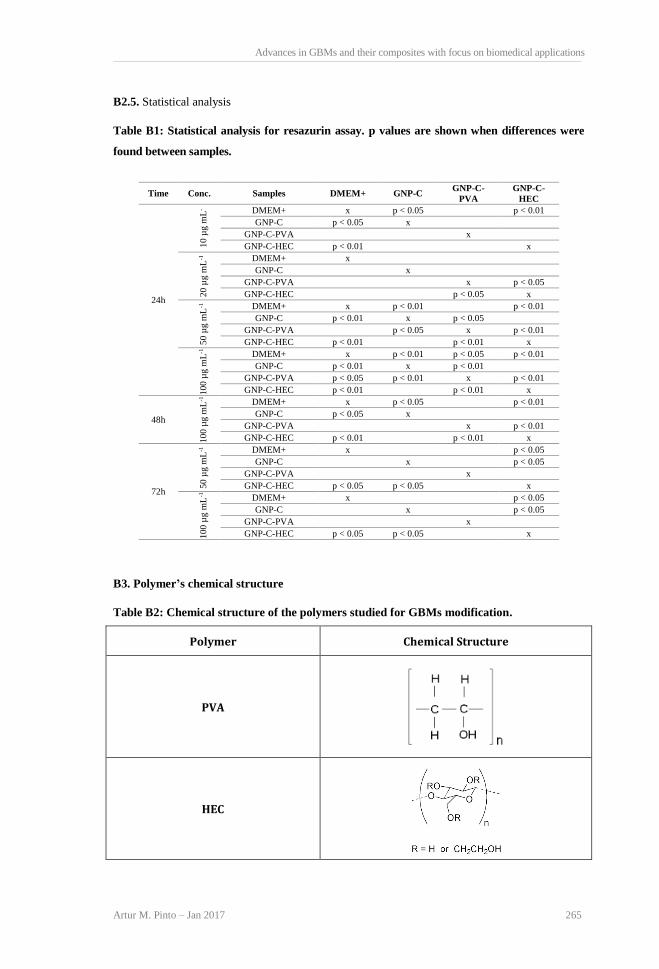
Advances in GBMs and their composites with focus on biomedical applications
Artur M. Pinto – Jan 2017 265
B2.5. Statistical analysis
Table B1: Statistical analysis for resazurin assay. p values are shown when differences were
found between samples.
Time Conc. Samples DMEM+ GNP-C GNP-C-
PVA
GNP-C-
HEC
24h
10 µ
g m
L-
DMEM+ x p < 0.05
p < 0.01
GNP-C p < 0.05 x
GNP-C-PVA
x
GNP-C-HEC p < 0.01
x
20
µg m
L-1
DMEM+ x
GNP-C
x
GNP-C-PVA
x p < 0.05
GNP-C-HEC
p < 0.05 x
50
µg
mL
-1
DMEM+ x p < 0.01
p < 0.01
GNP-C p < 0.01 x p < 0.05
GNP-C-PVA
p < 0.05 x p < 0.01
GNP-C-HEC p < 0.01
p < 0.01 x
10
0 µ
g m
L-1
DMEM+ x p < 0.01 p < 0.05 p < 0.01
GNP-C p < 0.01 x p < 0.01
GNP-C-PVA p < 0.05 p < 0.01 x p < 0.01
GNP-C-HEC p < 0.01
p < 0.01 x
48h
10
0 µ
g m
L-1
DMEM+ x p < 0.05 p < 0.01
GNP-C p < 0.05 x
GNP-C-PVA
x p < 0.01
GNP-C-HEC p < 0.01
p < 0.01 x
72h
50
µg
mL
-1
DMEM+ x
p < 0.05
GNP-C
x p < 0.05
GNP-C-PVA x
GNP-C-HEC p < 0.05 p < 0.05 x
10
0 µ
g m
L-1
DMEM+ x
p < 0.05
GNP-C
x p < 0.05
GNP-C-PVA x
GNP-C-HEC p < 0.05 p < 0.05 x
B3. Polymer’s chemical structure
Table B2: Chemical structure of the polymers studied for GBMs modification.
Polymer Chemical Structure
PVA
HEC

11 Appendices
266 Artur M. Pinto – Jan 2017
PEG
PVP
CON
GLU
HA
B4. References
1. J.A. Moreira, A. Almeida, M.R. Chaves, M.L. Santos, P.P. Alferes, Raman spectroscopic study
of the phase transitions and pseudospin phonon coupling in sodium ammonium sulphate
dehydrate, Phys Rev B 76 (2007).
2. A.C. Ferrari, Raman spectroscopy of graphene and graphite: Disorder, electron-phonon
coupling, doping and nonadiabatic effects, Solid State Commun 143 (2007) 47-57.
3. M.A. Pimenta, G. Dresselhaus, M.S. Dresselhaus, L. G. Cançado, A. Jorio, R. Saito, Studying
disorder in graphite-based systems by Raman spectroscopy, Phys Chem Chem Phys, 9 (2007)
1276-1291.
4. H.-B. Chen, E. Hollinger, Y.-Z. Wang, D.A. Schiraldi, Facile fabrication of poly(vinyl alcohol)
gels and derivative aerogels, Polymer 55 (2014) 380-384.
5. R. Russo, M. Abbate, M. Malinconico, G. Santagata, Effect of polyglycerol and the
crosslinking on the physical properties of a blend alginate-hydroxyethylcellulose, Carbohydr
Polym 84 (2010) 1061-1067.

Advances in GBMs and their composites with focus on biomedical applications
Artur M. Pinto – Jan 2017 267
APPENDIX C
SUPPLEMENTARY MATERIAL FOR CHAPTER 8
PHYSICAL-CHEMICAL PROPERTIES AND
BIOCOMPATIBILITY OF PLA/GBMS COMPOSITES -
EFFECT OF BIODEGRADATION
C1. Fillers distribution in PLA matrix
Figure C1 shows the number of agglomerates per unit of area (mm2) as a function of apparent
particle sizes, for different PLA/GNP-M and C 0.25 wt.%, evaluated by direct measurements on
several SEM images collected for each material, using ImageJ software. [1] Both GNP-C and M
are well exfoliated in PLA matrix. GNP-C presents apparent particle sizes mostly bellow 2 µm, in
agreement with the maximum nanoplatelet diameters reported by the manufacturer. GNP-M
presents a fraction of material with sizes above 2.5 µm, corresponding to the visible nanoplatelets
with lateral dimensions of about 5 µm and some small agglomerates.
Figure C1. Example of SEM images of samples broken under liquid nitrogen, showing
fillers distribution on PLA matrix. Number of agglomerates per unit of area (mm2) as a
function of agglomerate length, for PLA/GNP-C and M 0.25 wt.%.

11 Appendices
268 Artur M. Pinto – Jan 2017
C2. Fourier Transform Infrared Spectroscopy
Figure C2, shows spectra typical for PLA, with peaks correspondent to alkyl C-H stretches being
observed from 3000-2850 cm-1, and the C=O stretching region appearing around 1750 cm-1. A
band at 1450 cm-1 attributed to CH3 is found. The C-H deformation and asymmetric bands are
present at 1380, and 1355 cm-1. The C-O stretching modes of the ester groups are present around
1178 cm-1. A band correspondent to C-O-C asymmetric stretching is present around 1078 cm-1,
and C-O alkoxy stretching vibration mode is at 1060 cm-1. Also, a band correspondent to C- CH3
vibrations is present around 1041 cm-1. Bands at 865, and 754 cm-1 are attributed to the
amorphous and crystalline phase of PLA, respectively. [2] FTIR spectra for PLA, and composites
before and after degradation are similar.
Figure C2: FTIR spectra for PLA and composites before and after degradation during 6
months in PBS at 37 °C and 100 rpm.
C3. X-ray Diffraction
X-ray diffraction analysis, confirmed the presence of GNP in the PLA matrix. Figure C3 shows
that GNP-M and C powders present similar XRD spectra, typical of graphitic materials [3], with
an intense peak around 31°, and two broad peaks around 50° and 65°. GNP-M presents a more
intense peak at 31º because it has a higher number of stacked graphene sheets per platelet than
GNP-C, thus having different planes contributing to the same diffraction. [4] PLA, before (0M)
and after the 6 months (6M) biodegradation period, presents similar typical spectra, with two
broad peaks. The first, around 20°, is more intense than the second, around 35°. [5] PLA/GNP-M
0.25 wt.% 0M and 6M present similar spectra, with PLA and GNP-M peaks being observed,

Advances in GBMs and their composites with focus on biomedical applications
Artur M. Pinto – Jan 2017 269
which confirms the presence of filler in the polymer matrix. For PLA/GNP-C 0.25 wt.% 0M and
6M, the two spectra are also similar, however the GNP-C peak is much less intense than GNP-M
peak, as expected since the pristine powders also show the same intensity disparity.
Figure C3. XRD spectra for GNP-M and C powders (A), PLA 0M and 6M (B), PLA/GNP-M
0.25 wt.% 0M and 6M (C) and PLA/GNP-C 0.25 wt.% 0 and 6M (D).
C5. References
1. A.M. Pinto, C. Goncalves, D.M. Sousa, A.R. Ferreira, J.A. Moreira, I.C. Goncalves, F.D.
Magalhaes, Smaller particle size and higher oxidation improves biocompatibility of graphene-
based materials, Carbon 99 (2016) 318-329.
2. C. Bilbao-Sainz, B.S Chiou, D. Valenzuela-Medina, W.X. Du, K.S. Gregorski, T.G. Williams,
D.F. Wood, G.M. Glenn, W.J. Orts, Solution blow spun poly(lactic acid)/hydroxypropyl
methylcellulose nanofibers with antimicrobial properties, Eur Polym J 54 (2014) 1-10.
3. H.M. Lee, K. Lee, C.K. Kim, Electrodeposition of Manganese-Nickel Oxide Films on a
Graphite Sheet for Electrochemical Capacitor Applications, Materials 7 (2014) 265-274.
4. D.M. Gray, B. Mookerji, Crystal Structure of Graphite, Graphene and Silicon, Physics for
Solid State Applications (2009).
5. B.W. Chieng, N.A. Ibrahim, W.Z.W Yunus, M.Z. Hussein, Y.Y. Then, Y.Y Loo, Effects of
Graphene Nanoplatelets and Reduced Graphene Oxide on Poly(lactic acid) and Plasticized
Poly(lactic acid): A Comparative Study, Polymers-Basel 6 (2014) 2232-2246.