
Advances in Decision Tools for Ranking Analytics
25
University of Arkansas, Fayeeville ScholarWorks@UARK Industrial Engineering Undergraduate Honors eses Industrial Engineering 5-2014 Advances in Decision Tools for Ranking Analytics Steven Cole Ellio University of Arkansas, Fayeeville Follow this and additional works at: hp://scholarworks.uark.edu/ineguht is esis is brought to you for free and open access by the Industrial Engineering at ScholarWorks@UARK. It has been accepted for inclusion in Industrial Engineering Undergraduate Honors eses by an authorized administrator of ScholarWorks@UARK. For more information, please contact [email protected], [email protected]. Recommended Citation Ellio, Steven Cole, "Advances in Decision Tools for Ranking Analytics" (2014). Industrial Engineering Undergraduate Honors eses. 25. hp://scholarworks.uark.edu/ineguht/25
Transcript of Advances in Decision Tools for Ranking Analytics
University of Arkansas, FayettevilleScholarWorks@UARKIndustrial Engineering Undergraduate HonorsTheses Industrial Engineering
5-2014
Advances in Decision Tools for Ranking AnalyticsSteven Cole ElliottUniversity of Arkansas, Fayetteville
Follow this and additional works at: http://scholarworks.uark.edu/ineguht
This Thesis is brought to you for free and open access by the Industrial Engineering at ScholarWorks@UARK. It has been accepted for inclusion inIndustrial Engineering Undergraduate Honors Theses by an authorized administrator of ScholarWorks@UARK. For more information, please [email protected], [email protected].
Recommended CitationElliott, Steven Cole, "Advances in Decision Tools for Ranking Analytics" (2014). Industrial Engineering Undergraduate Honors Theses.25.http://scholarworks.uark.edu/ineguht/25

Advances in Decision Tools for Ranking Analytics
An Undergraduate Honors Thesis
in the
Department of Industrial Engineering College of Engineering University of Arkansas
Fayetteville, AR
by
Steven Cole Elliott

1
2
Section 1 – Introduction
The objective of this honors thesis is concerned with creating a tool that
will allow a user to perform analysis and then to produce a ranking based on that
analysis. This raises two main questions, the first of which being, “What is being
analyzed so that it can be ranked?” and the second of which being, “How is this
analysis being performed?”
Section 1.1 – Ranking Analytics Background
The answer to the first question is comparatively much simpler than the
answer to the second: NCAA Division 1 Football Bowl Subdivision (FBS) college
football teams. More specifically, it is specific fields of data that pertain to all of
these NCAA Division 1 FBS college football teams for a particular season.
Inherent in this discussion is also the reasoning or end-goal of performing this
analysis and eventual ranking. Cassady, Maillart, and Salman (2005) provide an
answer in the motivation for their ranking algorithm, “Ranking sports teams in the
absence of full round-robin tournaments is big business, especially for NCAA
Division 1 FBS college football. The Bowl Championship Series [BCS] awards
millions of dollars each year to the conferences whose teams are awarded bids.”
Because there are over 100 NCAA Division 1 FBS college football teams, it is not
feasible for each team to play every other team exactly once in the duration of
the season, and for this reason, there has to be a methodology that allows for
teams that may have never played against each other to be compared and
ranked.
3
However, removing all presence of subjectivity and bias in the ranking
process is easier said than done, as even mathematical models inherit the bias
of the designer. In its defense, currently the BCS ranking process is carried out
by two main entities that use several polls and computer models in order to
generate the ranking of the top teams. Even with the aid of different analysis
tools, it proves seemingly impossible to rank teams with a compilation of
analyses that wins the approval of every college football enthusiast. Cassady et
al. (2005) references this frustration, noting that, “although the BCS is intended to
eliminate controversy, every year it provokes debate among fans and members
of the media.”
Section 1.2 – CMS+ Methodology
Clearly, there is an eminent need for a means of objectively analyzing
teams’ performance and generating a ranking. Cassady, Maillart, and Salman
realized this need, but also realized that it would not be feasible to create a
method of analysis that would not reflect the bias of those who devised it. Thus,
they sought to create a “a ranking methodology that (1) requires decision makers
to quantify their biases, which renders our system customizable, and then (2)
uses mathematical programming to apply these biases fairly across all
competitors”.
In order to develop such a methodology, they developed a genetic
algorithm that would govern the overall process of generating a ranking. The
purpose of the genetic algorithm was to make a problem with over 100 teams
manageable to solve using a quadratic-assignment framework. Essentially, the
4
genetic algorithm would generate a specified number of possible ranking
sequences, and from that, only a specified percentage would be used, with the
rest being discarded. Those that were kept remained because their ranking
sequence produced an attractive value for the objective function, which gauges
the effectiveness of the ranking sequence’s ability to generate a sequence that
best incorporates the weights of different team statistics. Then, one of two
possible outcomes would occur governed by a specified percentage: either (1)
when comparing the next generation of solutions to the previous generation, the
ranking positions where the teams were the same would be kept or copied, and
then another generation would be created; or (2) an existing ranking sequence –
selected at random – would have two ranking positions randomly selected
creating an interval, and the positions outside of that interval would be copied,
while the positions within that interval would be reversed, or mutated. This
process of copying and mutation would continue up to a certain number of
generations.
After this process reaches a certain number of generations, then that final
solution serves as the initial sequence for the heuristic that will ultimately yield
the final ranking sequence. The heuristic works by switching the positions of two
teams in the ranking sequence, and comparing the before and after switching
values of the objective function in order to decide whether or to keep or disregard
the change in the ranking sequence. This is done for all possible ranking
sequence pairs, ensuring the selection of the best ranking sequence in terms of
the best value for the objective function.
5
The objective function governs the heuristic, so the parameters of the
solution approach, which will dictate the quality of the obtained objective value,
are crucial to the procedure. In order to satisfy the need for quantifying biases
and applying those biases fairly and equally across all of the teams as
recognized by Cassady, Maillart, and Salman, it was important to make sure that
the course of the model was tailored to the user’s preference on the effect that
two parameters would have on the eventual ranking sequence. Thus the model
was set up so that, “the decision-maker must specify two sets of parameters: (1)
the degree of victory achieved by the winner of each game, and (2) the relative
distance between every pair of ranking positions”(2005).
Section 1.3 – CMS+ Validation
Using their model, they identified a set of parameter values that gave them
rankings similar to those produced by the BCS in past years, and then used that
“best” set of parameters to weigh in on some controversial ranking decisions
made by the BCS. Comparing their rankings to past rankings and to a select few
ranking decisions allowed them to validate the accuracy of their model. With a
successful and validate mathematical model, Cassady et al. (2005, p. 507)
summarized their procedure saying, “We developed a novel ranking methodology
and demonstrated its potential for use in intercollegiate athletics.”
Section 1.4 – Application Motivation
One aspect missing from their work was a user interface that would make
this ranking algorithm as attractive as possible to being used by a committee who
will most likely not have any familiarity with algorithms and software
6
implementation. Thus, the goal in creating a user interface was to provide a
means for initializing the algorithm and heuristic and executing it without having
to edit lines of code, as well as for presenting the ranking output in an
aesthetically pleasing and familiar layout. As far as basic functionality was
concerned, the user interface would allow a user to upload a file containing the
various statistics of every team for that season, view that uploaded file, set the
values of the different parameters to be used in the actual algorithm, execute the
algorithm in order to generate a unique ranking, and finally to view the ranking.
Section 2 – Application Design
However, before the user interface could even be designed, some
consideration had to be given to some other factors that would ultimately
determine the success and effectiveness of the user interface. The first of those
factors was deciding through what platform to build and design the user interface,
and the second of which was incorporating basic user interface graphic design
conventions and principles.
Section 2.1 – Platform Selection
Initially, using Visual Basic (VBA) in Microsoft Excel was the prime
candidate for providing the programming foundation to build the user interface.
There were two problems with using VBA that were eventually identified: first, the
layout, appearance, functionality, and feel of a Visual Basic application in
Microsoft Excel did not seem to meet the expectations of what was envisioned
for the user interface. The purpose of the user interface was after all to remove
the presence of technical components and to provide an illusion to the user that
7
he or she was simply just clicking in order to make decisions. Those two
purposes would be violated by a user interface created in VBA and Microsoft
Excel. With minimal aesthetic capabilities, the layout and feel of it would not be
able to escape the underlying motif of Microsoft Excel, and, after generating the
ranking, the user would have to view it in a Microsoft Excel spreadsheet.
Requiring the user to perform manual manipulation and deletion of Excel
spreadsheets was something that needed to be avoided if the presence of
technical components was to be eliminated. Second, there was a mismatch of
programming languages. The algorithm was written in C++, as it would allow for
much faster processing and execution than VBA. So if the user interface was
written and developed in Microsoft Excel using VBA, then how would it be able to
interact with an algorithm that was written in C++? There are probably solutions
to this mismatch problem that exist, but taken in conjunction with the first
problem, the underlying uncertainty of spending a large amount of time on
developing an application that may not even be able to interact with the back-end
algorithm ruled out VBA and Microsoft Excel as a possible platform on which to
build the application.
After coming to the realization that VBA and Microsoft Excel would not
provide the capabilities that this application required, it was back to the drawing
board. After a search for viable system alternatives and investigating the
different functionalities of several platforms, the one that provided the best fit for
the design of this user interface was Qt Creator (Digia, 2013). It would allow the
designer to work with drag-and-drop design functionality instead of having to
8
write code for every aspect of the user interface. However, the designer could
still write code that would work in conjunction with any of the drag-and-drop
functionality. The only immediate obstacle to beginning to work with this platform
was learning its unique language and constructs. Qt has its own programming
language that is based exclusively off of C++.
Section 2.2 – Integration of User Interface Design
After deciding that Qt would be the platform that was used to design and
create this application, the design phase began. Importance could now be given
to making sure to integrate the second factor of incorporating basic, user
interface graphic design conventions and principles. After reading several
articles that each listed ten, similar, important design conventions to consider in
user interface design, it was evident that the ones that most applied to the
creation of this application were paying attention to patterns of design,
consistency of design, efficiency of design, and simplicity of design (Nielsen,
1995, Sollenberger, 2012, and Vogel, 2012).
Paying attention to patterns of design focuses on making the user feel
comfortable while using the application. It encompasses the idea that it is okay
and encouraged for the application to borrow or follow the patterns and
conventions used in interfaces that users would be familiar with, would interact
with, or be exposed to on a frequent basis, such as social networking
applications like Facebook, or applications that come standard with Mac or PC
operating systems (Sollenberger, 2012). One article proposed that during the
design phase, when considering how to design a certain function of the

9
application in the user interface, the designer should ask himself, “How would
Microsoft do it?” (Vogel, 2012). This further references the fact that most users
of any application will be familiar with and accustomed to the patterns of design
that are used in Microsoft applications. Thus, it follows that using patterns similar
to those in a user interface design is in the best interest of the designer in terms
of accomplishing the goal of making the user feel comfortable.
Consistency of design stresses the importance of ensuring that the user
can expect and trust that words, phrases, buttons, functionalities, etc. that appear
the same actually perform the same action. If the same action or type of action is
not being performed, then the user needs to have a clear distinguishing indicator
that a particular word, phrase, button, function, etc. does not perform the same
action as another (Nielsen, 1995). Additionally, the point of designing the
functionalities within the interface to be consistent is to also quicken the learning
curve of the user. If he or she can learn how to perform a certain action and then
trust that he could perform the same action or a similar one again simply by the
relying on the consistency of functionality design, then he feels more comfortable
with the interface and is able to use it more effectively and efficiently
(Sollenberger, 2012).
Efficiency of design broadly encompasses two more specific principles
that should be considered in the design of the user interface: error prevention
and logical flow of the design itself. In regards to error prevention, error
messages are appropriate, but more for the designer rather than the user. The
designer or developer does not want the responsibility of being present and

10
readily available for troubleshooting whenever his user interface is in use.
Therefore, it is crucial that he take the time to enumerate all possible erroneous
situations within the functionality confines of the system and do his best to
eliminate the possibility of those errors (Nielsen, 1995).
It could also be unrealistic for the designer to have the necessary time to
debug and create new code or logic that prevents errors left in the back-end
system by its designer. In those instances, it is the responsibility of the designer
to create a user interface that essentially directs the user around these potentially
error-prone instances. For example, this could be achieved through the use of
directions and confirmation messages that ask for the ultimate approval of the
user before executing an action. Additionally, the designer could restrict the
ability of the user to make certain choices where errors are likely to occur,
although this requires assuming that the user has the same desired goal in mind
as the designer when executing a particular action. This kind of error prevention
needs to be paired with a successful backtracking capability in case of a
miscommunication between the user and the designer’s intended use of a
functionality (Nielsen, 1995).
Concerning logical flow of the design, information presented in the user
interface should appear naturally and appeal to the common sense ordering of a
typical, generic user of the system. The terminology used and the way that
prompts and functionalities are arranged or displayed should directly correlate to
how the users would set it up if they themselves were arranging the prompts and
functionalities. Also, the designer should make sure that the layout of various

11
actions follows the logical or sequential flow of how those actions would be
executed by the user (Nielsen, 1995). For example, if there are three actions
that would normally be executed in the order of action one – action two – action
three, then their appropriate layout should be either in a top-to-bottom layout or a
right-to-left layout.
Finally for simplicity of design, the designer should make sure to base all
of his design decisions on the question, “What are the goals of the user?” In
order to make the user interface as effective as possible in executing actions of
the application, the designer cannot lose vision of the goals of the user. He
should create functionalities that allow the user to execute specific and
streamlined actions, rather than adding unnecessary extras that clutter up the
efficiency of the interface (Nielsen, 1995, Sollenberger, 2012, and Vogel, 2012).
Section 3 – Application Implementation
After downloading Qt Creator and making sure to keep the above user
interface design principles their due diligence, the actual design of the application
and it’s user interface began. To reiterate, the end goal of this process was to
create an application and user interface that would allow a user to perform the
following four actions: upload a file containing the various statistics of every team
for a particular season, view that uploaded file, set the values of the different
parameters to be used in the actual algorithm, execute the algorithm in order to
generate a unique ranking, and finally to view the ranking. A description and
explanation of the completed application are contained in the pages that follow.
12
Section 3.1 – Starting the Application
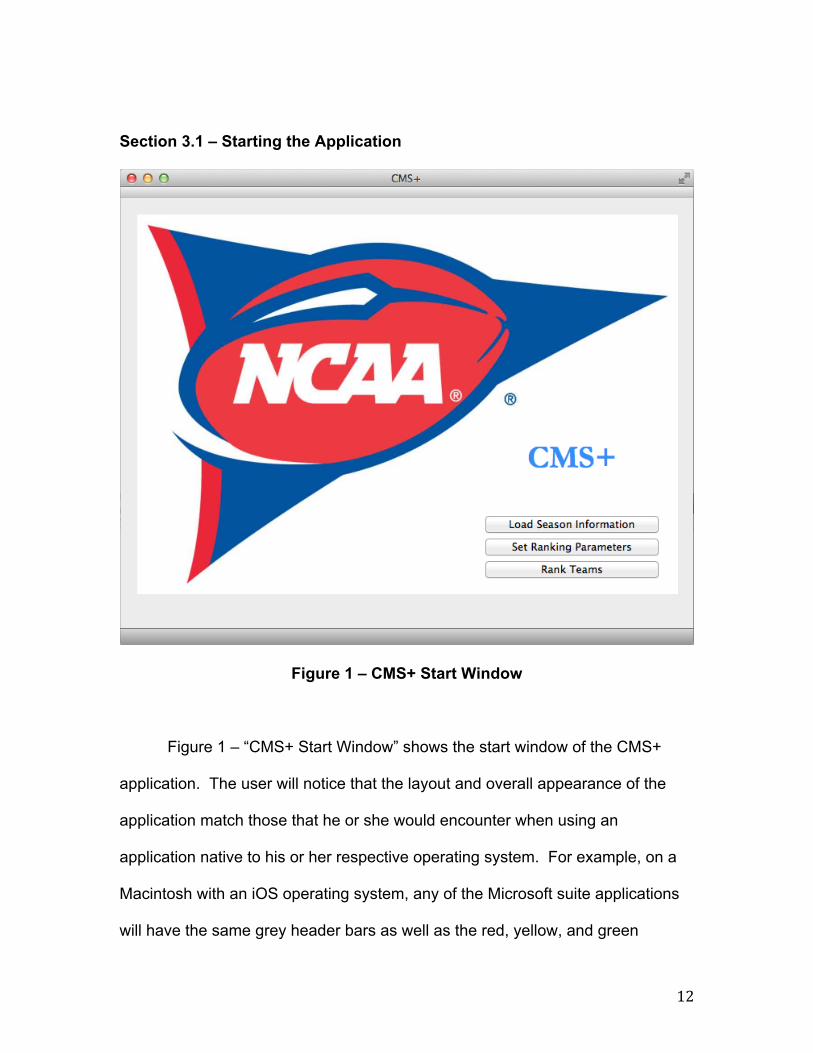
Figure 1 – CMS+ Start Window
Figure 1 – “CMS+ Start Window” shows the start window of the CMS+
application. The user will notice that the layout and overall appearance of the
application match those that he or she would encounter when using an
application native to his or her respective operating system. For example, on a
Macintosh with an iOS operating system, any of the Microsoft suite applications
will have the same grey header bars as well as the red, yellow, and green
13
buttons and the double arrow in the header bar. The buttons and the double
arrow function exactly as they would in any other application on that operating
system: close, minimize, and restore, and manually resize the window,
respectively. By using the mouse pointer to click and hold the bottom right
corner of the window, the user can also manually resize the window. The color
and styling of the action buttons are also consistent with the grey theme of many
familiar applications. The theme, styling, and general window functionality just
described is consistent across all of the windows in this application.
In the start window, the user has the ability at first to perform three of the
desired actions of this application. By clicking the “Load Season Information”
button, he can initiate the process of selecting a file with the season data for all of
the teams and then loading that file so that it can be used in the algorithm. By
clicking the “Set Ranking Parameters” button, the user can open a separate
window that will allow him to set the parameters that govern the way the
algorithm will process and evaluate the season data that ultimately affects the
ranking that is produced. Finally, by clicking the “Rank Teams” button, he can
execute the algorithm, generate a ranking, and then view that ranking, which is
displayed in a tabular format, in a separate window.
14
Section 3.1 – Loading Season Information
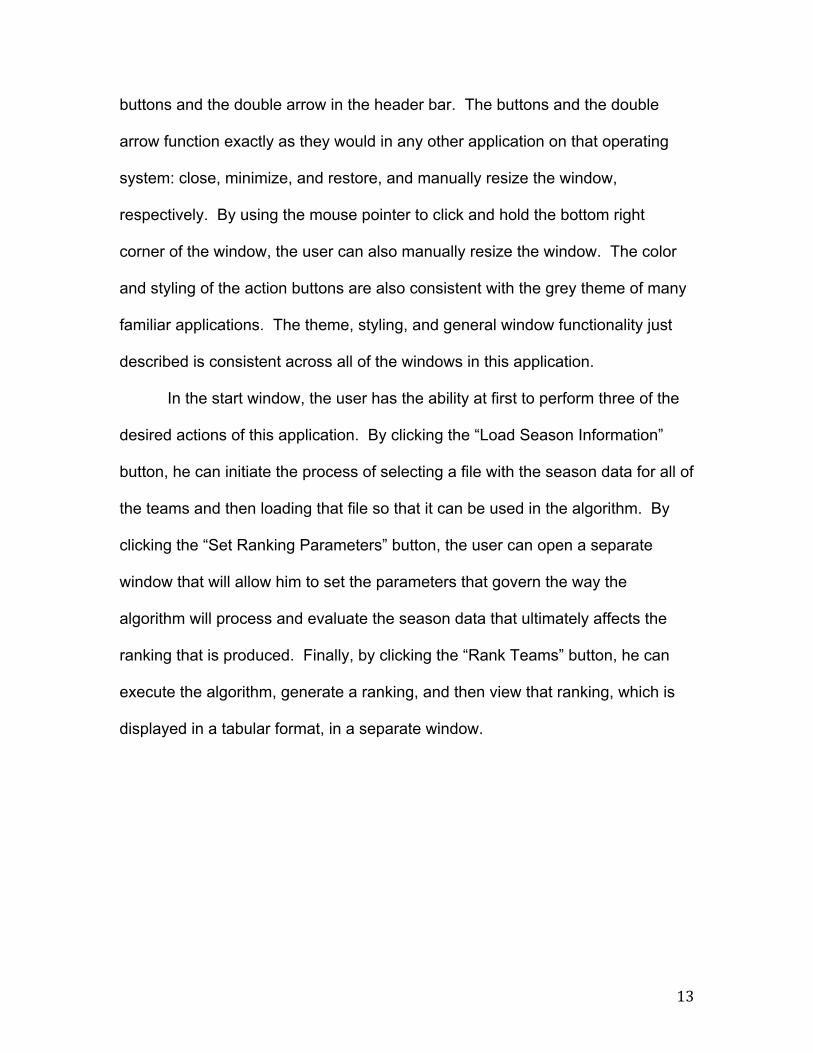
Figure 2 – Load Data Window
Figure 2 – “Load Data Window” shows the open file dialog box that
appears after the user clicks the “Load Season Information” button from the start
window. Consistent with the styling of any application inherent to an operating
system, the user will notice that this open file dialog box looks identical that he
would find in opening a file in Microsoft Word, for example. In the same token,
the user can expect the functionality of the open file dialog box to behave exactly
15
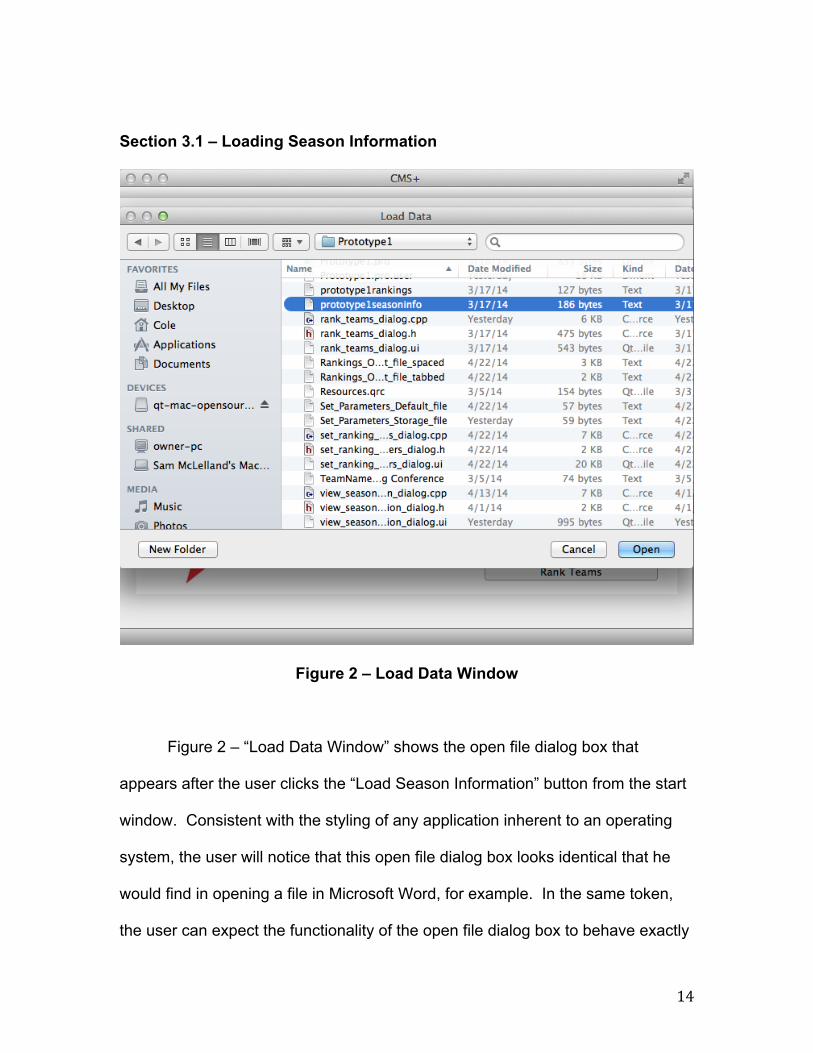
as he would expect it to when interacting with one in application like Microsoft
Word. Thus, the user can browse for a file to load and then select that file by
either highlighting it in blue by clicking on the file and then pressing the “Open”
button, or by double-clicking on the file. The “Open” button is not enabled for
clicking until the user has selected a file. If the user does not want to open a file,
he can press the “Cancel” button at any time to close the open file dialog box.
After pressing the “Open” button of the “Cancel” button, the user will return to the
start window. It is important that the user load the correct type of file so that the
algorithm can interact with it appropriately in order to generate a ranking. The
loaded file that contains the season data needs to be formatted as a tab-
delimited text file, meaning the file should end in the “.txt” prefix and that each of
the individual text strings in each line of the file is separated by a tab character.
16
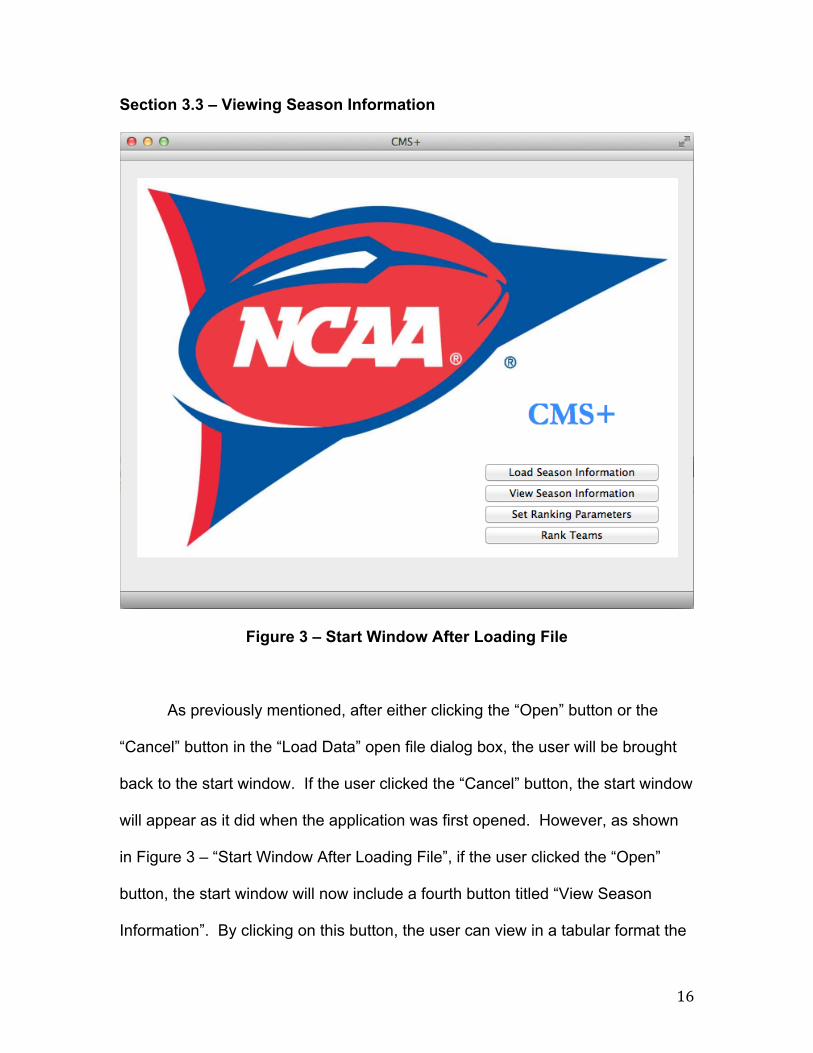
Section 3.3 – Viewing Season Information
Figure 3 – Start Window After Loading File
As previously mentioned, after either clicking the “Open” button or the
“Cancel” button in the “Load Data” open file dialog box, the user will be brought
back to the start window. If the user clicked the “Cancel” button, the start window
will appear as it did when the application was first opened. However, as shown
in Figure 3 – “Start Window After Loading File”, if the user clicked the “Open”
button, the start window will now include a fourth button titled “View Season
Information”. By clicking on this button, the user can view in a tabular format the

17
data that he loaded during the execution of the “Load Season Information” action.
Hiding the “View Season Information” button until the user has successfully
loaded a file helps to guide the user through the flow of the application and
encourages him to load a file before wanting to view the data that the file
contains. This prohibits him from attempting to a view data that he has not yet
specified from where to obtain.
Figure 4 – View Season Information Window
18
After clicking the “View Season Information” button in the start window, a
window titled “View Season Information” will open. This window is shown in
Figure 4 – “View Season Information Window”. The data taken from the text file
loaded during the “Load Season Information” action is presented in a tabular
format that the user will notice both appears and functions similar to cells in
Microsoft Excel. For example, the user can sort columns in either ascending or
descending order by clicking on the numbered column headers. He can also
resize or automatically resize columns and rows by placing his cursor on the
column or row dividing line and clicking and dragging the column or row to the
desired width, or double-clicking, respectively. The user can select individual
cells by clicking on them, but he cannot edit the contents of any cells. The user
can also scroll side-to-side and up-and-down through the table by placing his
cursor in the table window to activate the scroll bars, and then using them as
they would normally be used on any other application. Finally, he can close or
restore the window by clicking the red or green button in the top left corner of the
window, respectively. Closing the window will return the user to the start window.
19
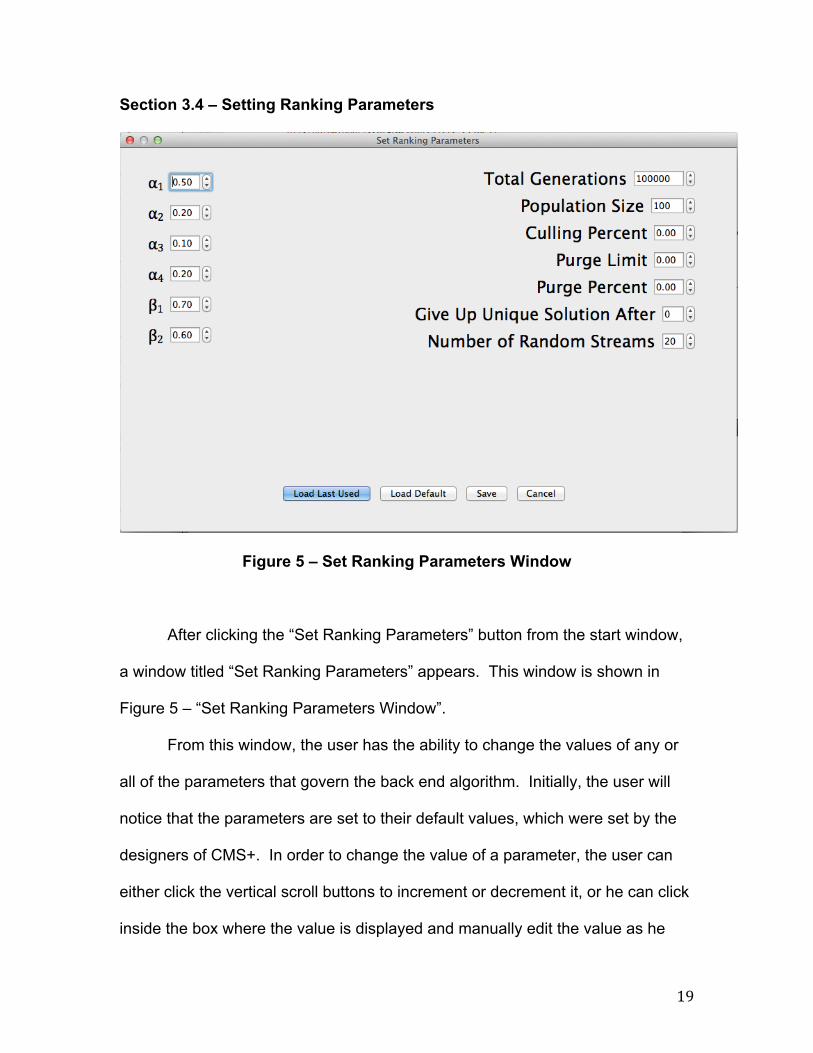
Section 3.4 – Setting Ranking Parameters
Figure 5 – Set Ranking Parameters Window
After clicking the “Set Ranking Parameters” button from the start window,
a window titled “Set Ranking Parameters” appears. This window is shown in
Figure 5 – “Set Ranking Parameters Window”.
From this window, the user has the ability to change the values of any or
all of the parameters that govern the back end algorithm. Initially, the user will
notice that the parameters are set to their default values, which were set by the
designers of CMS+. In order to change the value of a parameter, the user can
either click the vertical scroll buttons to increment or decrement it, or he can click
inside the box where the value is displayed and manually edit the value as he
20
would edit text in an application like Microsoft Word. The increments and
decrements of the individual parameters are fixed and depend on the feasible
range of values for that parameter. Values changed by manual editing still obey
the increment, decrement, and feasibility ranges placed on that parameter. After
making any changes, the user can press the “Save” button in order to set the
values of the parameters to the new values he specified, or he can press the
“Cancel” button to disregard his changes and restore the parameter values to
their defaults. He can also load the last set of parameters that were saved by
pressing the “Load Last Used” button, or he can return the parameters to their
default values by pressing the “Load Default” button. By pressing either the
“Save” button or the “Cancel” button, the user will close the window and return
the start window.
21
Section 3.5 – Ranking Teams
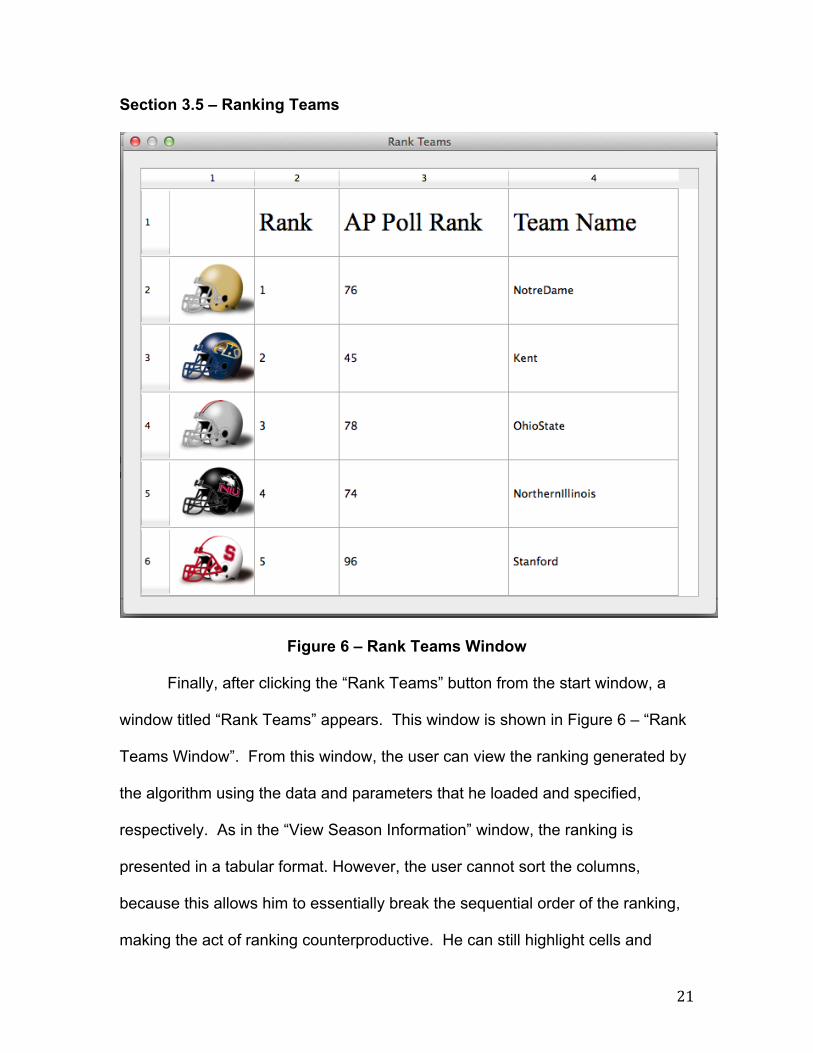
Figure 6 – Rank Teams Window
Finally, after clicking the “Rank Teams” button from the start window, a
window titled “Rank Teams” appears. This window is shown in Figure 6 – “Rank
Teams Window”. From this window, the user can view the ranking generated by
the algorithm using the data and parameters that he loaded and specified,
respectively. As in the “View Season Information” window, the ranking is
presented in a tabular format. However, the user cannot sort the columns,
because this allows him to essentially break the sequential order of the ranking,
making the act of ranking counterproductive. He can still highlight cells and
22
manually or automatically resize the rows and columns, as he is able to in the
“View Season Information” window, but he may not edit the contents of any of the
cells. Additionally, the user can still scroll side-to-side and up-and-down through
the table, as in “View Season Information” by placing his cursor in the table
window to activate the scroll bars, and then using them as they would normally
be used on any other application. Finally, he can close or restore the window by
clicking the red or green button in the top left corner of the window, respectively.
As always, closing the window will return the user to the start window.
Section 4 – Future Development & Conclusion
As far as future development is concerned, something that would make
this application more attractive as a decision tool is a functionality that would
allow the user to perform both a comparative analysis of multiple rankings and a
sensitivity analysis of the effect of changing different parameters. Effectively, he
would be able to simultaneously execute and view multiple rankings side-by-side
that were each based on different parameter sets. Another area of future work is
platform flexibility. To create exposure for CMS+ and its application as a ranking
decision tool, it is imperative that the application become online and mobile
capable. Qt is already compatible with HTML and iOS, meaning that the
potential for this ranking decision tool to become both an online and mobile
application is feasibly and practically realizable.
In conclusion, the application and its user interface effectively allow its
user to perform the four basic functional goals of its creation, which are uploading
a file containing the various statistics of every team for that season, viewing that
23
uploaded file, setting the values of the different parameters to be used in the
actual algorithm, executing the algorithm in order to generate a unique ranking,
and finally, viewing that ranking. It ensures that the user is able to quantify his
ranking biases when working with the algorithm and ranking heuristic, and
provides a means of interacting with them that supports the design conventions
of paying attention to patterns of design, consistency of design, error prevention,
logical flow of design, and simplicity of design. The application should make the
algorithm and ranking heuristic more attractive to being used by a decision
making entity that needs all of its attention devoted to making decisions – not
manually editing and executing lines of code.
Section 5 - References Cassady, C. Richard, Lisa M. Maillart, and Sinan Salman. "Ranking Sports
Teams: A Customizable Quadratic Assignment Technique." Informs Interfaces 35.6 (2005): 497-510. Informs. Informs, Nov. 2005. Web. 10 Apr. 2014. <http://www.ma.iup.edu/~jchrispe/ORArticles/RankingSportTeams.pdf>.
Nielsen, Jakob. "10 Usability Heuristics for User Interface Design." Nielsen
Norman Group Evidence-Based User Experience Research, Training, and Consulting. Nielsen Norman Group, 15 Jan. 1995. Web. 15 Nov. 2013. <http://www.nngroup.com/articles/ten-usability-heuristics/>.
Qt Creator. Computer software. Qt - Cross-platform Application and UI
Development Framework. Vers. 5.2.0. Digia, 2013. Web. 15 Nov. 2013. <http://qt.digia.com/#>.
Sollenberger, Kyle. "10 User Interface Design Fundamentals." Treehouse Blog. Treehouse, 7 Aug. 2012. Web. 15 Nov. 2013. <http://blog.teamtreehouse.com/10-user-interface-design-fundamentals>.
Vogel, Peter. "What's Important in UI Design." Visual Studio Magazine. Visual Studio Magazine, 6 Oct. 2012. Web. 15 Nov. 2013. <http://visualstudiomagazine.com/articles/2012/10/05/whats-important-in-ui-design.aspx>.


![[Webinar] Understanding Search Ranking & Analytics Reports](https://static.fdocuments.in/doc/165x107/588997c01a28ab330e8b67dd/webinar-understanding-search-ranking-analytics-reports.jpg)