Advances in Clinical Personality Measurement: An Item ... Classes/Spring 08... · Advances in...
26
Advances in Clinical Personality Measurement: An Item Response Theory Analysis of the MMPI–2 PSY–5 Scales Steven V. Rouse Department of Psychology Pepperdine University Michael S. Finger and James N. Butcher Department of Psychology University of Minnesota Item response theory (IRT) provides valuable methods for the analysis of the psychometric properties of a psychological measure. To date, however, these meth- ods have not been used frequently by personality assessment researchers, in part be- cause many researchers have not been introduced to the methods and in part because most of the development of IRT has taken place in applied education assessment set- tings, resulting in terminology that is ability focused rather than trait focused. The purpose of this article is twofold. First, an overview of IRT is presented, highlighting the concepts of the three-parameter IRT model, item and test information, and condi- tional standard error of measurement. Second, the psychometric properties of the (MMPI–2) PSY–5 scales are examined to demonstrate IRT’s value. Item response theory (IRT) is a modern psychometric approach that holds great po- tential for the evaluation of objective personality assessment. However, most pub- lished applications of IRT have used the method to examine cognitive tests and tests of abilities. As a result, although many IRT researchers are confident that this method can be applied to trait measures, the literature has yet to resolve several im- portant issues in the use of IRT for personality assessment. The purposes of this ar- ticle are to provide an overview of IRT methodology and to demonstrate its useful- ness in evaluating the psychometric properties of a new set of trait measures, the Minnesota Multiphasic Personality Inventory–2 (MMPI–2) Personality Psycho- pathology–Five (PSY–5) scales. JOURNAL OF PERSONALITY ASSESSMENT, 72(2), 282–307 Copyright © 1999, Lawrence Erlbaum Associates, Inc. Copyright © 2000 All Rights Reserved
Transcript of Advances in Clinical Personality Measurement: An Item ... Classes/Spring 08... · Advances in...

Advances in Clinical PersonalityMeasurement: An Item Response TheoryAnalysis of the MMPI–2PSY–5Scales
Steven V. RouseDepartment of Psychology
Pepperdine University
Michael S. Finger and James N. ButcherDepartment of PsychologyUniversity of Minnesota
Item response theory (IRT) provides valuable methods for the analysis of thepsychometric properties of a psychological measure. To date, however, these meth-ods have not been used frequently by personality assessment researchers, in part be-cause many researchers have not been introduced to the methods and in part becausemost of the development of IRT has taken place in applied education assessment set-tings, resulting in terminology that is ability focused rather than trait focused. Thepurpose of this article is twofold. First, an overview of IRT is presented, highlightingthe concepts of the three-parameter IRT model, item and test information, and condi-tional standard error of measurement. Second, the psychometric properties of the(MMPI–2) PSY–5scales are examined to demonstrate IRT’s value.
Item response theory (IRT) is a modern psychometric approach that holds great po-tential for the evaluation of objective personality assessment. However, most pub-lished applications of IRT have used the method to examine cognitive tests andtests of abilities. As a result, although many IRT researchers are confident that thismethod can be applied to trait measures, the literature has yet to resolve several im-portant issues in the use of IRT for personality assessment. The purposes of this ar-ticle are to provide an overview of IRT methodology and to demonstrate its useful-ness in evaluating the psychometric properties of a new set of trait measures, theMinnesota Multiphasic Personality Inventory–2 (MMPI–2) Personality Psycho-pathology–Five (PSY–5) scales.
JOURNAL OF PERSONALITY ASSESSMENT,72(2), 282–307Copyright © 1999, Lawrence Erlbaum Associates, Inc.
Copyright © 2000 All Rights Reserved

PRINCIPLES OF IRT
Classical Test Theory
Traditionally, the psychometric evaluation of personality trait measures usedclassical test theory (CTT) or the classical true score model (Crocker & Algina,1986), in which a person’s observed score (X) on a measure is conceptualized asa combination of that person’s true score (T) and a random error value (E). Inother words,X = T + E. Although one would not expect any measure to be per-fectly free of error, the goal of CTT is to develop a measure by which we canobtainX values as close toT as possible; that is, to minimize error. To attain thisgoal, CTT argues that multiple measurements of the same trait should be used;becauseE is a random variable with a mean of 0, the expected value ofE for asingle person on an inventory over an infinite number of administrations is 0.Therefore, the mean of a person’s observed scores over an infinite number of ad-ministrations should equal that person’s true score. The practical application ofthis assumption, then, is that an objective personality test should include multi-ple items measuring the same trait where each item can be taken as a single ad-ministration. In this sense, the items are considered parallel forms of a singletrait measure. However, because we cannot use an infinite number of measuresof the same trait, every test will fall short of the perfect estimation of a person’strue score. The standard error of measurement (SEM), which is in part based onthe reliability coefficient of a scale, is used to construct a confidence intervalaround the person’s observed score within which we would expect the true scoreto fall. As reliability increases, the width of the confidence interval decreases.
In addition to the reliability of a whole test, CTT traditionally addresses twoproperties of individual items. First,item difficulty,a value that can range from0.00 to 1.00, is defined as the proportion of examinees who answer the item cor-rectly (Crocker & Algina, 1986). The equivalent definition in personality testingis the proportion of examinees who respond in the keyed or “traited” direction.CTT offers a very limited range of acceptable item difficulty values; from theCTT perspective, an item is most likely to aid in the estimation of true scores(i.e., an item will maximize reliability) when half of the examinees answer thequestion in the keyed direction and half do not (Crocker & Algina, 1986). Thegoal, then, is to create a large number of items that each have difficulty values of.50. Second,item discriminationis defined as the point-biserial correlation be-tween a dichotomously scored item and the total score on the scale. For person-ality testing, the coefficient can be conceptualized as an indication of the extentto which high-traited examinees endorse the item in the keyed direction andlow-traited examinees endorse the item in the nonkeyed direction. In CTT, anitem with a high positive coefficient maximizes reliability and is considered ahighly discriminating item; therefore it is considered useful from a measurement
IRT AND THE MMPI–2PSY–5SCALES 283
Copyright © 2000 All Rights Reserved

perspective. Those with lower or negative coefficients are not considered to beuseful in trait measurement.
Problems With CTT and a Solution in IRT
Weiss (1995) identified several problems inherent in CTT, many relating to thecentrality of the concepts of reliability and the SEM. First, there numerous meth-ods of estimating reliability and the resulting reliability coefficients are groupspecific. Because reliability estimates will vary as a function of the method usedand the sample on which they were computed, the SEM and the resulting confi-dence interval will also fluctuate. Second, a single SEM is calculated for the en-tire scale as an indication of the scale’s lack of measurement precision. Thissingle coefficient would not be an accurate reflection of a scale that may, for ex-ample, be highly reliable for examinees at high levels of the trait but much lessreliable for examinees at low levels of the trait. For such a scale, it would bemore useful to have an indication of the precision of the scale at every point onthe trait dimension. Third, the item selection procedure advocated in CTT (i.e.,selecting items with difficulty values near .50 and high positive discriminationvalues) results in instruments that are effective at discriminating between the up-per and lower halves of the population of examinees but ineffective at discrimi-nating between examinees at other levels of the trait. For example, if items for anegative emotionality scale were selected on this basis, this scale would be veryuseful for determining whether a specific client was in the upper or lower 50%of the population, but it would be much less effective as a screening device forthose clients in the upper 10% of the population. Fourth, each item in a scale isgiven equal weight, regardless of the difficulty of that item. For example, on apositive emotionality scale, the endorsement of an “easy” or frequently endorseditem (e.g., “I usually feel that my life is worthwhile”) would be treated in thesame manner as the endorsement of a “difficult” or infrequently endorsed item(e.g., “I like to be with a crowd who play jokes with one another”); each itemwould add a point to the examinee’s observed score. Fifth, because each item isworth a point in calculating an observed score, there are a limited number of lev-els of the observed score at which a person can be assessed. For example, if ascale has 20 items, there are 21 possible observed score levels at which a personcould be assessed.
The IRT approach addresses each of these criticisms. First, the psychometricinformation provided by IRT is not sample dependent (Lord, 1980). For example,item parameters estimated for a set of items from a sample are linearly related toitem parameters estimated for the same item set from a second sample of the samepopulation. Second, the effectiveness of a scale can be assessed at every level ofthe trait dimension being measured. Third, IRT provides guidance for use in the
284 ROUSE, FINGER, BUTCHER
Copyright © 2000 All Rights Reserved
construction of a test, allowing a test writer to tailor a scale that is efficient at onespecific level of the trait dimension or that is efficient across the entire trait contin-uum. Fourth, each item is not equally weighted in the estimation of trait level; in-stead, several parameters of the items are taken into account in determining thepredicted trait level. Because of this differential weighting of items based on theirparameters, the predicted trait level will be equivalent regardless of the items onwhich it is based. Fifth, the IRT approach provides a continuous dimension of pre-dicted trait levels, and a person’s trait level can be estimated at any position be-tween 3SDabove and below the mean. Because of these weaknesses of the CTTapproach,and because IRT addresses these weaknesses, the field of personality as-sessment would benefit from moving away from an exclusive reliance on the CTTapproach and moving toward utilizing the valuable psychometric tools providedby IRT.
The IRT Approach: Item Response Functions (IRFs)
Although the goal of this article is to provide the reader with an introduction of theprinciples of the IRT approach, a full discussion of the method is beyond the scopeof the article. Readers interested in further information are referred to Hambletonand Swaminathan (1985) and Hambleton, Swaminathan, and Rogers (1991) for ex-cellent in-depth discussions.
The psychometric analysis of a scale using IRT begins by identifying the IRF(also calleditem characteristic curve) that best fits each item on the scale. An IRFhas two axes. The probability of endorsing an item in the keyed direction, rangingfrom 0.0 to 1.0, is plotted on the vertical axis, andtheta(θ), a general term referringto the underlying latent trait or characteristic that is being measured, is displayed inz score format on the horizontal axis. The curve itself can be interpreted as theprobability that a person will endorse the item in the keyed direction at any possi-ble level of theta. The IRFs for two items from a positive emotionality scale arepresented in Figure 1. Notice that for Item 1 the probability of endorsement for aperson with an average level of positive emotionality (i.e.,θ = 0.0) is approxi-mately .35, whereas the same person’s probability of endorsement for Item 2 is ap-proximately .85. That is, we would be very confident that the average personwould endorse Item 2, but less confident that the average person would endorseItem 1. However, for a person who has a level of positive emotionality that is 2SDabove the mean (i.e.,θ = 2.0), the probabilities of endorsing Items 1 and 2 are ap-proximately .85 and .99, respectively.
The IRFs seen in Figure 1 use a frequently used IRT model, thethree-parameterlogistic curve.In this model, each IRF can be represented by three values. The firstvalue,a, is the item discrimination parameter, which is a function of the slope of theIRFat thepointon the thetacontinuumatwhich the IRF’sslope issteepest. InFigure
IRT AND THE MMPI–2PSY–5SCALES 285
Copyright © 2000 All Rights Reserved
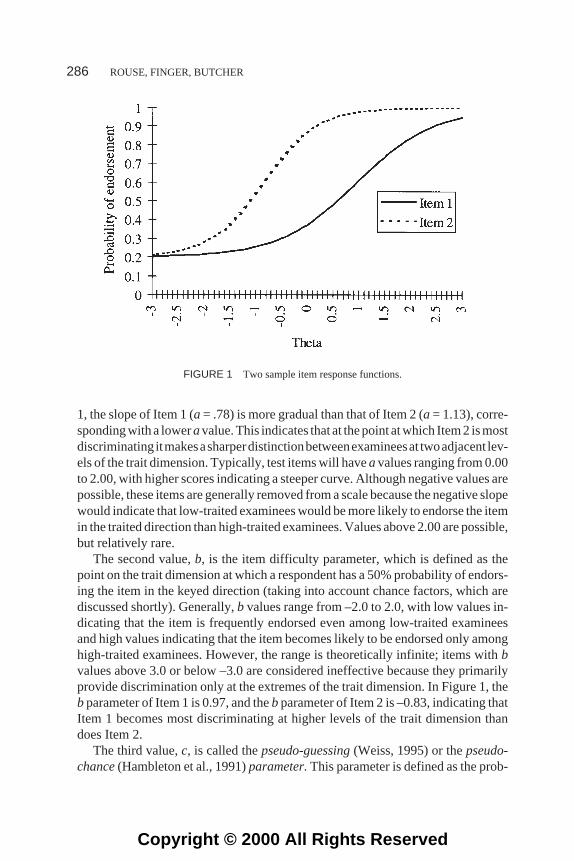
1, the slope of Item 1 (a = .78) is more gradual than that of Item 2 (a = 1.13), corre-sponding with a loweravalue. This indicates that at the point at which Item 2 is mostdiscriminating itmakesasharperdistinctionbetweenexamineesat twoadjacent lev-els of the trait dimension. Typically, test items will haveavalues ranging from 0.00to 2.00, with higher scores indicating a steeper curve. Although negative values arepossible, these items are generally removed from a scale because the negative slopewould indicate that low-traited examinees would be more likely to endorse the itemin the traited direction than high-traited examinees. Values above 2.00 are possible,but relatively rare.
The second value,b, is the item difficulty parameter, which is defined as thepoint on the trait dimension at which a respondent has a 50% probability of endors-ing the item in the keyed direction (taking into account chance factors, which arediscussed shortly). Generally,b values range from –2.0 to 2.0, with low values in-dicating that the item is frequently endorsed even among low-traited examineesand high values indicating that the item becomes likely to be endorsed only amonghigh-traited examinees. However, the range is theoretically infinite; items withbvalues above 3.0 or below –3.0 are considered ineffective because they primarilyprovide discrimination only at the extremes of the trait dimension. In Figure 1, thebparameter of Item 1 is 0.97, and thebparameter of Item 2 is –0.83, indicating thatItem 1 becomes most discriminating at higher levels of the trait dimension thandoes Item 2.
The third value,c, is called thepseudo-guessing(Weiss, 1995) or thepseudo-chance(Hambleton et al., 1991)parameter.This parameter is defined as the prob-
286 ROUSE, FINGER, BUTCHER
FIGURE 1 Two sample item response functions.
Copyright © 2000 All Rights Reserved

ability level at which the IRF reaches its lower asymptote or “levels off.” It cantake a value anywhere between 0 and 1.00, although it is rare for an item to have acvalue more than .25. In Figure 1, thecparameter estimates for Items 1 and 2 are .18and .21, respectively. In IRT applications to abilities testing, this parameter may beinterpreted as the probability of a correct answer being given by an examinee at avery low ability level. This may happen when an examinee answers a question cor-rectly simply by guessing, even if that person’s ability level is 3SD below themean. For personality assessment, the interpretation of this parameter is not asclear, because examinees are unlikely to “guess” whether or not they, for example,like to be in a crowd who play jokes with one another. For this reason, some re-searchers (Reise & Waller, 1990; Waller, Tellegen, McDonald, & Lykken, 1996)who have applied IRT to personality tests have chosen to use the two-parametermodel (i.e., to set thec parameter at 0.00), even though the lower asymptote wasgreater than 0.00 on several items.
Some alternatives to the three-parameter logistic model have been used. Asmentioned earlier, in the two-parameter model only thea andb parameters are es-timated, withc set at 0.00. Likewise, in the one-parameter model (the Raschmodel), only thebparameter is estimated;a is set at 1.00, andc is set at 0.00. In ad-dition, a four-parameter model has been proposed. Along with the three parame-ters already discussed, the gamma (γ) parameter represents the upper asymptote.This reflects the observation that, for some items, even examinees with very highlevels of the trait may not respond to the item in the “correct” or keyed direction.However, Hambleton and Swaminathan (1985) concluded that this model may beof theoretical interest only, because it has not been shown to enhance measure-ment, and no commercial IRT programs estimate the gamma parameter.
Two Transformations of the IRF
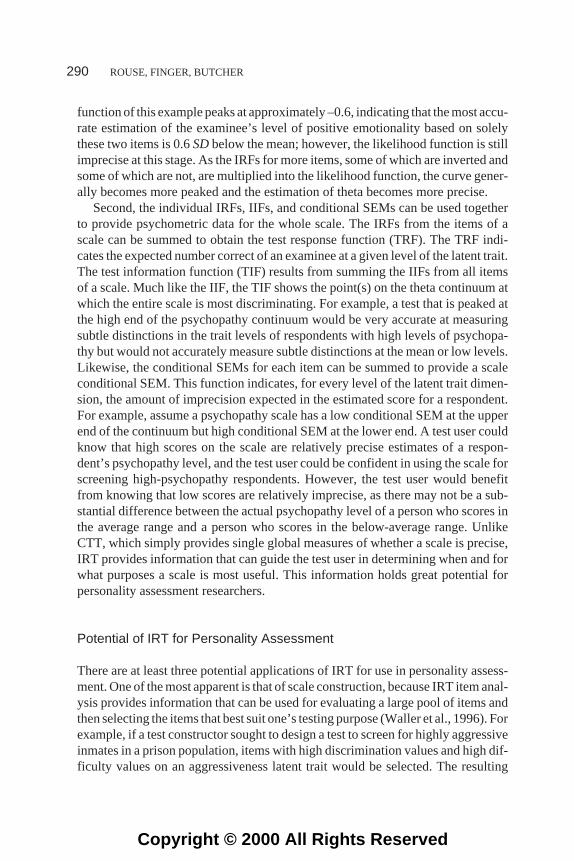
The IRF obtained for each item can be transformed into an item information func-tion (IIF) and a conditional SEM. The IIF is a graphic representation of the squaredprecision of measurement for the item at every point on the theta continuum. Asseen in Figure 2, the IIF is a bell-shaped function that peaks at the point on the thetacontinuum at which the IRF is steepest. In other words, a test developer can identifythe point at which the item is most discriminating by locating the peak of the IIF. Ofthe two sample items in Figure 2, Item 2 peaks approximately 0.5SDbelow themean, indicating that it will be most useful in estimating the positive emotionalitylevel of respondents with trait levels slightly below the mean, whereas Item 1 willbe more useful in estimating the ability level of respondents with trait levels slightlyabove the mean. The IIF can also be directly transformed into the conditional SEM,a graphic representation of the error of prediction expected for the item at each levelof the theta continuum. As seen in the two example conditional SEMs presented in
IRT AND THE MMPI–2PSY–5SCALES 287
Copyright © 2000 All Rights Reserved

Figure 3, these functions are usually bowl-shaped, and they reach their lowest levelat the point of the theta continuum where the item is most precise. The function forItem 1 is highest below the mean of positive emotionality, indicating less preciseestimation of the latent trait level for respondents with low levels of positive emo-tionality. However, Item 2 is more precise at those same levels but reaches a highdegree of imprecision for clients with latent trait levels above the mean. UnlikeCTT, then, the IRT model provides data about the precision of an item as it variesfor high-level, moderate-level, and low-level respondents.
Test-Level Analyses Using the IRFs
Once IRFs have been identified for each item on the scale, these IRFs can be aggre-gated for two different purposes: estimating the examinee’s latent trait level (θ) andproviding overall scale psychometric data. First, theta can be estimated by combin-ing the IRFs of the items the examinee endorsed in the keyed direction and the in-verted IRFs of the items the examinee endorsed in the nonkeyed direction. For ex-ample, assume that for the two items in Figure 1 an examinee responds in thenonkeyed direction for Item 1 and the keyed direction for Item 2. Figure 4 shows theIRF for Item 2 and the inverted IRF (i.e., the probability of not responding in thekeyed direction at each level ofθ) for Item 1. By multiplying these two IRFs at eachlevel of theta, a probability curve is obtained that indicates the likelihood of the per-son’s latent trait level being at each level along the theta dimension. The likelihood
288 ROUSE, FINGER, BUTCHER
FIGURE 2 Two sample item information functions.
Copyright © 2000 All Rights Reserved

289
FIGURE 3 Two sample item conditional standard errors of measurement.
FIGURE 4 Demonstration of trait-level estimation with sample.
Copyright © 2000 All Rights Reserved
function of this example peaks at approximately –0.6, indicating that the most accu-rate estimation of the examinee’s level of positive emotionality based on solelythese two items is 0.6SDbelow the mean; however, the likelihood function is stillimprecise at this stage. As the IRFs for more items, some of which are inverted andsome of which are not, are multiplied into the likelihood function, the curve gener-ally becomes more peaked and the estimation of theta becomes more precise.
Second, the individual IRFs, IIFs, and conditional SEMs can be used togetherto provide psychometric data for the whole scale. The IRFs from the items of ascale can be summed to obtain the test response function (TRF). The TRF indi-cates the expected number correct of an examinee at a given level of the latent trait.The test information function (TIF) results from summing the IIFs from all itemsof a scale. Much like the IIF, the TIF shows the point(s) on the theta continuum atwhich the entire scale is most discriminating. For example, a test that is peaked atthe high end of the psychopathy continuum would be very accurate at measuringsubtle distinctions in the trait levels of respondents with high levels of psychopa-thy but would not accurately measure subtle distinctions at the mean or low levels.Likewise, the conditional SEMs for each item can be summed to provide a scaleconditional SEM. This function indicates, for every level of the latent trait dimen-sion, the amount of imprecision expected in the estimated score for a respondent.For example, assume a psychopathy scale has a low conditional SEM at the upperend of the continuum but high conditional SEM at the lower end. A test user couldknow that high scores on the scale are relatively precise estimates of a respon-dent’s psychopathy level, and the test user could be confident in using the scale forscreening high-psychopathy respondents. However, the test user would benefitfrom knowing that low scores are relatively imprecise, as there may not be a sub-stantial difference between the actual psychopathy level of a person who scores inthe average range and a person who scores in the below-average range. UnlikeCTT, which simply provides single global measures of whether a scale is precise,IRT provides information that can guide the test user in determining when and forwhat purposes a scale is most useful. This information holds great potential forpersonality assessment researchers.
Potential of IRT for Personality Assessment
There are at least three potential applications of IRT for use in personality assess-ment. One of the most apparent is that of scale construction, because IRT item anal-ysis provides information that can be used for evaluating a large pool of items andthen selecting the items that best suit one’s testing purpose (Waller et al., 1996). Forexample, if a test constructor sought to design a test to screen for highly aggressiveinmates in a prison population, items with high discrimination values and high dif-ficulty values on an aggressiveness latent trait would be selected. The resulting
290 ROUSE, FINGER, BUTCHER
Copyright © 2000 All Rights Reserved
scale would then be very discriminating at high ends of the aggressiveness contin-uum, and the examinees would not be required to respond to items that are only dis-criminating at low ends of the continuum. However, if a test constructor wanted todesign a test of constraint that effectively assessed the entire range of the trait di-mension, that test constructor could select a set of items with difficulty valuesspread out across the continuum. This approach to personality scale constructionwas demonstrated by Waller et al. (1996) in the creation of a Negative Emotionalityscale for the Multidimensional Personality Questionnaire.
A second application of IRT is in the determination of differential item func-tioning (DIF) for two populations (Cooke & Michie, 1997; Lim & Drasgow,1990). When mean scores on a scale differ between two populations, that meanscore difference is ambiguous. It could indicate that the two populations differ onthe construct being assessed or it could indicate that the test items function differ-ently for the two populations. DIF can be assessed by comparing IRFs obtained onthe same item from two different populations. For example, we might expect themean score on a scale of stereotypical masculine interests to differ for a sample ofmale military personnel and male college freshmen, even though we would expectto see a wide range of individual differences within each sample. If the IRFs ob-tained for each sample were similar (indicating that individuals with a high level ofthe latent trait are equally likely to endorse the item regardless of the sample towhich they belong and individuals with a low level of the trait are unlikely to en-dorse the item regardless of the sample), we could conclude that the item is not bi-asing in the measurement of the trait. If, however, DIF exists for the item, the IRFswill differ, and a substantial area will be seen between the two curves. This holdsgreat promise for the field of personality assessment, both in examining thegeneralizability of a scale within one culture and in examining the comparabilityof a test translation.
Third, using IRT technology, a unidimensional personality scale can be sub-stantially shortened through computerized adaptive testing (CAT; Waller & Reise,1989). For example, in Figure 2, after the administration of just two items, the mostlikely z score for the hypothetical examinee was atθ = –0.6, although a greatamount of imprecision still was present. In the CAT approach, the computer wouldnext select an item that provided discrimination near a difficulty level of –0.6,rather than selecting items that provided little information at that level of the thetadimension. Systematic selection of items would continue until a precise estimateof the examinee’s latent trait level was obtained, using fewer items and taking lesstime to administer (Weiss, 1985).
Previous Personality Assessment Research With IRT
Although IRT has been widely researched and utilized for educational measure-ment applications, IRT applications to personality assessment have received sub-
IRT AND THE MMPI–2PSY–5SCALES 291
Copyright © 2000 All Rights Reserved
stantially less attention. However, among the published applications to personalityassessment, IRT methods have provided psychometric data for the Beck Depres-sion Inventory (Hammond, 1995), the Eysenck Personality Questionnaire (Zumbo,Pope, Watson, & Hubley, 1997), the Eysenck Personality Inventory (Ferrando,1994), the Hare Psychopathy Checklist (Cooke & Michie, 1997), an abbreviatedform of the Myers–Briggs Type Indicator (Harvey, Murry, & Markham, 1994), se-lected scales from the MMPI–2 (Panter, Swygert, Dahlstrom, & Tanaka, 1997), theMultidimensional Personality Questionnaire (Reise & Waller, 1990), the Rosen-berg Self-Esteem Scale (Gray-Little, Williams, & Hancock, 1997), the Self-Description Questionnaire (Flannery, Reise, & Widaman, 1995), and the TrierPersonality Inventory (Ellis, Becker, & Kimmel, 1993). In addition to providingpsychometric data, IRT has been used to detect invalid responding (Zickar &Drasgow, 1996), to develop alternative scale scoring methods (Harvey & Murry,1994), to examine the accuracy of scale translations (Ellis et al., 1993), to compareresponse-style differences between clinical and normative samples (Hammond,1995), to develop efficient trait scales (Waller et al., 1996), and to compare CATwith standard paper-and-pencil tests (Waller & Reise, 1989).
A few published studies (Carter & Wilkinson, 1984; Chang, 1996; de Jong-Gierveld & Kamphius, 1985) have used a one-parameter model that only com-pares items on the difficulty (b) parameter. However, studies that have comparedthe one-parameter and two-parameter models (Ferrando, 1994; Gray-Little et al.,1997) have demonstrated better data fit for the two-parameter model, indicatingthat all personality inventory items cannot be assumed to discriminate equally.Most studies have used the two-parameter model instead, although some (Harvey& Murry, 1994; Zumbo et al., 1997) have used the three-parameter model.
Despite the value this approach presents for personality assessment (Thissen &Steinberg, 1988), much of the IRT research to this day is carried out in the educa-tional measurement area. The relatively slow progress in IRT applications to per-sonality assessment can be explained in part by considering that IRT was formallydeveloped by educational measurement specialists (e.g., Lord, 1952), and much ofthe language (e.g., “item difficulty,” “pseudo-guessing/chance parameter”) stillreflects this heritage. Thus, this article is intended to introduce IRT to personalityassessment researchers and practitioners who are not immediately familiar with itsmethodology by demonstrating how the technique can be used to evaluate a set ofpersonality trait scales.
THE MMPI–2 PSY–5 SCALES
The PSY–5(Harkness & McNulty, 1994) are five broad dimensions developedto represent the structure of normative personality and personality pathology. Asdescribed by Harkness (1993), these dimensions address five key pieces of in-
292 ROUSE, FINGER, BUTCHER
Copyright © 2000 All Rights Reserved

formation that one would want to know about another person in many interper-sonal situations, ranging from understanding the personality of a potentialroommate to summarizing the personality pathology of a psychiatric inpatient.The five pieces of information are Aggressiveness (i.e., is the person aggressive,assaultive, and domineering, or is the person more likely to be submissive andnonassertive?), Psychoticism (i.e., is the person likely to have unrealistic beliefs,misperceptions, and psychotic experiences, or does the person have a healthycontact with reality?), Constraint (i.e., is the person emotionally and behavior-ally controlled, or is the person a disorganized risk taker with little regard for le-gality?), Negative Emotionality/Neuroticism (NEM; i.e., is the person tense,anxious, and likely to experience negative affect, or is the person more likely tobe nonreactive to stress and emotionally stable?), and Positive Emotionality/Extraversion (PEM; i.e., is the person energetic and interested in social contactsor anhedonic and withdrawn?).
Harkness, McNulty, and Ben-Porath (1995) constructed scales to measure eachof these five dimensions using items from the MMPI–2. A panel of trained ratersnominated items from the MMPI–2 that reflected each dimension. The resultingsets of items were refined using rational and empirical criteria. The final scales hadinternal consistency estimates ranging from .68 to .84 (based on the MMPI–2 nor-mative sample), and the construct validity of the scales has been demonstratedthrough correlations with other published scales designed to measure similar traits(Harkness et al., 1995; McNulty, Harkness, & Ben-Porath, 1998) and through cor-relations with therapist-rated symptom indexes (Rouse, 1997). Despite the re-cency of their development, several studies have demonstrated the usefulness ofthese scales in the understanding of inpatient and outpatient pathology (Eggers,Derksen, & DeMey, 1997), substance abuse (Rouse, Butcher, & Miller, 1997), andpersonality disorders (McNulty, Ben-Porath, & Watt, 1997).
The purpose of this study was to demonstrate the usefulness of IRT in examin-ing the psychometric properties of clinical personality assessment measures. TheMMPI–2 PSY–5scales were selected for two reasons. First, all five scales appearto be unidimensional and thus meet a primary assumption of IRT (Hambleton &Swaminathan, 1985). Second, because these scales are relatively new develop-ments, an IRT-based analysis would aid in the understanding and effective use ofthese scales.
METHOD
This study used the MMPI–2 item responses for a sample of 1,600 individuals. Thissample of 800 heterosexual couples living together is part of the larger MMPI–2Restandardization Sample (Butcher, Dahlstrom, Graham, Tellegen, & Kaemmer,1989). However, because extensive biographical information was provided by
IRT AND THE MMPI–2PSY–5SCALES 293
Copyright © 2000 All Rights Reserved
each participant and personality ratings were provided by each participant’s spouseor partner, this smaller sample has been used as a part of the MMPI–2 normativestudy to obtain external validation of many MMPI–2 scales. The item parametersfor the three-parameter model were estimated with XCALIBRE (Assessment Sys-tems Corporation, 1996), which uses marginal maximum likelihood (Bock &Aitkin, 1981; Harwell, Baker, & Zwarts, 1988) in the estimation of the logisticmodel.
RESULTS AND DISCUSSION
Unidimensionality
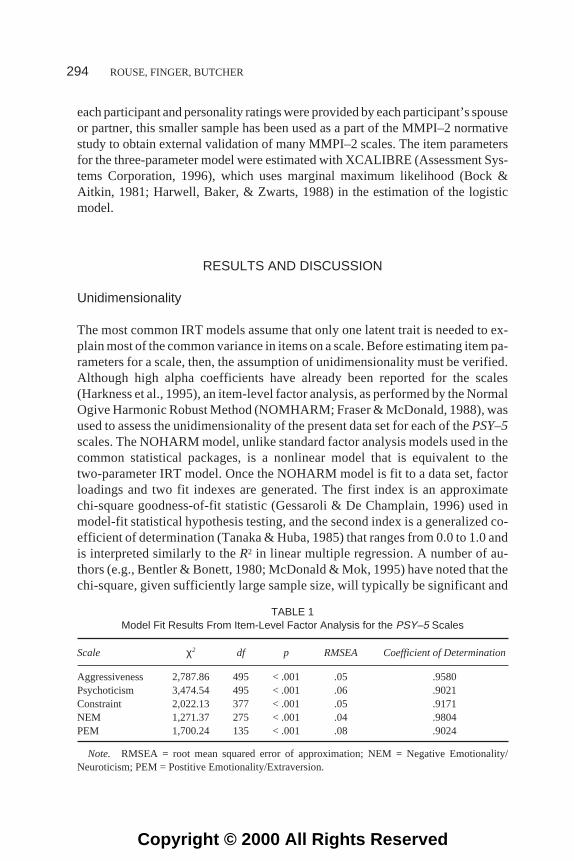
The most common IRT models assume that only one latent trait is needed to ex-plain most of the common variance in items on a scale. Before estimating item pa-rameters for a scale, then, the assumption of unidimensionality must be verified.Although high alpha coefficients have already been reported for the scales(Harkness et al., 1995), an item-level factor analysis, as performed by the NormalOgive Harmonic Robust Method (NOMHARM; Fraser & McDonald, 1988), wasused to assess the unidimensionality of the present data set for each of thePSY–5scales. The NOHARM model, unlike standard factor analysis models used in thecommon statistical packages, is a nonlinear model that is equivalent to thetwo-parameter IRT model. Once the NOHARM model is fit to a data set, factorloadings and two fit indexes are generated. The first index is an approximatechi-square goodness-of-fit statistic (Gessaroli & De Champlain, 1996) used inmodel-fit statistical hypothesis testing, and the second index is a generalized co-efficient of determination (Tanaka & Huba, 1985) that ranges from 0.0 to 1.0 andis interpreted similarly to theR2 in linear multiple regression. A number of au-thors (e.g., Bentler & Bonett, 1980; McDonald & Mok, 1995) have noted that thechi-square, given sufficiently large sample size, will typically be significant and
294 ROUSE, FINGER, BUTCHER
TABLE 1Model Fit Results From Item-Level Factor Analysis for the PSY–5 Scales
Scale χ2 df p RMSEA Coefficient of Determination
Aggressiveness 2,787.86 495 < .001 .05 .9580Psychoticism 3,474.54 495 < .001 .06 .9021Constraint 2,022.13 377 < .001 .05 .9171NEM 1,271.37 275 < .001 .04 .9804PEM 1,700.24 135 < .001 .08 .9024
Note. RMSEA = root mean squared error of approximation; NEM = Negative Emotionality/Neuroticism; PEM = Postitive Emotionality/Extraversion.
Copyright © 2000 All Rights Reserved

thus will reject the model even in the presence of acceptable fit. For this reason,the approximate chi-square statistic can be transformed into a root mean squarederror of approximation (RMSEA; Browne & Cudeck, 1993; Steiger, 1990).RMSEA is an effect-size measure of model fit indicating the extent to which amodel fits a data set. A model is considered to have reasonable fit when theRMSEA value is at or below 0.08. The results of the item factor analysis and theresulting coefficient of determination, approximate chi-square, and RMSEA arepresented in Table 1. It should be noted that these results must be interpreted withminor caution, as the two-parameter model was used for the item factor analysis.Lack of model fit may be due to multidimensionality, true nonzeroc parametervalues, or both. Nonetheless, all RMSEA values were at or below 0.08 and all co-efficients of determination were above .90, indicating an acceptable degree ofunidimensionality.
Item Parameters
The estimates of thea, b,andcparameters and residual values for each of thePSY–5scales are presented in Tables 2 through 6. Theresidual valueis an index of the ex-
IRT AND THE MMPI–2PSY–5SCALES 295
TABLE 2Final Item Parameter Estimates for the PSY–5 Aggressiveness Scale
Item a b c Residual
27 0.73 2.19 .08 0.6950 0.40 0.44 .08 0.8570 0.47 –1.30 .07 0.7785 0.69 2.72 .08 0.58134 0.98 2.50 .06 0.78239 0.53 1.38 .07 0.54323 1.00 3.00 .05 1.78324 0.96 3.00 .05 2.23346 0.39 –0.92 .08 0.90350 0.66 –0.34 .07 0.65358 0.74 2.19 .06 0.64414 0.59 0.70 .08 0.49423 0.53 0.87 .08 0.34446 0.43 –0.63 .07 0.86452 0.54 –0.78 .07 0.44503 0.53 –2.20 .07 0.87521 0.60 –0.78 .07 0.81548 0.84 2.53 .06 0.64M 0.65 0.81 .07 0.83SD 0.20 1.69 .01 0.46
Copyright © 2000 All Rights Reserved

tent to which the item fails to fit the model selected. An item with a residual valuegreater than 2.0 did not adequately fit the model (Assessment Systems Corporation,1996).
The a parameter. In general, the estimates of discrimination supported theprevious observation that typical personality items haveaparameters ranging from0.50 to 1.50 (Waller et al., 1996). A dramatic difference was seen, however, be-tween the discrimination of the Psychoticism scale and the other four scales. ForPsychoticism, estimates ofa ranged from 1.02 to 1.67 (M = 1.45), indicating verysteep slopes and thus very discriminating IRFs. For the other four scales, mostitems had estimates less than 1.0, indicating a more gradual discrimination. In otherwords, most items on the Psychoticism scale are very discriminating across a short
296 ROUSE, FINGER, BUTCHER
TABLE 3Final Item Parameter Estimates for the PSY–5 Psychoticism Scale
Item a b c Residual
24 1.58 3.00 .07 5.2042 1.53 3.00 .07 5.2848 1.24 2.86 .11 3.1572 1.48 3.00 .08 4.5696 1.45 3.00 .09 3.7599 1.47 3.00 .08 4.23138 1.53 3.00 .07 5.74144 1.52 3.00 .36 6.28184 1.02 1.57 .32 0.83198 1.67 3.00 .06 6.16241 1.24 2.43 .13 2.65259 1.47 2.24 .13 2.46315 1.29 1.23 .23 0.45319 1.54 3.00 .09 3.91336 1.55 3.00 .06 6.03355 1.56 3.00 .06 5.98361 1.55 3.00 .07 4.96374 1.45 1.45 .20 0.75427 1.21 3.00 .17 1.74448 1.11 2.44 .14 2.38466 1.24 1.70 .19 0.89490 1.42 3.00 .12 2.50508 1.22 2.06 .14 1.99549 1.53 2.58 .11 2.97551 1.35 2.42 .12 2.71M 1.45 2.67 .11 3.90SD 0.16 0.60 .07 1.95
Copyright © 2000 All Rights Reserved

range of the theta continuum but nondiscriminating in other regions, whereas mostitems on the other scales are not as discriminating at any one point, but their dis-crimination is spread over a wider range of the theta continuum.
The b parameter. Dramatic differences were seen between the Psychoti-cism scale and the other four scales on thebparameter as well. For the Psychoticismscale, 14 of the 25 items had difficulties greater than 2.95; the lowest difficulty foran item on this scale was 0.23. This suggests that the scale’s discriminability is pri-marily limited to respondents with latent trait values more than 1SD above the
IRT AND THE MMPI–2PSY–5SCALES 297
TABLE 4Final Item Parameter Estimates for the PSY–5 Constraint Scale
Item a b c Residual
34 0.37 –2.16 .18 0.7535 0.75 0.20 .14 1.0284 0.84 –1.92 .17 0.4088 0.78 3.00 .11 1.33100 0.70 1.01 .14 0.89103 0.32 –1.09 .18 0.78105 0.89 –1.14 .16 0.60121 0.56 –0.81 .18 0.30123 0.63 –0.43 .17 0.17126 0.66 –3.00 .17 1.41154 0.38 0.72 .19 0.71209 0.63 0.37 .18 0.54222 0.83 3.00 .10 1.62250 0.63 –0.48 .17 0.35263 0.32 –2.11 .18 0.80266 0.63 –0.92 .17 0.63284 0.33 0.79 .18 0.90309 0.54 3.00 .22 0.80344 0.46 0.64 .17 0.34351 0.87 1.34 .12 0.93362 0.52 1.17 .17 0.32385 0.44 1.16 .19 0.49402 0.33 1.61 .20 0.88412 0.61 –2.14 .17 0.57417 0.55 –1.41 .18 0.31418 0.39 –0.01 .18 0.54431 0.64 –2.97 .17 0.62477 0.48 –1.11 .18 0.54497 0.59 3.00 .18 0.44M 0.60 –0.11 .17 0.78SD 0.19 1.80 .03 0.39
Copyright © 2000 All Rights Reserved

mean. The highly discriminating items with homogenous difficulties lead to the ex-pectation that this scale will primarily show its strength in screening respondentswith high levels of Psychoticism, not in differentiating between respondents withaverage and below-average levels of Psychoticism. For the remaining four scales,difficulties were widely dispersed over the latent trait continuum, leading to the ex-pectation of greater versatility than the Psychoticism scale.
298 ROUSE, FINGER, BUTCHER
TABLE 5Final Item Parameter Estimates for the PSY–5 NEM Scale
Item a b c Residual
37 0.57 0.87 .07 0.7452 0.79 2.39 .06 0.7663 0.51 –0.31 .07 0.5482 0.92 1.69 .05 0.9193 0.53 –2.86 .07 1.15116 0.77 0.90 .06 0.87166 0.71 2.47 .06 0.74196 0.99 –0.03 .06 0.37213 0.62 0.56 .07 0.70223 0.78 2.13 .07 0.36290 0.65 –0.09 .07 0.42301 1.03 1.62 .05 1.30305 0.74 1.26 .06 0.38329 1.14 3.00 .05 3.27372 0.78 1.00 .06 0.47375 0.54 1.40 .07 0.67389 0.83 2.02 .05 1.07390 0.59 0.67 .07 0.59395 0.81 2.50 .06 0.46397 0.68 2.38 .07 0.56405 1.01 1.60 .06 0.59407 0.83 3.00 .07 0.70409 0.54 0.45 .07 0.85415 1.12 1.05 .06 0.75435 0.81 2.44 .06 0.33442 0.67 –0.50 .07 0.70444 0.79 1.48 .06 0.29451 0.92 2.09 .05 0.90496 0.48 –0.03 .07 0.97513 1.07 1.41 .05 1.00542 0.62 0.21 .07 0.84556 0.92 0.83 .06 0.62564 0.79 1.62 .07 0.21M 0.75 1.04 .06 0.85SD 0.18 1.34 .01 0.66
Note. NEM = Negative Emotionality/Neuroticism.
Copyright © 2000 All Rights Reserved
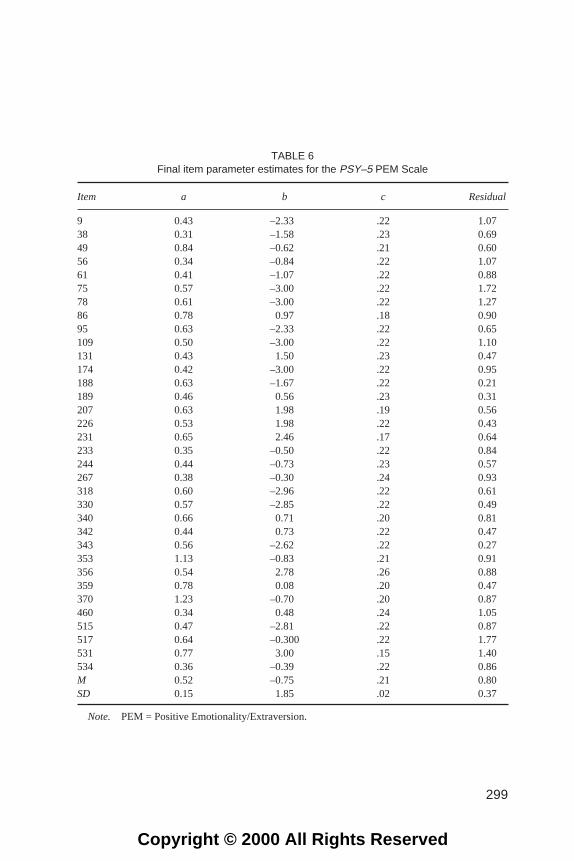
TABLE 6Final item parameter estimates for the PSY–5 PEM Scale
Item a b c Residual
9 0.43 –2.33 .22 1.0738 0.31 –1.58 .23 0.6949 0.84 –0.62 .21 0.6056 0.34 –0.84 .22 1.0761 0.41 –1.07 .22 0.8875 0.57 –3.00 .22 1.7278 0.61 –3.00 .22 1.2786 0.78 0.97 .18 0.9095 0.63 –2.33 .22 0.65109 0.50 –3.00 .22 1.10131 0.43 1.50 .23 0.47174 0.42 –3.00 .22 0.95188 0.63 –1.67 .22 0.21189 0.46 0.56 .23 0.31207 0.63 1.98 .19 0.56226 0.53 1.98 .22 0.43231 0.65 2.46 .17 0.64233 0.35 –0.50 .22 0.84244 0.44 –0.73 .23 0.57267 0.38 –0.30 .24 0.93318 0.60 –2.96 .22 0.61330 0.57 –2.85 .22 0.49340 0.66 0.71 .20 0.81342 0.44 0.73 .22 0.47343 0.56 –2.62 .22 0.27353 1.13 –0.83 .21 0.91356 0.54 2.78 .26 0.88359 0.78 0.08 .20 0.47370 1.23 –0.70 .20 0.87460 0.34 0.48 .24 1.05515 0.47 –2.81 .22 0.87517 0.64 –0.300 .22 1.77531 0.77 3.00 .15 1.40534 0.36 –0.39 .22 0.86M 0.52 –0.75 .21 0.80SD 0.15 1.85 .02 0.37
Note. PEM = Positive Emotionality/Extraversion.
299
Copyright © 2000 All Rights Reserved

The c parameter. The lower asymptote values varied across scales. For Ag-gressiveness and NEM, all thec estimates were somewhat low, between .05 and.08. For these scales, the pseudo-guessing factor did not appear to have a great in-fluence on responses to the individual items. Estimates ofc were greater and morevariable for the Psychoticism, Constraint, and PEM scales. Although Reise andWaller (1990) advocated the use of a two-parameter model for personality items,the results here suggest that the pseudo-guessing factor does have a notable influ-ence on responses to these items. A possible interpretation of this parameter is pro-posed later.
Item residuals. An examination of residual values highlighted an additionaldifference between the Psychoticism scale and the other four scales. Only one prob-lematic item was observed for the Aggressiveness and NEM scales, and all itemsappeared to fit the model for the Constraint and PEM scales. However, of the 25items on the Psychoticism scale, 19 had residual values greater than 2.0, indicatinga poor fit to the IRT model chosen. For these large residual items, theb valuestended to exceed 2.5, indicating few participants endorsed the items in the keyed di-rection. Given that this sample likely has a low base rate of psychoticism, the lowendorsement rate is logical.
TIFs
The TIFs for thePSY–5scales are displayed in Figure 5. Two distinctly differentpatterns can be seen in these functions. First, the functions for three of the scales(i.e., Aggressiveness, Psychoticism, and NEM) were positively skewed; eachreached its peak at the high end of its trait dimension. Although the pattern was ap-parent for all three, it was most clear on the Psychoticism scale, a scale that pro-vided almost no information below a theta of 1.0 and showed its greatest discrimi-nation among respondents who had thetas between 2.0 and 3.0. This indicates that atest user would be unwise to overinterpret low and moderate scores because theremay be little observable difference between an examinee who obtained a score atthe mean and an examinee who obtained a score 1SDbelow the mean. However,the effectiveness of this scale lies in its ability to identify people with very high lev-els of the Psychoticism trait and to measure subtle quantitative differences betweenhigh-scoring respondents. Although the pattern is not as strong for either the Ag-gressiveness or NEM scale, the same conclusions apply. It should be noted thatthese three scales represent constructs for which an elevated score represents pa-thology, suggesting that these scales are very useful as screening tools but shouldnot be overinterpreted for scores within normal limits.
The second pattern that emerged, seen for the Constraint and PEM scales, was anonskewed function, indicating that these two scales provide their discrimination
300 ROUSE, FINGER, BUTCHER
Copyright © 2000 All Rights Reserved

FIGURE 5 Test information functions for the MMPI–2PSY–5scales.
301
Copyright © 2000 All Rights Reserved

at the midrange of the dimension. This suggests that these two scales are most reli-able for measuring the traits of midlevel respondents. However, compared with theother three scales, the information level was relatively stable across the contin-uum, suggesting that they are versatile enough to permit the reliable measurementof Constraint and PEM for respondents who have high, moderate, and low levelsof the traits.
Reconceptualization of the c Parameter
When IRT is applied to measures of abilities, the lower asymptote is characterizedas a pseudo-guessing factor or pseudo-chance factor, acknowledging that a personof very low ability may still answer a question correctly merely by randomly select-ing a correct multiple-choice response. Although the concept of guessing is notmeaningful when measuring personality traits, little attention has been paid to themeaning ofc in personality assessment. Because this third parameter represents asource of variance that is independent of a person’s trait level but still influences theprobability of a person endorsing an item, we examined the hypothesis that thecpa-rameter was influenced by the social desirability (SoD) of the item. In other words,an item on a personality measure may be written in such a way that a person with avery low level of a trait may still endorse that item because of the SoD of that item; ifthis were the case, the lower asymptote of the IRF would not reach 0.00 but wouldinstead level off at a higher probability level. Although Zumbo et al. (1997) also hy-pothesized a relation between thecparameter and SoD, this conjecture has not beenpreviously tested.
SoD ratings for the items were obtained from the MMPI–2 manual (Butcher etal., 1989); these ratings were made on a Likert scale ranging from 1 (undesirable)to 9 (desirable). For all of the items that were in the original version of the MMPI(which includes most of the items on thePSY–5scales), these SoD ratings wereoriginally obtained from a sample of 171 college students more than three decadesago (Messick & Jackson, 1961). For new items on the MMPI–2, desirability rat-ings were obtained during the MMPI–2 restandardization (Butcher et al., 1989).
For each scale, SoD ratings for the items on the scale were correlated with thecestimates for the same items; for items that are reverse keyed on thePSY–5scales,the SoD ratings were transposed. The correlation coefficients obtained were .49(Aggressiveness), .60 (Psychoticism), .10 (Constraint), .31 (NEM), and .20 (PEM).This indicates that thec parameters for these personality trait measures are influ-enced by the SoD of the items, although the degree of influence varies from scaleto scale. For some scales (i.e., Aggressiveness and Psychoticism) thec parameteraccounted for 25 to 36% of the variance in SoD ratings. However, for other scales(i.e., Constraint and PEM), thec parameter only accounted for 1 to 4% of the vari-ance in SoD ratings.
302 ROUSE, FINGER, BUTCHER
Copyright © 2000 All Rights Reserved

Notably, the three scales that showed the strongest relations between SoD andthec parameter were three scales that could be conceptualized as unidirectionallypathological, namely, Aggressiveness, Psychoticism, and NEM. However, one re-viewer speculated that these relations may be confounded by the difficulty of theitems; that is, frequently endorsed (or “easy”) items would slope at a lower pointon theta than less frequently endorsed items. As a result, they would not havereached their lower asymptote even at 3SDbelow the mean, causing an artificiallyelevated estimate of the lower asymptote. This, the reviewer pointed out, couldhave generated the sizable correlations. Although this is a reasonable alternate hy-pothesis, Tables 2 through 6 suggest that the correlation is not simply due to a con-founding with item difficulty. It is true that the two highest meanc parameterestimates were obtained for the two scales with lowest mean item difficulties (i.e.,Constraint and PEM); however, these were also the two scales with the lowest cor-relations betweenc and SoD. This suggests that the relation among thec parame-ter, item difficulty, and SoD is complex and should be explored in greater detail infuture research. First, future research should attempt to disentangle the relation be-tween SoD and thec parameter using contemporary samples. It is reasonable tohypothesize that the relations might have been higher if thec estimates had beencompared to ratings of SoD that are more recent and reflective of the opinions ofadults, rather than those of college students. For example, SoD ratings of Con-straint items given by college students in 1961 may not reflect the actual SoD ofthe items as read by this contemporary adult sample. Second, future researchshould explore the value of the fourth parameter, the estimate of the upper asymp-tote. Just as the third parameter may reflect the tendency of a low-traited person toendorse an item because of its desirability even if that response is not accurate, thefourth parameter may reflect the tendency of a high-traited person to avoid endors-ing an item because of its undesirability. In this case, an undesirable item’s upperasymptote may never reach 1.00 because even high-traited people may avoid en-dorsing it. However, as already described, little attention has been paid to thefour-parameter model, no commercial programs have been developed to estimatethis parameter, and the estimations of the third and fourth parameters are less reli-able than the estimation ofa andb,so this line of inquiry is fraught with complica-tion. In sum, future research should use contemporary ratings of item SoD todisentangle the relations among SoD, the asymptote estimates, and item difficulty.
CONCLUSIONS
Personality test developers and researchers are encouraged to include IRT methodsin the toolbox of psychometric methods used to evaluate new trait measures. UnlikeCTT, which essentially provides only an indication of whether a scale is or is notpsychometrically sound, one advantage of the use of IRT is that it allows for a more
IRT AND THE MMPI–2PSY–5SCALES 303
Copyright © 2000 All Rights Reserved

comprehensive description of the purposes for which a scale is most useful. An ex-amination of the TIF for a specific scale will identify the region of a trait dimensionfor which the scale provides its strongest prediction. For example, this study dem-onstrated that the NEM scale is most discriminating among respondents who aremore than 1SDabove the mean, which allows the responsible test user to know themost effective use of the scale. One could conclude that scores below a theta of 1.0are less precise on the NEM scale than those above that level. As such, the focus forthis scale should be on its use in the measurement of high NEM. However, otherscales (specifically Constraint and PEM) are more consistently precise forexaminees at all levels of the traits.
In addition to providing a more comprehensive understanding of the potentialuses of a scale, these methods will allow the field to continue moving toward CAT.For example, we are currently preparing a simulated CAT study of the MMPI–2PSY–5scales. Using the item parameters listed in Tables 2 through 6 and using aclinical data set, we will determine whether it is possible to obtain precise scoreson these scales using a smaller number of items. The value of this technology isdramatic; as the managed care movement continues to influence the practice ofclinical psychology, placing greater emphasis on procedural efficiency, the fieldof personality assessment will benefit from exploring whether CAT, powered byIRT methods, could allow for shortened testing sessions and still provide accurateassessment of personality traits.
Future research should also examine the differences between IRT analyses per-formed on normative samples and those performed on clinical samples, especiallywhen the construct being measured is a pathological trait. In this study, for exam-ple, the items on the Psychoticism scale showed poor fit to the IRT model. This isvery likely because very few respondents endorsed the items in the pathologicaldirection. Had the study been performed using a more diverse sample, utilizing re-sponses from normative and clinical respondents, the sample would have beenmore widely distributed over the latent dimension. It is likely that, under these con-ditions, the items on this pathologically oriented scale would have shown a closerfit to the IRT model. Future personality researchers are encouraged to use hetero-geneous samples, ensuring complete coverage of the latent dimension, when con-ducting IRT analyses of clinically relevant scales.
ACKNOWLEDGMENTS
We thank Beverly Kaemmer of the University of Minnesota Press for permission touse the MMPI–2 Normative Couples data set for this study. In addition, we thank totwo anonymous reviewers who provided valuable recommendations for the furtherdevelopment of this article.
304 ROUSE, FINGER, BUTCHER
Copyright © 2000 All Rights Reserved

Portions of this article were presented at the 33rd Annual Symposium on Re-cent Developments in the Use of the MMPI–2 and MMPI–A, Clearwater Beach,FL, March 1998.
REFERENCES
Assessment Systems Corporation. (1996). User’s manual for the XCALIBRE marginal maximum-likelihood estimation program [Computer software manual]. St. Paul, MN: Author.
Bentler, P. M., & Bonett, D. G. (1980). Significance tests and the goodness of fit in the analysis ofcovariance structures.Psychological Bulletin, 88,588–606.
Bock, R. D., & Aitkin, M. (1981). Marginal maximum likelihood estimation of item parameters: An ap-plication of an EM algorithm.Psychometrika, 46,443–459.
Browne, M. W., & Cudeck, R. (1993). Alternative ways of assessing model fit. In K. A. Bollen & J. S.Long (Eds.),Testing structural equation models(pp. 136–162). Newbury Park, CA: Sage.
Butcher, J. N., Dahlstrom, W. G., Graham, J. R., Tellegen, A., & Kaemmer, B. (1989).MMPI–2 (Minne-sota Multiphasic Personality Inventory–2): Manual for administration and scoring.Minneapolis:University of Minnesota Press.
Carter, J. E., & Wilkinson, L. (1984). A latent trait analysis of the MMPI.Multivariate Behavioral Re-search, 19,385–407.
Chang, C. H. (1996). Finding two dimensions in MMPI–2 depression.Structural Equation Modeling, 3,41–49.
Cooke, D. J., & Michie, C. (1997). An item response theory analysis of the Hare PsychopathologyChecklist–Revised.Psychological Assessment, 9,3–14.
Crocker, L., & Algina, J. (1986).Introduction to classical and modern test theory.Fort Worth, TX: Har-court Brace Jovanovich.
de Jong-Gierveld, J., & Kamphius, F. (1985). The development of a Rasch-type loneliness scale.Ap-plied Psychological Measurement, 9,289–299.
Eggers, J. I. M., Derksen, J. J. L., & DeMey, H. M. R. (1997, June).Validation of MMPI–2 scales andprofiles in outpatient and inpatient settings.Paper presented at the 32nd Annual Symposium on Re-cent Developments in the Use of the MMPI–2 and MMPI–A, Minneapolis, MN.
Ellis, B. B., Becker, P., & Kimmel, H. D. (1993). An item response theory evaluation of an English ver-sion of the Trier Personality Inventory.Journal of Cross-Cultural Psychology, 24,133–148.
Ferrando, P. J. (1994). Fitting item response models to the EPI–A Impulsivity subscale.Educationaland Psychological Measurement, 54,118–127.
Flannery, W. P., Reise, S. P., & Widaman, K. F. (1995). An item response theory analysis of the generaland academic scales of the Self-Description Questionnaire–II.Journal of Research in Personality,29,168–188.
Fraser, C., & McDonald, R. P. (1988). NOHARM: Least squares item factor analysis.Multivariate Be-havioral Research, 23,267–269.
Gessaroli, M. E., & De Champlain, A. F. (1996). Using an approximate chi-square statistic to test thenumber of dimensions underlying the responses to a set of items.Journal of Educational Measure-ment, 33,157–180.
Gray-Little, B., Williams, V. S. L., & Hancock, T. D. (1997). An item response theory analysis of theRosenberg Self-Esteem Scale.Personality and Social Psychology Bulletin, 23,443–451.
Hambleton, R. K., & Swaminathan, H. (1985).Item response theory: Principles and applications.Boston: Kluwer Nijhoff.
Hambleton, R. K., Swaminathan, H., & Rogers, H. J. (1991).Fundamentals of item response theory.Newbury Park, CA: Sage.
IRT AND THE MMPI–2PSY–5SCALES 305
Copyright © 2000 All Rights Reserved
Hammond, S. M. (1995). An IRT investigation of the validity of non-patient analogue research using theBeck Depression Inventory.European Journal of Psychological Assessment, 11,14–20.
Harkness, A. R. (1993). The dictionary, the diagnostic manual, and the MMPI–2 too: ThePSY–5scales.MMPI–2 and MMPI–A News and Profiles, 4,2–3.
Harkness, A. R., & McNulty, J. L. (1994). The Personality Psychopathology Five (PSY–5): Issue fromthe pages of a diagnostic manual instead of a dictionary. In S. Strack & M. Lorr (Eds.),Differenti-ating normal and abnormal personality(pp. 291–315). New York: Springer.
Harkness, A. R., McNulty, J. L., & Ben-Porath, Y. S. (1995). The Personality Psychopathology Five(PSY–5): Constructs and MMPI–2 scales.Personality Assessment, 7,104–114.
Harvey, R. J., & Murry, W. D. (1994). Scoring the Myers–Briggs Type Indicator: Empirical comparisonof preference score versus latent-trait methods.Journal of Personality Assessment, 62,116–129.
Harvey, R. J., Murry, W. D., & Markham, S. E. (1994). Evaluations of three short-form versions of theMyers–Briggs Type Indicator.Journal of Personality Assessment, 63,181–184.
Harwell, M. R., Baker, F. B., & Zwarts, M. (1988). Item parameter estimation via marginal maximumlikelihood and an EM algorithm: A didactic.Journal of Educational Statistics, 13,243–271.
Lim, R. G., & Drasgow, F. (1990). Evaluation of two methods for estimating item response theory pa-rameters when assessing differential item functioning.Journal of Applied Psychology, 75,164–174.
Lord, F. M. (1952).A theory of test scores.Iowa City, IA: Psychometric Society.Lord, F. M. (1980).Applications of item response theory to practical testing problems.Hillsdale, NJ:
Lawrence Erlbaum Associates, Inc.McDonald, R. P., & Mok, M. M. C. (1995). Goodness of fit in item response models.Multivariate
Behaviorial Research, 30,23–40.McNulty, J. L., Ben-Porath, Y. S., & Watt, M. (1997, June).Predicting SCID–II personality disorder
symptomology: A comparison of the PSY–5 and Big Five models.Paper presented at the 32nd An-nual Symposium on Recent Developments in the Use of the MMPI–2 and MMPI–A, Minneapolis,MN.
McNulty, J. L., Harkness, A. R., & Ben-Porath, Y. S. (1998, March).Theoretical assertions and empiri-cal evidence: How the MMPI–2 PSY–5 scales are linked with the MPQ, ZKPQ–III, and NEO–PI–R.Paper presented at the 33rd Annual Symposium on Recent Developments in the Use of the MMPI–2and MMPI–A, Clearwater Beach, FL.
Messick, S., & Jackson, D. N. (1961). Desirability scale values and dispersion for MMPI items.Psycho-logical Reports, 8,409–419.
Panter, A. T., Swygert, K. A., Dahlstrom, W. G., & Tanaka, J. S. (1997). Factor-analytic approaches topersonality item-level data.Journal of Personality Assessment, 68,561–589.
Reise, S. P., & Waller, N. G. (1990). Fitting the two-parameter model to personality data.Applied Psy-chological Measurement, 14,45–58.
Rouse, S. V. (1997).The construct validity of the MMPI–2 PSY–5 scales in a clinical setting.Unpub-lished doctoral dissertation, University of Minnesota, Minneapolis.
Rouse, S. V., Butcher, J. N., & Miller, K. B. (1997, June).Assessment of substance abuse problems in asample of psychotherapy patients.Paper presented at the 32nd Annual Symposium on Recent De-velopments in the Use of the MMPI–2 and MMPI–A, Minneapolis, MN.
Steiger, J. H. (1990). Structural model evaluation and modification: An interval approach.MultivariateBehavioral Research, 25,173–180.
Tanaka, J. S., & Huba, G. J. (1985). A fit index for covariance structure models under arbitrary GLS esti-mation.British Journal of Mathematical and Statistical Psychology, 38,197–201.
Thissen, D., & Steinberg, L. (1988). Data analysis using item response theory.Psychological Bulletin,104,385–395.
Waller, N. G., & Reise, S. P. (1989). Computerized adaptive personality assessment: An illustrationwith the absorption scale.Journal of Personality and Social Psychology, 57,1051–1058.
306 ROUSE, FINGER, BUTCHER
Copyright © 2000 All Rights Reserved

Waller, N. G., Tellegen, A., McDonald, R. P., & Lykken, D. T. (1996). Exploring nonlinear models inpersonality assessment: Development and preliminary validation of a negative emotionality scale.Journal of Personality, 64,545–576.
Weiss, D. J. (1985). Adaptive testing by computer.Journal of Consulting and Clinical Psychology, 53,774–789.
Weiss, D. J. (1995). Improving individual differences measurement with item response theory and com-puterized adaptive testing. In D. Lubinski & R. V. Dawis (Eds.),Assessing individual differences inhuman behavior: New concepts, methods, and findings(pp. 49–79). Palo Alto, CA: Davis-Black.
Zickar, M. J., & Drasgow, F. (1996). Detecting faking on a personality instrument using appropriatenessmeasurement.Applied Psychological Measurement, 20,71–87.
Zumbo, B. D., Pope, G. A., Watson, J. E., & Hubley, A. M. (1997). An empirical test of Roskam’s con-jecture about the interpretation of an ICC parameter in personality inventories.Educational andPsychological Measurement, 57,963–969.
Steven V. RouseDepartment of PsychologyPepperdine UniversityMalibu, CA 90265
Received September 23, 1998Revised January 19, 1999
IRT AND THE MMPI–2PSY–5SCALES 307
Copyright © 2000 All Rights Reserved