Advances and application analysis of drought monitoring ...
16
1007-4619 (2011) 06-1315-16 Journal of Remote Sensing 遥感学报 Received: 2010-09-27; Accepted: 2011-01-07 Foundation: National High Technology Research and Development Program (No. 2009AA12Z101); Key Project of Knowledge Innovation Program, Chinese Academy of Sciences (No. KZCX2-YW-Q03-07) First author biography: WANG Litao (1979— ), male, associated professor. His research interests are the remote sensing applications on hazard and environment. E-mail: [email protected] Corresponding author biography: WANG Shixin (1965— ), male, professor. His research interests are the remote sensing applications on hazard and environment. He has published over 40 a cademic papers and written 2 monographs. E-mail: [email protected] 1 INTRODUCTION Drought is a natural phenomenon of relative water deficiency, frequently occurs throughout the world and in various historical events. It would cause harm to crop growth and decrease agricul- tural production. The severe drought should cause the shortage of drinking water and affect the people living, industrial production and other socio-economic activities. In China, the obvious monsoon climate and the uneven temporal-spatial distribution of precipita- tion lead to frequent occurrence of drought that causes seriously ef- fect on agricultural production and people’s lives. In northern forest region, drought could make fire occur frequently and be difficult to control. For the drought with characteristics of long-time continuing and large-scale spreading, real-time dynamic macro monitoring in- formation is important for drought-preventing decisions. In recent decades, Remote sensing has the capacity of rapid, economical and macroscopic data-obtained. It provides an important techni- cal means and data sources for the drought monitoring, which will make up the shortage of monitoring drought based on meteorologi- cal station data. In this paper, drought monitoring methods using remote sensing are overviewed and classified, including the monitoring principle, applicability and advances. And then, an application case is intro- duced with respect to the drought situation occurred in spring, 2010 in Southwest China. In the application, a drought monitoring meth- od combined with Global Vegetation Moisture Index (GVMI) and Shortwave Angle Normalized Index (SANI) is used and analyzed based on remote sensing data. 2 REMOTE SENSING MONITORING METHODS FOR DROUGHT Based on different assessment considerations, the drought situ- ation can be divided into meteorological drought, hydrological drought and agricultural drought. The corresponding evaluation in- dicators include three aspects: precipitation indicators, soil moisture indicators and crop water balance indicators (Li, 2001). With the development of remote sensing technology and deep study to the quantitative retrieval technology, a number of surface parameters and thermal information can be extracted from remote sensing data, which provides an important theoretical basis for the application of monitoring drought. During the course of drought occurrence, the soil and vegetation are more impacted. So the soil moisture, eva- potranspiration, the vegetation growth and canopy water content of vegetation are used to evaluate the drought situation. In present researches and applications, four kinds of monitoring methods based on remote sensing are commonly used: soil thermal inertia Advances and application analysis of drought monitoring using remote sensing WANG Litao 1 , WANG Shixin 1 , ZHOU Yi 1 , WANG Futao 1,2 , LIU Wenliang 1,2 1. Institute of Remote Sensing Applications, Chinese Academy of Sciences, Beijing 100101, China; 2. Graduate University of Chinese Academy of Sciences, Beijing 100039, China Abstract: Remote sensing technology with the characteristics of rapid, economical and macroscopic provides an important real-time dynamic data source for drought monitoring and decision making. In this paper, monitoring methods based on remote sensing data are overviewed and classified into four kinds: soil thermal inertia methods, soil spectrum characteristic methods, evapotranspiration model methods and vegetation index methods. The monitoring principle, applicability and advances for each method are presented. Combination with the drought of Southwest China occurred in the spring of 2010, a drought remote sens- ing method using vegetation water indices is introduced including monitoring model, data processing and application analysis. And the monitoring results are statistical analyzed and evaluated. Key words: drought monitoring, remote sensing, advances, application analysis CLC number: TP79 Document code: A Citation format: Wang L T, Wang S X, Zhou Y, Wang F T and Liu W L. 2011. Advances and application analysis of drought monitoring using remote sensing. Journal of Remote Sensing, 15(6): 1315–1330
Transcript of Advances and application analysis of drought monitoring ...

1007-4619 (2011) 06-1315-16 Journal of Remote Sensing 遥感学报
Received: 2010-09-27; Accepted: 2011-01-07Foundation: National High Technology Research and Development Program (No. 2009AA12Z101); Key Project of Knowledge Innovation Program,
Chinese Academy of Sciences (No. KZCX2-YW-Q03-07)First author biography: WANG Litao (1979— ), male, associated professor. His research interests are the remote sensing applications on hazard and
environment. E-mail: [email protected] author biography: WANG Shixin (1965— ), male, professor. His research interests are the remote sensing applications on hazard and
environment. He has published over 40 a cademic papers and written 2 monographs. E-mail: [email protected]
1 INTRODUCTION
Drought is a natural phenomenon of relative water defi ciency, frequently occurs throughout the world and in various historical events. It would cause harm to crop growth and decrease agricul-tural production. The severe drought should cause the shortage of drinking water and affect the people living, industrial production and other socio-economic activities. In China, the obvious monsoon climate and the uneven temporal-spatial distribution of precipita-tion lead to frequent occurrence of drought that causes seriously ef-fect on agricultural production and people’s lives. In northern forest region, drought could make fi re occur frequently and be diffi cult to control.
For the drought with characteristics of long-time continuing and large-scale spreading, real-time dynamic macro monitoring in-formation is important for drought-preventing decisions. In recent decades, Remote sensing has the capacity of rapid, economical and macroscopic data-obtained. It provides an important techni-cal means and data sources for the drought monitoring, which will make up the shortage of monitoring drought based on meteorologi-cal station data.
In this paper, drought monitoring methods using remote sensing are overviewed and classifi ed, including the monitoring principle, applicability and advances. And then, an application case is intro-
duced with respect to the drought situation occurred in spring, 2010 in Southwest China. In the application, a drought monitoring meth-od combined with Global Vegetation Moisture Index (GVMI) and Shortwave Angle Normalized Index (SANI) is used and analyzed based on remote sensing data.
2 REMOTE SENSING MONITORING METHODS FOR DROUGHT
Based on different assessment considerations, the drought situ-ation can be divided into meteorological drought, hydrological drought and agricultural drought. The corresponding evaluation in-dicators include three aspects: precipitation indicators, soil moisture indicators and crop water balance indicators (Li, 2001). With the development of remote sensing technology and deep study to the quantitative retrieval technology, a number of surface parameters and thermal information can be extracted from remote sensing data, which provides an important theoretical basis for the application of monitoring drought. During the course of drought occurrence, the soil and vegetation are more impacted. So the soil moisture, eva-potranspiration, the vegetation growth and canopy water content of vegetation are used to evaluate the drought situation. In present researches and applications, four kinds of monitoring methods based on remote sensing are commonly used: soil thermal inertia
Advances and application analysis of drought monitoring using remote sensing
WANG Litao1, WANG Shixin1, ZHOU Yi1, WANG Futao1,2, LIU Wenliang1,2
1. Institute of Remote Sensing Applications, Chinese Academy of Sciences, Beijing 100101, China;2. Graduate University of Chinese Academy of Sciences, Beijing 100039, China
Abstract: Remote sensing technology with the characteristics of rapid, economical and macroscopic provides an important real-time dynamic data source for drought monitoring and decision making. In this paper, monitoring methods based on remote sensing data are overviewed and classifi ed into four kinds: soil thermal inertia methods, soil spectrum characteristic methods, evapotranspiration model methods and vegetation index methods. The monitoring principle, applicability and advances for each method are presented. Combination with the drought of Southwest China occurred in the spring of 2010, a drought remote sens-ing method using vegetation water indices is introduced including monitoring model, data processing and application analysis. And the monitoring results are statistical analyzed and evaluated.Key words: drought monitoring, remote sensing, advances, application analysisCLC number: TP79 Document code: A
Citation format: Wang L T, Wang S X, Zhou Y, Wang F T and Liu W L. 2011. Advances and application analysis of drought monitoring using remote sensing. Journal of Remote Sensing, 15(6): 1315–1330

1316 Journal of Remote Sensing 遥感学报 2011,15(6)
methods, soil spectrum characteristic methods, evapotranspiration model methods and vegetation index methods.
2.1 Soil thermal inertia methods
Soil thermal inertia (STI) is a thermal property that soil prevents the changing of its temperature. STI has a good relationship with soil water content. STI can be expressed as below: (1)where P is soil thermal inertia, λ is the thermal conductivity, ρ is soil density, and c is the specifi c heat. Because there is a big dif-ference between the heat capacity and thermal conductivity of the dried soil and those of the water, the soil with different moisture will have different soil thermal inertia (Price, 1985). The drought monitoring researches using soil thermal inertia can be summarized into the two steps. At fi rst, combine the ground model with remote sensing thermal infrared data to construct a soil thermal inertia model and calculate the soil thermal inertia. Then, establish the re-lation between the soil thermal inertia and soil moisture content for the evaluation of soil drought conditions.
Soil thermal inertia methods are commonly-used drought moni-toring methods, including in China (e.g. Zhang, et al., 2001). In practice, different thermal inertia models are developed (Price, 1985; England, et al., 1992). Through large quantities of measured data, the stable relationship between thermal inertia and moisture content has been established, which brings higher precision for soil drought monitoring in the small extent and singularity type (Chen, et al., 2008).
However, soil thermal inertia methods have some limitations due to the characteristics of thermal inertia models and remote sensing data. For example, the calculation of thermal inertia needs the temperatures both in daytime and in nighttime, which augments the probability of could-covering in the time of satellite passing. For the covering of ground vegetation, it is diffi cult to obtain soil surface temperature using remote sensing data, and thus soil ther-mal inertia methods are generally used in the region of bare soil or covering by less vegetation (Wang, et al., 2007). To extend the application of soil thermal inertia methods, previous work has es-tablished multi-layer thermal inertia model, which considered the temperature difference information of the sunlight surface and the shadow surface temperature in order to retrieve the soil moisture content and monitor drought situation using multi-angle remote sensing data (Zhang, et al., 2003).
2.2 Soil spectrum characteristic methods
In the range of the visible and near infrared and dielectric prop-erty, soil samples with different moisture have different spectral characteristics, which has been the important methodological basis for the assessment of soil moisture and drought monitoring using optical and microwave remote sensing data.
In microwave remote sensing, soil moisture directly affects the dielectric properties. And the microwave echo is very sensitive to soil water content (Wang & Schmugge, 1985). Thereby establish-ing the relationship between soil moisture content and microwave backscattering coeffi cient can achieve the purpose of retrieving the soil moisture and drought monitoring. Microwave remote sensing has some technical advantages: less affected by the atmosphere, used in all weathers, and a certain penetration to the vegetation and
soil. Microwave remote sensing application is also an important research aspect for soil moisture inversion and drought monitoring (Yan, et al., 2006).
However, due to some factors (e.g. microwave imaging mecha-nism), microwave remote sensing data is more diffi cult to obtain and has lower temporal-spatial resolution than optical and infrared remote sensing data. In addition, the infl uence on surface roughness and vegetation will decrease the precision of soil water content inversion using microwave data. How to reduce or eliminate the infl uence of surface roughness and vegetation is an important prob-lem of soil moisture and drought monitoring. Li, et al. (2002) inte-grated active and passive microwave data and established a semi-empirical model with bulk scattering computation, which would reduce the infl uence of vegetation and increase soil moisture inver-sion accuracy. Zhou, et al.(2010) utilized “water-cloud model” to wipe off vegetation infl uence from total backscattering coeffi cient of radar data through setting up the relationship between soil back-scattering coefficient and soil moisture based on the Normalized Difference Moisture Index extracted from homochronous visible remote sensing data. The result showed that the method performed well in retrieving soil water content in medium vegetated areas.
In terms of temporal resolution and spatial resolution, optical (visible and infrared) remote sensing has more advantages relative to microwave remote sensing. So some researchers have also used the different spectral characteristics of different soil water content. Du (2006) introduced a soil moisture retrieval index-Surface Wa-ter Content Index (SWCI). SWCI was constructed based on the analysis on the water absorption curve and the band characteristics of MODIS channel 6 and 7. It also considered the mixture of crops and soil and analyzed the influence to the spectral reflectance of vegetation and soil by the water absorption. So it had higher accu-racy in retrieving shallow soil water content. An index of Cropland Soil Moisture Index (CSMI) was developed combing SWCI with NDVI (Zhang, et al., 2009). CSMI could decrease the instability of monitoring accuracy due to the change of vegetation cover. Opti-cal remote sensing has a most disadvantage, poor penetration. It is affected easily by clouds, atmosphere and vegetation. And what’s more, the inversion index using optical remote sensing can only slightly better refl ect the shallow soil moisture even in the bare soil (Zhang, et al., 2008).
2.3 Evapotranspiration model methods
Evapotranspiration model methods are base on the theory of energy balance that the change of evapotranspiration energy can refl ect the surface moisture conditions. Those applications began in the 1970’s. The original study analyzed the empirical relationship between the air vapor pressure, the canopy temperature and air tem-perature and then constructed the Crop Water Stress Index (CWSI) (Idso, et al., 1981). Jackson, et al. (1981) made a detailed analysis of Crop Water Stress Index based on the energy balance theory that the sun net radiation was the sum of the sensible heat fl ux, latent heat fl ux and soil heat fl ux. Its theoretical equation was established using actual Evapotranspiration (ETc) and potential Evapotranspira-tion (ETp): (2)
Supported by ground observations, remote sensing data is used to retrieve land surface refl ectance, surface emissivity and surface

1317WANG Litao, et al.: Advances and application analysis of drought monitoring using remote sensing
temperature. And then combining with Penman-Monteith equation, the regional evapotranspiration can be estimated (e.g. Zha, et al., 2010). According the underlying surface conditions, there are some different models developed, such as single-layer model, two-layer model and multi-layer model. Single-layer models construct the heat exchange model based on the hypothesis that soil and vegeta-tion are seen as a whole boundary layer. The advantage of the mod-els is less dependent on input data and parameters (Shen & Tian, 1998). Zhang, et al. (2005) used the SEBS model, one of single-layer models based on NOAA / AVHRR data to analyze the re-gional evapotranspiration in the Yellow River Delta. And then they determined the drought degree compared with the precipitation on the same period. Due to considering the land surface as a whole boundary layer, single-layer models cannot obtain higher accuracy and the difference from the land surface system. The construction of two-layer models takes into account separately the vegetation canopy heat balance equation and soil surface heat balance equa-tion. The classic two-layer models need a large number of param-eters, which limits their applications. But by now, most models are yet empirical models, which require many empirical parameters and only are applicable to the local range (Chen, et al., 2010).
Based on energy conservation, meteorology, plant physiology, evapotranspiration models have a strong theoretical basis. How-ever, both single-layer models and two-layer models are involved in some surface thermodynamic parameters. Those parameters have a strong regional characteristic and are mainly obtained by empiri-cal methods, which limit the application of the evapotranspiration methods.
2.4 Vegetation index methods
The growth and physiological status of the vegetation are close-ly related with the drought situation. Researches design many indi-ces based on multi-spectral remote sensing to evaluate the drought monitoring. There are three kinds of vegetation indices: Vegeta-tion Condition Indices, such as Normalized Difference Vegetation Index (NDVI); Integrated Vegetation Indices, such as Vegetation Supply Water Index (VSWI), Temperature Vegetation Dryness Index (TVDI); Vegetation Moisture Index, such as Global Vegeta-tion Moisture Index (GVMI), Normalized Difference Water Index (NDWI).
The spectrum of vegetation leaves has a stronger absorption in the red range and a higher refl ectance in the near-infrared. The linear or nonlinear relationship between those two channels can re-fl ect the growth of the vegetation (Zhao, et al., 2003). The shortage of vegetation water will affect the growth of vegetation, especially during a long period of drought. According to this phenomenon, different vegetation condition indices are developed for drought monitoring and assessment. Some of them also use the concept of “anomaly” in the weather and climate research (Chen, et al., 1994). Normalized Difference Vegetation Index (NDVI) is one of most widely used indices and becomes the basis of a variety of vegeta-tion indices. For example, Gutman, et al. (1996) used the NOAA / AVHRR NDVI time series data within the year of 1988 to 1991 for global monitoring. The monthly change of NDVI can be proved to refl ect the extreme weather such as drought and fl ood monitoring. However, floods, pests, soil salinization and improper field man-agement can also lead to changes in the vegetation index. So, veg-
etation condition indices alone is certain one-sidedness for drought assessment.
To reduce the influence of other factors, efforts are used to combine environmental factors with vegetation indices to develop the Integrated Vegetation Indices for drought monitoring. Canopy surface temperature retrieving from remote sensing is widely used. Such as, Vegetation Supply Water Index (VSWI) is constructed by using the ratio of canopy temperature and NDVI vegetation index built. (3)
When drought occurs, NDVI values will decrease and crop canopy temperature will increase for the closure of the stomata, leading to increase in VSWI. When VSWI becomes larger, drought will be more severe (Goward, et al., 2002). But there is a diffi culty in how to determine the assessment criteria of the drought situation, because different soil background, land cover types, crop planting structure, climatic conditions and other factors will also affect the value of VSWI. Temperature Vegetation Dryness index (TVDI) is another index widely used, which is based on an empirical param-eterisation of the relationship (Fig. 1) between surface temperature (Ts) and vegetation index (NDVI) (Sandholt, et al., 2002). The for-mula is as follows.
(4)
where, Ts is the surface (canopy) temperature of the given pixel, Tsmax the maximum surface temperature observation for a given NDVI and Tsmin the minimum surface temperature observation for a given NDVI. The calculations of Tsmax and Tsmin are shown as
(5)
Some researches find that TVDI index and soil moisture have a signifi cant correlation in a certain range of vegetation cover (Sun, et al., 2010), ensures the possibility of drought monitoring and as-sessment (e.g. Wu, et al., 2007; Yang, et al., 2009).
Vegetation canopy water content, an important physiologi-cal indicator, is a direct refl ection of vegetation drought (water shortage).
Fig. 1 The feature space between Ts and NDVI and the defi nition of TVDI (Sandholt, et al., 2002)
NDVI
TVDITsmin
Ts
(NDVI.Ts)BA
Ts=a+b·NDVI
TVDI=1
surf
ace
tem
pera
ture
Max Transpiration
NoTranspiration
vegetation index
TVDI=0
NoEvaporation
MaxEvaporation

1318 Journal of Remote Sensing 遥感学报 2011,15(6)
Measured from a large number of data analysis, results indicate that in the near infrared channel and in the shortwave infrared chan-nel the absorption is very weak while in those two bands vegetation canopy has higher refl ectance. Therefore, it can be very sensitive to vegetation water content by using near-infrared and shortwave infrared spectral data (Ceccato, 2002a). Based on the above charac-teristics, vegetation water indices are developed, such as the Nor-malized Difference Water Index (NDWI), Moisture Stress Index (MSI), and Global Vegetation Moisture Index (GVMI). The opera-tional applications also show that those indices have good correla-tions with the value of the vegetation water content (Gao, 1996; Hunt & Rock, 1989; Ceccato, 2002b). However, some studies have shown that vegetation water indices are not fi t to the application of drought monitoring during the early stage of the crop growth stage or in the region with low vegetation cover (Fensholt & Sendhoh, 2003). Therefore, in the application of vegetation water indices, other judge needs to be incorporated to minimize the impact from the soil. For example, Yu (2008) introduced the Shortwave Angle Normalized Index (SANI) to eliminate the infl uence from the soil. The result showed that it could solve the impact of soil background to the monitoring of crops moisture content.
The above analysis shows that the existing drought monitoring methods based on soil thermal inertia and the spectral character-istics of the soil, due to the infl uence of vegetation, usually has a good application only in the region of bare soil or less vegetation covered areas. Evapotranspiration model methods have strong theo-retical basis, but its application is limited due to need surface ther-modynamic parameters. Vegetation index methods have a relatively good effect in higher vegetation coverage area from two aspects of canopy drought water monitoring, but are susceptible to other envi-ronmental factors.
3 A CASE OF DROUGHT MONITORING APPLICATION
Through overviewing and analyzing the drought monitoring methods using remote sensing, we have developed a remote sens-ing method for drought based on the vegetation water index. In this section, the method is presented, including the model and the data processing. Selecting a case of the 2010 spring drought occurring in Southwest China, the method is applied and analyzed.
3.1 Application area and data
In the spring of 2010, a large-scale drought occurs in South-western China. The drought seriously affected the local social pro-duction and people’s life, especially in the four provinces of Yun-nan, Guizhou, Guangxi, and Sichuan. In Southwest China, there lies a complex terrain and rich terrestrial ecosystems. But for the impact from the monsoon, the Southwest region of China is one of
the major drought-occurring regions.In the application, the Moderate Resolution Imaging Spec-
troradiometer (MODIS) 500 m refl ectance dataset is used for the retrieval of vegetation water content and drought monitoring. It has seven bands distributed in the regions of visible, near infrared and shortwave infrared, which can meet the monitoring need of spectrum. MODIS data also has higher temporal resolution (twice a day) and larger spatial coverage, which can meet the temporal-spatial need of drought monitoring.
3.2 Monitoring method and data processing
In the drought monitoring application, the selection of vegeta-tion water content indicator also has great impact on the evaluation effect. Some indicators of the vegetation water content have been proposed, such as Relative Water Content (RWC), Specifi c Water Density (SWD), Fuel Moisture Content (FMC), and Equivalent Water Thickness (EWT). EWT is defi ned as the ratio between veg-etation leaves water content (the difference of fresh weight and dry weight) and leaf area. And the formula is shown as
(6)
where FW is leaf fresh weight, DW is leaf dry weight, and A is one-side leaf area. The EWT is analyzed and considered that hav-ing good independence of species, and so is widely used in a wide range for vegetation water monitoring and drought assessment (Ceccato, 2002b; Gao, 1996; Du, 2006; Yu, 2008). Therefore, in the study EWT are selected as the value of vegetation water content, in order to reduce the effect from mixed pixel.
Global Vegetation Moisture Index is calculated from remote sensing and then was used to inverse the vegetation water con-tent. GVMI index is constructed based on the measured data of LOPEX’93, rather than a sensor characteristic, which make it more general. The actual effects of application shows that: GVMI index has higher correlation and stability with vegetation water content (Ceccato, et al., 2002a); although there exists a small offset between the model inversion results and the actual value due to in-strumental systematic error, a constant change can remove it (Gao, 1996).
GVMI can be calculated using the following equation (Ceccato, et al., 2002a),
(7)
where NIR and SWIR are respectively the near infrared band (858 nm) and the shortwave infrared band (1240 nm) of MODIS.
Through the analysis of experimental data (Ceccato, et al., 2002b) and the application of vegetation water content inversion (Du, 2006), the formula between GVMI and EWT is established as
(8)
where a, b, c and d are the constants, a = 1.53, b = –1.40, c = –0.000099, d = 0.000517.
But the surface refl ectance will be infl uenced by bare soil and the inversion accuracy will be severely affected in the region with less covered vegetation (Ceccato, et al., 2002a), which would de-
crease the precision of vegetation water content inversion using GVMI. So the Shortwave Angle Normalized Index (SANI) is intro-duced to eliminate the effect from the soil background.
SANI is constructed by using the geometry relationship between three consecutive MODIS bands of NIR, SWIR1, and SWIR2 (Pala-

1319WANG Litao, et al.: Advances and application analysis of drought monitoring using remote sensing
cios, et al., 2006). The formula is shown as
(9)
where βSWIR1 is the angle between refl ectance curve line NIR-SWIR1 and SWIR1–SWIR2 (Fig. 2). The calculation of βSWIR1 is shown as
(10)
where NIR, SWIR1, and SWIR2 are respectively the refl ectance of the near-infrared band (858 nm) and the shortwave infrared bands (1240 nm, 1640 nm), a, b, and c are respectively the Euclidean ge-ometry distance between the NIR, SWIR1, and SWIR2.
c
b
6000
NIR a SWIR1
SWIR2
Dried SoilWet SoilDrid MatterGreen Vegetation
Wavelength / μm
Ref
lect
ance
×10
000
βSWIR1
5000
4000
3000
2000
1000
00.5 1.0 1.5 2.0
Fig. 2 The angle at the point of SWIR1 and the slope of line C (Palacios, et al., 2005)
In order to facilitate comparison, SWIR1 refl ectance values of the different land types are set at the same location. In Fig. 2, it shows that the value range of βSWIR1 is 0 — 2π; the value range of (SWIR2–NIR)/(SWIR2+NIR) is –1 — 1; and the value range of SANI is –2π —2π. The βSWIR1 value of the dry soil is more than those of the dry matter and the wet soil. The slope value of the line “c” corresponding to the soil is a positive constant. As the soil moisture content increases, the slope value decreases. And the slope value of the dry matter is close to 0, while the slope value of the green vegetation is negative. Therefore, if SANI<0 , the corre-sponding pixel can be considered as the area of vegetation coverage and the corresponding vegetation water content can be calculated by the equation between GVMI and EWT; if SANI≥0, the corre-sponding pixel can be considered as the area of sparse vegetation or bare soil and the vegetation water content is set as 0.
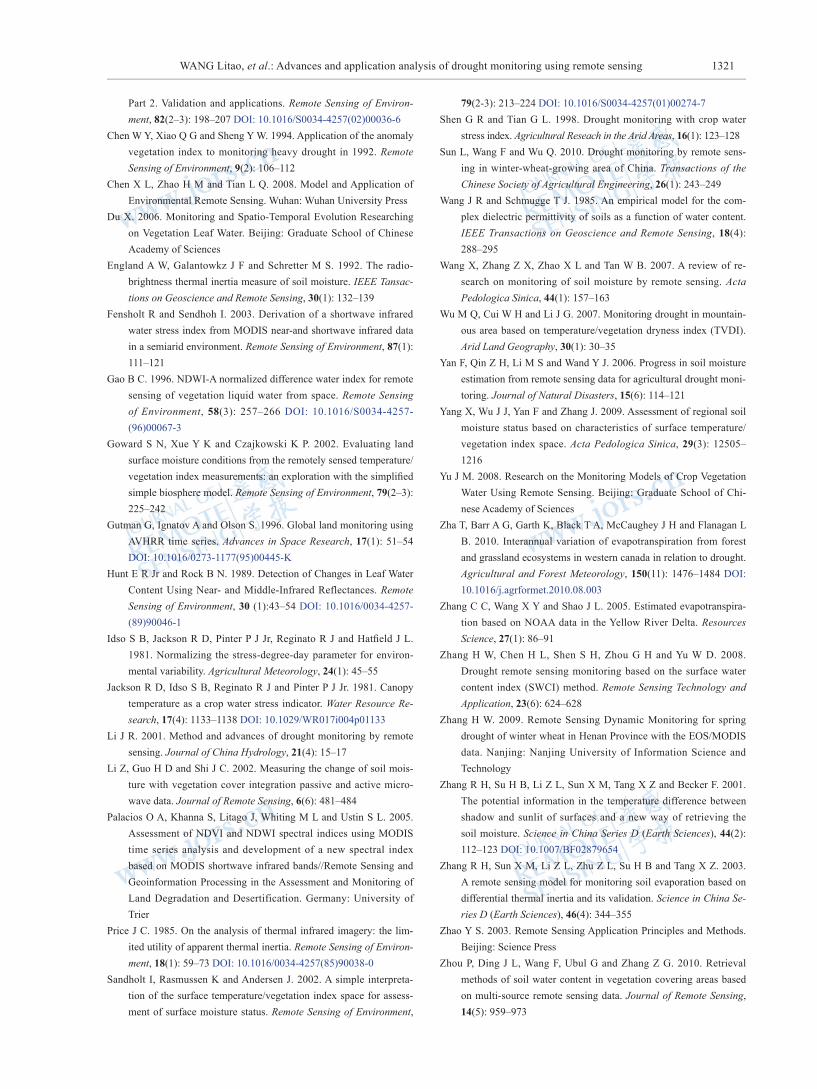
Some researches have demonstrated that vegetation canopy water content EWT have a certain correlation with precipitation and soil moisture (Du, 2006). In this study, EWT data extracted by the site (longitude and latitude) of weather stations is also used to analyze the relationship. The result shows that the temporal change of EWT is basically the same as that of precipitation (e.g. Fig. 3), but there is a process of delay due to need of some time for the vegetation’s absorption to precipitation. And the monitoring period the EWT has a significant correlation (0.67) with soil moisture. The above facts also show that EWT can be as an indicator of the drought situation.
Prec
ipita
tion/
mm
2010
-01-01
2010
-04-01
2010
-03-03
2010
-03-02
2010
-03-01
2010
-02-03
2010
-02-02
2010
-02-01
2010
-01-03
2010
-01-02
EWT/
(g/m
2 )
6 250
200
150
100
50
0
5
4
3
2
1
0
Date
PrecipitationEWT
Fig. 3 The temporal map of EWT and precipitation
In the drought assessment method, the value ranges of vegeta-tion water content can be classifi ed to express the different levels of drought. It has been proved to be validated in evaluating the crops drought in the small region (Yu, 2008). However, due to larger spatial extent and richer vegetation types in monitoring Southwest drought, the numerical ranges of EWT are very diffi cult to be di-rectly linked to drought levels. Therefore, we made a hypothesis that the vegetation growth and structure in the same area and in the same period (e.g. the last ten-day of February) of the past 10 years should be the same, and the average value of EWT during the same period should be the water content of normal vegetation. Through comparative analysis with historical vegetation water content data, the index of AEWT is calculated to reflect the shortage status of vegetation water. The formula of AEWT is shown as
(11)
where EWTmean is the historical mean value of vegetation water content in the same period, EWTmax is historical maximum value of vegetation water content in the same period; EWTmin is the his-torical minimum value of vegetation water content in the same pe-riod. When AEWT is negative, it indicates that there is the lack of vegetation water content and the occurrence of drought; the larger negative value, indicating more serious drought.
3.3 Result and analysis
Based on the above method and analysis, MODIS data from January to April, 2010 are processed and analyzed. During the course of data processing, the standard grid dealing and data syn-thesis of ten day are used to further eliminate the geometric correc-tion and cloud interference. The data processing fl ow (Fig. 4) in-cludes some steps as standard grid dealing, water extraction, cloud removing, index calculation, EWT inversion, data synthesis, and drought evaluation.
Through processing and analyzing to remote sensing data, the maps of Southwest region drought situation in China are obtained. Combination with basic geographic data and multi-temporal data, the distribution and development of drought situation can be evalu-ation by spatial-temporal statistics. For example, Fig. 5 is the map of Southwest region drought situation in China in the last ten-day of February, 2010. The monitoring result shows that in later Feb-ruary, the drought situation in Yunnan is the worst, and Guangxi

1320 Journal of Remote Sensing 遥感学报 2011,15(6)
second; the most area in Guizhou and Sichuan hit with the light and medium drought; The area proportion of heavy drought in Yunnan is 17.9%, in Guangxi 14.7%, in Sichuan 5.1% and in Guizhou 2.7%; The area proportion of medium drought in Yunnan is 35.1%, in Guangxi 27.4%, in Sichuan 15.8% and in Guizhou 15.7%.
Fig. 5 The map of Southwest Region Drought situation in China (The last ten-day of February, 2010)
LightLegend
MediumHeavyRegular
4 CONCLUSION
With the continuous development of technology, remote sensing data has the capacity of rapid, economical and macroscopic data-obtained. It can provide an important technical means and data sources for the drought monitoring, which makes up the shortage of monitoring drought based on meteorological data station. Dur-ing the course of drought development, the soil and vegetation are more impacted. So the soil moisture, the evapotranspiration, growth and canopy water content of vegetation can be used to evaluate the drought situation. In the present researches and applications, four kinds of monitoring methods based on remote sensing data are common used, including the soil thermal inertia methods, soil spec-
trum characteristic methods, evapotranspiration model methods and vegetation index methods.
Of the above methods, the existing drought monitoring methods based on soil thermal inertia and the spectral characteristics of the soil, due to the infl uence of vegetation, usually has a good appli-cations in the region of bare soil or less vegetation covered. Eva-potranspiration model methods have strong theoretical basis, and its application is limited due to obtaining the surface thermodynamic parameters of the model usually by experience. Vegetation index methods have a relatively good effect in higher vegetation coverage area from two aspects of canopy drought water monitoring, but are susceptible to other environmental factors.
Combination with the drought of Southwest China occurred in the spring of 2010, a drought remote sensing method using the veg-etation water index is introduced including monitoring model, data processing and application analysis. And the monitoring results are statistical analyzed and evaluated. The analysis results show that the temporal change of EWT is basically the same as that of pre-cipitation, but there is a process of delay indicates in the monitoring period the EWT has a signifi cant correlation with soil moisture.
The occurrence and development of drought involve the com-plex hydrological changes, vegetation physical changes and the interaction between soil moisture and vegetation water content. So the drought model study based on remote sensing data should con-sider the integration the soil moisture and vegetation water con-tent, which will help to improve evaluation accuracy and compre-hensive assessment of drought spatial-temporal development. The combination of monitoring tools and the establishment of drought synthetical assessment model based on the physical mechanism and multi-sensor data will be the priorities in drought monitoring research.
REFERENCES
Ceccato P, Gobron N, Flasse S, Pinty B and Tarantola S. 2002a. De-signing a spectral index to estimate vegetation water content from remote sensing data: Part 1. Theoretical approach. Remote Sensing of Environment, 82(2–3): 188–197 DOI: 10.1016/S0034-4257-(02)00037-8
Ceccato P, Flasse S and Gregoire J M. 2002b. Designing a spectral in-dex to estimate vegetation water content from remote sensing data:
MODISdata
Datapreprocessing
Multi-temporaldata
Basicgeographic data
Droughtevaluation
Temporal-spatial analysis
The result of droughtsituation
Auxiliarydata
Datasynthesis
EWTinversion
Indexcalculation
Standard griddealing
Waterextraction
Cloudremoving
Cloudmask
SANI
GVMI
Fig. 4 The fl ow chart of data processing for drought remote sensing monitoring
1321WANG Litao, et al.: Advances and application analysis of drought monitoring using remote sensing
Part 2. Validation and applications. Remote Sensing of Environ-ment, 82(2–3): 198–207 DOI: 10.1016/S0034-4257(02)00036-6
Chen W Y, Xiao Q G and Sheng Y W. 1994. Application of the anomaly vegetation index to monitoring heavy drought in 1992. Remote Sensing of Environment, 9(2): 106–112
Chen X L, Zhao H M and Tian L Q. 2008. Model and Application of Environmental Remote Sensing. Wuhan: Wuhan University Press
Du X. 2006. Monitoring and Spatio-Temporal Evolution Researching on Vegetation Leaf Water. Beijing: Graduate School of Chinese Academy of Sciences
England A W, Galantowkz J F and Schretter M S. 1992. The radio-brightness thermal inertia measure of soil moisture. IEEE Tansac-tions on Geoscience and Remote Sensing, 30(1): 132–139
Fensholt R and Sendhoh I. 2003. Derivation of a shortwave infrared water stress index from MODIS near-and shortwave infrared data in a semiarid environment. Remote Sensing of Environment, 87(1): 111–121
Gao B C. 1996. NDWI-A normalized difference water index for remote sensing of vegetation liquid water from space. Remote Sensing of Environment, 58(3): 257–266 DOI: 10.1016/S0034-4257-(96)00067-3
Goward S N, Xue Y K and Czajkowski K P. 2002. Evaluating land surface moisture conditions from the remotely sensed temperature/vegetation index measurements: an exploration with the simplifi ed simple biosphere model. Remote Sensing of Environment, 79(2–3): 225–242
Gutman G, Ignatov A and Olson S. 1996. Global land monitoring using AVHRR time series. Advances in Space Research, 17(1): 51–54 DOI: 10.1016/0273-1177(95)00445-K
Hunt E R Jr and Rock B N. 1989. Detection of Changes in Leaf Water Content Using Near- and Middle-Infrared Reflectances. Remote Sensing of Environment, 30 (1):43–54 DOI: 10.1016/0034-4257-(89)90046-1
Idso S B, Jackson R D, Pinter P J Jr, Reginato R J and Hatfi eld J L. 1981. Normalizing the stress-degree-day parameter for environ-mental variability. Agricultural Meteorology, 24(1): 45–55
Jackson R D, Idso S B, Reginato R J and Pinter P J Jr. 1981. Canopy temperature as a crop water stress indicator. Water Resource Re-search, 17(4): 1133–1138 DOI: 10.1029/WR017i004p01133
Li J R. 2001. Method and advances of drought monitoring by remote sensing. Journal of China Hydrology, 21(4): 15–17
Li Z, Guo H D and Shi J C. 2002. Measuring the change of soil mois-ture with vegetation cover integration passive and active micro-wave data. Journal of Remote Sensing, 6(6): 481–484
Palacios O A, Khanna S, Litago J, Whiting M L and Ustin S L. 2005. Assessment of NDVI and NDWI spectral indices using MODIS time series analysis and development of a new spectral index based on MODIS shortwave infrared bands//Remote Sensing and Geoinformation Processing in the Assessment and Monitoring of Land Degradation and Desertification. Germany: University of Trier
Price J C. 1985. On the analysis of thermal infrared imagery: the lim-ited utility of apparent thermal inertia. Remote Sensing of Environ-ment, 18(1): 59–73 DOI: 10.1016/0034-4257(85)90038-0
Sandholt I, Rasmussen K and Andersen J. 2002. A simple interpreta-tion of the surface temperature/vegetation index space for assess-ment of surface moisture status. Remote Sensing of Environment,
79(2-3): 213–224 DOI: 10.1016/S0034-4257(01)00274-7Shen G R and Tian G L. 1998. Drought monitoring with crop water
stress index. Agricultural Reseach in the Arid Areas, 16(1): 123–128Sun L, Wang F and Wu Q. 2010. Drought monitoring by remote sens-
ing in winter-wheat-growing area of China. Transactions of the Chinese Society of Agricultural Engineering, 26(1): 243–249
Wang J R and Schmugge T J. 1985. An empirical model for the com-plex dielectric permittivity of soils as a function of water content. IEEE Transactions on Geoscience and Remote Sensing, 18(4): 288–295
Wang X, Zhang Z X, Zhao X L and Tan W B. 2007. A review of re-search on monitoring of soil moisture by remote sensing. Acta Pedologica Sinica, 44(1): 157–163
Wu M Q, Cui W H and Li J G. 2007. Monitoring drought in mountain-ous area based on temperature/vegetation dryness index (TVDI). Arid Land Geography, 30(1): 30–35
Yan F, Qin Z H, Li M S and Wand Y J. 2006. Progress in soil moisture estimation from remote sensing data for agricultural drought moni-toring. Journal of Natural Disasters, 15(6): 114–121
Yang X, Wu J J, Yan F and Zhang J. 2009. Assessment of regional soil moisture status based on characteristics of surface temperature/vegetation index space. Acta Pedologica Sinica, 29(3): 12505–1216
Yu J M. 2008. Research on the Monitoring Models of Crop Vegetation Water Using Remote Sensing. Beijing: Graduate School of Chi-nese Academy of Sciences
Zha T, Barr A G, Garth K, Black T A, McCaughey J H and Flanagan L B. 2010. Interannual variation of evapotranspiration from forest and grassland ecosystems in western canada in relation to drought. Agricultural and Forest Meteorology, 150(11): 1476–1484 DOI: 10.1016/j.agrformet.2010.08.003
Zhang C C, Wang X Y and Shao J L. 2005. Estimated evapotranspira-tion based on NOAA data in the Yellow River Delta. Resources Science, 27(1): 86–91
Zhang H W, Chen H L, Shen S H, Zhou G H and Yu W D. 2008. Drought remote sensing monitoring based on the surface water content index (SWCI) method. Remote Sensing Technology and Application, 23(6): 624–628
Zhang H W. 2009. Remote Sensing Dynamic Monitoring for spring drought of winter wheat in Henan Province with the EOS/MODIS data. Nanjing: Nanjing University of Information Science and Technology
Zhang R H, Su H B, Li Z L, Sun X M, Tang X Z and Becker F. 2001. The potential information in the temperature difference between shadow and sunlit of surfaces and a new way of retrieving the soil moisture. Science in China Series D (Earth Sciences), 44(2): 112–123 DOI: 10.1007/BF02879654
Zhang R H, Sun X M, Li Z L, Zhu Z L, Su H B and Tang X Z. 2003. A remote sensing model for monitoring soil evaporation based on differential thermal inertia and its validation. Science in China Se-ries D (Earth Sciences), 46(4): 344–355
Zhao Y S. 2003. Remote Sensing Application Principles and Methods. Beijing: Science Press
Zhou P, Ding J L, Wang F, Ubul G and Zhang Z G. 2010. Retrieval methods of soil water content in vegetation covering areas based on multi-source remote sensing data. Journal of Remote Sensing, 14(5): 959–973

1322 Journal of Remote Sensing 遥感学报 2011,15(6)
收稿日期:2010-09-27;修订日期:2011-01-07基金项目:国家高技术研究发展计划(863计划)(编号: 2009AA12Z101);中国科学院知识创新工程重要方向项目(编号: KZCX2-YW-Q03-07)第一作者简介:王丽涛(1979— ),男,副研究员,2007年毕业于中国科学院遥感应用研究所,目前主要从事灾害和环境遥感应用方面的研究
工作。E-mail: [email protected]。
通信作者简介:王世新(1965— ),男,研究员,目前主要从事灾害和环境遥感应用方面的研究工作,发表论文40余篇,编写专著2本。
E-mail: [email protected]。
1 引 言
干旱是一种水量相对亏缺的自然现象,普遍存在
于世界各地,频发于各个历史时期。干旱的最直接危
害是造成农作物减产,使农业歉收。在严重干旱时,
甚至造成居民饮水困难,危害居民生活,影响工业生
产及其他社会经济活动。中国地处东亚,受明显季风
气候及降水时空分布不均等因素影响,导致干旱频繁
发生,严重影响了中国农业生产和人民生活。在中国
北方林区,干旱可导致林火频发,火情难以控制。
干旱具有延续时间长、波及范围广等特点,因此
在防旱、抗旱决策中需要实时、动态、宏观的旱情监
测数据提供决策辅助。在近几十年,随着遥感技术的
不断发展,遥感数据以其快速、经济、大空间范围获
取的特点,为旱情监测提供了重要的数据源,弥补了
基于台站气象数据旱情监测的不足。
本文对现有的旱情遥感监测方法进行了分析、总
结和归类,并从监测原理、适用范围和研究进展等方
面对每类方法进行了阐述。在此基础之上,以2010年
春季西南旱情为应用案例,介绍了一种结合全球植被
水分指数和短波角度归一化指数的优势建立的旱情遥
感监测方法,分析了其应用特点。
2 旱情遥感监测方法
从不同角度考虑,旱情可以分为气象干旱、水
文干旱和农业干旱等。相应的评价指标也包括3大方
面:降水指标、土壤含水量指标和作物水分平衡指
标(李纪人,2001)。随着遥感技术的发展、遥感机理
的深入研究以及定量反演技术的广泛应用,使得遥感
引用格式: 王丽涛,王世新,周艺,王福涛,刘文亮.2011.旱情遥感监测研究进展与应用案例分析.遥感学报,15(6): 1315-1330
Wang L T, Wang S X, Zhou Y, Wang F T and Liu W L. 2011. Advances and application analysis of drought monitoring using remote sensing. Journal of Remote Sensing, 15(6): 1315–1330
旱情遥感监测研究进展与应用案例分析
王丽涛1,王世新1,周艺1,王福涛1,2,刘文亮1,2
1.中国科学院 遥感应用研究所,北京 100101;
2.中国科学院 研究生院,北京 100039
摘 要:在大范围、长时序的旱情监测中,遥感技术以其快速、经济和大空间范围获取的特点,弥补了基于台站气象
数据旱情监测的不足,为防旱和抗旱决策提供了实时、动态、宏观的辅助决策数据。本文对已有旱情遥感监测方法进
行分析和整理,将其总结为基于土壤热惯量、基于土壤波谱特征、基于蒸散模型和基于植被指数的旱情监测方法,并
对各类方法从监测原理、适用范围和应用进展等方面进行了阐述。在此基础之上,详细介绍一种结合了全球植被水分
指数和短波角度归一化指数的优势建立的旱情遥感监测模型和方法。以2010年春季西南地区旱情为应用案例,从监测
模型方法、数据处理流程和应用分析等方面,介绍一种基于植被水分指数的旱情监测方法,并对其监测结果进行统计
分析与评价。
关键词:旱情监测,遥感,研究进展,应用分析
中图分类号:TP79 文献标志码:A

1323王丽涛 等:旱情遥感监测研究进展与应用案例分析
数据能够较为准确地提取一些地表特征参数和热量信
息,为旱情监测评估提供了重要的理论基础。针对干
旱发生时的主要地表承载体——土壤和植被,研究人
员从土壤湿度、植被蒸散、长势和冠层含水量等方
面,结合遥感数据特征,开展了大量的研究和应用。
目前,应用较为广泛的旱情遥感监测评估方法,主要
有4类:基于土壤热惯量的旱情监测方法、基于土壤
波谱特征的旱情监测方法、基于蒸散模型的旱情监测
方法和基于植被指数的旱情监测方法。
2.1 基于土壤热惯量的旱情监测方法
土壤热惯量是土壤阻止温度变化能力的一个热特
性参数,它与土壤水分含量之间有着很好的相关关
系。热惯量可以由下式表示:
(1)式中,P为热惯量,λ为热传导率,ρ为土壤密度,c为
比热。由于水和土壤在热容量和热传导率之间存在较
大差别,因此土壤含水量的不同,会较大影响土壤的
热惯量(Price,1985)。研究人员在利用热惯量特性进
行旱情监测时,通常包括以下两步:首先将地面模型
和遥感热红外数据结合建立土壤热惯量模型,计算土
壤热惯量;之后,建立土壤热惯量与水分之间的相关
关系,进行土壤旱情状况监测。
土壤热惯量法是应用较早、研究较广的旱情监测
方法之一。在实际应用中,通过发展不同热惯量模型
(Price,1985;England 等,1992)、利用大量实测数
据建立热惯量和水分之间稳定相关关系等方法,使得
该方法在范围较小、类型较单一的土壤旱情监测中具
有较高的精度(陈晓玲 等,2008),在中国旱情遥感
监测的研究和应用中也有较广泛的应用(Zhang 等,
2001)。
但是,由于热惯量模型和遥感数据特征,热惯量
法在应用中也具有一定的局限性。如,热惯量计算通
常需要温度日较差,而卫星在日夜过境时同时无云影
响的可能性较低;由于植被的影响,使得遥感数据很
难获得土壤表面温度,因此该方法一般用于裸土或者
植被覆盖较低的区域(汪潇 等,2007)。为提高热惯
量法的应用范围,研究人员通过建立多层热惯量模
型,考虑地物光照面和阴影的表面温度差信息,建立
了土壤水分含量的遥感反演模型,利用多角度遥感信
息提取土壤水分,进行旱情监测研究,取得了一定的
应用效果(Zhang 等,2003)。
2.2 基于土壤波谱特征的旱情监测方法
不同湿度的土壤在可见光、近红外及其介电特性
方面,表现出不同的波谱特性,成为利用光学和微
波遥感数据进行土壤水分监测和旱情评估的重要理
论基础。
在微波遥感中,由于土壤含水量直接影响土壤的
介电特性,使微波回波对土壤湿度极为敏感(Wang和
Schmugge,1985)。由此建立土壤含水量和微波后向
散射系数二者之间的关系,即可达到监测旱情的目
的。微波遥感以其全天时、全天候的工作特征以及对
于植被、土壤具有一定的穿透能力而被广泛应用于土
壤水分反演,被认为是当前土壤水分反演中最有效的
方法之一(闫峰 等,2006)。
由于受微波成像机理等因素所限,目前微波遥感
数据难以在空间分辨率和时间分辨率上与光学、红外
遥感数据相媲美。此外,微波的后向散射系数同时受
到地表粗糙度和植被的影响。如何降低或消除地表粗
糙度和植被的影响,是土壤含水量反演和旱情监测中
的重要研究方向。李震等人(2002)综合主动和被动微
波数据,建立了一个计算体散射项的半经验公式模
型,减少了植被的影响,提高了土壤湿度变化监测的
精度。周鹏等人(2010)则利用同期光学遥感影像数据
建立 “水–云模型”从雷达数据总的后向散射中去除
植被影响,建立土壤后向散射系数与土壤含水量的关
系。实验证明,该方法在中等覆盖条件下去除植被影
响有较好的效果。
在时间分辨率和空间分辨率方面,光学、红外遥
感相对微波遥感具有较大优势,因此一些研究人员也
利用不同湿度的土壤表现出的光谱特征进行旱情监
测研究。杜晓(2006)通过分析水的吸收曲线及MODIS
数据的第6、7波段的分布特点,考虑农作物和土壤
的混合差异,提出了一种反演土壤水分含量的指数
(SWCI)。SWCI从水的吸收对植被和土壤反射率波谱
的综合影响入手,直接获取其地表水分含量指标,对
提高浅层土壤墒情的精度效果较好。张红卫(2009)在
SWCI指数的基础之上,结合NDVI指数构建农田浅层
土壤湿度指数(CSMI),在一定程度减少了由于植被
覆盖变化而引起的土壤水分监测精度的不稳定性。但
是,由于光学、红外遥感数据的穿透能力较差,因此
在应用中存在受云、大气和植被影响较大的缺点。即
使在裸土土壤含水量反演,该方法也只能较好地反映

1324 Journal of Remote Sensing 遥感学报 2011,15(6)
浅层土壤墒情(张红卫 等,2008)。
2.3 基于蒸散模型的旱情监测方法
蒸散模型方法是建立在能量平衡基础之上的,利
用蒸散能量的变化来反映地表湿度情况,从而进行旱
情评估。该方法的应用开始于20世纪70年代。最初的
研究根据冠层温度与空气温度差(简称冠气温差)与空
气水汽压的经验关系(Idso 等,1981),提出了作物水
分胁迫指数(Crop Water Stress Index,CWSI),用于旱
情评估。Jackson等人(1981)根据太阳净辐射为感热通
量、潜热通量和土壤热通量的总和的能量平衡理论
对作物水分胁迫指数做了细致的分析,利用实际蒸散
(ETc)与潜在蒸散(ETp)建立了其理论模型:
(2)
目前,将遥感测量的地表温度和Penman-Monteith公
式相结合,利用遥感影像反演地表反射率、地表比
辐射率和地表表面温度的同时,辅助地面观测资料
直接估算区域蒸散量的方法应用较为广泛(Zha 等,
2010),并针对不同的下垫面情况发展了单层、双层
和多层模型。单层模型将土壤和植被作为一个整体的
边界层来建立与大气间热交换模型,优点是简单,
需要输入的数据和参数也比较少(申广荣和田国良,
1998)。张长春等人(2005)采用单层模型中已经实用化
的SEBS模型,利用NOAA/AVHRR数据对中国重要的
粮食和石油生产基地黄河三角洲区域蒸散量进行了研
究,与同期降雨量对比确定了该地区的干旱程度。单
层将地表作为一个整体来简化模拟和和计算过程的同
时,也牺牲了模拟的精度和深入研究系统内部的可能
性。双层模型是将土壤和植被分开,分别建立土壤表
面和植被冠层的热量平衡方程。经典的双层模型,引
入了大量参数,限制了其应用性。国内外的许多学者
则主要致力于经典双层模型的简化与改进,但是目前
的模型大多是经验模型,经验参数较多,只适用于局
地范围(陈晓玲 等,2008)。
总体来说,蒸散模型基于能量守恒、气象学和植
物生理学等原理,具有较强的理论基础。但是,无论
单层模型和双层模型,都涉及一些地表热力学参数,
具有较强的地域性,目前在应用中还主要采用经验方
法获取,限制了该方法的应用。
2.4 基于植被指数的旱情监测方法
植被的长势、生理状态与旱情发展有着密切的
关系,因此有研究人员利用多光谱信息构建的植被
指数进行旱情评估研究和监测应用。在利用植被指
数的旱情遥感研究方法中,主要利用3个方面的植被
指数:植被状态指数,如归一化差分植被指数(Nor-
malized Difference Vegetation Index,NDVI)、条件
植被指数(Vegetation Condition Index,VCI)等;综合
植被指数,如植被供水指数(Vegetation Supply Water
Index,VSWI)、温度植被干旱指数(Temperature Veg-
etation Dryness Index,TVDI)等;植被水分指数,如
全球植被水分指数(Global Vegetation Moisture Index,
GVMI)、归一化差值水分指数(Normalized Difference
Water Index,NDWI)等。
植被活性叶片在红波段有强吸收,在近红外波
段有较高反射,利用两个波段的线性或非线性关系
可以反映植被的长势。而当植被受水分胁迫时,尤其
是长期处于缺水状态下,植被的长势会发生相应的变
化(赵英时,2003)。根据这一原理,研究人员构建了
不同的植被状态指数,并结合天气气候研究中的“距
平”概念,用于旱情遥感监测与评估(陈维英 等,
1994)。其中,归一化差分植被指数(NDVI)应用最为
广泛,并以此为基础扩展出了多种植被指数。如,
Gutman等人(1996)利用全球1988年到1991年NOAA/
AVHRR月NDVI时间序列数据对全球进行监测,发现
NDVI的月变化可以对极端的天气如旱灾与洪涝进行
监测。然而洪涝、病虫害、土壤盐渍化、田间管理不
当等都可以造成植被(尤其是农作物)长势不良,因此
仅用植被状态指数进行旱情监测具有一定的片面性。
为减少其他因素的影响,研究人员将环境因素与
植被状态指数结合构建综合指数,用于旱情监测。
其中,冠层温度应用较为广泛,如植被供水指数
(VSWI),利用冠层温度和NDVI比值构建的植被综合
指数。
(3)
当出现旱情时,NDVI值会降低,冠层温度也会因
作物气孔关闭而升高,因此VSWI有增大的趋势,
VSWI越大,表明旱情越严重(Goward 等,2002)。但
该方法在确定旱情评估标准中存在一定难度,不同的
土壤背景、地表覆盖类型、作物种植结构和气候条
件等因素都会影响VSWI的测定。温度植被旱情指数
(TVDI)是另一个应用较为广泛的综合指数,是基于
地表温度(Ts)和植被指数(NDVI)的特征空间(图1)构建
而成的(Sandholt 等,2002)。计算公式如下:

1325王丽涛 等:旱情遥感监测研究进展与应用案例分析
应用植被水分指数进行旱情监测时,会引入其他判断
以尽量减少来自土壤的影响。如,于君明(2008)在利
用全球植被水分指数(GVMI)进行旱情评估时,引入
了短波角度归一化指数(Shortwave Angle Normalized
Index,SANI)用于消除来自土壤的影响,通过在黄淮
平原的应用,表明可以较好地解决农作物水分含量监
测中土壤背景的影响问题。
通过以上分析可知,在现有监测方法中基于土壤
热惯量和基于土壤波谱特征的旱情监测方法,由于受
到植被影响,通常在裸土或低植被覆盖地区具有较好
的应用;基于蒸散模型的旱情监测方法具有较强的理
论基础,但是由于模型中的地表热力学参数通常利用
经验获取,限制了其应用;基于植被指数的旱情监测
方法,在中高植被覆盖度区域具有相对较好的应用效
果,可从植被长势和冠层含水两方面进行旱情监测,
但是易受其他环境因素的影响。
3 旱情遥感监测应用案例
基于对旱情遥感监测方法的总结分析,以及对植
被水分的研究和应用,建立了一种基于植被水分的
旱情监测评估方法。本节将结合2010年春季西南旱
情,介绍和分析植被水分模型在旱情监测与评估中
的应用。
3.1 应用区域及数据
2010年初西南地区出现大范围旱情,严重影响了
当地社会的生产、生活。特别是云南、贵州、广西和
四川等省受旱灾影响较大、发生范围较广、持续时间
较长、损失较重。中国西南地区地形复杂,具有丰富
的陆地植被生态系统,同时由于受季风影响,西南地
区也是中国主要的旱情发生地区之一。
在旱情监测分析中,选用遥感数据为MODIS
500 m反射光谱数据集。MODIS 500 m反射光谱数据
集拥有7个波段,分布于可见光、近红外和短波红外
波谱区,可满足监测的光谱需求。同时,MODIS数
据拥有较高的时间分辨率(2次/d)和较大空间覆盖范
围,可满足监测的时间和空间需求。
3.2 监测模型及方法
在植被水分指数监测旱情应用中,植被含水量
的表征对旱情监测应用效果也有很大的影响。在植
(4)
式中,Ts表示待测像元的地表温度,Tsmax和Tsmin表示
待测像元NDVI在特征空间中对应的最大地表温度和
最小地表温度,其计算公式如下:
(5)
TVDI指数在一定植被覆盖范围内与土壤水分具有显
著的相关性(孙丽 等,2010),因此在旱情的监测与
评估应用也较为广泛(吴孟泉 等,2007;杨曦 等,
2009)。
植被指数NDVI
TVDI
无蒸腾
最大蒸腾
Tsmin
TsB
A
Ts=a+b·NDVI
TVDI=1
TVDI=0
表面温度
无蒸发
最大蒸发
(NDVI,Ts)
图1 Ts/NDVI特征空间与TVDI定义示意图
(Sandholt 等,2002)
植被冠层含水量是植被重要生理指标之一,是植
被旱情(缺水状况)的直接反映。通过分析大量实测数
据,发现在近红外波段植被液态水的吸收可以忽略不
计,在短波红外波段植被液态水的吸收很弱,而这两
个波段均位于植被冠层的高反射区,因此利用近红外
波段与短波红外波段的光谱信息可以很灵敏地反应植
被冠层含水量(Ceccato 等,2002a)。基于这一特征,
研究人员利用遥感数据构建多个水分指数,如归一化
差值水分指数(NDWI)、湿度胁迫指数MSI(Moisture
Stress Index)以及全球植被水分指数(GVMI)等。通过
实际应用,也证明上述指数与植被含水量表征值之间
具有较好的相关性(Gao,1996;Hunt和Rock,1989;
Ceccato,2002b)。但是,也有研究表明(Fensholt和
Sendhoh,2003),植被水分指数并不适用于作物生长
前期或植被覆盖度较低情况下的旱情监测。因此,在

1326 Journal of Remote Sensing 遥感学报 2011,15(6)
被含水量定义方面,研究人员提出过很多的评价指
标, 如RWC(relative water content),SWD(specific
water density),FMC(Fuel Moisture Content)以及
EWT(Equivalent Water Thickness) 等。EWT定义为植
被叶片水分含量(鲜重与干重的差值)与叶面面积的比
值,公式如下:
(6)
式中,FW为叶片鲜重,DW为叶片干重,A代表叶片
面积。由于EWT在分析中被认为具有较好的物种独
立性,因此在大范围的植被水分监测和旱情评估应用
得到广泛的应用(Ceccato 等,2002b;Gao,1996;
杜晓,2006;于君明,2008)。因此,在研究中选用
了EWT表征值被含水量,以降低来自混合像元效应
的影响。
在利用遥感数据进行植被含水量反演中,选取
式中,a、b、c和d为反演常数值,a =1.53,b = –1.40, c = – 0.000099,d = 0.000517。
但在利用GVMI指数反演植被水分含量时,存在
一定的适用范围,即当地表植被覆盖较低时,地表的
反射率受裸土影响较大,其反演精度受到较大影响
(Ceccato 等,2002a)。因此,在植被含水量监测和旱
情评估中,引入了短波角度归一化指数(SANI)来剔除
土壤背景的影响。
短波角度归一化指数(SANI)(Palacios 等,2006)
利用MODIS的3个连续的波段—NIR、SWIR1、SWIR2
间光谱的几何形状,用参数刻画了3个光谱间的相互
关系,计算公式如下:
(9)
式中,βSWIR1是反射率光谱曲线中线段NIR–SWIR1与
SWIR1–SWIR2间的夹角(图2),其计算公式如下:
(10)
式中,NIR、SWIR1、SWIR2分别是MODIS的近红
外波段(858 nm)和两个短波红外波段(1240 nm、
1640 nm);a、b、c分别是NIR、SWIR1、SWIR2三个
峰值间的欧几里德几何距离。
了全球植被水分指数(GVMI)。由于GVMI指数是基
于独立的 LOPEX’93实测数据创建的,而非根据某个
传感器的数据,使得指数更具普遍意义。并且从国
内外同行应用的实际效果来看,GVMI指数与植被含
水量具有较高的相关性和稳定性。虽然模型反演的
结果与实际值之间会因仪器系统误差而产生的少量
平移,增减一个常数即可消除(Ceccato 等,2002a;
Gao,1996)。GVMI计算公式如下(Ceccato,2002a)
(7)
式中,NIR、SWIR分别是MODIS的近红外波段
(858 nm)和短波红外波段(1240 nm)。
在对实验数据分析(Ceccato 等,2002b)和利用中
国植被水分监测的实际应用分析(杜晓,2006)中,建
立GVMI和EWT之间的公式如下:
(8)
为了便于比较,将各种土地类型在SWIR1处的反
射率值人为的移到同一位置。如图2显示,βSWIR1的取
值范围是0—2π;(SWIR2–NIR)/(SWIR2+NIR)的取值
范围是–1—1;因此SANI的取值范围是–2π—2π。干
燥土壤的 βSWIR1 最大,干物质和湿土对应的βSWIR1逐渐
减小。土壤对应的线段“c”的斜率是正值,随着土
壤水分含量的增多,斜率减小;干物质的斜率接近
0;绿色植被的斜率是负值。因此,当SAIN<0时,
可认为像素对应的研究区域是植被覆盖区,则利
用GVMI与EWT间的经验方程计算植被含水量;当
图2 SWIR1处的角度及线段c的斜率(Palacios 等,2005)
6000
NIR a SWIR1
SWIR2
干土
干植被绿色植被
波长/μm
反射
率×
1000
0
βSWIR1
湿土
5000
4000
3000
2000
1000
00.5 1.0 1.5 2.0
bc

1327王丽涛 等:旱情遥感监测研究进展与应用案例分析
图3 EWT值与降水量时序分布图
降水
量/m
m
2010
-01-01
2010
-04-01
2010
-03-03
2010
-03-02
2010
-03-01
2010
-02-03
2010
-02-02
2010
-02-01
2010
-01-03
2010
-01-02
EW
T值/(g
/m2 )
6 250
200
150
100
50
0
5
4
3
2
1
0
日期
降水量EWT值
SANI≥0时,其像素对应的区域是植被稀疏或裸土区
域,则将植被含水量视为0。
在已有研究中表明了EWT表征的植被冠层含水
量与气象数据、土壤水分数据存在一定的相关性(杜
晓,2006)。通过气象台站经纬度提取对应的EWT
值,并与降水数据和土壤水分数据进行了时序分
析,结果表明:EWT值的变化与降水量时序变化趋
势基本一致(图3),但存在一定滞后性,这是由于植
被对降水的吸收需要一定的过程所造成;而监测期
内EWT值与土壤水分数据(有效值)存在较高相关性
(0.67)。以上结果也表明了EWT值对旱情具有一定的
指示作用。
利用植被含水量的值域区间来对应旱情等级的旱
情评估方法在小范围的农作物旱情遥感监测的实际应
用中取得一定的效果(于君明,2008)。但是,由于西
南旱情监测范围较大、植被类型复杂,直接利用数值
区间划分方法很难直接对应旱情等级。为此,在旱情
监测中假设:同一区域在近10年内其植被类型、结构
在同一时期(如2月下旬等)对应的植被生长等因素相
同,而其同一时期均值为植被正常生长状况的作物含水
量。通过与历史植被含水量数据的对比分析,构造了
AEWT指数反映当前植被的缺水状况。其公式如下:
(11)
式中,EWT为某区域植被类型当前水分含量数值,
EWTmean为某区域植被类型历史同期的植被含水量均
值,EWTmax为某区域植被类型历史同期的植被含水
量最大值,EWTmin为某区域植被类型历史同期的植
被含水量最小值。当AEWT值为负时,说明当前植被
含水量欠缺,发生一定程度的旱情,当负值越大说明
旱情越严重。
3.3 监测流程及结果
基于以上监测模型与方法,对2010年1月至4月
MODIS数据进行了计算与分析。在数据处理中,为
进一步消除由于几何纠正和云带来的干扰,采用标准
格网和旬数据合成的方法。数据处理流程(图4)包括
了预处理、标准格网处理、水体提取、去云处理、指
数计算、植被含水量反演、数据合成、旱情评估等主
要步骤。
MODIS数据
数据预处理 标准格网处理 水体提取 去云处理 云MASK
SANI
GVMI
指数计算含水量反演数据合成旱情评估多时相数据
基础地理数据 时空分析 辅助数据
旱情空间分布结果
图4 旱情遥感监测数据处理流程

1328 Journal of Remote Sensing 遥感学报 2011,15(6)
图5 中国西南地区旱情遥感监测结果图(2010年2月下旬)
轻旱图列
中旱重旱正常
通过数据处理和分析,可得到西南地区的旱情
状况遥感监测图(图5)。结合基础地理数据和多时相
数据,通过空间统计和时序分析,即可分析和评估旱
情分布和发展。如图5为2010年2月下旬旱情监测结
果,由图可知:西南四省中云南旱情最为严重,广西
次之;贵州和四川旱情以中轻旱情为主。重度受旱
(重旱)面积占总面积的比例分别达到:云南17.9%,
广西14.7%,四川5.1%和贵州2.7%。中度受旱(中旱)
面积占总面积的比例分别达到:云南35.1%,广西
27.4%,四川15.8%和贵州15.7%。
4 结论与展望
遥感技术以其快速、经济、大空间范围获取的特
点,为延续时间长、波及范围广的旱灾监测和灾情评
估提供了重要的技术手段和数据源,弥补了基于台站
气象数据旱情监测的不足。随着近几十年遥感技术的
发展和旱情遥感监测研究的深入,研究人员从土壤和
植被两个旱情承载体进行了多方法的尝试探索,形成
了基于土壤热惯量的旱情监测方法、基于土壤波谱特
征的旱情监测方法、基于蒸散模型的旱情监测方法和
基于植被指数的旱情监测方法等四类旱情遥感监测方
法,并在国内外旱情监测中得到了广泛的应用。
在以上方法中基于土壤热惯量和基于土壤波谱特
征的旱情监测方法,由于受到植被影响,通常在裸土
或低植被覆盖地区具有较好的应用;而基于蒸散模型
的旱情监测方法具有较强的理论基础,但是由于模型
中的地表热力学参数通常利用经验获取,限制了其应
用;基于植被指数的旱情监测方法,在高植被覆盖度
区域具有相对较好的应用效果,可从植被长势和冠层
含水两方面进行旱情监测,但是易受其他环境因素的
影响。
结合2010年春季中国西南地区发生的严重旱情,
从监测模型方法、数据处理流程和应用分析等方面,
介绍了一种基于植被水分指数的旱情监测方法,并对
其监测结果进行了统计分析与评价。EWT数据与气
象数据的分析表明,EWT与降水具有相似的时序变
化趋势,但存在一定滞后性;而土壤湿度存在显著的
相关性。
由于 旱情的发生发展涉及复杂的水文变化和植被
生理形态变化,以及土壤水文与植被含水量之间的相
互影响。综合考虑土壤与植被含水量的旱情遥感监测
模型研究,将有助于提高遥感监测的精度以及对旱情
时空发展的综合评估能力。因此,结合多种监测手段
(如微波、高光谱等),建立基于物理机制的、多传感
器数据综合处理的旱情评估模型,将是旱情遥感监测
的研究重点。
REFERENCES
Ceccato P, Gobron N, Flasse S, Pinty B and Tarantola S. 2002a.
Designing a spectral index to estimate vegetation water content
from remote sensing data: Part 1. Theoretical approach. Re-
mote Sensing of Environment, 82(2–3): 188–197 DOI: 10.1016/
S0034-4257(02)00037-8
Ceccato P, Flasse S and Gregoire J M. 2002b. Designing a spectral
index to estimate vegetation water content from remote sens-
ing data: Part 2. Validation and applications. Remote Sensing
of Environment, 82(2–3): 198–207 DOI: 10.1016/S0034-4257-
(02)00036-6
Chen W Y, Xiao Q G and Sheng Y W. 1994. Application of the
anomaly vegetation index to monitoring heavy drought in 1992.
Remote Sensing of Environment, 9(2): 106–112
Chen X L, Zhao H M and Tian L Q. 2008. Model and Application of
Environmental Remote Sensing. Wuhan: Wuhan University Press
Du X. 2006. Monitoring and Spatio-Temporal Evolution Researching
on Vegetation Leaf Water. Beijing: Graduate School of Chinese
Academy of Sciences
England A W, Galantowkz J F and Schretter M S. 1992. The radio-
brightness thermal inertia measure of soil moisture. IEEE Tans-
actions on Geoscience and Remote Sensing, 30(1): 132–139

1329王丽涛 等:旱情遥感监测研究进展与应用案例分析
Fensholt R and Sendhoh I. 2003. Derivation of a shortwave infrared
water stress index from MODIS near-and shortwave infrared
data in a semiarid environment. Remote Sensing of Environment,
87(1): 111–121
Gao B C. 1996. NDWI-A normalized difference water index for
remote sensing of vegetation liquid water from space. Remote
Sensing of Environment, 58(3): 257–266 DOI: 10.1016/S0034-
4257(96)00067-3
Goward S N, Xue Y K and Czajkowski K P. 2002. Evaluating land
surface moisture conditions from the remotely sensed tempera-
ture/vegetation index measurements: an exploration with the
simplifi ed simple biosphere model. Remote Sensing of Environ-
ment, 79(2–3): 225–242
Gutman G, Ignatov A and Olson S. 1996. Global land monitoring
using AVHRR time series. Advances in Space Research, 17(1):
51–54 DOI: 10.1016/0273-1177(95)00445-K
Hunt E R Jr and Rock B N. 1989. Detection of Changes in Leaf Wa-
ter Content Using Near- and Middle-Infrared Refl ectances. Re-
mote Sensing of Environment, 30(1): 43–54 DOI: 10.1016/0034-
4257(89)90046-1
Idso S B, Jackson R D, Pinter P J Jr, Reginato R J and Hatfi eld J L.
1981. Normalizing the stress-degree-day parameter for environ-
mental variability. Agricultural Meteorology, 24(1): 45–55
Jackson R D, Idso S B, Reginato R J and Pinter P J Jr. 1981. Canopy
temperature as a crop water stress indicator. Water Resource Re-
search, 17(4): 1133–1138 DOI: 10.1029/WR017i004p01133
Li J R. 2001. Method and advances of drought monitoring by remote
sensing. Journal of China Hydrology, 21(4): 15–17
Li Z, Guo H D and Shi J C. 2002. Measuring the change of soil
moisture with vegetation cover integration passive and active
microwave data. Journal of Remote Sensing, 6(6): 481–484
Palacios O A, Khanna S, Litago J, Whiting M L and Ustin S L. 2005.
Assessment of NDVI and NDWI spectral indices using MODIS
time series analysis and development of a new spectral index
based on MODIS shortwave infrared bands//Remote Sensing
and Geoinformation Processing in the Assessment and Monitor-
ing of Land Degradation and Desertifi cation. Germany: Univer-
sity of Trier
Price J C. 1985. On the analysis of thermal infrared imagery: the lim-
ited utility of apparent thermal inertia. Remote Sensing of Envi-
ronment, 18(1): 59–73 DOI: 10.1016/0034-4257(85)90038-0
Sandholt I, Rasmussen K and Andersen J. 2002. A simple interpreta-
tion of the surface temperature/vegetation index space for as-
sessment of surface moisture status. Remote Sensing of Environ-
ment, 79(2–3): 213–224 DOI: 10.1016/S0034-4257(01)00274-7
Shen G R and Tian G L. 1998. Drought monitoring with crop water
stress index. Agricultural Reseach in the Arid Areas, 16(1):
123–128
Sun L, Wang F and Wu Q. 2010. Drought monitoring by remote sens-
ing in winter-wheat-growing area of China. Transactions of the
Chinese Society of Agricultural Engineering, 26(1): 243–249
Wang J R and Schmugge T J. 1985. An empirical model for the
complex dielectric permittivity of soils as a function of water
content. IEEE Transactions on Geoscience and Remote Sensing,
18(4): 288–295
Wang X, Zhang Z X, Zhao X L and Tan W B. 2007. A review of re-
search on monitoring of soil moisture by remote sensing. Acta
Pedologica Sinica, 44(1): 157–163
Wu M Q, Cui W H and Li J G. 2007. Monitoring drought in moun-
tainous area based on temperature/vegetation dryness index
(TVDI). Arid Land Geography, 30(1): 30–35
Yan F, Qin Z H, Li M S and Wand Y J. 2006. Progress in soil mois-
ture estimation from remote sensing data for agricultural drought
monitoring. Journal of Natural Disasters, 15(6): 114–121
Yang X, Wu J J, Yan F and Zhang J. 2009. Assessment of regional
soil moisture status based on characteristics of surface tem-
perature/vegetation index space. Acta Pedologica Sinica, 29(3):
12505–1216
Yu J M. 2008. Research on the Monitoring Models of Crop Vegeta-
tion Water Using Remote Sensing. Beijing: Graduate School of
Chinese Academy of Sciences
Zha T, Barr A G, Garth K, Black T A, McCaughey J H and Flanagan
L B. 2010. Interannual variation of evapotranspiration from for-
est and grassland ecosystems in western canada in relation to
drought. Agricultural and Forest Meteorology, 150(11): 1476–
1484 DOI: 10.1016/j.agrformet.2010.08.003
Zhang C C, Wang X Y and Shao J L. 2005. Estimated evapotranspira-
tion based on NOAA data in the Yellow River Delta. Resources
Science, 27(1): 86–91
Zhang H W, Chen H L, Shen S H, Zhou G H and Yu W D. 2008.
Drought remote sensing monitoring based on the surface water
content index (SWCI) method. Remote Sensing Technology and
Application, 23(6): 624–628
Zhang H W. 2009. Remote Sensing Dynamic Monitoring for spring
drought of winter wheat in Henan Province with the EOS/
MODIS data. Nanjing: Nanjing University of Information Sci-
ence and Technology
Zhang R H, Su H B, Li Z L, Sun X M, Tang X Z and Becker F. 2001.
The potential information in the temperature difference between
shadow and sunlit of surfaces and a new way of retrieving the
soil moisture. Science in China Series D (Earth Sciences),
44(2): 112–123 DOI: 10.1007/BF02879654
Zhang R H, Sun X M, Li Z L, Zhu Z L, Su H B and Tang X Z. 2003.
A remote sensing model for monitoring soil evaporation based
on differential thermal inertia and its validation. Science in
China Series D (Earth Sciences), 46(4): 344–355
Zhao Y S. 2003. Remote Sensing Application Principles and Meth-
ods. Beijing: Science Press
Zhou P, Ding J L, Wang F, Ubul G and Zhang Z G. 2010. Retrieval
methods of soil water content in vegetation covering areas based

1330 Journal of Remote Sensing 遥感学报 2011,15(6)
on multi-source remote sensing data. Journal of Remote Sens-
ing, 14(5): 959–973
附中文参考文献
陈维英,肖乾广,盛永伟.1994.距平植被指数在1992年特大干
旱监测中的应用.环境遥感,9(2): 106–112
陈晓玲,赵红梅,田礼乔.2008.环境遥感模型与应用.武汉:
武汉大学出版社
杜晓.2006.农作物叶面水遥感监测及其时空特征分析.北京:
中国科学院研究生院
李纪人.2001.旱情遥感监测方法及其进展.水文,21(4): 15–17
李震,郭华东,施建成.2002.综合主动和被动微波数据监测土
壤水分变化.遥感学报,6(6): 481–484
申广荣,田国良.1998.作物缺水指数监测旱情方法研究.干旱
地区农业研究,16(1): 123–128
孙丽,王飞,吴全.2010.干旱遥感监测模型在中国冬小麦区的
应用.农业工程学报,26(1): 243–249
汪潇,张增祥,赵晓莉,谭文彬.2007.遥感监测土壤水分研究
综述.土壤学报,44(1): 157–163
吴孟泉,崔伟宏,李景刚.2007.温度植被干旱指数(TVDI)在复
杂山区干旱监测的应用研究.干旱区地理,30(1): 30–35
闫峰,覃志豪,李茂松,王艳姣. 2006.农业旱灾监测中土壤水
分遥感反演研究进展.自然灾害学报,15(6): 114–121
杨曦,武建军,闫峰,张洁.2009.基于地表温度-植被指数特征
空间的区域土壤干湿状况.生态学报,29(3): 1205–1216
于君明.2008.农作物水分状况遥感探测方法研究.北京: 中国
科学院研究生院
张长春,王晓燕,邵景力.2005.利用NOAA数据估算黄河三角
洲区域蒸散量.资源科学,27(1): 86–91
张红卫,陈怀亮,申双和,周官辉,余卫东.2008.基于表层水
分含量指数(SWCI)的土壤干旱遥感监测.遥感技术与应用,
23(6): 624–628
张红卫.2009.基于EOS/MODIS数据的河南省冬小麦春季干旱
遥感动态监测研究.南京: 南京信息工程大学
赵英时.2003.遥感应用分析原理与方法.北京: 科学出版社
周鹏,丁建丽,王飞,古丽加玛丽 · 吾不力,张治广.2010.植
被覆盖地表土壤水分遥感反演.遥感学报,14(5): 959–973