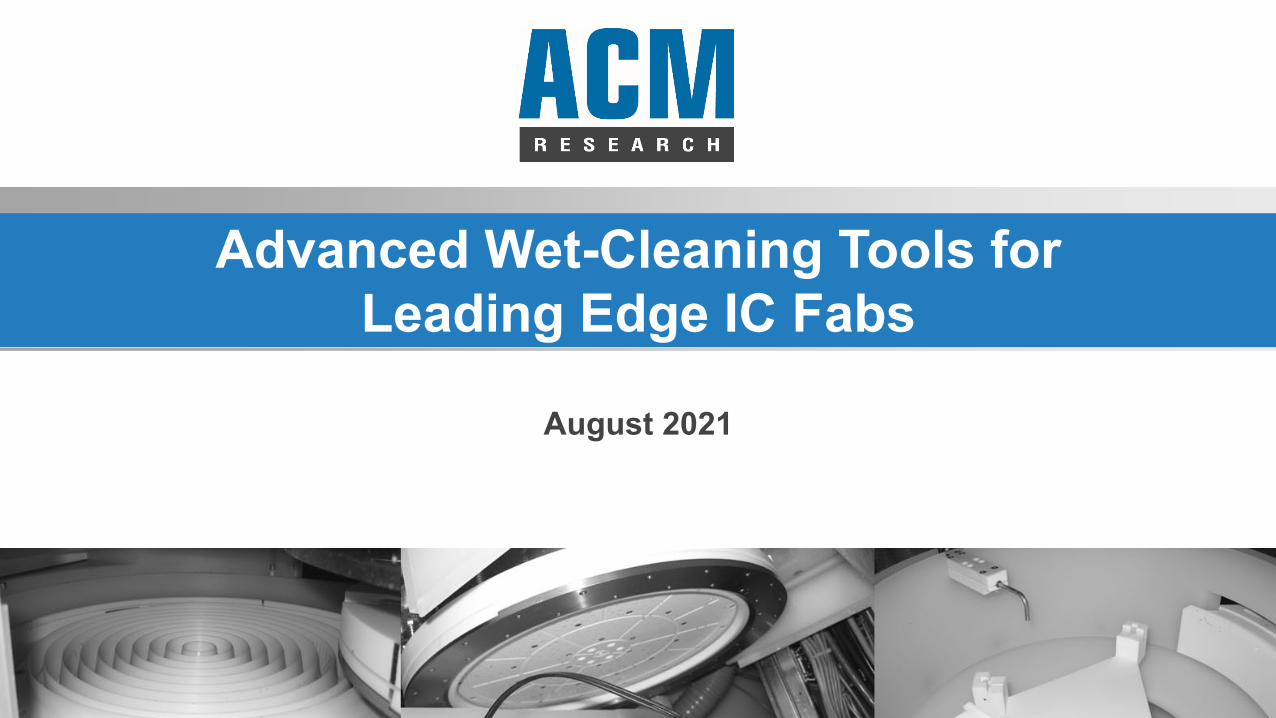
Advanced Wet-Cleaning Tools for Leading Edge IC Fabs
17
Advanced Wet-Cleaning Tools for Leading Edge IC Fabs August 2021
Transcript of Advanced Wet-Cleaning Tools for Leading Edge IC Fabs
Advanced Wet-Cleaning Tools for Leading Edge IC Fabs
August 2021
2
Market Data. Information presented below under “Who is ACM Research?,” “Innovation and Product Introductions Expanding Addressable Market” and “Investment Highlights” concerning ACMResearch’s total addressable market presents a forecast based on information provided by Gartner, Inc. in its report “Forecast: Semiconductor Wafer Fab Equipment, Worldwide, 4Q20 Update”(December 2020). You are cautioned not to rely on or give undue weight to this information. The Gartner report represents research opinions or viewpoints that are published, as part of asyndicated subscription service, by Gartner and are not representations of fact. The Gartner report speaks as of its original publication date (and not as of the date of this presentation), and theopinions expressed in the Gartner report are subject to change without notice. While ACM Research is not aware of any misstatements regarding the information provided in the Gartner report, ithas not independently verified the accuracy or completeness of that information, which involves numerous assumptions and is subject to risks and uncertainties, as well as change based onvarious factors, that could cause results to differ materially from the forecast presented. The industry in which ACM Research operates is subject to a high degree of uncertainty and risk due tovariety of factors, including those described in ACM Research’s public filings with the Securities and Exchange Commission, as described above.
Note Regarding Presentation of Non-GAAP Financial Measures. Information presented below under “Q2 2021 Highlights,” “Q2 2021 Financial Results” and “”GAAP to Non-GAAP Reconciliation” includes certain “non-GAAP financial measures” as defined in Regulation G under the Securities Exchange Act of 1934, including non-GAAP adjusted gross margin, adjusted operating margin, fully diluted adjusted EPS, adjusted gross profit and adjusted operating income. These supplemental measures exclude the impact of stock-based compensation and change in fair value of financial liability, which ACM Research does not believe are indicative of its core operating results. A reconciliation of each non-GAAP financial measure to the most directly comparable GAAP financial measure is included under “GAAP to Non-GAAP Reconciliation.”
SAPS, TEBO, ULTRA C, ULTRA FURNACE and the ACM logo are ACM Research’s trademarks. For convenience, these trademarks appear in this presentation without ™ symbols, but that practice does not mean that ACM Research will not assert, to the fullest extent under applicable law, its rights to the trademarks.
3
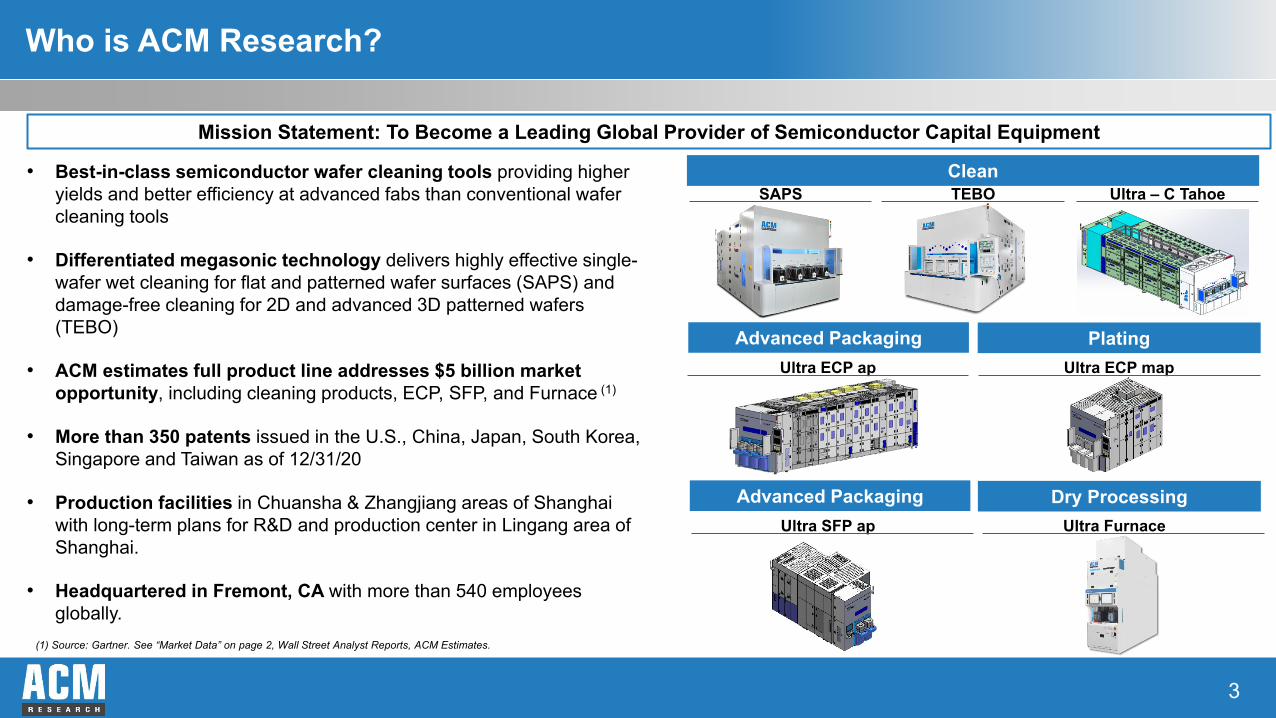
Who is ACM Research?
CleanSAPS TEBO Ultra – C Tahoe
Advanced Packaging PlatingUltra ECP ap Ultra ECP map
• Best-in-class semiconductor wafer cleaning tools providing higher yields and better efficiency at advanced fabs than conventional wafer cleaning tools
• Differentiated megasonic technology delivers highly effective single-wafer wet cleaning for flat and patterned wafer surfaces (SAPS) and damage-free cleaning for 2D and advanced 3D patterned wafers (TEBO)
• ACM estimates full product line addresses $5 billion market opportunity, including cleaning products, ECP, SFP, and Furnace (1)
• More than 350 patents issued in the U.S., China, Japan, South Korea, Singapore and Taiwan as of 12/31/20
• Production facilities in Chuansha & Zhangjiang areas of Shanghai with long-term plans for R&D and production center in Lingang area of Shanghai.
• Headquartered in Fremont, CA with more than 540 employees globally.
Mission Statement: To Become a Leading Global Provider of Semiconductor Capital Equipment
(1) Source: Gartner. See “Market Data” on page 2, Wall Street Analyst Reports, ACM Estimates.
Advanced Packaging Dry ProcessingUltra SFP ap Ultra Furnace
4
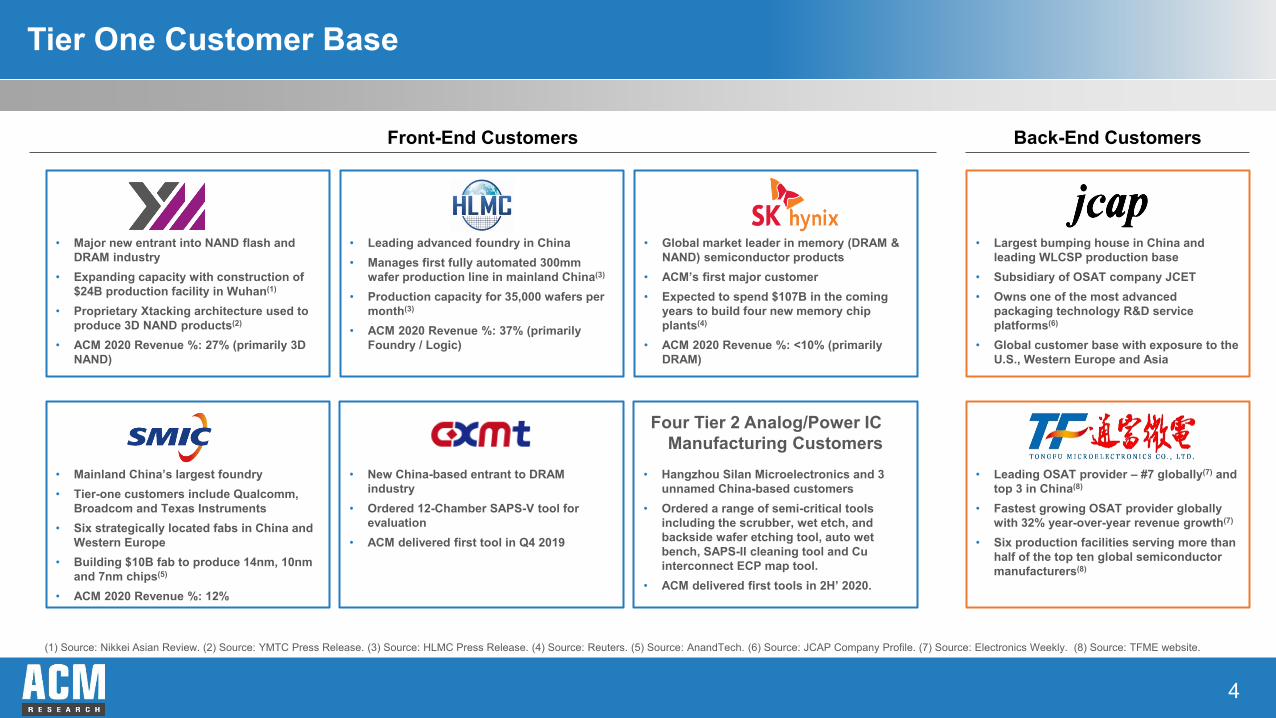
Tier One Customer Base
• Global market leader in memory (DRAM & NAND) semiconductor products
• ACM’s first major customer• Expected to spend $107B in the coming
years to build four new memory chip plants(4)
• ACM 2020 Revenue %: <10% (primarily DRAM)
• Major new entrant into NAND flash and DRAM industry
• Expanding capacity with construction of $24B production facility in Wuhan(1)
• Proprietary Xtacking architecture used to produce 3D NAND products(2)
• ACM 2020 Revenue %: 27% (primarily 3D NAND)
• Leading advanced foundry in China• Manages first fully automated 300mm
wafer production line in mainland China(3)
• Production capacity for 35,000 wafers per month(3)
• ACM 2020 Revenue %: 37% (primarily Foundry / Logic)
• Mainland China’s largest foundry• Tier-one customers include Qualcomm,
Broadcom and Texas Instruments• Six strategically located fabs in China and
Western Europe • Building $10B fab to produce 14nm, 10nm
and 7nm chips(5)
• ACM 2020 Revenue %: 12%
• Largest bumping house in China and leading WLCSP production base
• Subsidiary of OSAT company JCET• Owns one of the most advanced
packaging technology R&D service platforms(6)
• Global customer base with exposure to the U.S., Western Europe and Asia
• Leading OSAT provider – #7 globally(7) and top 3 in China(8)
• Fastest growing OSAT provider globally with 32% year-over-year revenue growth(7)
• Six production facilities serving more than half of the top ten global semiconductor manufacturers(8)
(1) Source: Nikkei Asian Review. (2) Source: YMTC Press Release. (3) Source: HLMC Press Release. (4) Source: Reuters. (5) Source: AnandTech. (6) Source: JCAP Company Profile. (7) Source: Electronics Weekly. (8) Source: TFME website.
• New China-based entrant to DRAM industry
• Ordered 12-Chamber SAPS-V tool for evaluation
• ACM delivered first tool in Q4 2019
Front-End Customers Back-End Customers
• Hangzhou Silan Microelectronics and 3 unnamed China-based customers
• Ordered a range of semi-critical tools including the scrubber, wet etch, and backside wafer etching tool, auto wet bench, SAPS-II cleaning tool and Cu interconnect ECP map tool.
• ACM delivered first tools in 2H’ 2020.
Four Tier 2 Analog/Power IC Manufacturing Customers
5
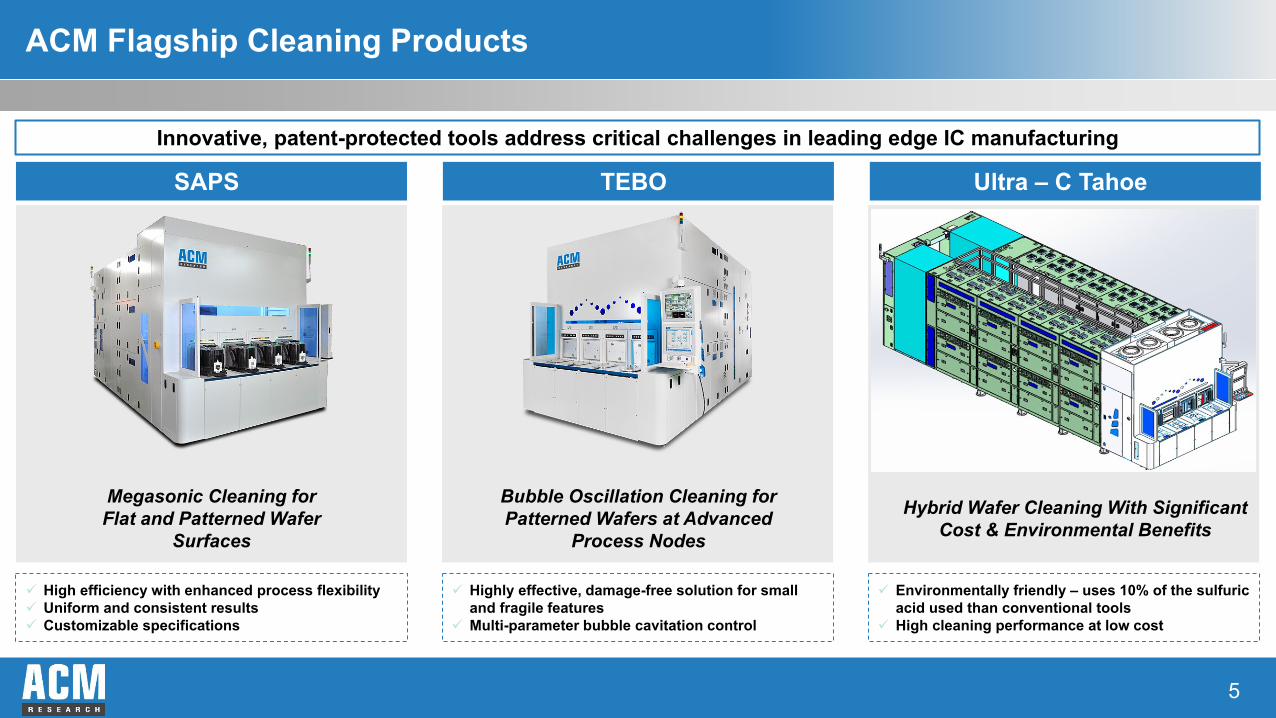
ACM Flagship Cleaning Products
Megasonic Cleaning forFlat and Patterned Wafer
Surfaces
Bubble Oscillation Cleaning for Patterned Wafers at Advanced
Process Nodes
Hybrid Wafer Cleaning With Significant Cost & Environmental Benefits
SAPS TEBO Ultra – C Tahoe
High efficiency with enhanced process flexibility Uniform and consistent results Customizable specifications
Highly effective, damage-free solution for small and fragile features
Multi-parameter bubble cavitation control
Environmentally friendly – uses 10% of the sulfuric acid used than conventional tools
High cleaning performance at low cost
Innovative, patent-protected tools address critical challenges in leading edge IC manufacturing
6
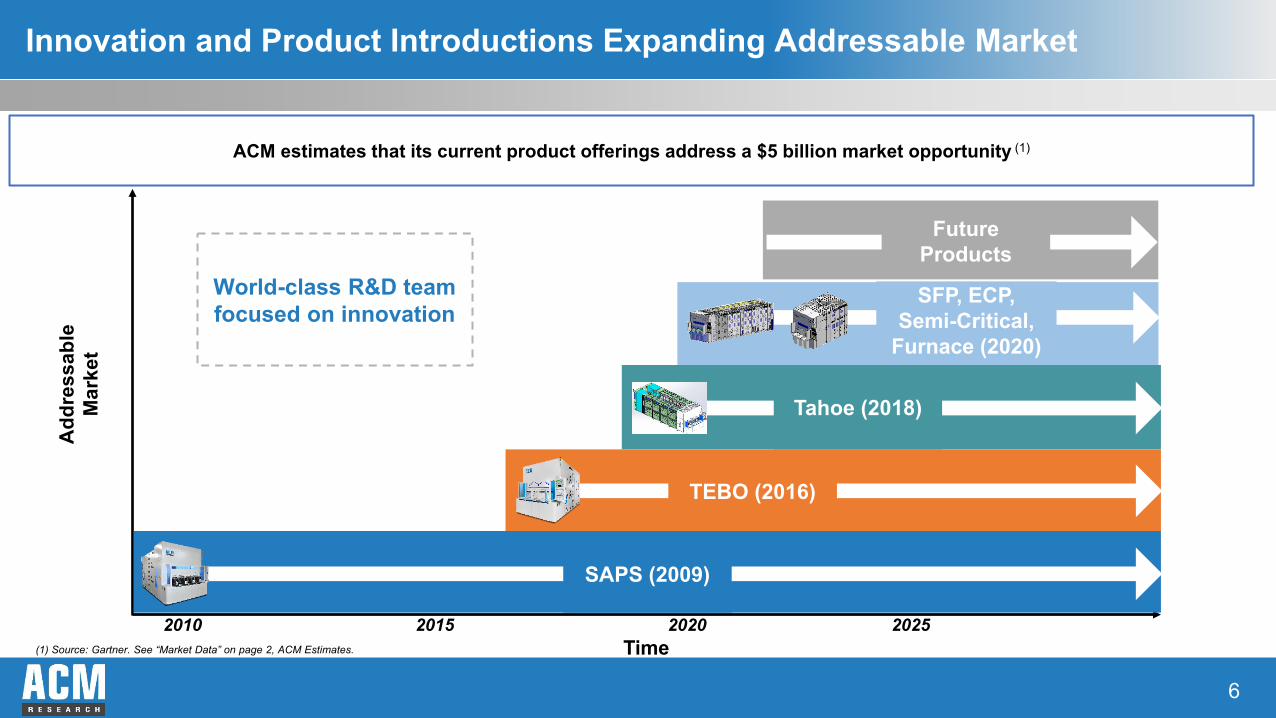
Innovation and Product Introductions Expanding Addressable Market
ACM estimates that its current product offerings address a $5 billion market opportunity (1)
Time
Add
ress
able
Mar
ket
2010 2015 2020 2025
SAPS (2009)
TEBO (2016)
Tahoe (2018)
SFP, ECP, Semi-Critical,
Furnace (2020)
World-class R&D team focused on innovation
FutureProducts
(1) Source: Gartner. See “Market Data” on page 2, ACM Estimates.
7
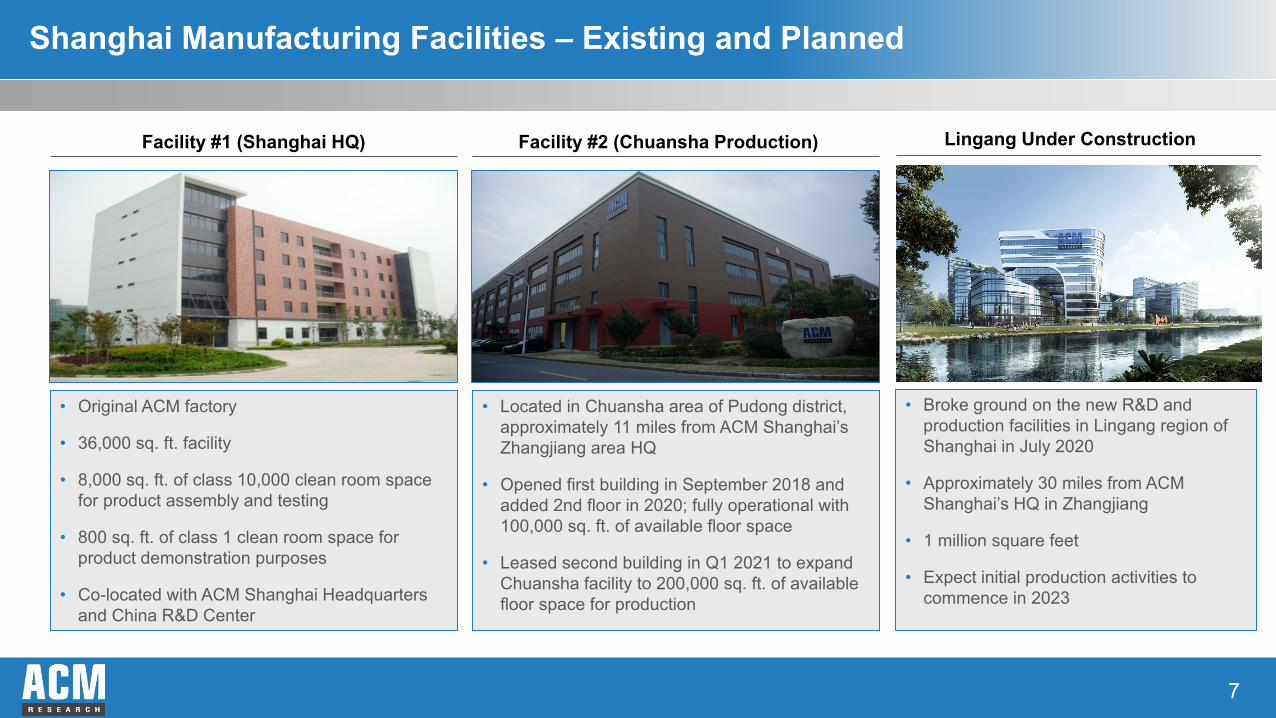
Shanghai Manufacturing Facilities – Existing and Planned
• Original ACM factory
• 36,000 sq. ft. facility
• 8,000 sq. ft. of class 10,000 clean room space for product assembly and testing
• 800 sq. ft. of class 1 clean room space for product demonstration purposes
• Co-located with ACM Shanghai Headquarters and China R&D Center
• Located in Chuansha area of Pudong district, approximately 11 miles from ACM Shanghai’s Zhangjiang area HQ
• Opened first building in September 2018 and added 2nd floor in 2020; fully operational with 100,000 sq. ft. of available floor space
• Leased second building in Q1 2021 to expand Chuansha facility to 200,000 sq. ft. of available floor space for production
Facility #1 (Shanghai HQ) Facility #2 (Chuansha Production) Lingang Under Construction
• Broke ground on the new R&D and production facilities in Lingang region of Shanghai in July 2020
• Approximately 30 miles from ACM Shanghai’s HQ in Zhangjiang
• 1 million square feet
• Expect initial production activities to commence in 2023
8
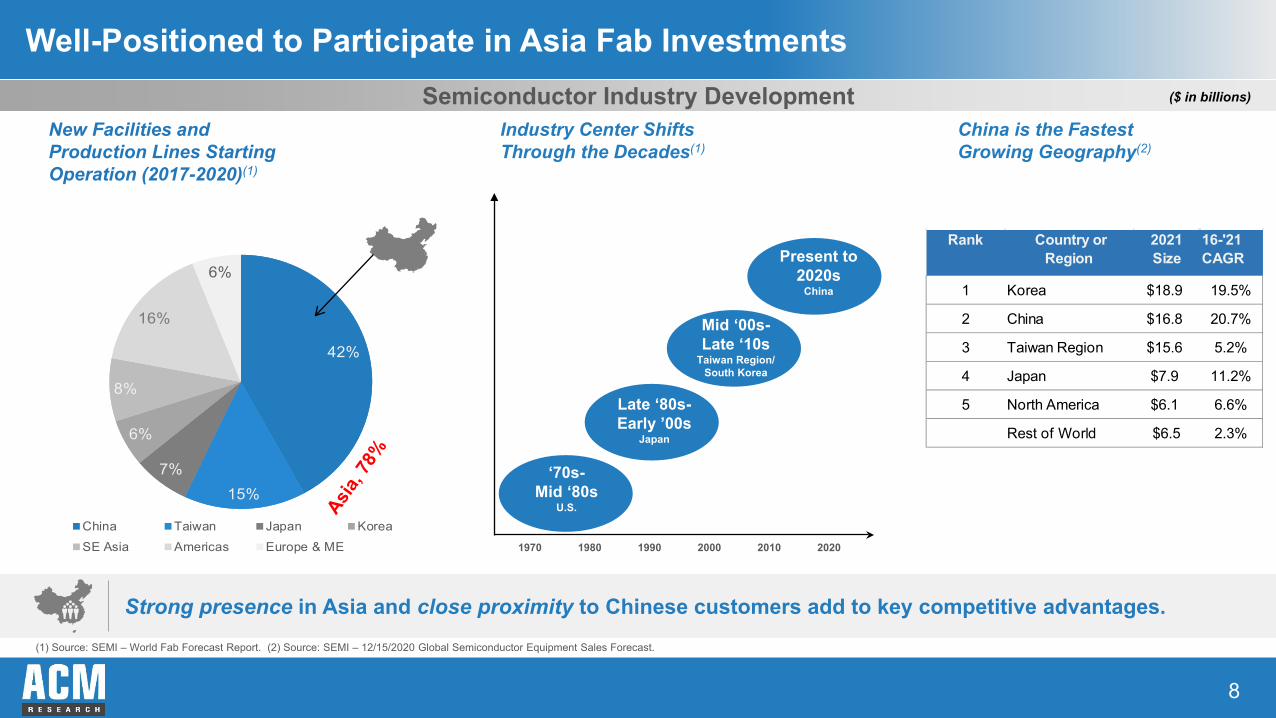
42%
15%7%
6%
8%
16%
6%
China Taiwan Japan KoreaSE Asia Americas Europe & ME
Well-Positioned to Participate in Asia Fab Investments
Strong presence in Asia and close proximity to Chinese customers add to key competitive advantages.(1) Source: SEMI – World Fab Forecast Report. (2) Source: SEMI – 12/15/2020 Global Semiconductor Equipment Sales Forecast.
Semiconductor Industry DevelopmentIndustry Center Shifts Through the Decades(1)
($ in billions)
Late ‘80s-Early ’00s
Japan
Present to2020s
China
‘70s-Mid ‘80s
U.S.
1970 1980 1990 2000 2010 2020
Mid ‘00s-Late ‘10s
Taiwan Region/ South Korea
New Facilities and Production Lines Starting Operation (2017-2020)(1)
China is the Fastest Growing Geography(2)
Rank Country or Region
2021 Size
16-'21 CAGR
1 Korea $18.9 19.5%
2 China $16.8 20.7%
3 Taiwan Region $15.6 5.2%
4 Japan $7.9 11.2%
5 North America $6.1 6.6%
Rest of World $6.5 2.3%
9
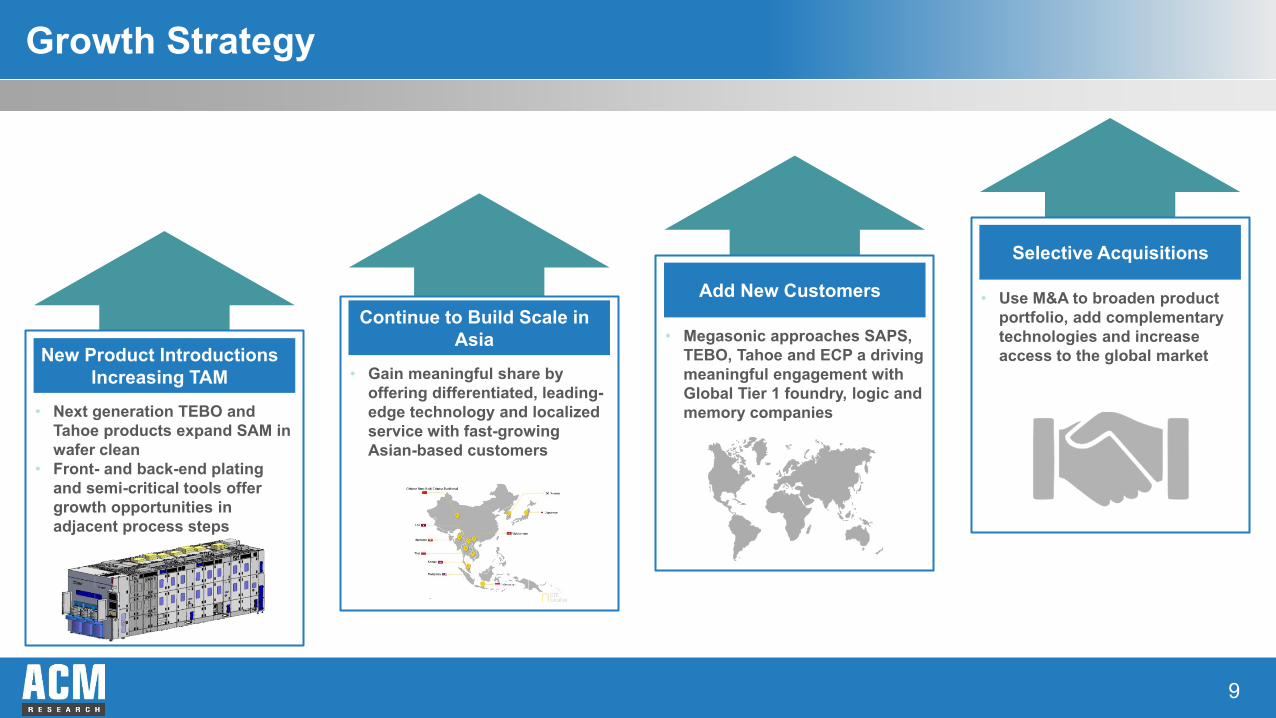
Growth Strategy
New Product Introductions Increasing TAM
• Next generation TEBO and Tahoe products expand SAM in wafer clean
• Front- and back-end plating and semi-critical tools offer growth opportunities in adjacent process steps
111Selective Acquisitions
• Use M&A to broaden product portfolio, add complementary technologies and increase access to the global market
111Continue to Build Scale in Asia
• Gain meaningful share by offering differentiated, leading-edge technology and localized service with fast-growing Asian-based customers
111Add New Customers
• Megasonic approaches SAPS, TEBO, Tahoe and ECP a driving meaningful engagement with Global Tier 1 foundry, logic and memory companies
10
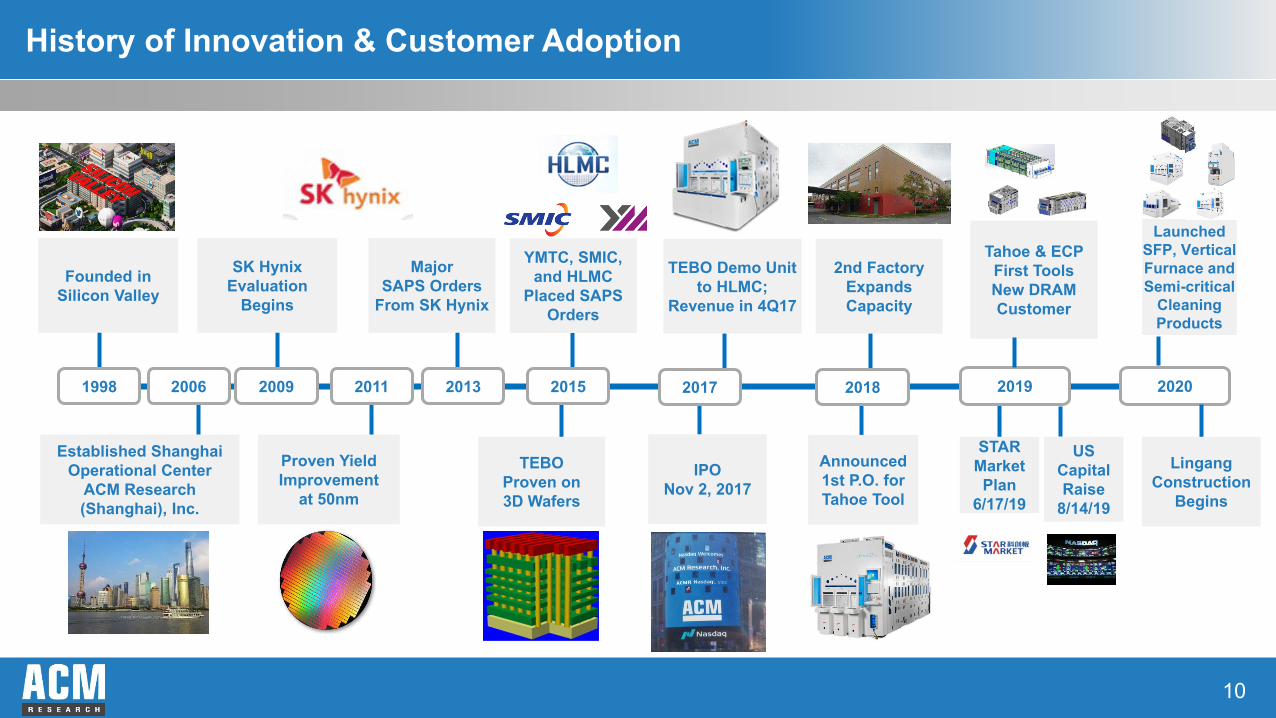
History of Innovation & Customer Adoption
Founded in Silicon Valley
1998 2006 2013
Established Shanghai Operational Center
ACM Research (Shanghai), Inc.
SK Hynix Evaluation
Begins
2009
Proven Yield Improvement
at 50nm
2011
MajorSAPS Orders
From SK Hynix
YMTC, SMIC, and HLMC
Placed SAPS Orders
TEBO Proven on 3D Wafers
TEBO Demo Unit to HLMC;
Revenue in 4Q17
IPO Nov 2, 2017
2nd Factory Expands Capacity
20192015 2017 2018
Announced 1st P.O. for Tahoe Tool
Tahoe & ECP First Tools New DRAM Customer
STAR Market
Plan 6/17/19
US Capital Raise
8/14/19
Launched SFP, Vertical Furnace and Semi-critical
Cleaning Products
2020
Lingang Construction
Begins
11
Q2 2021 Highlights and Recent Announcements
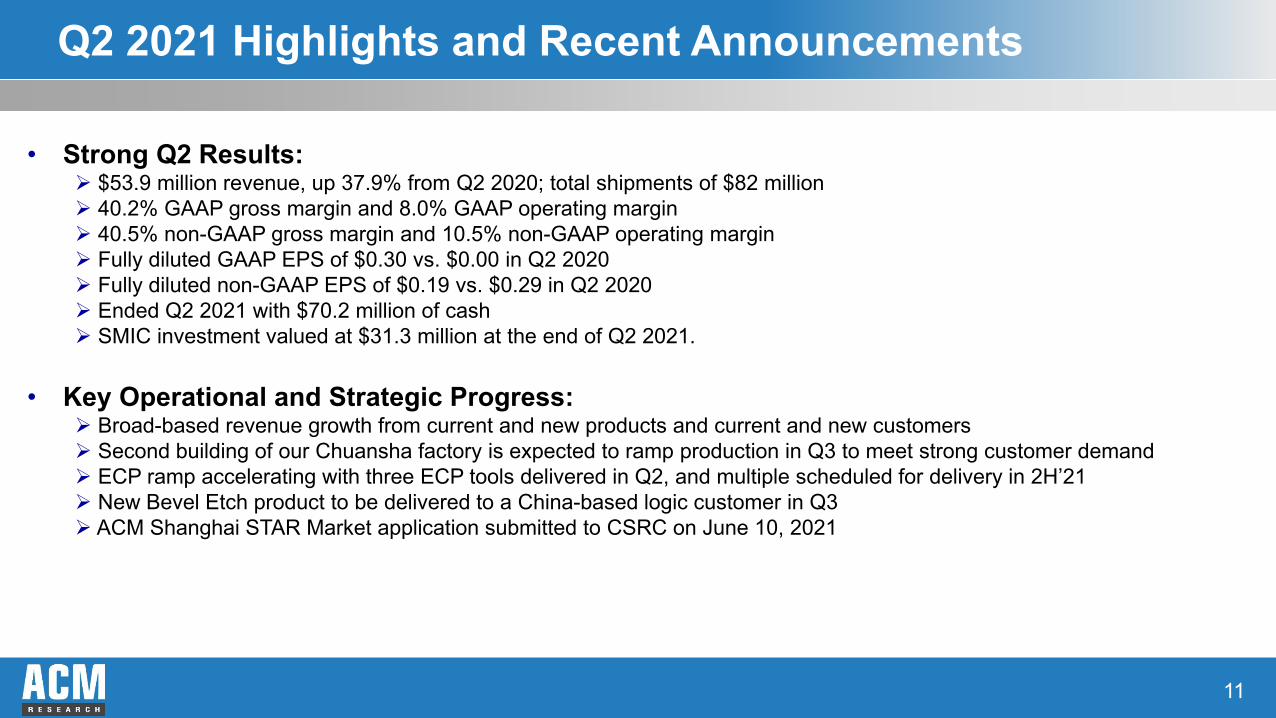
• Strong Q2 Results: $53.9 million revenue, up 37.9% from Q2 2020; total shipments of $82 million 40.2% GAAP gross margin and 8.0% GAAP operating margin 40.5% non-GAAP gross margin and 10.5% non-GAAP operating margin Fully diluted GAAP EPS of $0.30 vs. $0.00 in Q2 2020 Fully diluted non-GAAP EPS of $0.19 vs. $0.29 in Q2 2020 Ended Q2 2021 with $70.2 million of cash SMIC investment valued at $31.3 million at the end of Q2 2021.
• Key Operational and Strategic Progress: Broad-based revenue growth from current and new products and current and new customers Second building of our Chuansha factory is expected to ramp production in Q3 to meet strong customer demand ECP ramp accelerating with three ECP tools delivered in Q2, and multiple scheduled for delivery in 2H’21 New Bevel Etch product to be delivered to a China-based logic customer in Q3 ACM Shanghai STAR Market application submitted to CSRC on June 10, 2021

12
Q2 2021 Revenue Detail
`
2021 2020 2021 2020 Single Wafer Cleaning, Tahoe and Semi-Critical Cleaning Equipment 45,461$ 33,340$ 77,874$ 56,124$ ECP (front-end and packaging), Furnace and Other Technologies - 4,490 5,550 4,490 Advanced Packaging (excluding ECP), Services & Spares 8,403 1,219 14,172 2,783 Total Revenue By Product Category 53,864$ 39,049$ 97,596$ 63,397$
Wet cleaning and other front-end processing tools 45,974$ 37,830$ 77,874$ 60,614$ Advanced packaging, other processing tools, services and spares 7,890 1,219 19,722 2,783 Total Revenue Front-end and Back-End 53,864$ 39,049$ 97,596$ 63,397$
2021 2020 2021 2020 Mainland China 53,736$ 39,004$ 97,432$ 63,293$ Other Regions 128 45 164 104
53,864$ 39,049$ 97,596$ 63,397$
Three Months Ended June 30,
Three Months Ended June 30,
S ix Months Ended June 30,
S ix Months Ended June 30,
13
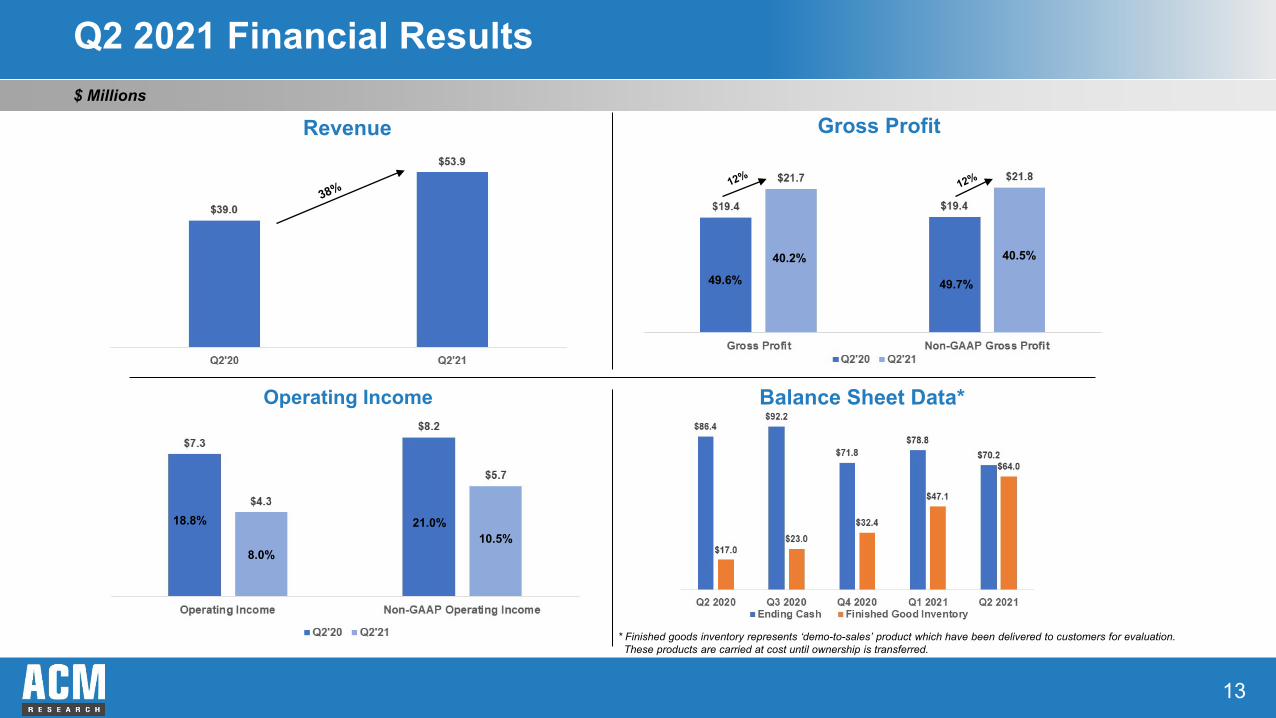
Q2 2021 Financial Results$ Millions
Revenue Gross Profit
Balance Sheet Data*Operating Income
* Finished goods inventory represents ‘demo-to-sales’ product which have been delivered to customers for evaluation. These products are carried at cost until ownership is transferred.
18.8%
8.0%
21.0%10.5%
49.6%
40.2% 40.5%
49.7%
14
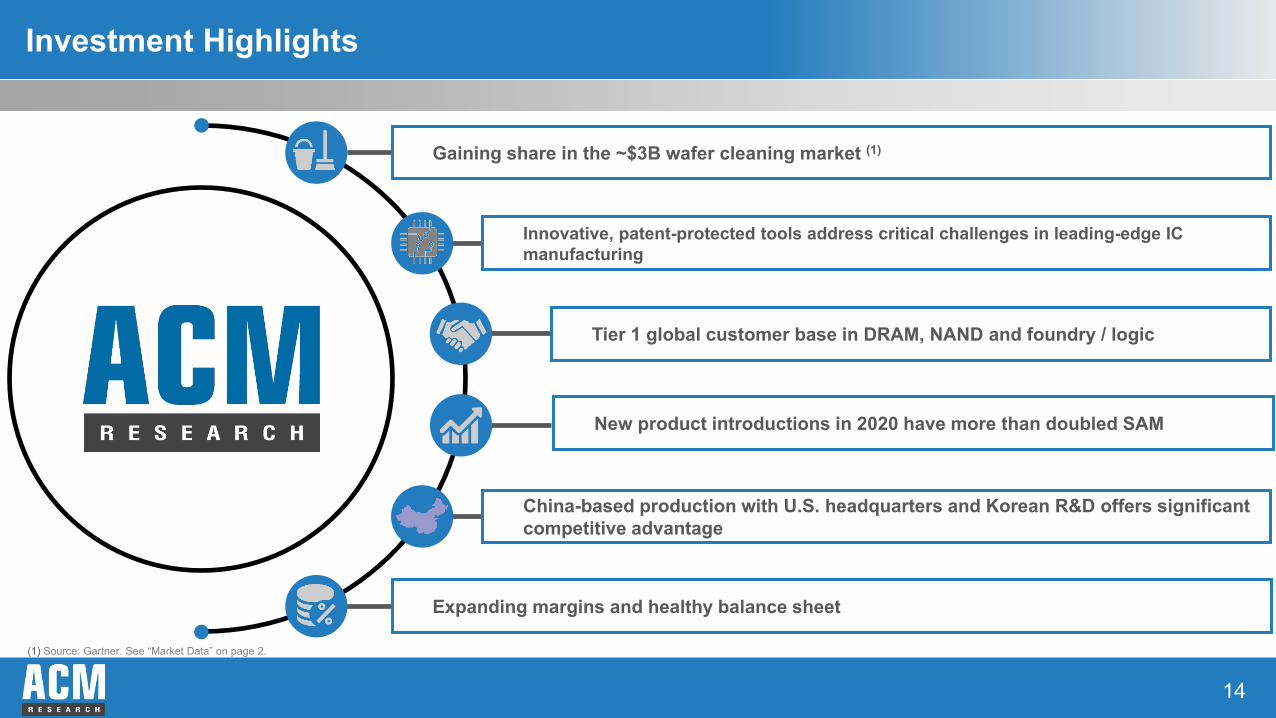
Investment Highlights
Innovative, patent-protected tools address critical challenges in leading-edge IC manufacturing
Tier 1 global customer base in DRAM, NAND and foundry / logic
New product introductions in 2020 have more than doubled SAM
China-based production with U.S. headquarters and Korean R&D offers significant competitive advantage
Expanding margins and healthy balance sheet
Gaining share in the ~$3B wafer cleaning market (1)
(1) Source: Gartner. See “Market Data” on page 2.

15
GAAP to Non-GAAP Reconciliation (1)
2018 2019 2020 3 months Ended 6/30/2021 3 months Ended 6/30/2020
GAAP Income from Operations $6.5 $17.8 $21.5 $4.3 $7.3Plus: Stock-based Compensation $3.4 $3.6 $5.6 $1.3 $0.9
Adjusted Income from Operations $9.8 $21.4 $27.1 $5.7 $8.2
GAAP Net Income $6.6 $19.5 $21.7 $7.3 $0.5Plus: Interest Expense (Income), Net $0.5 $0.4 $0.1 $0.2 ($0.1)Plus: Income Tax Expense (Benefit) $0.8 ($0.5) ($2.4) $0.0 $1.9Plus: Depreciation and Amortization $0.4 $0.8 $1.1 $0.5 $0.2Plus: Stock-based Compensation $3.4 $3.6 $5.6 $1.3 $0.9Plus: Change in Fair Value of Financial Liability - - $12.0 - $5.4Plus: Unrealized Gain on Trade Securities - - ($12.6) ($3.8) -
Adjusted EBITDA $11.6 $23.7 $25.5 $5.5 $8.8
GAAP Net Income $6.6 $19.5 $21.7 $7.3 $0.5Plus: Change in Fair Value of Financial Liability - - $12.0 - $5.4Plus: Stock-based Compensation $3.4 $3.6 $5.6 $1.3 $0.9Plus: Unrealized Gain on Trade Securities - - ($12.6) ($3.8) -
Adjusted Net Income $9.9 $23.0 $26.7 $4.9 $6.8

16
GAAP to Non-GAAP Reconciliation (2)
Actual Adjusted Actual Adjusted
(GAAP) (Non-GAAP) (GAAP) (Non-GAAP)
Revenue 53,864$ -$ -$ 53,864$ 39,049$ -$ -$ 39,049$ Cost of revenue (32,184) (110) - (32,074) (19,693) (43) - (19,650) Gross profit 21,680 (110) - 21,790 19,356 (43) - 19,399 Gross margin % 40.2% 0.2% 40.5% 49.6% 0.1% 49.7%Operating expenses:
Sales and marketing (5,789) (478) - (5,311) (4,595) (164) - (4,431) Research and development (7,933) (279) - (7,654) (5,221) (188) - (5,033) General and administrative (3,627) (468) - (3,159) (2,204) (460) - (1,744)
Income from operations 4,331$ (1,335)$ -$ 5,666$ 7,336$ (855)$ -$ 8,191$ Operating margin % 8.0% 2.5% - 10.5% 18.8% 2.2% - 21.0%
Change in fair value of financial liability - - - - (5,431) - (5,431) - Unrealized gain on trading securities 3,783 - 3,783 - - - - -
Net income (loss) attributable to ACM Research, Inc. 6,567$ (1,335)$ 3,783$ 4,119$ (81)$ (855)$ (5,431)$ 6,205$ Basic EPS 0.34$ 0.22$ (0.00)$ 0.34$ Diluted EPS 0.30$ 0.19$ (0.00)$ 0.29$
Three Months Ended June 30,2021 2020
SBC SBC
($ in thousands)
Other non-operating
adjustments
Other non-operating
adjustments
17
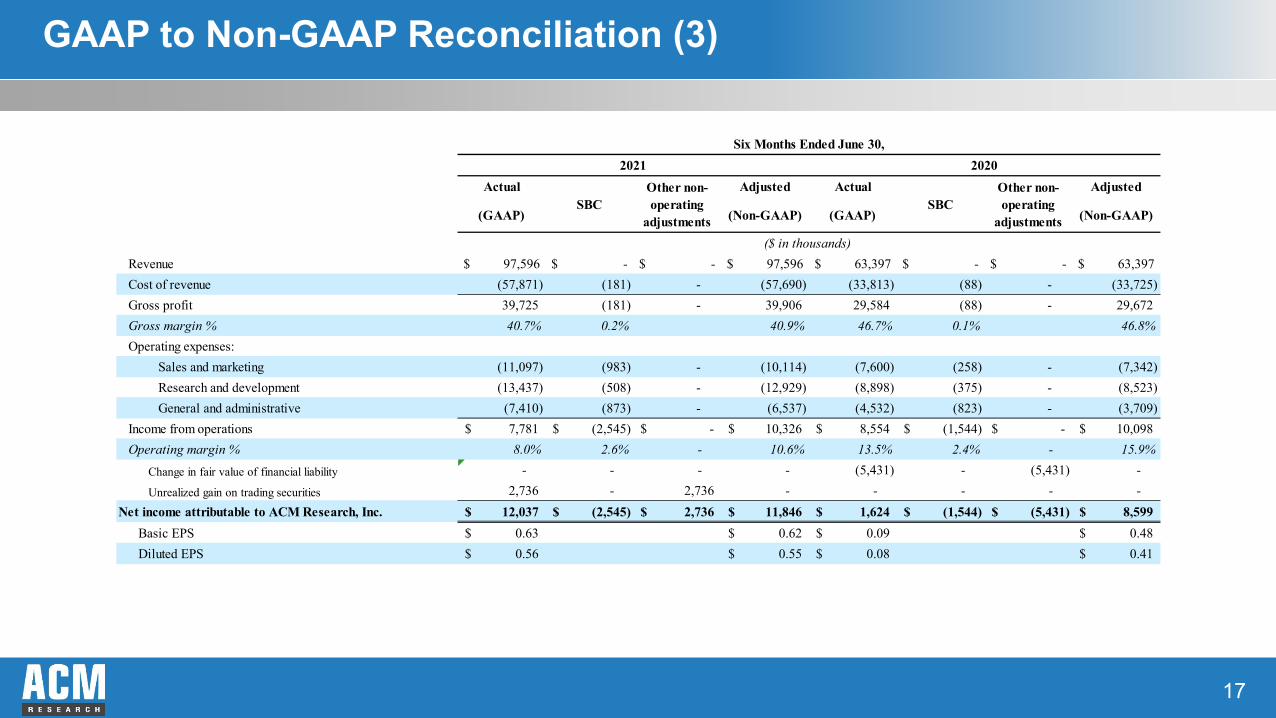
GAAP to Non-GAAP Reconciliation (3)
Actual Adjusted Actual Adjusted
(GAAP) (Non-GAAP) (GAAP) (Non-GAAP)
Revenue 97,596$ -$ -$ 97,596$ 63,397$ -$ -$ 63,397$ Cost of revenue (57,871) (181) - (57,690) (33,813) (88) - (33,725) Gross profit 39,725 (181) - 39,906 29,584 (88) - 29,672 Gross margin % 40.7% 0.2% 40.9% 46.7% 0.1% 46.8%Operating expenses:
Sales and marketing (11,097) (983) - (10,114) (7,600) (258) - (7,342) Research and development (13,437) (508) - (12,929) (8,898) (375) - (8,523) General and administrative (7,410) (873) - (6,537) (4,532) (823) - (3,709)
Income from operations 7,781$ (2,545)$ -$ 10,326$ 8,554$ (1,544)$ -$ 10,098$ Operating margin % 8.0% 2.6% - 10.6% 13.5% 2.4% - 15.9%
Change in fair value of financial liability - - - - (5,431) - (5,431) - Unrealized gain on trading securities 2,736 - 2,736 - - - - -
Net income attributable to ACM Research, Inc. 12,037$ (2,545)$ 2,736$ 11,846$ 1,624$ (1,544)$ (5,431)$ 8,599$ Basic EPS 0.63$ 0.62$ 0.09$ 0.48$ Diluted EPS 0.56$ 0.55$ 0.08$ 0.41$
($ in thousands)
2021 2020Other non-operating
adjustmentsSBC SBC
Six Months Ended June 30,
Other non-operating
adjustments