Advanced Sensing Techniques for Damage Detection in...
12
Advanced Sensing Techniques for Damage Detection in Reinforced Concrete Structures K.A. Peterson 1 , S.N. Pakzad 2 , S.G. Shahidi 3 , S.M. Barbachyn 4 , and Y.C. Kurama 5 , 1 Staff I-Structures, Simpson Gumpertz & Heger Inc., Waltham, MA, 02453. email: [email protected] 2 Assistant Professor, Lehigh University, Dept. of Civil & Environmental Engineering, Bethlehem, PA, 18015. email: [email protected] 3 Graduate Student, Lehigh University, Dept. of Civil & Environmental Engineering, Bethlehem, PA, 18015. email: [email protected] 4 Graduate Student, Dept. of Civil & Environmental Engineering & Earth Sciences, University of Notre Dame, Notre Dame, IN, 46556. email: [email protected] 5 Professor, Dept. of Civil & Environmental Engineering & Earth Sciences, University of Notre Dame, Notre Dame, IN, 46556. email: [email protected] ABSTRACT This paper primarily presents a comparison of traditional and advanced sensing techniques in the field of Structural Health Monitoring for use in damage detection in reinforced concrete (RC) structures. The accuracy of these methods is evaluated through standard laboratory tests on concrete cylinders. Furthermore, a damage detection method for RC structures is introduced where strains measured from densely clustered sensors are used to develop damage sensitive features. This method is verified through simulation data from a Fiber Element model of a new earthquake resistant RC coupled shear wall system. A large scale specimen of this system with a dense network of embedded strain gauges, displacement and rotation transducers, as well as Digital Image Correlation systems was recently tested. The data collected through this experiment will be used to experimentally validate the proposed damage detection method. INTRODUCTION Structural Health Monitoring (SHM) is defined as the process of identifying structural damage through the use of sensing technologies and analytical methods (Lynch and Loh 2006). Damage is characterized as any change introduced into a system that adversely affects its performance. (Farrar and Worden 2007). The changes can be caused by wear from continuous usage or by extreme events like earthquakes or severe wind. SHM offers an automated method for continuous monitoring, inspection, and damage detection in order to identify and evaluate these
Transcript of Advanced Sensing Techniques for Damage Detection in...
Advanced Sensing Techniques for Damage Detection in Reinforced Concrete
Structures
K.A. Peterson1, S.N. Pakzad
2, S.G. Shahidi
3, S.M. Barbachyn
4, and Y.C. Kurama
5,
1Staff I-Structures, Simpson Gumpertz & Heger Inc., Waltham, MA, 02453. email:
[email protected] 2Assistant Professor, Lehigh University, Dept. of Civil & Environmental Engineering,
Bethlehem, PA, 18015. email: [email protected] 3Graduate Student, Lehigh University, Dept. of Civil & Environmental Engineering,
Bethlehem, PA, 18015. email: [email protected] 4Graduate Student, Dept. of Civil & Environmental Engineering & Earth Sciences,
University of Notre Dame, Notre Dame, IN, 46556. email: [email protected] 5Professor, Dept. of Civil & Environmental Engineering & Earth Sciences, University
of Notre Dame, Notre Dame, IN, 46556. email: [email protected]
ABSTRACT
This paper primarily presents a comparison of traditional and advanced
sensing techniques in the field of Structural Health Monitoring for use in damage
detection in reinforced concrete (RC) structures. The accuracy of these methods is
evaluated through standard laboratory tests on concrete cylinders. Furthermore, a
damage detection method for RC structures is introduced where strains measured
from densely clustered sensors are used to develop damage sensitive features. This
method is verified through simulation data from a Fiber Element model of a new
earthquake resistant RC coupled shear wall system. A large scale specimen of this
system with a dense network of embedded strain gauges, displacement and rotation
transducers, as well as Digital Image Correlation systems was recently tested. The
data collected through this experiment will be used to experimentally validate the
proposed damage detection method.
INTRODUCTION
Structural Health Monitoring (SHM) is defined as the process of identifying
structural damage through the use of sensing technologies and analytical methods
(Lynch and Loh 2006). Damage is characterized as any change introduced into a
system that adversely affects its performance. (Farrar and Worden 2007). The
changes can be caused by wear from continuous usage or by extreme events like
earthquakes or severe wind. SHM offers an automated method for continuous
monitoring, inspection, and damage detection in order to identify and evaluate these
changes and track the health of the structure. As a result, if the structure becomes
damaged, the damage can be localized and repaired before catastrophic failure.
The most valuable SHM system can detect the extent, type, and location of
damage, but most SHM methods are only capable of detecting the mere presence of
damage (Huston 2011). For example, vibration-based techniques have been used to
characterize damage based on the concept that local damage causes a reduction of
local stiffness, which influences the global behavior of a structure (Fritzen 2006).
However, it has been found that they are not effective damage detection or
localization methods since modal properties only reflect the global state of the
structure. In an effort to localize and evaluate damage, it is common to locally
conduct Non-Destructive Evaluation (NDE) after the damage has been identified
(Chang and Liu 2003; Farrar and Worden 2007). Although NDE techniques are
useful in several applications, they each have their own limitations. For example,
some require a priori knowledge of the damage location and material properties
(Farrar and Worden 2007). Therefore, there is a need to establish damage detection
methodologies that effectively identify damage both globally and locally, yet not
fundamentally depend on a priori knowledge of the damage location or the structural
material properties.
This paper primarily presents a comparison of the traditional and advanced
sensing techniques in the SHM field. The accuracy of the sensing method is evaluated
through standard laboratory tests on concrete cylinders. Furthermore, a damage
detection method for reinforced concrete (RC) structures is introduced where strains
measured from densely clustered sensors are used to develop damage sensitive
features. This method is verified through simulation data from a Fiber Element (FE)
model of a new earthquake resistant reinforced concrete coupled shear wall system.
A large scale specimen of this system with a dense network of embedded strain
gauges, displacement and rotation transducers, as well as Digital Image Correlation
systems was recently tested. The data collected through this experiment will be used
to experimentally validate the proposed damage detection method.
DIGITAL IMAGE CORRELATION
Digital Image Correlation (DIC) is a novel non-contact sensing technology
that measures surface displacements by comparing a series of images of the deformed
structure to a reference image. First, a reference photo is taken to serve as a baseline
and is divided into subsets called facets, which each has unique pixel identities based
on the gray level intensity. The displacement field is determined from comparing
deformed images to the reference image.
DIC is a particular area of interest in SHM field because it has the capability
to compare current surface geometry, displacement, and strain measurements to
baseline measurements made several months or years prior (Nonis et al 2013). DIC
requires only cameras and a calibration object and no sensors must be affixed to the
specimen or wired to a data acquisition system. As a result, data collection is much
quicker and easier. Additionally, DIC is beneficial for field monitoring because it

requires no contact. Therefore, displacements and strain measurements can be
accurately measured from a remote distance if a structure is hard to reach (although
there are restrictions in application of DIC in terms of maximum distance and
cameras‟ field of view).
SMALL SCALE COMPARISON AND VERIFICATION TESTS
Prior to the large scale testing of the coupled shear wall, a series of small
scale experiments on concrete cylinders were performed in order to estimate the 28-
day stiffness of the concrete from each pour used in the test specimen and to develop
procedures for collecting and analyzing DIC data. Displacements measured by DIC
were also used to calculate strains in the cylinders throughout testing. These DIC
strains were compared to estimated strains determined from the applied load and the
ACI approximate equation for the modulus of elasticity of concrete.
All 28-day stiffness tests were performed on concrete cylinders 4 inches
(101.6 mm) in diameter and 8 inches (203.2 mm) high. The SATEC Machine located
at Lehigh University„s ATLSS Center executed a uniaxial compressive strength test
(ASTM C39/C39M − 12a). Throughout the compression test, the SATEC Machine‟s
data acquisition system recorded the displacement of the machine„s head and the
corresponding applied load. Photos were taken using the ARAMIS-2M DIC system
every 5,000 lbf until 60,000 lbf, 2,000 lbf until 70,000 lbf, and then every 1,000 lbf
until failure. Whenever a photo was taken with the DIC, the SATEC Machine was
paused and the corresponding displacement of the head and load were recorded. The
experimental set-up is pictured in Figure 1.
Figure 1: Set-up of the uniaxial compression test on the concrete cylinder
After failure, the images were analyzed in the ARAMIS software v6.0.1.2. The
measurement quantity of interest was the axial displacement in order to calculate the
strain in the cylinder in this direction. The axial strain due to compressive loading
was then calculated as the difference between the average axial displacements of two
section cuts made in ARAMIS image divided by the distance between them. These
SATEC Machine
DIC Cameras
Stochastic
Pattern
Additional
Lighting
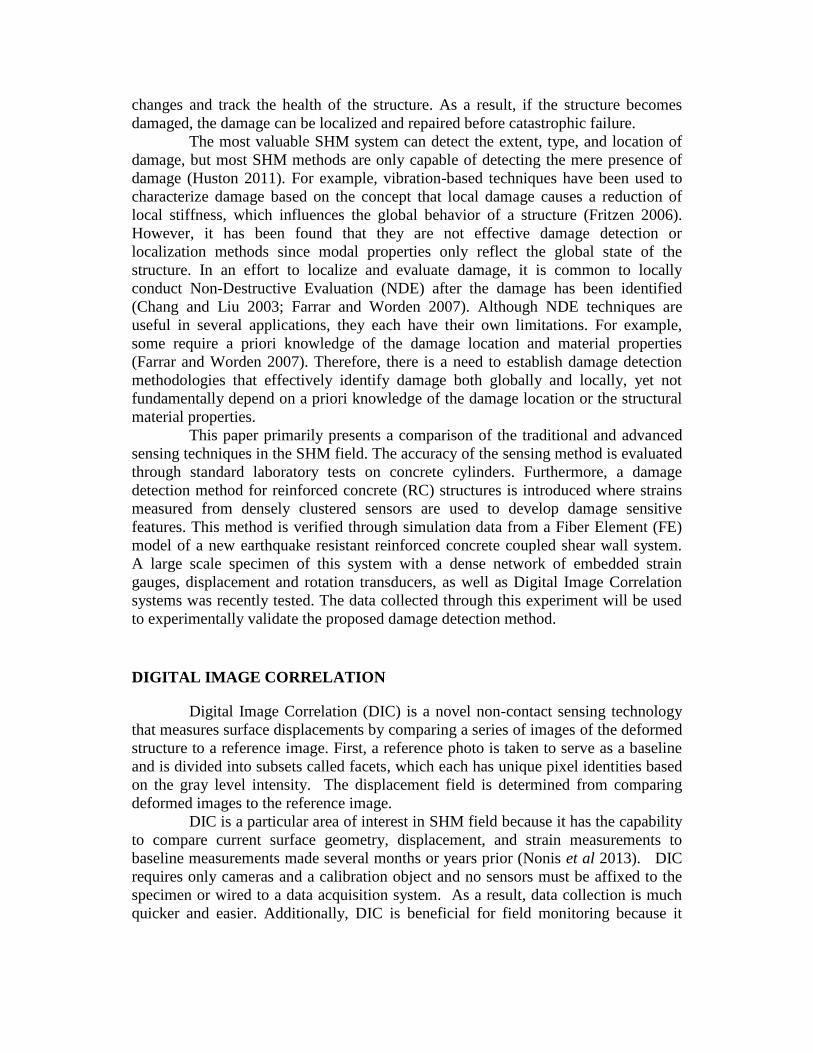
two sections are shown in Figure 2a and b as the horizontal lines 1.5 inches (38.1mm)
above and below the centerline for one of the twelve cylinders tested.
The SATEC strain was calculated at each stage assuming that the concrete
behaves linearly throughout the test. This strain uses the recorded SATEC load, the
estimated modulus of elasticity of concrete from ACI determined from the concrete‟s
compressive strength, and the cross sectional area of the cylinder. In Figure 2c the
SATEC strains are plotted with the DIC strains in order to compare the DIC
measurements to an accepted approximation for linear strain in concrete. This figure
shows that both curves are very similar with a maximum deviation of 89.98
microstrain.
(a) (b) (c)
Figure 2: Results of axial compression test: (a) Axial displacement at Stage 0
(reference stage, zero load) and (b) Stage 29 (failure stage), (c) resulting stress-
strain curve
In order to verify that DIC is an accurate alternative to traditional sensors,
two 350 ohm strain gauges (SG1 and SG2) were installed on the cylinder 180 degrees
from each other as shown in Figure 3a to collect the longitudinal strain in the cylinder
throughout the compression test. Simultaneously, the SATEC Machine‟s data
acquisition system recorded the displacement of the machine„s head and the
corresponding applied load and photos were taken using the ARAMIS-2M DIC
system in the same manner previously described.
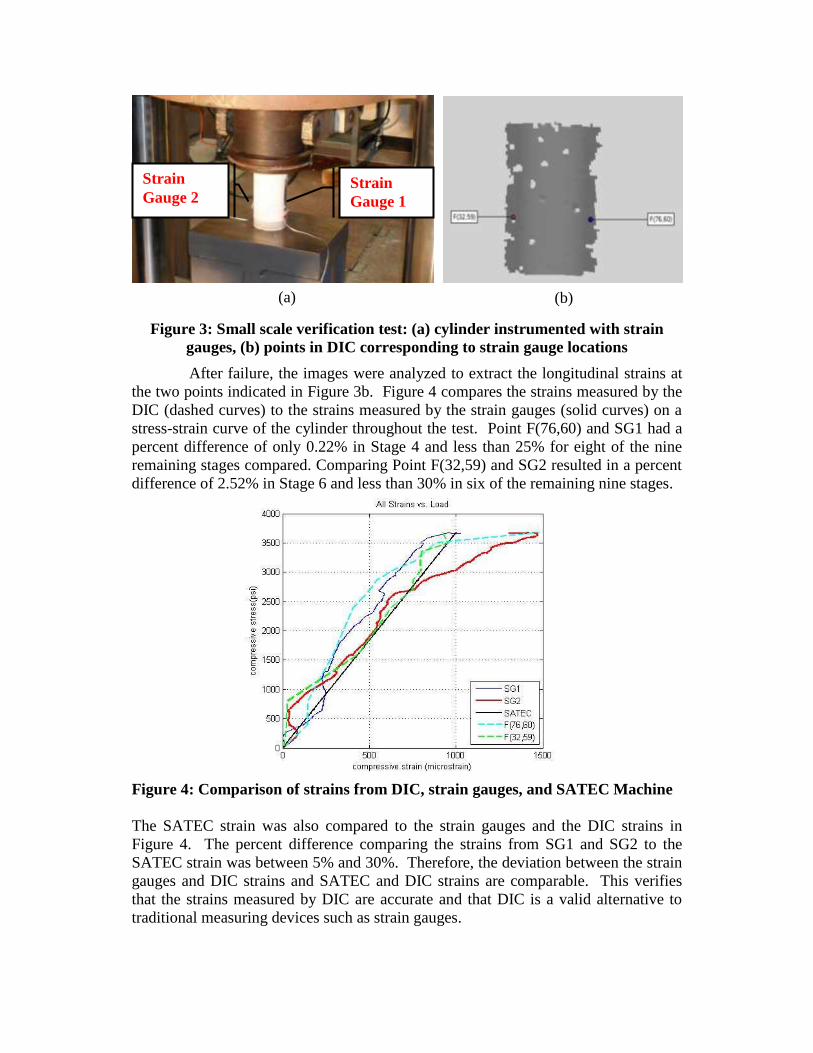
Figure 3: Small scale verification test: (a) cylinder instrumented with strain
gauges, (b) points in DIC corresponding to strain gauge locations
After failure, the images were analyzed to extract the longitudinal strains at
the two points indicated in Figure 3b. Figure 4 compares the strains measured by the
DIC (dashed curves) to the strains measured by the strain gauges (solid curves) on a
stress-strain curve of the cylinder throughout the test. Point F(76,60) and SG1 had a
percent difference of only 0.22% in Stage 4 and less than 25% for eight of the nine
remaining stages compared. Comparing Point F(32,59) and SG2 resulted in a percent
difference of 2.52% in Stage 6 and less than 30% in six of the remaining nine stages.
Figure 4: Comparison of strains from DIC, strain gauges, and SATEC Machine
The SATEC strain was also compared to the strain gauges and the DIC strains in
Figure 4. The percent difference comparing the strains from SG1 and SG2 to the
SATEC strain was between 5% and 30%. Therefore, the deviation between the strain
gauges and DIC strains and SATEC and DIC strains are comparable. This verifies
that the strains measured by DIC are accurate and that DIC is a valid alternative to
traditional measuring devices such as strain gauges.
Strain
Gauge 1
Strain
Gauge 2
(a) (b)

IMPLEMENTATION OF DENSE SENSOR NETWORKS ON LARGE SCALE
TEST SPECIMEN
In order to obtain rich dataset for damage detection and localization, it is
important to establish advanced sensing techniques that utilize dense networks of
sensors. It is possible to create a dense sensor network by installing traditional sensors
such as strain gauges throughout a structure, or by employing more recent
technologies such as DIC. This section describes an instrumentation plan developed
for a large scale test specimen of a concrete coupled shear wall system. In order to
develop this plan, results from the simulation were used to optimize sensor placement
by placing the strain gauges where the largest stresses and most damages were
expected to occur. These locations include along the wall pier base, at the beam-wall
interface at each story, and along the coupling beams as indicated in Figure 5.
Figure 5: Implementation of strain gauges in shear wall specimen
In order to collect spatially dense data at the location of predicted damage,
DIC sensors are used in two- and three-dimensional settings. Each 2D DIC setup
utilizes one camera and is best at collecting data on an object with little or no out-of-
plane movement. For this reason, 2D setups are used for the wall pier bases, the top
of the 1st story slab, and the top of the 3rd story slab. A schematic for the 2D set-ups
for the wall pier bases is shown in Figure 6a. 3D setups utilizing two cameras each
are necessary to view the bottom of the beam and slab on the 1st and 3rd stories
because significant out-of-plane movement is expected. A schematic for the 3D setup
to capture data from the 1st story beam and slab is shown in Figure 6b. Details on the
implementation of multiple DIC systems for the nearly full-field monitoring of this
structure are discussed in McGinnis et al 2014. In summary, a total of 14 DIC

sensors -three 3D and eleven 2D setups- capture data from over 200 square feet of the
structure in addition to over 200 embedded strain gauges.
(a) (b)
Figure 6: Schematics of DIC setup for experimental testing: (a) 2D and (b) 3D
DAMAGE DETECTION IN REINFORCED CONCRETE STRUCTURES
Damage features, or damage indices, are coefficients that are influenced by
changes in the structural response. Establishing damage indices from measured
responses makes it possible to condense large amounts of data into more meaningful
information regarding the health of the structure. This section describes a
methodology proposed to extract damage sensitive features from strain measurement
in RC structures. As this damage detection method is data-driven, damage features
are generated based on the measured data, and this removes the need for a calibrated
computer simulation of the structure in future applications of this method.
Additionally, this technique is helpful in identifying damage modes/locations where
the information provided by the instrumentation would not directly lead to such
realizations; for example, cracking and crushing of the concrete cover or core of a
beam can be identified based on the data measured by the strain gauges attached to
the rebars.
The proposed method uses damage indices to determine an instantaneous linear
relationship between the change in strain of sensor locations i and j on a structure.
Two damage coefficients are introduced below.
The first damage index is the regression coefficient, α, which results from
linear regression between two sensors i and j. It is calculated by the following
equation where the change in strain at time t in location j is .
(1)
As in this modeling and laboratory experiment the base shear is known, the
normalized regression coefficient, β , is also introduced for this implementation in
order to demonstrate that valuable information in regards to the health of the structure
exists in the data. This damage index is established from the observation that the
slope between the regression coefficient and base shear s steps apart changes at the
onset of damage when the regression coefficient α is plotted against the base shear,

Vb, as shown in Equation 2. Step size of one proved to be effective in this application.
| |
| | (2)
Assuming that the structural responses of two neighbor sensors are highly
correlated and that damage changes the structural response, the relationship between
the two locations will change if damage occurs. Therefore discontinuities or peaks in
the damage indices signify a change in this relationship, i.e. possible damage,
between the sensors compared by the damage index. An effective damage index
exhibits these peaks at the step associated with a material damage mode.
Generally, damage in an element causes an increase in the rate of change of
the strain. The initial elastic modulus of steel or concrete is the steepest. After
yielding, spalling, or crushing, the modulus decreases and slope of the stress-strain
curve becomes flatter; thus there is a larger change in strain for the same change in
stress. Consequently, α will increase if the damaged element is used as sensor j and
will decrease if it is used as sensor i in Equation 1. Therefore, the rate of the change
in strain measured at different locations signifies the occurrence and location of the
structural damage. β indices are used here to further investigate the change in α, since
β will show a positive or negative peak respectively when α increases or decreases.
NEES COUPLED SHEAR WALL
The NEES Coupled Shear Wall being studied at Lehigh University„s
Advanced Technology for Large Structural Systems Center (ATLSS) in conjunction
with The University of Notre Dame and The University of Texas at Tyler proposes a
novel lateral load resisting system as a superior alternative to conventional diagonally
reinforced coupling beams. This structure is used as a test-bed for the development
and implementation of damage detection methods for reinforced concrete structures. Previous experiments and FE models of similar shear wall systems (Kurama et
al 2004, 2006, 2011; Weldon and Kurama 2010) led to the development of the key
features of this specimen. The specimen is a shear wall core composed of 2 C-shaped
walls linked at each floor level by post-tensioned (PT) coupling beams with debonded
reinforcement that extends into the wall pier. The debonded reinforcement, or energy
dissipating (ED) steel bars, are not bonded to the coupling beam over a predetermined
length at the beam ends. This intended lack of bond delays low cycle fatigue fracture
of rebars, also results in concentration of cracks at beam ends where crack initiators
are located to control the location of the damage in the beam. Additionally, the PT
creates a diagonal compression strut along the span of the beam, which eliminates the
distributed cracks at the mid-span; a damage mode that is commonly seen in
conventional diagonally reinforced coupling beams. Overall, the damage modes
expected to occur in this structure include the spalling and crushing of the concrete at
the ends of the coupling beams and the yielding of the ED steel.
A DRAIN-2DX FE model was previously developed by The University of
Notre Dame and is used for validation of the proposed damage detection methods.
The model consists of 8 stories of the coupled shear wall system under static
monotonic displacement controlled loading to about 3% roof drift. Each material
uses a multi-linear idealization to consider nonlinear properties of the materials.
These multi-linear stress-strain curves define the possible damage modes experienced
in the model and the strains at which each damage mode initiates. Since the ideal
behavior of the system concentrates damage to the coupling beams, the damage
modes that are considered in this study include yielding of the ED reinforcement in
tension and spalling and crushing of the concrete in compression at the beam ends.
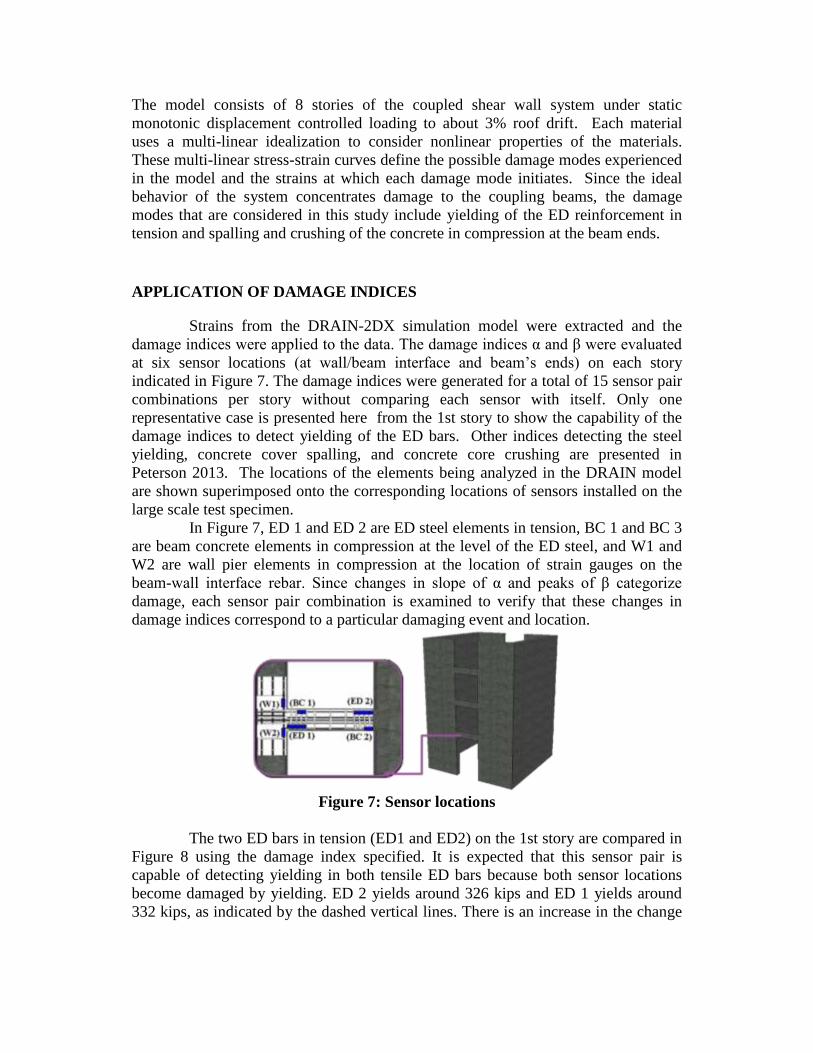
APPLICATION OF DAMAGE INDICES
Strains from the DRAIN-2DX simulation model were extracted and the
damage indices were applied to the data. The damage indices α and β were evaluated
at six sensor locations (at wall/beam interface and beam‟s ends) on each story
indicated in Figure 7. The damage indices were generated for a total of 15 sensor pair
combinations per story without comparing each sensor with itself. Only one
representative case is presented here from the 1st story to show the capability of the
damage indices to detect yielding of the ED bars. Other indices detecting the steel
yielding, concrete cover spalling, and concrete core crushing are presented in
Peterson 2013. The locations of the elements being analyzed in the DRAIN model
are shown superimposed onto the corresponding locations of sensors installed on the
large scale test specimen.
In Figure 7, ED 1 and ED 2 are ED steel elements in tension, BC 1 and BC 3
are beam concrete elements in compression at the level of the ED steel, and W1 and
W2 are wall pier elements in compression at the location of strain gauges on the
beam-wall interface rebar. Since changes in slope of α and peaks of β categorize
damage, each sensor pair combination is examined to verify that these changes in
damage indices correspond to a particular damaging event and location.
Figure 7: Sensor locations
The two ED bars in tension (ED1 and ED2) on the 1st story are compared in
Figure 8 using the damage index specified. It is expected that this sensor pair is
capable of detecting yielding in both tensile ED bars because both sensor locations
become damaged by yielding. ED 2 yields around 326 kips and ED 1 yields around
332 kips, as indicated by the dashed vertical lines. There is an increase in the change
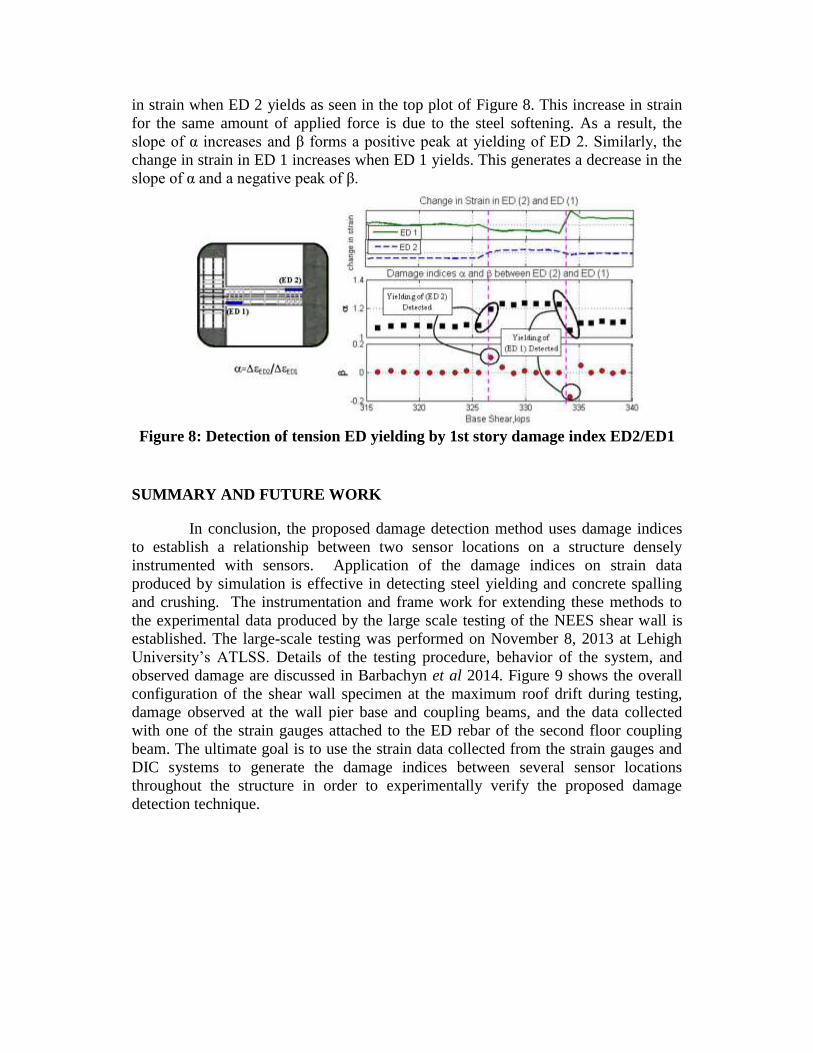
in strain when ED 2 yields as seen in the top plot of Figure 8. This increase in strain
for the same amount of applied force is due to the steel softening. As a result, the
slope of α increases and β forms a positive peak at yielding of ED 2. Similarly, the
change in strain in ED 1 increases when ED 1 yields. This generates a decrease in the
slope of α and a negative peak of β.
Figure 8: Detection of tension ED yielding by 1st story damage index ED2/ED1
SUMMARY AND FUTURE WORK
In conclusion, the proposed damage detection method uses damage indices
to establish a relationship between two sensor locations on a structure densely
instrumented with sensors. Application of the damage indices on strain data
produced by simulation is effective in detecting steel yielding and concrete spalling
and crushing. The instrumentation and frame work for extending these methods to
the experimental data produced by the large scale testing of the NEES shear wall is
established. The large-scale testing was performed on November 8, 2013 at Lehigh
University‟s ATLSS. Details of the testing procedure, behavior of the system, and
observed damage are discussed in Barbachyn et al 2014. Figure 9 shows the overall
configuration of the shear wall specimen at the maximum roof drift during testing,
damage observed at the wall pier base and coupling beams, and the data collected
with one of the strain gauges attached to the ED rebar of the second floor coupling
beam. The ultimate goal is to use the strain data collected from the strain gauges and
DIC systems to generate the damage indices between several sensor locations
throughout the structure in order to experimentally verify the proposed damage
detection technique.
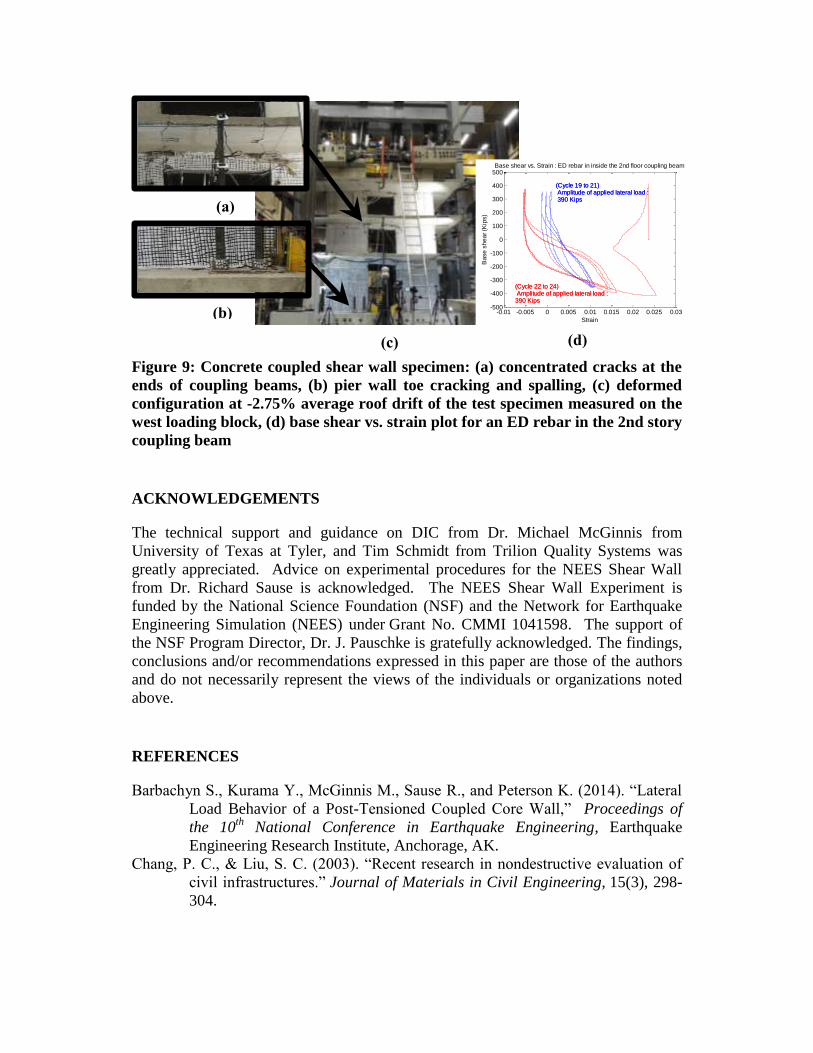
Figure 9: Concrete coupled shear wall specimen: (a) concentrated cracks at the
ends of coupling beams, (b) pier wall toe cracking and spalling, (c) deformed
configuration at -2.75% average roof drift of the test specimen measured on the
west loading block, (d) base shear vs. strain plot for an ED rebar in the 2nd story
coupling beam
ACKNOWLEDGEMENTS
The technical support and guidance on DIC from Dr. Michael McGinnis from
University of Texas at Tyler, and Tim Schmidt from Trilion Quality Systems was
greatly appreciated. Advice on experimental procedures for the NEES Shear Wall
from Dr. Richard Sause is acknowledged. The NEES Shear Wall Experiment is
funded by the National Science Foundation (NSF) and the Network for Earthquake
Engineering Simulation (NEES) under Grant No. CMMI 1041598. The support of
the NSF Program Director, Dr. J. Pauschke is gratefully acknowledged. The findings,
conclusions and/or recommendations expressed in this paper are those of the authors
and do not necessarily represent the views of the individuals or organizations noted
above.
REFERENCES
Barbachyn S., Kurama Y., McGinnis M., Sause R., and Peterson K. (2014). “Lateral
Load Behavior of a Post-Tensioned Coupled Core Wall,” Proceedings of
the 10th
National Conference in Earthquake Engineering, Earthquake
Engineering Research Institute, Anchorage, AK.
Chang, P. C., & Liu, S. C. (2003). “Recent research in nondestructive evaluation of
civil infrastructures.” Journal of Materials in Civil Engineering, 15(3), 298-
304.
(d) (c)
(b)
(a)
-0.01 -0.005 0 0.005 0.01 0.015 0.02 0.025 0.03-500
-400
-300
-200
-100
0
100
200
300
400
500
Strain
Ba
se
sh
ea
r (K
ips)
Base shear vs. Strain : ED rebar in inside the 2nd floor coupling beam
(Cycle 22 to 24) Amplitude of applied lateral load : 390 Kips
(Cycle 19 to 21) Amplitude of applied lateral load : 390 Kips
(Cycle 22 to 24) Amplitude of applied lateral load : 390 Kips
(Cycle 19 to 21) Amplitude of applied lateral load : 390 Kips

Farrar, C.R. and Worden, K. (2007). “An Introduction to Structural Health
Monitoring.” Phil.Trans. R. Soc. A (2007), 365:303-315.
Huston, D. (2011). Structural Sensing, Health Monitoring, and Performance
Evaluation. Taylor & Francis, Boca Raton, Florida.
Lynch, J.P. and Loh, K.J. (2006). “A Summary Review of Wireless Sensors and
Sensor Networks for Structural Health Monitoring.” The Shock and
Vibration Digest (2006), 38: 91- 128.
Kurama, Y. C., and McGinnis, M. J. (2011). "NEESR-CR: Post-Tensioned Coupled
Shear Wall Systems." 2011 NSF Engineering Research and Innovation
Conference.
Kurama, Y. C., and Shen, Q. (2004). "Posttensioned Hybrid Coupled Walls under
Lateral Loads." Journal of Structural Engineering, 130(2), 297-309.
Kurama, Y. C., Weldon, B. D., and Shen, Q. (2006). "Experimental Evaluation of
Posttensioned Hybrid Coupled Wall Subassemblages." Journal of Structural
Engineering, 132(7), 1017-1029.
McGinnis, M.J., Barbachyn, S., Kurama, Y.C. (2014). “Application of Multiple
Digital Image Correlation Sensors in Earthquake Engineering,” Proceedings
of the 10th National Conference in Earthquake Engineering, Earthquake
Engineering Research Institute, Anchorage, AK.
Nonis, C., Niezrecki, C., Yu, Tzu-Yang, Ahmed, S., Su, Che-Fu, (2013). “Structural
Health Monitoring of Bridges using Digital Image Correlation.” Health
Monitoring of Structural and Biological Systems 2013. SPIE Vol.
8695,869507.
Peterson, K. A. (2013). “Damage Detection in RC Earthquake Systems Using Dense
Sensor Networks,” Lehigh University, Proquest, UMI Dissertations
Publishing, 2013. Weldon, B. D., and Kurama, Y. C. (2010). "Experimental Evaluation of Posttensioned
Precast Concrete Coupling Beams." Journal of Structural Engineering, 136(9),
1066-1077.

![Detection of Urban Damage Using Remote Sensing and …As early as 1998, object-based image analysis (OBIA) has been used to detect earthquake damage from remote sensing [9]. More recently,](https://static.fdocuments.in/doc/165x107/5e83254667b2fd44422a3055/detection-of-urban-damage-using-remote-sensing-and-as-early-as-1998-object-based.jpg)