Advanced Queries 1 2 · 339 Advanced Queries 1 2 • left outer join • make table query • outer...
50
339 Advanced Queries 12 • left outer join • make table query • outer join • right outer join • SELECT statement • subquery • unequal join • update query KEY TERMS • action query • aggregate function • append query • calculated field • cross join • crosstab query • delete query • inner join • join LESSON SKILL MATRIX Skill Exam Objective Objective Number Creating Crosstab Queries Create crosstab queries 3.1.2 Creating a Subquery Add new fields Remove fields Add conditional logic Use comparison operators 3.2.2 3.2.3 3.3.2 3.3.4 Saving a Filter as a Query Creating Action Queries Create action queries 3.1.4 Understanding Advanced Query Modifi- cation Create multi-table queries Add calculated fields Use basic operators Format fields within queries Group and summarize data 3.1.5 3.3.1 3.3.5 3.2.6 3.3.3 © GgWink/iStockphoto
Transcript of Advanced Queries 1 2 · 339 Advanced Queries 1 2 • left outer join • make table query • outer...

339
Advanced Queries
12
• left outer join
• make table query
• outer join
• right outer join
• SELECT statement
• subquery
• unequal join
• update query
KEY TERMS
• action query
• aggregate function
• append query
• calculated fi eld
• cross join
• crosstab query
• delete query
• inner join
• join
LESSON SKILL MATRIX
Skill Exam Objective Objective Number
Creating Crosstab Queries Create crosstab queries 3.1.2
Creating a Subquery Add new fi elds
Remove fi elds
Add conditional logic
Use comparison operators
3.2.2
3.2.3
3.3.2
3.3.4
Saving a Filter as a Query
Creating Action Queries Create action queries 3.1.4
Understanding Advanced Query Modifi -
cation
Create multi-table queries
Add calculated fi elds
Use basic operators
Format fi elds within queries
Group and summarize data
3.1.5
3.3.1
3.3.5
3.2.6
3.3.3
© G
gWin
k/i
Sto
ckp
hot
o

Lesson 12340
World Wide Importers is a car dealership that specializes in imported
luxury cars. The company has recently opened a used car division
that sells vehicles acquired in trade and expands the buyer’s pur-
chasing options. As the offi ce manager for the new division, you
have started using Access to track inventory and sales. In this les-
son, you learn how to create an action query, a crosstab query, and
a subquery and how to save fi lters as a query. You also learn how to
create joins, include calculated fi elds in a query, and create aggre-
gated queries.
© GgWink/iStockphoto
CREATING CROSSTAB QUERIES
Queries are powerful tools that can be used to retrieve exactly the data you need from your data-base, showing only the relevant records. Depending on the information you want to display, these advanced queries can help refi ne the results of your search or perform the actions you want. A crosstab query calculates a sum, average, count, or other type of total on records and then groups the results by two types of information: one down the left side of the datasheet and the other across the top. When you summarize data using a crosstab query, you select values from specifi ed fi elds or expressions as column headings so you can view data in a more compact format than with a select query.
In Lesson 7, you learned how to create and modify several types of queries.
Creating Crosstab Queries
A crosstab query is a special type of query that displays its results in a grid similar to an Excel worksheet. Crosstab queries summarize your values and then group them by two sets of facts—a set of row headers down the side and a set of column headers across the top. A crosstab query typ-ically includes data from more than one table and always includes three types of data: the data used as row headings, the data used as column headings, and the values that you want to sum or otherwise compute. A crosstab query does not always populate all the fi elds in the result set be-cause the tables that you use in the query do not always contain values for every possible data point. In this exercise, you create a crosstab query.
The easiest way to create a crosstab query is to use the Crosstab Query Wizard. To run a crosstab query, double-click it in the Navigation Pane or click it and then press Enter. When you run a crosstab query, the results are displayed in Datasheet view.
STEP BY STEP Create Crosstab Queries
GET READY. Before you begin these steps, be sure to LAUNCH Microsoft Access.
1. OPEN the Importers database from the data fi les for this lesson.
2. SAVE the database as ImportersXXX (where XXX is your initials).
3. On the CREATE tab, in the Queries group, click the Query Wizard button to display the
New Query dialog box, shown in Figure 12-1.
The Bottom Line
Cross Ref

Advanced Queries 341
4. Click Crosstab Query Wizard and click OK to display the Crosstab Query Wizard, shown
in Figure 12-2.
Figure 12-1
New Query dialog box
Figure 12-2
Crosstab Query Wizard, fi rst screen
5. Click Table: Used Cars Sold and then click Next . to display the next screen, shown in
Figure 12-3.
Lesson 12342
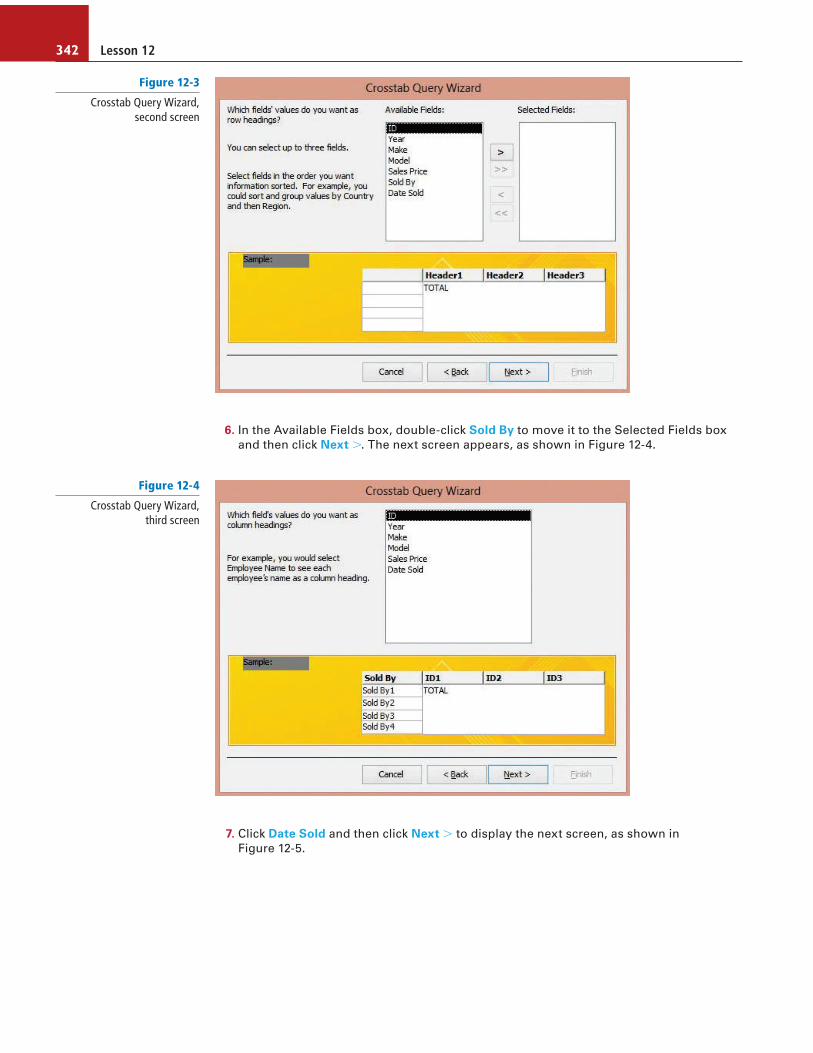
6. In the Available Fields box, double-click Sold By to move it to the Selected Fields box
and then click Next . . The next screen appears, as shown in Figure 12-4.
Figure 12-3
Crosstab Query Wizard, second screen
Figure 12-4
Crosstab Query Wizard, third screen
7. Click Date Sold and then click Next . to display the next screen, as shown in
Figure 12-5.

Advanced Queries 343
8. Click Month and then click Next . to display the next screen, as shown in Figure 12-6.
Figure 12-5
Crosstab Query Wizard, fourth screen
Figure 12-6
Crosstab Query Wizard, fi fth screen
9. In the Fields box, click Sales Price, and in the Functions box, click Sum. Click Next . to
display the fi nal screen, as shown in Figure 12-7.
Lesson 12344
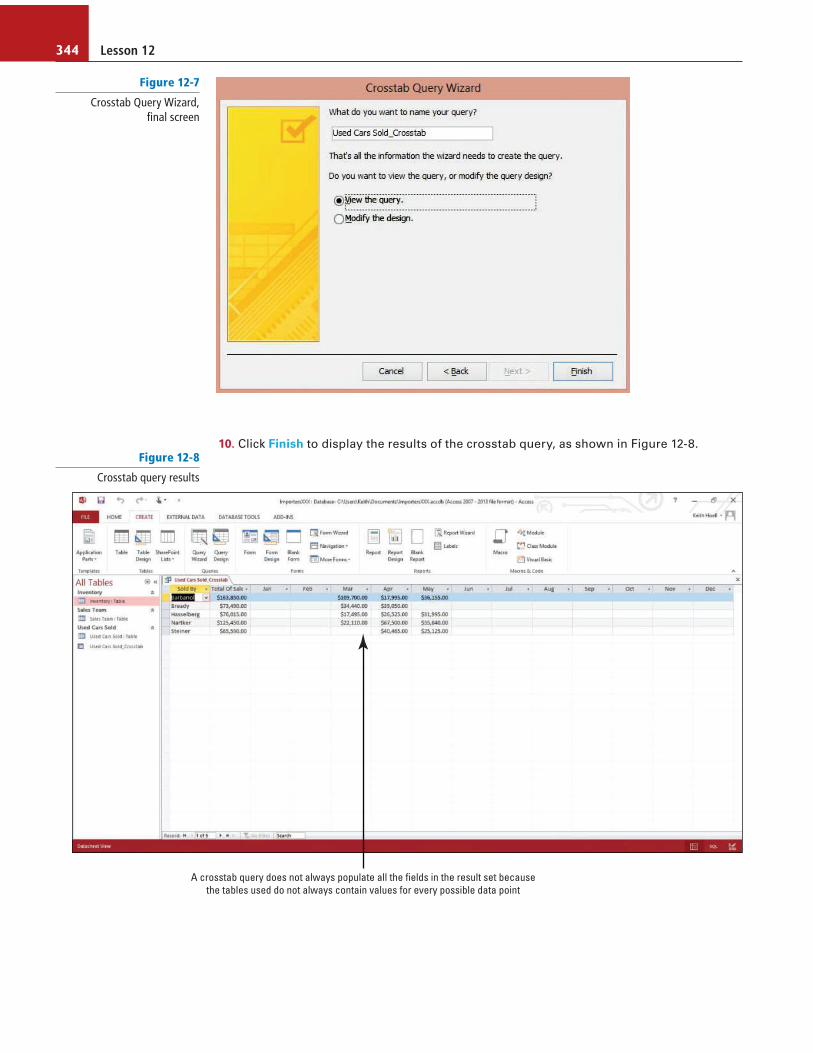
10. Click Finish to display the results of the crosstab query, as shown in Figure 12-8.
Figure 12-7
Crosstab Query Wizard, fi nal screen
Figure 12-8
Crosstab query results
A crosstab query does not always populate all the fields in the result set because
the tables used do not always contain values for every possible data point
Advanced Queries 345
11. Click the Close button to close the Used Cars Sold_Crosstab query.
PAUSE. LEAVE the database open to use in the next exercise.
CREATING A SUBQUERY
You can use a subquery to limit the amount of data returned by a query. A subquery is a SELECT statement that is inside another select or action query. A SELECT statement is a Structured Que-ry Language (SQL) command that instructs the Microsoft Access database engine to return infor-mation from the database as a set of records. This type of statement invokes conditional logic using expressions that evaluate to true or false; if true, Access returns a result that meets the condition that you have specifi ed; if false, Access can return a different result depending on what you’ve specifi ed. For example, you can use a conditional expression to create a new fi eld that displays an adjusted salary with a 3% bonus for all employees who had annual sales revenue of $50,000 or more and display a message like “Not Bonus Eligible” for everyone else. The data that appears after the expression is evaluated can be communicated on reports to provide useful information to employees who make decisions in your organization.
At a minimum, the syntax for a SELECT statement is:
SELECT fi elds FROM table
An asterisk (*) can be used to select all the fi elds in a table. The following example selects all the fi elds in the Inventory table:
SELECT * FROM Inventory
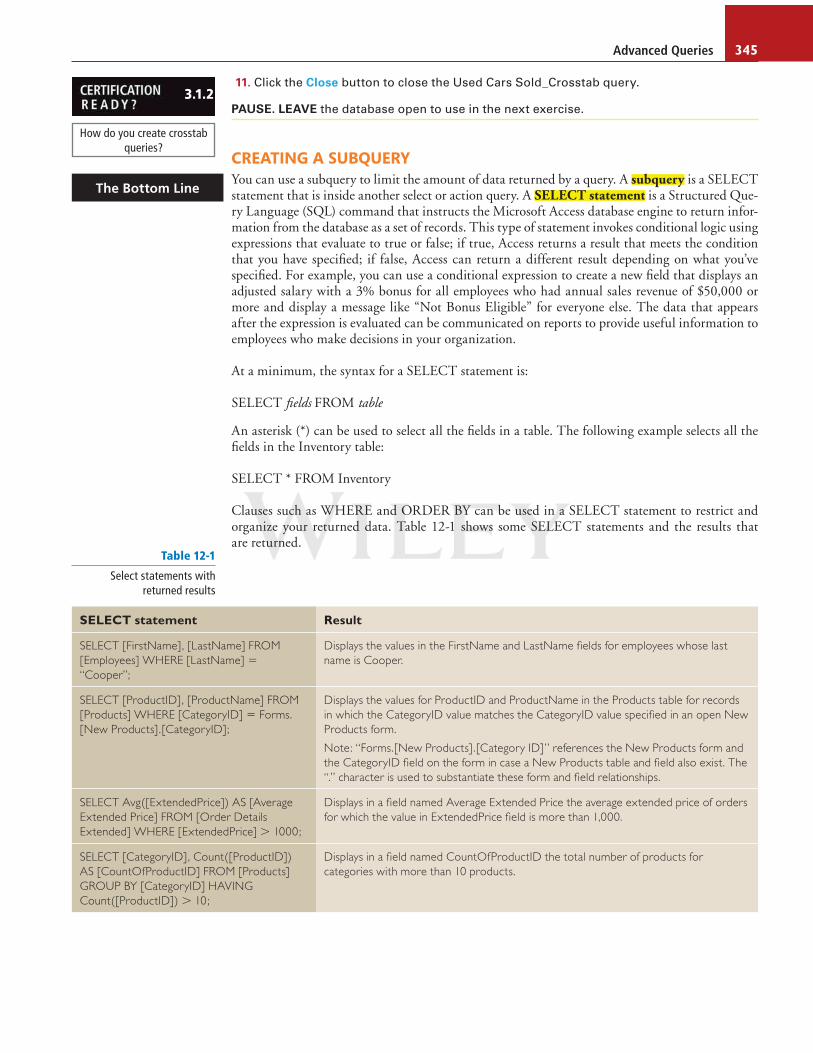
Clauses such as WHERE and ORDER BY can be used in a SELECT statement to restrict and organize your returned data. Table 12-1 shows some SELECT statements and the results that are returned.
How do you create crosstab queries?
3.1.2
The Bottom Line
SELECT statement Result
SELECT [FirstName], [LastName] FROM
[Employees] WHERE [LastName] 5
“Cooper”;
Displays the values in the FirstName and LastName fi elds for employees whose last
name is Cooper.
SELECT [ProductID], [ProductName] FROM
[Products] WHERE [CategoryID] 5 Forms.
[New Products].[CategoryID];
Displays the values for ProductID and ProductName in the Products table for records
in which the CategoryID value matches the CategoryID value specifi ed in an open New
Products form.
Note: “Forms.[New Products].[Category ID]” references the New Products form and
the CategoryID fi eld on the form in case a New Products table and fi eld also exist. The
“.” character is used to substantiate these form and fi eld relationships.
SELECT Avg([ExtendedPrice]) AS [Average
Extended Price] FROM [Order Details
Extended] WHERE [ExtendedPrice] . 1000;
Displays in a fi eld named Average Extended Price the average extended price of orders
for which the value in ExtendedPrice fi eld is more than 1,000.
SELECT [CategoryID], Count([ProductID])
AS [CountOfProductID] FROM [Products]
GROUP BY [CategoryID] HAVING
Count([ProductID]) . 10;
Displays in a fi eld named CountOfProductID the total number of products for
categories with more than 10 products.
Table 12-1
Select statements with returned results

Lesson 12346
A SELECT statement can be entered in a fi eld or criteria cell in Design view. If you need more space in which to enter the SELECT statement in a fi eld or criteria cell, press Shift 1 F2 and enter the statement in the Zoom box. You can see the entire SQL statement by switching to SQL view.
In a subquery, you use a SELECT statement to provide a set of one or more specifi c values to eval-uate in the WHERE or HAVING clause expression. A subquery has three parts:
• C omparison: A n expression and a comparison operator that compares the expression with the results of the subquery
• E xpression: A n expression for which the result set of the subquery is searched
• S qlstatement: A SELECT statement, following the same format and rules as any other SELECT statement. It must be enclosed in parentheses .
Creating a Subquery
In this exercise, you create a subquery that returns only the records from the Inventory table whose asking price is equal to or greater than the average asking price. You also add, remove, and reposi-tion fi elds while working within the query design grid.
Subqueries are created in Design view. Using the Show Table dialog box, you fi rst need to select the table that contains the desired information. This will add the table window, which contains the table’s fi eld list, to Design view. You can then easily add fi elds from the table window to the design grid at the bottom of the screen by either double-clicking the fi eld name or by clicking and dragging the fi eld to the query design grid. You can remove fi elds from the query design grid by moving the mouse pointer above the fi eld name you want to remove until the pointer changes to a bold down arrow, clicking, and then pressing Delete on the keyboard, or by clicking the Delete Columns button in the Query Setup group on the DESIGN tab. You can rearrange fi elds on the grid by moving the mouse pointer above the fi eld you want to move until the pointer changes to a bold down arrow, then clicking and dragging the fi eld to any position on the grid using the vertical placeholder bar that appears as a guide.
STEP BY STEP Create a Subquery
USE the database that is open from the previous exercise.
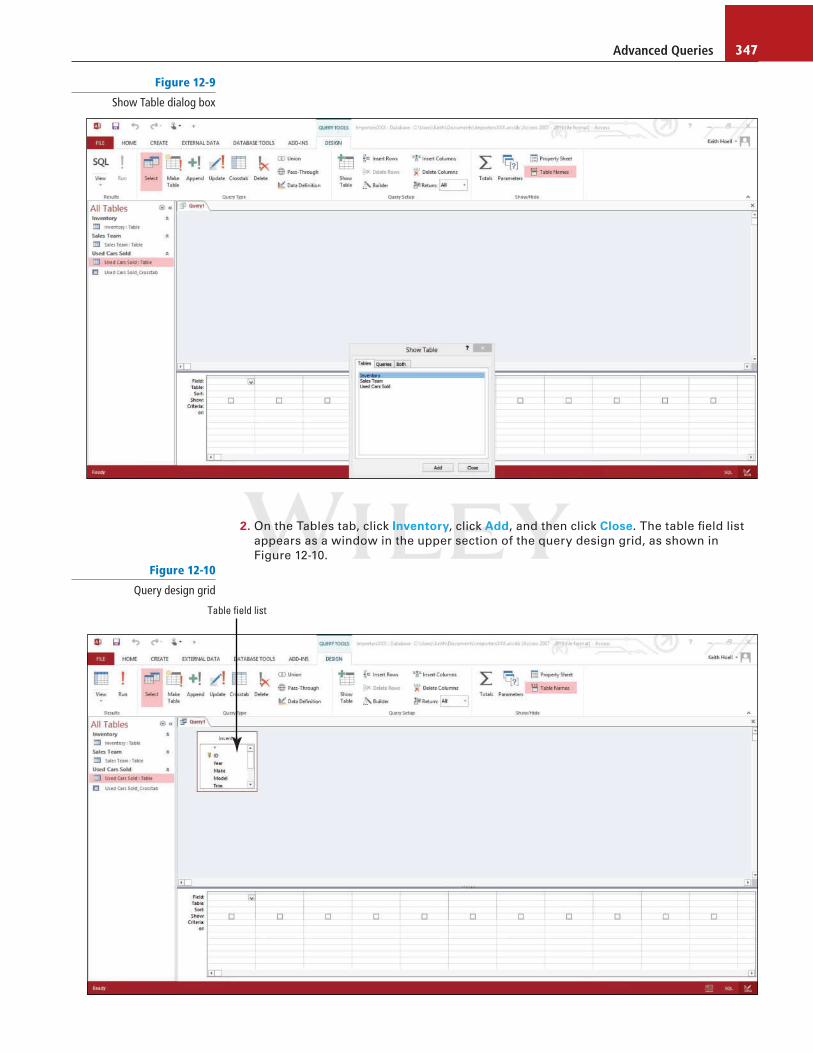
1. On the CREATE tab, in the Queries group, click Query Design. The query design grid opens,
and the Show Table dialog box appears, as shown in Figure 12-9.
Advanced Queries 347
2. On the Tables tab, click Inventory, click Add, and then click Close. The table fi eld list
appears as a window in the upper section of the query design grid, as shown in
Figure 12-10.
Figure 12-9
Show Table dialog box
Figure 12-10
Query design grid
Table field list

Lesson 12348
3. In the list of table fi elds, double-click Year , Make , Model , Trim , and AskingPrice to add
those fi elds to the design grid, as shown in Figure 12-11. Another WayTo quickly add all
the fi elds in a table, double-click the asterisk (*) at the top of the list of table fi elds.
Figure 12-11
Fields added to design grid
Double-click a field name to add it
to the query design grid below
4. Move the insertion point above the Trim fi eld on the design grid until it turns into a bold
down arrow. Click to select and highlight the Trim column, as shown in Figure 12-12.

Advanced Queries 349
5. [Press the Delete key] on the keyboard and the Trim column is deleted. The AskingPrice
fi eld moves to the left to replace the Trim column.
6. Move the insertion point above the Model fi eld on the design grid until it turns into a
bold down arrow. Click to select and highlight the Model column.
7. On the DESIGN tab, in the Query Setup group, click the Delete Columns button. The
Model column is deleted.
8. In the table fi eld list in the Inventory table window, double-click the Model fi eld to add
it back to the query design grid as the last column.
9. Move the insertion point above the Model fi eld on the design grid until it turns into a
bold down arrow. Click to select and highlight the Model column. Click and hold the
mouse button down and drag the Model fi eld to the left until the black vertical
placeholder bar is positioned between the Make and AskingPrice fi elds, then release
the mouse button. Your screen should resemble Figure 12-13.
Figure 12-12
Column highlighted on design grid
Column selected

Lesson 12350
10. Place the insertion point in the Criteria row of the AskingPrice fi eld and
[press Shift 1 F2 ] to display the Zoom dialog box.
The Zoom dialog box is used to create a larger workspace to help you focus on expressions and limit typing errors.
11. Key the following expression in the Zoom dialog box, as shown in Figure 12-14, to have
the query eventually return all car makes that have an asking price greater or equal to
the average asking price for all car makes:
. 5 (SELECT Avg(AskingPrice) FROM Inventory WHERE Make 5 Inventory.Make)
Take Note
Figure 12-13
Query design grid
Figure 12-14
Zoom dialog box with expression

Advanced Queries 351
Since you are already working inside the Inventory table, the reference in the expression to the Inventory table preceding the Make fi eld can be omitted and the expression can also be construct-ed as follows: . 5 (SELECT Avg(AskingPrice) FROM Inventory WHERE Make 5 Make)
12. Click OK to insert the expression in the Criteria row of the AskingPrice fi eld.
13. On the DESIGN tab, in the Results group, click the lower half of the View button and click
SQL View to see the entire expression, as shown in Figure 12-15.
Take Note
Figure 12-15
SQL View
Subquery WHERE clause in SQL View
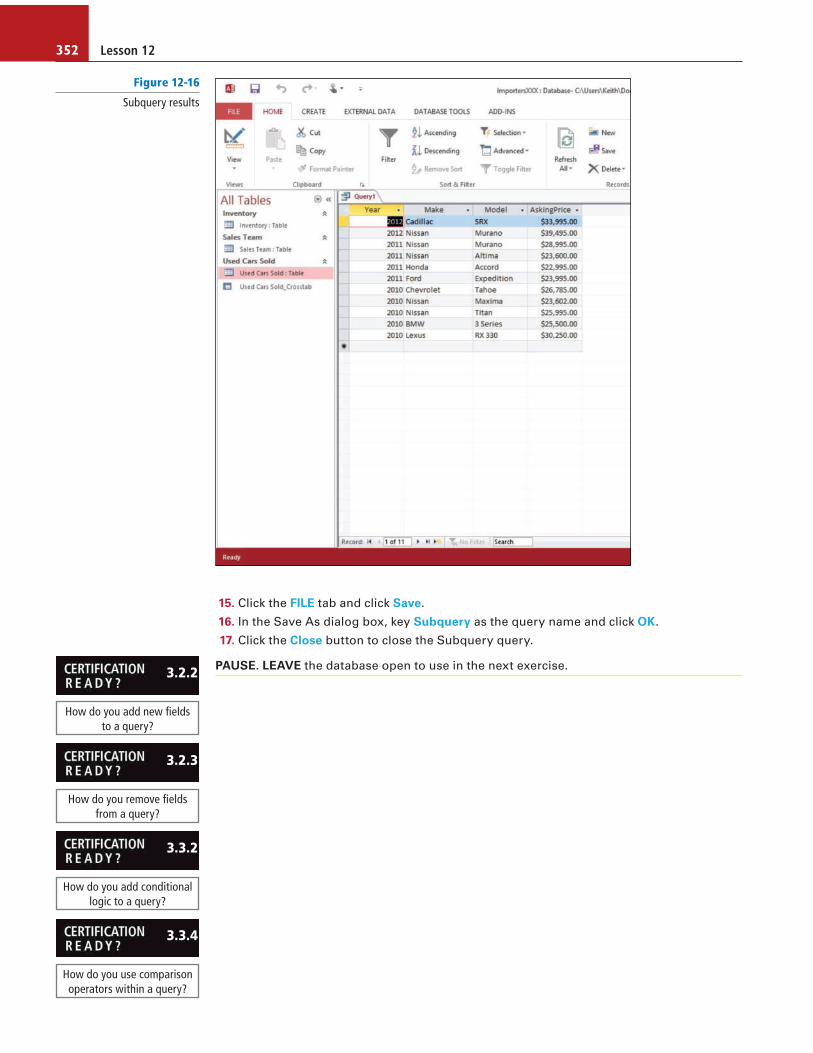
14. On the DESIGN tab, in the Results group, click Run. The query results are displayed, as
shown in Figure 12-16.
Lesson 12352
15. Click the FILE tab and click Save.
16. In the Save As dialog box, key Subquery as the query name and click OK.
17. Click the Close button to close the Subquery query.
PAUSE. LEAVE the database open to use in the next exercise.
Figure 12-16
Subquery results
How do you add new fi elds to a query?
3.2.2
How do you remove fi elds from a query?
3.2.3
How do you add conditional logic to a query?
3.3.2
How do you use comparison operators within a query?
3.3.4
Advanced Queries 353
SAVING A FILTER AS A QUERY
A fi lter can be saved as a query so it can be run again anytime you want. If you often work with certain fi lters, you might want to save these fi lters so you are not wasting time defi ning them each time. You cannot save more than one fi lter for each table, query, or form; but you can save a fi lter as a query and then apply the query as a fi lter when and where you want.
Saving a Filter as a Query
In this exercise, you create a simple select query, fi lter it, and then save it.
When you want to save a fi lter as a query, you fi rst use the Query Wizard to create a new query using all the fi elds from a table or another query. You can then use the Filter by Form command to choose the data by which to fi lter the newly created query and then apply the fi lter. Next, on the HOME tab, in the Sort & Filter group, you can click the Advanced button and then click Advanced Filter/Sort. The new query design grid will appear. It will automatically include all the fi elds you’ve previously chosen to fi lter. On the HOME tab, in the Sort & Filter group, click the Advanced button and click Save As Query. Key a name for the query and click OK.
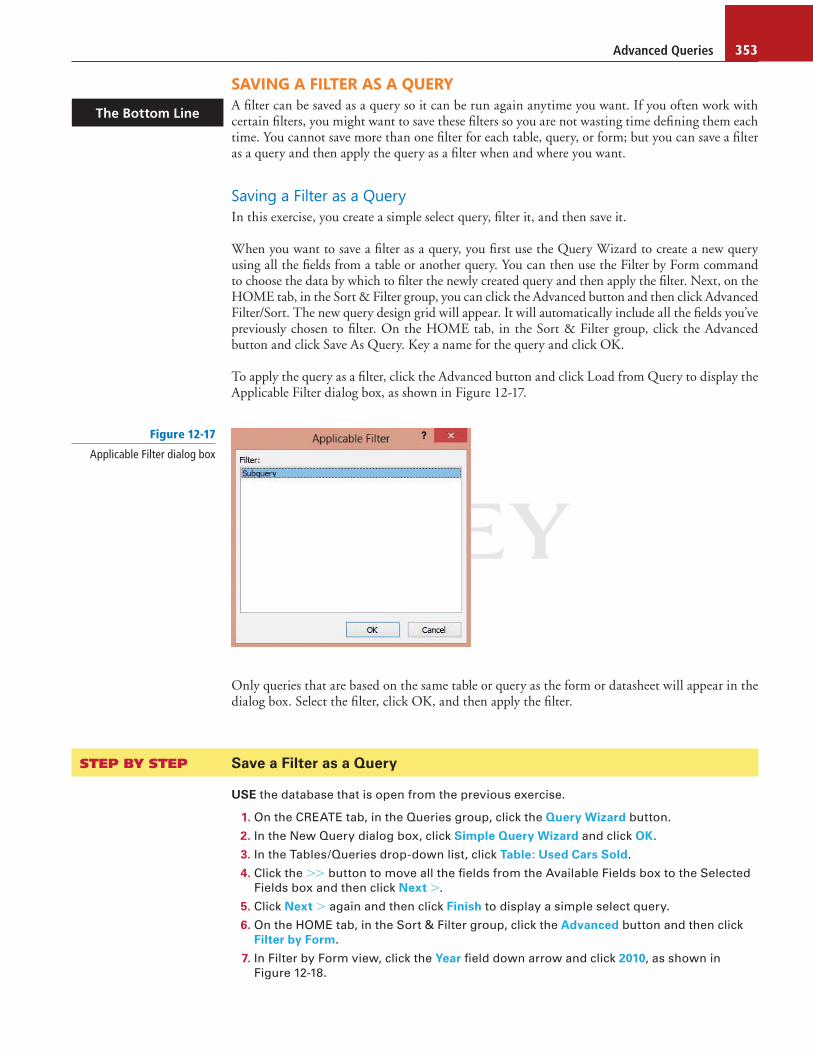
To apply the query as a fi lter, click the Advanced button and click Load from Query to display the Applicable Filter dialog box, as shown in Figure 12-17.
The Bottom Line
Figure 12-17
Applicable Filter dialog box
Only queries that are based on the same table or query as the form or datasheet will appear in the dialog box. Select the fi lter, click OK, and then apply the fi lter.
STEP BY STEP Save a Filter as a Query
USE the database that is open from the previous exercise.
1. On the CREATE tab, in the Queries group, click the Query Wizard button.
2. In the New Query dialog box, click Simple Query Wizard and click OK.
3. In the Tables/Queries drop-down list, click Table: Used Cars Sold.
4. Click the . . button to move all the fi elds from the Available Fields box to the Selected
Fields box and then click Next . .
5. Click Next . again and then click Finish to display a simple select query.
6. On the HOME tab, in the Sort & Filter group, click the Advanced button and then click
Filter by Form.
7. In Filter by Form view, click the Year fi eld down arrow and click 2010, as shown in
Figure 12-18.

Lesson 12354
8. On the HOME tab, in the Sort & Filter group, click the Toggle Filter button to apply the
fi lter. The results are displayed, as shown in Figure 12-19.
Figure 12-18
Filter by Form
Click the down arrow to select
criteria by which to filter a field
Figure 12-19
Filter by Form results
Results filtered to show only 2010 cars

Advanced Queries 355
9. On the HOME tab, in the Sort & Filter group, click the Advanced button and then click
Advanced Filter / Sort to display the new query design grid, as shown in Figure 12-20.
Figure 12-20
New query design grid
New query filter tab
10. On the HOME tab, in the Sort & Filter group, click the Advanced button and then click
Save As Query. The Save As Query dialog box appears, as shown in Figure 12-21.
Figure 12-21
Save As Query dialog box
11. Key Filter Query in the Query Name box and click OK.
12. Click the Close button to close the Used Cars Sold QueryFilter1 query.
13. On the HOME tab, in the Sort & Filter group, click the Toggle Filter button to remove the
fi lter.
14. Click the Close button to close the Used Cars Sold Query and save the changes when
prompted. If another dialog box appears informing you that another user may have
changed the data, click Yes.
PAUSE. LEAVE the database open to use in the next exercise.

Lesson 12356
CREATING ACTION QUERIES
An action query changes the data in its datasource or creates a new table. There are four types of action queries—append, delete, update, and make table—and except for the make table query, action queries make changes to the data in the tables on which they are based.
As their name suggests, action queries make changes to the data in the tables they are based on (except for make table queries, which create new tables). There are four types of action queries:
• Append query: A dds the records in the query’s result set to the end of an existing table
• Delete query: R emoves rows matching the criteria that you specify from one or more tables
• Update query: C hanges a set of records according to criteria that you specify
• Make table query: C reates a new table and then creates records in it by copying records from an existing table
Changes made by action queries cannot be easily undone, so if you later decide you didn’t want to make those changes, usually you will have to restore the data from a backup copy. For this reason, you should always make sure you have a current backup of the underlying data before running an action query.
To minimize the risk involved in running an action query, you can fi rst preview the data that will be acted upon by viewing the action query in Datasheet view before running it. When you are ready to run an action query, double-click it in the Navigation Pane or click it and then press En-ter. Or, on the DESIGN tab, in the Results group, click Run.
Creating an Append Query
An append query adds a set of records from one or more source tables (or queries) to one or more destination tables. Typically, the source and destination tables reside in the same database, but they don’t have to. For example, suppose you acquire some new customers and a database that contains a table of information about those customers. To avoid entering that new data manually, you can append it to the appropriate table in your database. In this exercise, you practice creating an append query.
You can also use append queries to append fi elds that are based on criteria. For example, you might want to append only the names and addresses of customers who have outstanding orders. Or you can use append queries to append records when some of the fi elds in one table don’t exist in the other table. For example, suppose that your Customers table has 10 fi elds, and the fi elds in the Clients table in another database match 8 of your 10 fi elds. You can use an append query to add only the data in the matching fi elds and ignore the others.
You cannot use append queries to change the data in individual fi elds in existing records. To do that type of task, you use an update query. You can only use append queries to add rows of data.
STEP BY STEP Create an Append Query
USE the database that is open from the previous exercise.
1. On the CREATE tab, in the Queries group, click the Query Design button.
2. In the Show Table dialog box, double-click Inventory to add it to the upper section of
the query design grid.
3. Click Close to close the Show Table dialog box.
4. In the list of table fi elds, double-click Year , Make , Model , and Asking Price to add those
fi elds to the design grid. Your screen should look similar to Figure 12-22.
The Bottom Line

Advanced Queries 357
5. On the DESIGN tab, in the Results group, click Run. Verify that the query returned the
records that you want to append, as shown in Figure 12-23.
Figure 12-22
Design grid
Figure 12-23
Records to be appended

Lesson 12358
If you need to add or remove fi elds from the query, switch back to Design view and double-click to add fi elds or select the fi elds that you don’t want and press Delete to remove them from the query.
6. Right-click the document tab (titled Query1) for the open query and click Design View
on the shortcut menu.
7. On the DESIGN tab, in the Query Type group, click Append. The Append dialog box
appears, as shown in Figure 12-24.
Take Note
Figure 12-24
Append dialog box
8. In the Table Name box, click the down arrow and click Used Cars Sold. This is the table
you want to append to. The Current Database option button should be selected.
9. Click OK. Access automatically adds the names of the destination fi elds that match the
source fi eld names to the Append To row in the design grid. Because the Asking Price
fi eld doesn’t have a match, Access leaves that fi eld blank.
10. Click the blank fi eld in the Append To row under the Asking Price cell and select Sales
Price as the destination fi eld, as shown in Figure 12-25. Figure 12-25
Source and destinationfi elds matched
Click the down arrow to
manually choose Sales Price
as the destination field for
the AskingPrice source field

Advanced Queries 359
11. Right-click the document tab for the query, and then click Datasheet View to preview
your changes.
12. Right-click the document tab for the query, and then click Design View.
13. On the DESIGN tab, in the Results group, click Run. An alert message appears, as shown
in Figure 12-26.
Figure 12-26
Append alert message
14. Click Yes.
15. Open the Used Cars Sold table and scroll down to see that the records from the
Inventory table have been appended to the end, as shown in Figure 12-27.
Figure 12-27
Results of append query
Original records
Appended records
16. Click the Close button to close the Used Cars Sold table.
17. Click the FILE tab and click Save.
18. In the Save As dialog box, key Append Query as the query name and click OK.
19. Click the Close button on Append Query to close the query.
PAUSE. LEAVE Access open to use in the next exercise.

Lesson 12360
Creating a Make Table Query
A make table query is an action query that creates a new table and then creates records in it by copying records from an existing table. You use a make table query when you want to create a new table based on query criterion or criteria from an existing table. For example, you may work for a telecommunications provider and be provided with a table with thousands of cellphone service customers who live in various states. You may fi nd it easier to work with a subset of customers from New York, New Jersey, and Connecticut who have had cellphone service for less than one year, since you need to contact and produce reports on only those individuals. A make table query can be advantageous in this example, especially if you want to ensure the data is stored in a separate table (i.e., you want to export the data as a table to a new database). If you run a make table query with no criterion or criteria, Access will make a duplicate of the table titled after the name you provide. This is helpful when you need to copy the data in a table or to archive data, especially before you run an append, update, or delete query in case it amends the table data in a way that you don’t want. In this exercise, you practice creating a make table query to create a backup of a table.
STEP BY STEP Create a Make Table Query
USE the database that is open from the previous exercise.
1. On the CREATE tab, in the Queries group, click the Query Wizard button.
2. In the New Query dialog box, click Simple Query Wizard and click OK.
3. In the Tables/Queries drop-down list, click Table : Sales Team.
4. Click the . . button to move all the fi elds from the Available Fields to the Selected
Fields box and then click Next . .
5. Click Finish to display a simple select query.
6. Right-click the Sales Team Query document tab and click Design View to display the
query in Design view, as shown in Figure 12-28. Figure 12-28
Query in Design view
Advanced Queries 361
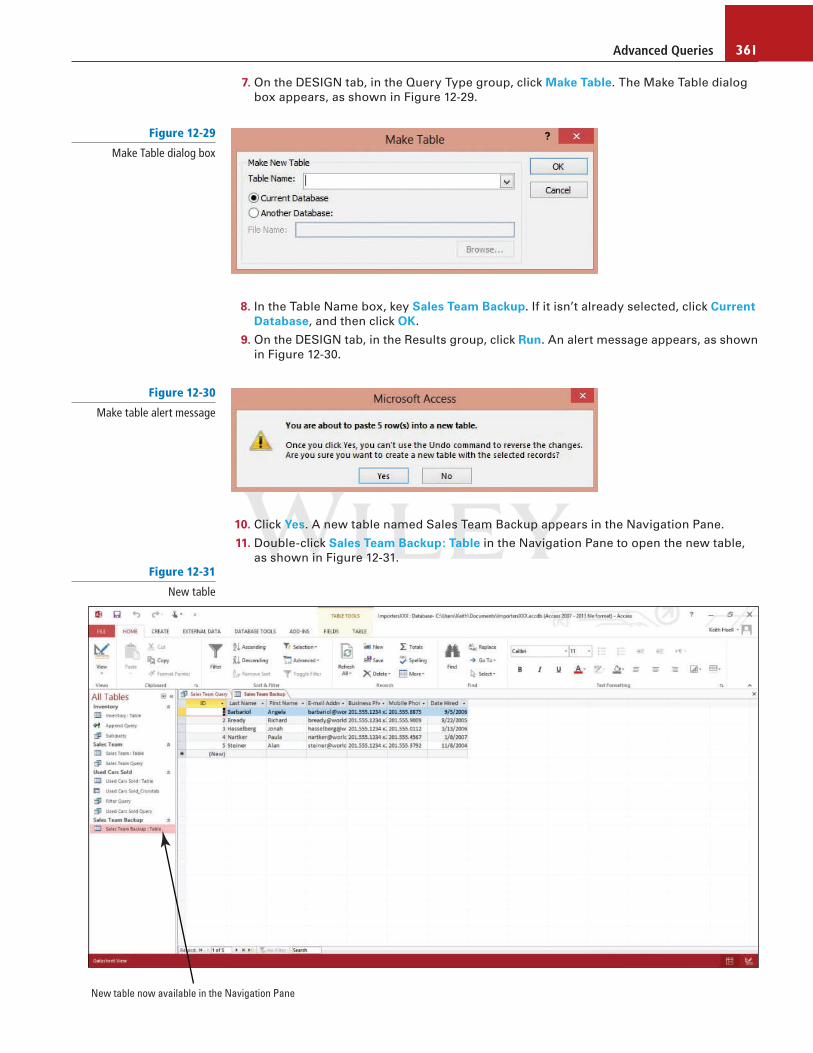
7. On the DESIGN tab, in the Query Type group, click Make Table. The Make Table dialog
box appears, as shown in Figure 12-29.
Figure 12-29
Make Table dialog box
8. In the Table Name box, key Sales Team Backup. If it isn’t already selected, click Current
Database, and then click OK.
9. On the DESIGN tab, in the Results group, click Run. An alert message appears, as shown
in Figure 12-30.
Figure 12-30
Make table alert message
10. Click Yes. A new table named Sales Team Backup appears in the Navigation Pane.
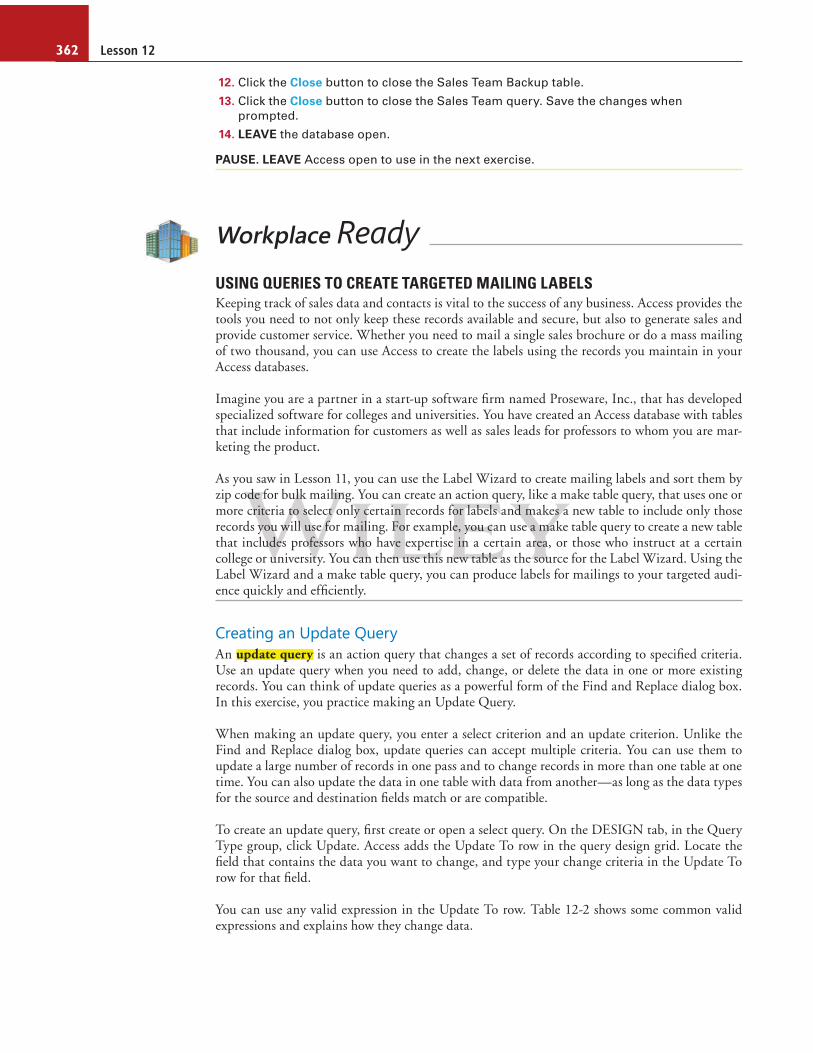
11. Double-click Sales Team Backup : Table in the Navigation Pane to open the new table,
as shown in Figure 12-31. Figure 12-31
New table
New table now available in the Navigation Pane
Lesson 12362
12. Click the Close button to close the Sales Team Backup table.
13. Click the Close button to close the Sales Team query. Save the changes when
prompted.
14. LEAVE the database open.
PAUSE. LEAVE Access open to use in the next exercise.
Workplace Ready
USING QUERIES TO CREATE TARGETED MAILING LABELS Keeping track of sales data and contacts is vital to the success of any business. Access provides the tools you need to not only keep these records available and secure, but also to generate sales and provide customer service. Whether you need to mail a single sales brochure or do a mass mailing of two thousand, you can use Access to create the labels using the records you maintain in your Access databases.
Imagine you are a partner in a start-up software fi rm named Proseware, Inc., that has developed specialized software for colleges and universities. You have created an Access database with tables that include information for customers as well as sales leads for professors to whom you are mar-keting the product.
As you saw in Lesson 11, you can use the Label Wizard to create mailing labels and sort them by zip code for bulk mailing. You can create an action query, like a make table query, that uses one or more criteria to select only certain records for labels and makes a new table to include only those records you will use for mailing. For example, you can use a make table query to create a new table that includes professors who have expertise in a certain area, or those who instruct at a certain college or university. You can then use this new table as the source for the Label Wizard. Using the Label Wizard and a make table query, you can produce labels for mailings to your targeted audi-ence quickly and effi ciently.
Creating an Update Query
An update query is an action query that changes a set of records according to specifi ed criteria. Use an update query when you need to add, change, or delete the data in one or more existing records. You can think of update queries as a powerful form of the Find and Replace dialog box. In this exercise, you practice making an Update Query.
When making an update query, you enter a select criterion and an update criterion. Unlike the Find and Replace dialog box, update queries can accept multiple criteria. You can use them to update a large number of records in one pass and to change records in more than one table at one time. You can also update the data in one table with data from another—as long as the data types for the source and destination fi elds match or are compatible.
To create an update query, fi rst create or open a select query. On the DESIGN tab, in the Query Type group, click Update. Access adds the Update To row in the query design grid. Locate the fi eld that contains the data you want to change, and type your change criteria in the Update To row for that fi eld.
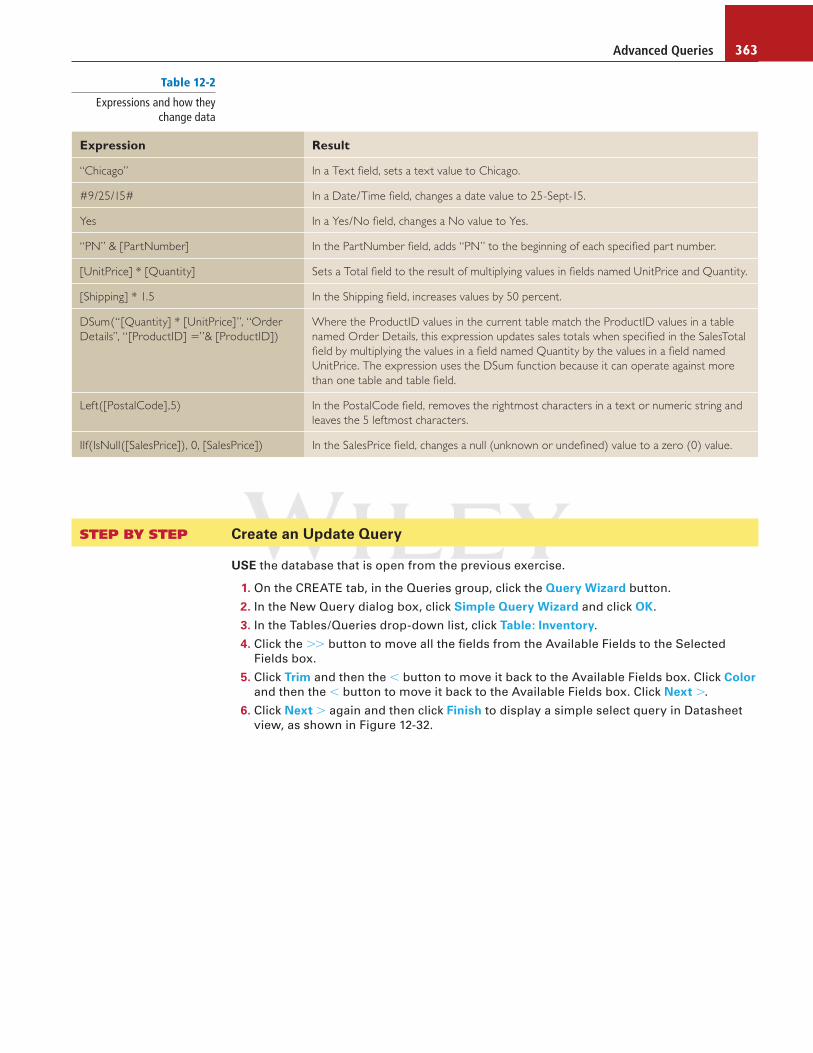
You can use any valid expression in the Update To row. Table 12-2 shows some common valid expressions and explains how they change data.
Advanced Queries 363
STEP BY STEP Create an Update Query
USE the database that is open from the previous exercise.
1. On the CREATE tab, in the Queries group, click the Query Wizard button.
2. In the New Query dialog box, click Simple Query Wizard and click OK.
3. In the Tables/Queries drop-down list, click Table : Inventory.
4. Click the . . button to move all the fi elds from the Available Fields to the Selected
Fields box.
5. Click Trim and then the , button to move it back to the Available Fields box. Click Color
and then the , button to move it back to the Available Fields box. Click Next . .
6. Click Next . again and then click Finish to display a simple select query in Datasheet
view, as shown in Figure 12-32.
Table 12-2
Expressions and how they change data
Expression Result
“Chicago” In a Text fi eld, sets a text value to Chicago.
#9/25/15# In a Date/Time fi eld, changes a date value to 25-Sept-15.
Yes In a Yes/No fi eld, changes a No value to Yes.
“PN” & [PartNumber] In the PartNumber fi eld, adds “PN” to the beginning of each specifi ed part number.
[UnitPrice] * [Quantity] Sets a Total fi eld to the result of multiplying values in fi elds named UnitPrice and Quantity.
[Shipping] * 1.5 In the Shipping fi eld, increases values by 50 percent.
DSum(“[Quantity] * [UnitPrice]”, “Order
Details”, “[ProductID] 5”& [ProductID])
Where the ProductID values in the current table match the ProductID values in a table
named Order Details, this expression updates sales totals when specifi ed in the SalesTotal
fi eld by multiplying the values in a fi eld named Quantity by the values in a fi eld named
UnitPrice. The expression uses the DSum function because it can operate against more
than one table and table fi eld.
Left([PostalCode],5) In the PostalCode fi eld, removes the rightmost characters in a text or numeric string and
leaves the 5 leftmost characters.
IIf(IsNull([SalesPrice]), 0, [SalesPrice]) In the SalesPrice fi eld, changes a null (unknown or undefi ned) value to a zero (0) value.

Lesson 12364
7. Right-click the Inventory Query document tab and click Design View to display the
query in Design view.
8. Key 2012 in the Criteria row of the Year fi eld.
9. On the DESIGN tab, in the Query Type group, click Update. Access adds the Update To
row in the query design grid, as shown in Figure 12-33.
Figure 12-32
Select query in Datasheet view
Figure 12-33
Select query in Design view

Advanced Queries 365
10. In the Update To row of the AskingPrice fi eld, key [AskingPrice] 1 500. The design grid
should look similar to Figure 12-34.
Figure 12-34
Select and update criterion
Update criteria
11. On the DESIGN tab, in the Results group, click Run. An alert message appears, as shown
in Figure 12-35.
Figure 12-35
Update alert message
12. Click Yes.
13. Right-click the Inventory Query document tab and click Datasheet View to display the
update query results, as shown in Figure 12-36.

Lesson 12366
Figure 12-36
Update query results
The query contains fields that you
don’t update, so Access does not
display those fields in the results
14. Click the Close button to close the Inventory query. Save the changes when prompted.
15. Double-click Inventory : Table in the Navigation Pane to open it. Notice that the asking
price for all 2012 cars has been increased by $500.
16. Click the Close button to close the Inventory table.
17. LEAVE the database open.
PAUSE. LEAVE Access open to use in the next exercise.
Creating a Delete Query
A delete query is an action query that removes rows matching the criteria that you specify from one or more tables. A delete query is used to delete entire records from a table, along with the key value that makes a record unique. Typically, delete queries are used only when you need to change or remove large amounts of data quickly. To remove a small number of records, open the table in Datasheet view, select the fi elds or rows that you want to delete, and press Delete.
To create a delete query, fi rst create or open a select query and add criteria to return the records you want to delete. On the DESIGN tab, in the Query Type group, click Delete. Access changes the select query to a delete query, hides the Show row in the lower section of the design grid, and adds the Delete row. The word Where appears in the Delete row for all fi elds of the query.
When you click Run, Access prompts you to confi rm the deletion. Click Yes to delete the data and then open the table to see that the records have been deleted.

Advanced Queries 367
STEP BY STEP Create a Delete Query
USE the database that is open from the previous exercise.
1. On the CREATE tab, in the Queries group, click Query Wizard.
2. In the New Query dialog box, click Simple Query Wizard and click OK.
3. In the Tables/Queries drop-down list, click Table : Used Cars Sold.
4. Click the . . button to move all the fi elds from the Available Fields to the Selected
Fields box and then click Next . .
5. Click Next . again.
6. Key Delete Query as the title and then click Finish to display the results of the simple
select query.
7. Right-click the Delete Query document tab and click Design View to display the query
in Design view.
8. Key , #3/31/2015# in the Criteria row of the Date Sold fi eld, as shown in Figure 12-37.
Figure 12-37
Date Sold criteria
Lesson 12368
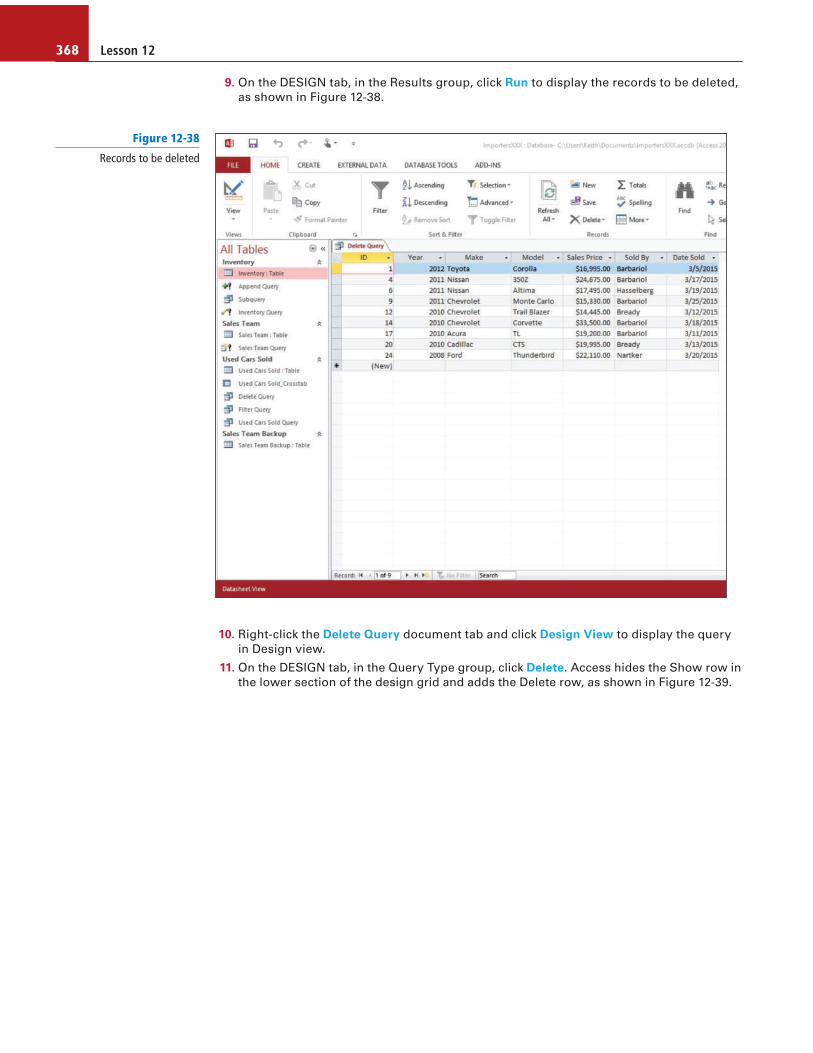
9. On the DESIGN tab, in the Results group, click Run to display the records to be deleted,
as shown in Figure 12-38.
Figure 12-38
Records to be deleted
10. Right-click the Delete Query document tab and click Design View to display the query
in Design view.
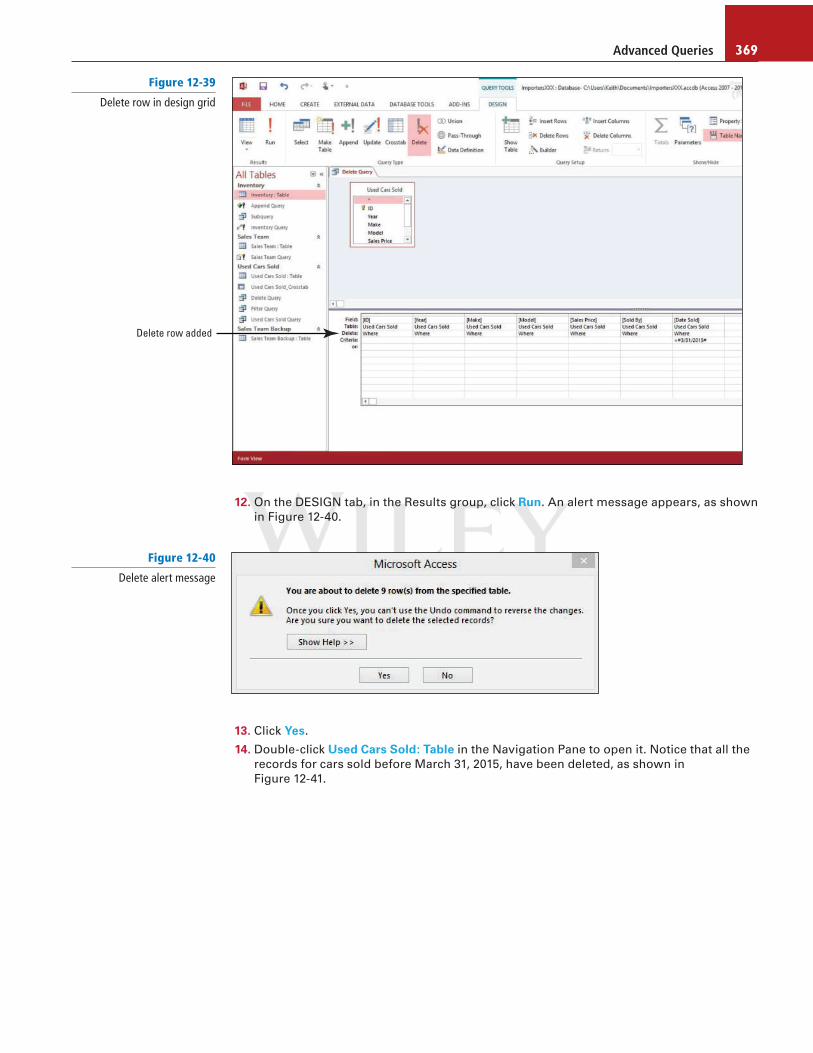
11. On the DESIGN tab, in the Query Type group, click Delete. Access hides the Show row in
the lower section of the design grid and adds the Delete row, as shown in Figure 12-39.
Advanced Queries 369
12. On the DESIGN tab, in the Results group, click Run. An alert message appears, as shown
in Figure 12-40.
Delete row added
Figure 12-39
Delete row in design grid
Figure 12-40
Delete alert message
13. Click Yes.
14. Double-click Used Cars Sold : Table in the Navigation Pane to open it. Notice that all the
records for cars sold before March 31, 2015, have been deleted, as shown in
Figure 12-41.

Lesson 12370
15. Click the Close button on Used Cars Sold to close the table.
16. Click the Close button on Delete Query to close the query. SAVE the changes when
prompted.
17. LEAVE the database open.
PAUSE. LEAVE Access open to use in the next exercise.
UNDERSTANDING ADVANCED QUERY MODIFICATION
After a query has been created, you can modify it in various ways to suit your purposes—by cre-ating a join, creating calculated fi elds, or using aggregated functions.
Creating a Join
Relational databases consist of tables that have logical relationships to each other. You use relation-ships to connect tables based on fi elds they have in common. A relationship between identical fi elds in different tables is represented by a join in Design view. When you include multiple tables in a query, you use joins to help you get the results you want. A join helps a query return only the records from each table you want to see based on how those tables are related to other tables in the query. When you add tables to a query, Access creates joins that are based on relationships that have been defi ned between the tables. You can manually create joins known as ad hoc relationships in queries, even if they do not represent relationships that have already been defi ned. In this exer-cise, you create a join between tables.
How do you create action queries?
3.1.4
The Bottom Line
Figure 12-41
Table with records deleted
All the records for cars
sold before 31 March
2015 have been deleted

Advanced Queries 371
If the relationship is one-to-many, Access displays a “1” above the join line to show which table is on the “one” side and an infi nity symbol ( ̀ ) to show which table is on the “many” side.
The four basic types of joins are inner joins, outer joins, cross joins, and unequal joins. An inner join includes rows in the query only when the joined fi eld matches records in both tables. Inner joins are the most common type of join. Most of the time, you don’t need to do anything to use an inner join. Access automatically creates inner joins if you add two tables to a query and those tables each have a fi eld with the same name and the same or compatible data type and one of the join fi elds is a primary key.
An outer join includes all of the rows from one table in the query results and only those rows from the other table that match the join fi eld in the fi rst table. You create outer joins by modifying inner joins. To create an outer join, double-click the line joining the tables to display the Join Properties dialog box. In the Join Properties dialog box, Option 1 represents an inner join. Option 2 is a left outer join , where the query includes all of the rows from the table on the left and only those records from the table on the right that match the join fi eld in the left table. Option 3 is a right outer join , where the query includes all of the rows from the table on the right and only those rows from the table on the left that match the join fi eld in the right table.
Because some of the rows on one side of an outer join will not have corresponding rows from the other table, some of the fi elds returned in the query results from the other table will be empty when the rows do not correspond.
To tell which table is the left table or the right table in a given join, double-click the join to view the Join Properties dialog box.
In a cross join , each row from one table is combined with each row from another table. Any time you run a query that has tables that are not explicitly joined, a cross join is produced. Cross joins are usually unintentional, but there are cases where they can be useful. A cross join can be used if you want to examine every possible combination of rows between two tables or queries.
If you want to combine the rows of two sources of data based on fi eld values that are not equal, you use an unequal join . Typically, unequal joins are based on either the greater than ( . ), less than ( , ), greater than or equal to ( . 5 ), or less than or equal to ( , 5 ) comparison operators. Unequal joins are not supported in Design view. If you wish to use them, you must do so in SQL view.
If you create a join by mistake, for example, a join between two fi elds that have dissimilar data types, you can delete it. In the query design grid, click the join you want to remove and press Delete.
STEP BY STEP Create a Join
USE the database that is open from the previous exercise.
1. On the CREATE tab, in the Queries group, click Query Design.
2. In the Show Table dialog box, double-click Sales Team and Used Cars Sold to add them
to the design grid.
3. Click Close.
4. In the Sales Team fi eld list, double-click E-mail Address.
5. In the Used Cars Sold fi eld list, double-click Year, Make, Model, and Sales Price. Your
screen should look similar to Figure 12-42.
Take Note
Take Note
Troubleshooting

Lesson 12372
6. Double-click the join line between the tables, indicating which fi elds are joined. The
Join Properties dialog box opens, as shown in Figure 12-43.
Figure 12-42
New query
Double-click join line to open the
Join Properties dialog box
Figure 12-43
Join Properties dialog box
Inner join option
Left outer join option
Right outer join option
7. Click the option button for option 2: and then click OK to create a left outer join.
8. On the DESIGN tab, in the Results group, click Run.
9. The results of the query are displayed, as shown in Figure 12-44.

Advanced Queries 373
10. Save the query as Join Query and CLOSE.
11. LEAVE the database open.
PAUSE. LEAVE Access open to use in the next exercise.
Creating a Calculated Query Field
You can create a new fi eld that displays the results of a calculation you defi ne with an expression or that manipulates fi eld values. A calculated fi eld is a column in a query that results from an expression. For example, you can calculate a value; combine text values, such as fi rst and last names; or format a portion of a date. You can also format the calculated fi eld value by choosing an appropriate format in the Property Sheet pane. In this exercise, you use the Expression Builder to create a calculated query by subtracting two fi elds to determine a markup price in both U.S.dollars and Euros.
You can use expressions that perform arithmetic operations in calculated fi elds using basic opera-tors ( 1 ,2,*, /) to add, subtract, multiply, and divide the values in two or more fi elds. You can also perform arithmetic operations on dates or use expressions that manipulate text. Table 12-3 shows examples of expressions and basic operators that can be used in calculated fi elds. The results can then be formatted by selecting the calculated fi eld and then selecting a format in the Format box of the Property Sheet pane. For example, a number can be formatted in several different ways, including as Currency or Scientifi c values. The Property Sheet button in the Show/Hide group on the DESIGN tab displays the Property Sheet pane.
How do you create multi-table queries?
3.1.5
Another Way You can also
display the Property Sheet pane by right-clicking the expression and choosing Properties from the shortcut menu that appears.
Figure 12-44
Left outer join
Results include all of the rows from the first table and only those records
from the second table that match the join field in the first table

Lesson 12374
Expression Description
PrimeShip: [Ship] * 1.1 Creates a fi eld called PrimeShip, and then displays shipping charges plus 10 percent in the fi eld.
OrderAmount: [Quantity] *
[Price]
Creates a fi eld called OrderAmount, and then displays the product of the values in the Quantity and
Price fi elds.
LeadTime: [RequiredDate] –
[ShippedDate]
Creates a fi eld called LeadTime, and then displays the difference (in number of days) between the
values in the RequiredDate and ShippedDate fi elds.
TotalInventory: [UnitsInStock]
1 [UnitsOnOrder]
Creates a fi eld called TotalInventory, and then displays the sum of the values in the UnitsInStock and
UnitsOnOrder fi elds.
FullName: [FirstName] & “ “ &
[LastName]
Creates a fi eld called FullName that displays the values in the FirstName and LastName fi elds,
separated by a space. (“&” is called the concatenation operator and is used to put strings together.)
Address2: [City] & “ “ &
[Region] & “ “ & [PostalCode]
Creates a fi eld called Address2 that displays the values in the City, Region, and PostalCode fi elds,
separated by spaces. (“&” is called the concatenation operator and is used to put strings together.)
Table 12-3
Expressions that can be used in calculated fi elds
A well-designed database does not store simple calculated values in tables. For example, a table might store an employee’s hire date, but not how long she has worked for the company. If you know both today’s date and the employee’s date of hire, you can always calculate her employment length, so there is no need to store that in the table. Instead, you create a query that calculates and displays the pertinent value. The calculations are made every time you run the query, so if the underlying data changes, so do your calculated results.
To create a calculated fi eld, fi rst open or create a query and switch to Design view. In the Field row of the fi rst blank column in the design grid, key the expression. You can use the Zoom box to access a larger screen area to help you enter the expression or, as you learned in Lesson 8, you can use the Expression Builder to easily select the elements of the expression (fi elds, operators, and built-in functions) from menus. To name the fi eld, key a name followed by a colon before the ex-pression. If you do not supply a name, Access will use a generic name for the fi eld, for example, EXPR1. The string following the colon is the expression that supplies the values for each record. To see the SQL code, you can switch to SQL View.
STEP BY STEP Create a Calculated Query Field
USE the database that is open from the previous exercise.
1. On the CREATE tab, in the Queries group, click Query Design.
2. In the Show Table dialog box, double-click Inventory to add the table to the design grid.
3. Click Close.
4. In the Inventory fi eld list, double-click Year, Make, Model, AskingPrice, and
TradeInValue.
5. Click the Field cell in the fi rst blank column (to the right of the TradeInValue fi eld) and
click the Builder button in the Query Setup group to open the Expression Builder
dialog box.
6. In the blank area of the dialog box, key the following:
Markup: [AskingPrice]
7. In the Expression Elements category, click Operators. The dialog box should resemble
Figure 12-45.

Advanced Queries 375
8. In the Expression Values category, double-click the minus sign (–). The minus sign
should appear in the expression and next to the AskingPrice fi eld.
9. In the Expression Elements category, click the expand button next to ImportersXXX.
accdb. Tables, Queries, Forms, and Reports should appear under ImportersXXX.accdb.
10. In the Expression Elements category, click the expand button next to Tables to expand
it. The available table names appear. Click Inventory. The available fi elds from the
Inventory table should appear in the Expression Categories box. Your screen should
resemble Figure 12-46.
Figure 12-45
Expression Builder
Expression Categories and Values
appear once Operators button is clicked
Operators
Expression
Expand button for
ImportersXXX.accdb
Figure 12-46
Expression Builder with Expression Elements expanded
Inventory table selected
Tables expanded
Available fields from Inventory table
ImportersXXX.accdb
expanded
Lesson 12376
11. In the Expression Categories box, double-click TradeInValue; [Inventory]! [TradeInValue]
should appear in the expression and next to the minus sign (–).
The part of the expression that reads [Inventory]! [T radeInValue] specifi es that the TradeInValue fi eld originates from the Inventory table; however, even though Access automatically formats it this way, this expression format is not required since you’re already referencing the Inventory table in the Table row of the design grid.
12. Click OK.
13. Click the Field cell in the fi rst blank column (to the right of the newly created calculated
fi eld) and click the Builder button in the Query Setup group to open the Expression
Builder dialog box.
14. In the blank area of the dialog box, key the following:
Markup in Euros: ([AskingPrice] – [TradeInValue]) * .7534
15. Click OK.
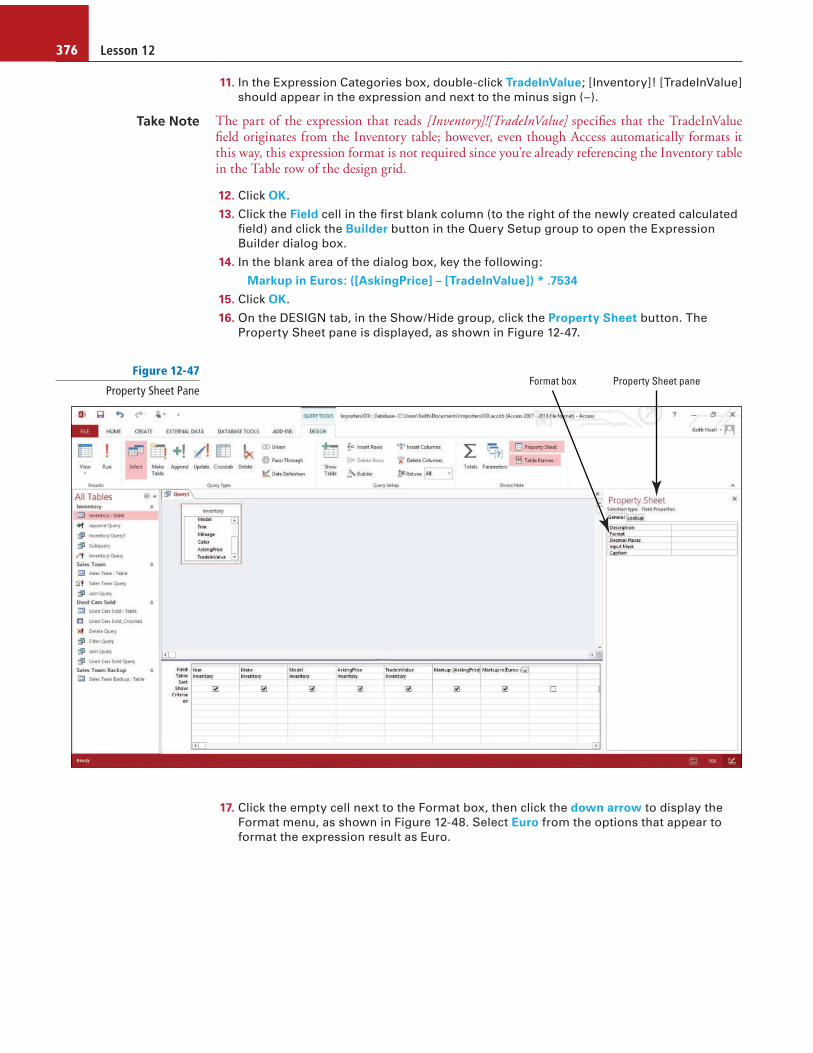
16. On the DESIGN tab, in the Show/Hide group, click the Property Sheet button. The
Property Sheet pane is displayed, as shown in Figure 12-47.
Take Note
17. Click the empty cell next to the Format box, then click the down arrow to display the
Format menu, as shown in Figure 12-48. Select Euro from the options that appear to
format the expression result as Euro.
Property Sheet paneFormat boxFigure 12-47
Property Sheet Pane

Advanced Queries 377
18. On the DESIGN tab, in the Results group, click Run. The query with the new calculated
Markup and Markup in Euros fi elds is displayed, as shown in Figure 12-49.
Click down arrow to display format menuFigure 12-48
Format menu

Lesson 12378
19. SAVE the query as Calculated Query and CLOSE.
20. LEAVE the database open.
PAUSE. LEAVE Access open to use in the next exercise.
Creating Aggregated Queries
An aggregate function performs a calculation on a set of values and then returns a single value. You can add, count, or calculate other aggregate values and display them in a special row, called the Total row, which appears below the asterisk (*) row in Datasheet view. You can use a different aggregate function for each column and you can also choose not to summarize a column. You can use aggregated functions to count the data returned by a query, calculate average values, and fi nd the smallest, largest, earliest, and latest values using a feature called the Total row, which doesn’t alter the design of your query. You can work with the Total row in both query Design and query Datasheet views. In this exercise, you create an aggregated query using the Total row in both query Design and query Datasheet views.
You can also apply aggregated functions in Design view where you have the ability to use the Group By function in the Total row on the design grid. The Group By function can be used in combination with other fi elds and aggregated functions. For example, if you’re managing a human resource database, you can group by employees’ gender and display the average salary per group.
How do you add calculated fi elds within queries?
3.3.1
How do you use basic operators within queries?
3.3.5
How do you format fi elds within queries?
3.2.6
New fields with results of
calculated expressions.
Figure 12-49
Calculated fi eld query results
Advanced Queries 379
The following aggregated functions are available in both Datasheet view and Design view:
• Count: C ounts the number of items in a column
• Sum: S ums a column of numbers
• Average: A verages a column of numbers
• Maximum: F inds the highest value in a column
• Minimum: F inds the lowest value in a column
• Standard Deviation: M easures how widely values are dispersed from an average value (a mean) in a column
• Variance: M easures the statistical variance of all values in a column
The following additional aggregated functions are available in Design view:
• First: F inds the fi rst value in a fi eld
• Last: F inds the last value in a fi eld
• Expression: G roups data based on an expression you can specify
• Where: G roups data based on criteria you can specify
In Lesson 9, you use the Total row with tables to provide a summary of table data.
Many of the aggregated functions work only on data fi elds set to specifi c data types. For example, if you are in a column that only displays text values, some functions—such as Sum or Average—are not relevant, and are therefore not available.
STEP BY STEP Create an Aggregated Query
USE the database that is open from the previous exercise.
1. On the CREATE tab, in the Queries group, click Query Design.
2. In the Show Table dialog box, double-click Inventory to add the table’s fi eld list window
to the design grid.
3. Click Close.
4. In the Inventory fi eld list, double-click Year, Make, Model, Mileage, AskingPrice , and
TradeInValue to add them to the design grid.
5. On the DESIGN tab, in the Results group, click Run.
6. On the HOME tab, in the Records group, click the Totals button. Scroll down, if
necessary, to see the Total row at the bottom of the result set.
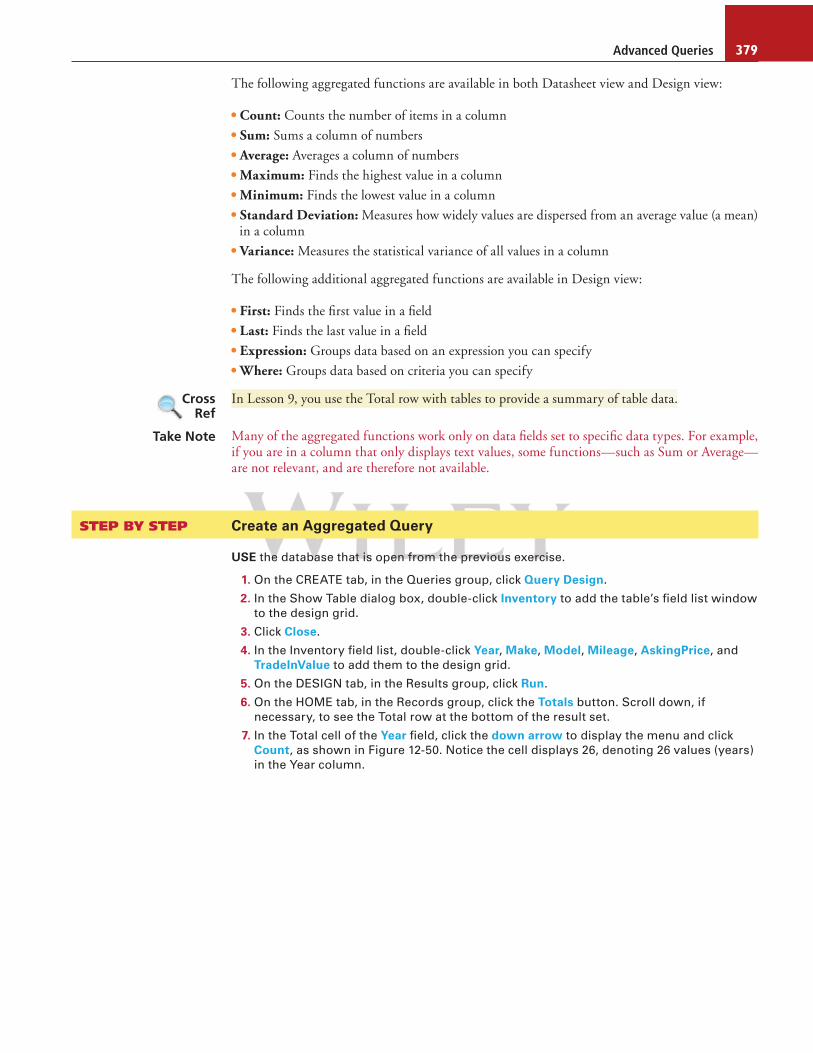
7. In the Total cell of the Year fi eld, click the down arrow to display the menu and click
Count, as shown in Figure 12-50. Notice the cell displays 26, denoting 26 values (years)
in the Year column.
Cross Ref
Take Note

Lesson 12380
8. Click the down arrow in the Total cell of the Mileage fi eld and click Average.
9. Click the down arrow in the Total cell of the AskingPrice fi eld and click Maximum.
10. Click the down arrow in the Total cell of the TradeInValue fi eld and click Sum. Your
Total row should appear similar to Figure 12-51.
Click the down arrow in the Total row
to see aggregate function options
Figure 12-50
Total row menu options

Advanced Queries 381
11. Switch to Design view and remove the Model , Mileage , AskingPrice , and TradeInValue
fi elds from the design grid. The Year and Make fi elds should be the only ones
remaining on the grid.
12. On the DESIGN tab, in the Show/Hide group, click the Totals button. A new Totals row
should appear below the Table row on the design grid.
13. Click the Group By cell below the Make fi eld cell and click the down arrow to display the
aggregate function menu.
14. Click the Count aggregate function to select it from the menu, as shown in Figure 12-52.
Count Average Maximum Sum
Figure 12-51
Aggregate function results

Lesson 12382
15. Switch to Datasheet view. Your screen should resemble Figure 12-53. Notice the
records in the Make fi eld are grouped by Year and counted with the results appearing
in a new column named CountOfMake. Also notice the Year fi eld is grouped and each
year remains counted as applied from the aggregate function we created previously in
Datasheet view.
Aggregate function menu in Total row
Figure 12-52
Aggregate function menu in Design view

Advanced Queries 383
16. SAVE the query as Aggregated Query and CLOSE it.
17. CLOSE the database.
PAUSE. CLOSE Access.
Figure 12-53
Aggregate function results
How do you group and summarize data within
queries?
3.3.3
In This Lesson You Learned How To: Exam ObjectiveObjective Number
Create crosstab queries Create crosstab queries 3.1.2
Create a subquery Add new fi elds
Remove fi elds
Add conditional logic
Use comparison operators
3.2.2
3.2.3
3.3.2
3.3.4
Save a fi lter as a query
Create action queries Create action queries 3.1.4
Understand advanced query modifi cation Create multi-table queries
Add calculated fi elds
Use basic operators
Format fi elds within queries
Group and summarize data
3.1.5
3.3.1
3.3.5
3.2.6
3.3.3
SKILL SUMMARY

Lesson 12384
Knowledge Assessment
Fill in the Blank
Complete the following sentences by writing the correct word or words in the blanks provided.
1. A(n) is a SELECT statement that is inside another select or action query.
2. A(n) removes rows matching the criteria you specify from one or more tables.
3. To minimize the risk of running an action query, you can fi rst preview the data that will
be acted upon by viewing the action query in view before running it.
4. A(n) includes all of the rows from one table in the query results and only those
rows from the other table that match the join fi eld in the fi rst table.
5. A(n) is a column in a query that results from an expression.
6. You can use the Group By function in the row on the design grid in query
Design view.
7. A(n) performs a calculation on a set of values and then returns a single value.
8. A(n) query always includes three types of data: the data used as row
headings, the data used as column headings, and the values that you want to sum or
otherwise compute.
9. To quickly add all the fi elds in a table to the design grid in Design view, double-click the at the top of the list of table fi elds.
10. To be able to apply a fi lter when and where you want, save the fi lter as a(n) .
Multiple Choice
Select the best response for the following statements or questions.
1. What type of query displays its results in a grid similar to an Excel worksheet?
a. crosstab
b. append
c. aggregated
d. subquery
2. What can you use for a more intuitive interface in which to enter criteria or an
expression in a fi eld or criteria cell?
a. Zoom box
b. Field list pane
c. control label
d. Expression Builder
3. Which action query does not make changes to the data in the tables that it is based on?
a. append
b. make table
c. update
d. delete
4. Which type of query can be thought of as a powerful version of the Find and Replace
dialog box?
a. fi lter
b. calculated fi eld
c. update
d. crosstab
5. Which of the following is not a type of join?
a. inner join
b. exterior join
c. cross join
d. unequal join
6. Which of the following is not an aggregated function?
a. Lowest
b. Sum

Advanced Queries 385
c. Average
d. Count
7. Which of the following SELECT statements selects all the fi elds from the Inventory
table?
a. SELECT all fi elds FROM Inventory
b. SELECT [ALL] from [INVENTORY]
c. SELECT from INVENTORY {all fi elds}
d. SELECT * FROM Inventory
8. For more space in which to enter the SELECT statement in a fi eld or criteria cell, what
do you press to display the Zoom box?
a. Shift 1 F2
b. Ctrl 1 2
c. Shift 1 Enter
d. Ctrl 1 Spacebar
9. To display the pane used to format a calculated value in query Design view, click the in the Show/Hide group on the DESIGN tab of the Ribbon.
a. Undo button
b. Property Sheet button
c. Datasheet View button
d. Totals button
10. Which type of query adds the records in the query’s result set to the end of an
existing table?
a. append
b. make table
c. update
d. delete
Competency Assessment
Project 12-1: Create a Calculated Query Field
In your job as a travel agent at Margie’s Travel, you are frequently asked the length of various trips. So that you don’t have to calculate it mentally, create a calculated fi eld that will give you this information.
GET READY. LAUNCH Access if it is not already running.
1. OPEN the M Travel database from the data fi les for this lesson.
2. SAVE the database as M TravelXXX (where XXX is your initials).
3. On the CREATE tab, in the Queries group, click Query Design.
4. In the Show Table dialog box, double-click Events to add the table to the design grid.
5. Click Close.
6. In the Inventory fi eld list, double-click Event, StartDate , and EndDate to add the fi elds to
the design grid.
7. Click the Field cell in the fi rst blank column and [press Shift 1 F2 ] to open the Zoom
dialog box.
8. In the Zoom dialog box, key the following expression:
TripLength: [EndDate] – [StartDate]
9. Click OK.
10. On the DESIGN tab, in the Results group, click Run. The query is displayed, with a new
TripLength fi eld calculating the number of days for each trip.
11. SAVE the query as Calculated Query and CLOSE.
12. CLOSE the database.
LEAVE Access running for the next project.

Lesson 12386
Project 12-2: Save a Filter as a Query
As sales manager for Fourth Coffee, you frequently run the same fi lters on the database. Now that you have learned to save a fi lter as a query, you can save yourself some time.
GET READY. LAUNCH Access if it is not already running.
1. OPEN Fourth Coffee from the data fi les for this lesson.
2. SAVE the database as Fourth Coffee XXX (where XXX is your initials).
3. On the CREATE tab, in the Queries group, click the Query Wizard button.
4. In the New Query dialog box, click Simple Query Wizard and click OK.
5. In the Tables/Queries drop-down list, click Table : Order Summary.
6. Click the . . button to move all the fi elds from the Available Fields to the Selected
Fields box and then click Next . .
7. Click Next . again and then click Finish to display a simple select query.
8. On the HOME tab, in the Sort & Filter group, click the Advanced button and then click
Filter by Form.
9. In the Filter by Form, click the down arrow in the Status fi eld and click Completed.
10. On the HOME tab, in the Sort & Filter group, click the Toggle Filter button to apply the
fi lter. The results are displayed.
11. On the HOME tab, in the Sort & Filter group, click the Advanced button and then click
Advanced Filter / Sort to display the new query design grid.
12. On the HOME tab, in the Sort & Filter group, click the Advanced button and then click
Save As Query. The Save As Query dialog box appears.
13. Key Filter Query in the Query Name box and click OK.
14. Click the Close button to close the Order Summary QueryFilter1 query.
15. On the HOME tab, in the Sort & Filter group, click the Toggle Filter button to remove
the fi lter.
16. Click the Close button to close the Order Summary Query and save the changes when
prompted. If presented with a message box stating the query has been changed, click Yes.
17. LEAVE the database open.
LEAVE Access open for the next project.
Profi ciency Assessment
Project 12-3: Create a Subquery
You are interested in extracting specifi c information about monthly sales for all Fourth Coffee stores from the database. Create a subquery to determine which months and corresponding stores have sales that are above average.
USE the database that is open from the previous project.
1. On the CREATE tab, in the Queries group, click Query Design.
2. Use the Show Table dialog box to add the Monthly Sales by Store table to the upper
section of the query design grid and then close the Show Table dialog box.
3. Add the Month, Store, and Sales fi elds to the design grid.
4. Place the insertion point in the Criteria row of the Sales fi eld and display the
Expression Builder.
5. Key the following expression in the Expression Builder, using the available categories
and menus:
. (SELECT AVG([Sales]) FROM [Monthly Sales by Store])

Advanced Queries 387
6. Click OK.
7. Use the Property Sheet pane to change the calculated fi eld format to Euro.
8. On the DESIGN tab, in the Results group, click Run to display the query results.
9. SAVE the query as Subquery and CLOSE.
10. CLOSE the database.
LEAVE Access open for the next project.
Project 12-4: Create a Make Table Query
As the manager at Southridge Video, you want to archive the current table with information about used games. Use the make table action query to create a backup table.
GET READY. LAUNCH Access if it is not already running.
1. OPEN Games Southridge from the data fi les for this lesson.
2. SAVE the database as Games SouthridgeXXX (where XXX is your initials).
3. Create a simple select query named Games Query using all the fi elds in the Games: Table.
4. Display the query in Design view if it is not already.
5. On the DESIGN tab, in the Query Type group, click Make Table to display the Make Table
dialog box.
6. In the Table Name box, key Games Backup. If it is not already selected, click Current
Database, and then click OK.
7. On the DESIGN tab, in the Results group, click Run. An alert message appears.
8. Click Yes. A new table appears in the Navigation Pane.
9. CLOSE the Games Query and save the changes when prompted.
10. CLOSE the database.
LEAVE Access open for the next project.
Mastery Assessment
Project 12-5: Create a Crosstab Query
As a regional manager for Contoso Pharmaceuticals, you are in charge of overseeing the sales reps in your division. To determine the total samples given by each rep in the fi rst two weeks of the quarter, you decide to create a crosstab query.
GET READY. LAUNCH Access if it is not already running.
1. OPEN Contoso Data from the data fi les for this lesson.
2. SAVE the database as Contoso DataXXX (where XXX is your initials).
3. Using the Samples Given: Table and the skills you have learned in this lesson, create
and save a crosstab query named Samples Given_Crosstab, as shown in Figure 12-54.

Lesson 12388
LEAVE the database open for the next project.
Project 12-6: Create an Update Query
The name of one of the hospitals in your region has recently been changed. You need to create an update query to change the name in the database.
USE the database that is open from the previous project.
1. Create a select query named Update Query that includes all the fi elds in the
Doctors: Table.
2. Switch to Design view.
3. Use criteria to select only the records that have Community Medical Center in the
Hospital fi eld.
4. Use the skills you have learned in this lesson to create and save an update query that
will change the name of Community Medical Center to Community Regional Hospital.
5. Open the Doctors: Table to verify that the hospital name has been changed. Then,
close the table and the query.
6. CLOSE the database.
CLOSE Access .
Figure 12-54
Crosstab query