Advanced Placement Mathematics Calculus Vertical Topic...
6
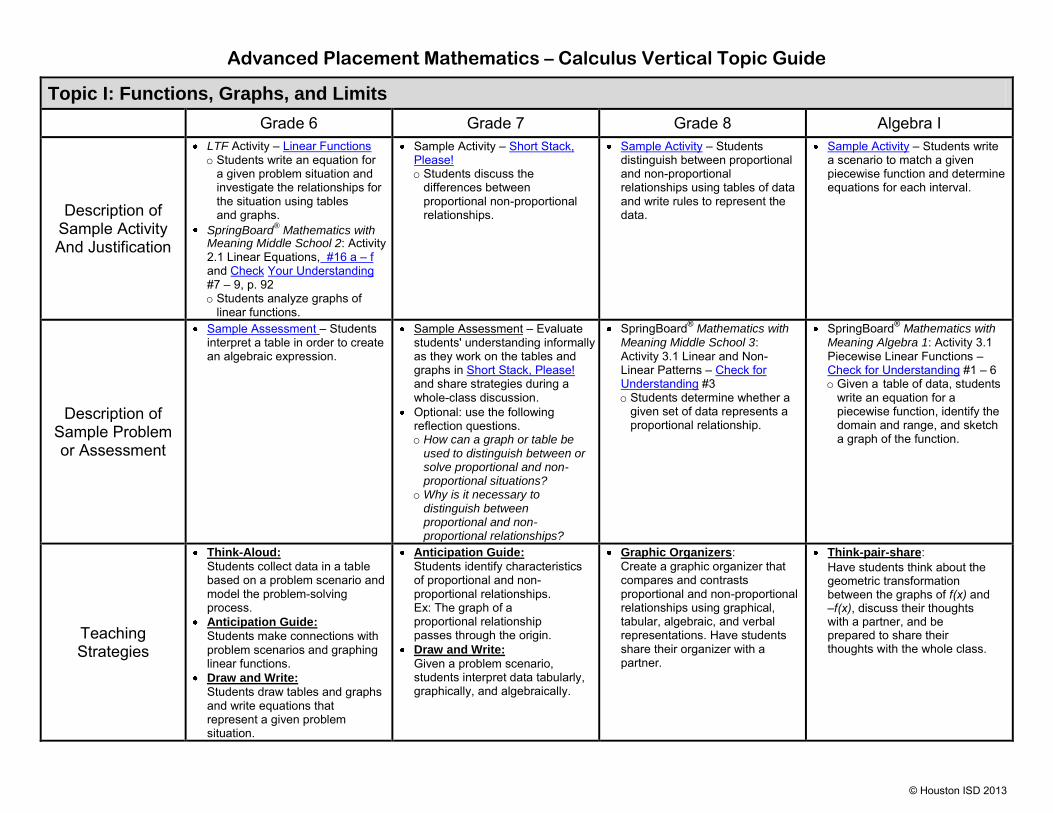
Advanced Placement Mathematics – Calculus Vertical Topic Guide Topic I: Functions, Graphs, and Limits Grade 6 Grade 7 Grade 8 Algebra I Description of Sample Activity And Justification LTF Activity – Linear Functions o Students write an equation for a given problem situation and investigate the relationships for the situation using tables and graphs. SpringBoard ® Mathematics with Meaning Middle School 2: Activity 2.1 Linear Equations, #16 a – f and Check Your Understanding #7 – 9, p. 92 o Students analyze graphs of linear functions. Sample Activity – Short Stack, Please! o Students discuss the differences between proportional non-proportional relationships. Sample Activity – Students distinguish between proportional and non-proportional relationships using tables of data and write rules to represent the data. Sample Activity – Students write a scenario to match a given piecewise function and determine equations for each interval. Description of Sample Problem or Assessment Sample Assessment – Students interpret a table in order to create an algebraic expression. Sample Assessment – Evaluate students' understanding informally as they work on the tables and graphs in Short Stack, Please! and share strategies during a whole-class discussion. Optional: use the following reflection questions. o How can a graph or table be used to distinguish between or solve proportional and non- proportional situations? o Why is it necessary to distinguish between proportional and non- proportional relationships? SpringBoard ® Mathematics with Meaning Middle School 3: Activity 3.1 Linear and Non- Linear Patterns – Check for Understanding #3 o Students determine whether a given set of data represents a proportional relationship. SpringBoard ® Mathematics with Meaning Algebra 1: Activity 3.1 Piecewise Linear Functions – Check for Understanding #1 – 6 o Given a table of data, students write an equation for a piecewise function, identify the domain and range, and sketch a graph of the function. Teaching Strategies Think-Aloud: Students collect data in a table based on a problem scenario and model the problem-solving process. Anticipation Guide: Students make connections with problem scenarios and graphing linear functions. Draw and Write: Students draw tables and graphs and write equations that represent a given problem situation. Anticipation Guide: Students identify characteristics of proportional and non- proportional relationships. Ex: The graph of a proportional relationship passes through the origin. Draw and Write: Given a problem scenario, students interpret data tabularly, graphically, and algebraically. Graphic Organizers : Create a graphic organizer that compares and contrasts proportional and non-proportional relationships using graphical, tabular, algebraic, and verbal representations. Have students share their organizer with a partner. Think-pair-share: Have students think about the geometric transformation between the graphs of f(x) and –f(x), discuss their thoughts with a partner, and be prepared to share their thoughts with the whole class. © Houston ISD 2013
Transcript of Advanced Placement Mathematics Calculus Vertical Topic...
Advanced Placement Mathematics – Calculus Vertical Topic Guide
Topic I: Functions, Graphs, and Limits
Grade 6 Grade 7 Grade 8 Algebra I
Description of Sample Activity And Justification
LTF Activity – Linear Functions o Students write an equation for
a given problem situation and investigate the relationships for the situation using tables and graphs.
SpringBoard® Mathematics with
Meaning Middle School 2: Activity 2.1 Linear Equations, #16 a – f and Check Your Understanding #7 – 9, p. 92 o Students analyze graphs of
linear functions.
Sample Activity – Short Stack, Please! o Students discuss the
differences between proportional non-proportional relationships.
Sample Activity – Students distinguish between proportional and non-proportional relationships using tables of data and write rules to represent the data.
Sample Activity – Students write a scenario to match a given piecewise function and determine equations for each interval.
Description of Sample Problem or Assessment
Sample Assessment – Students interpret a table in order to create an algebraic expression.
Sample Assessment – Evaluate students' understanding informally as they work on the tables and graphs in Short Stack, Please! and share strategies during awhole-class discussion. Optional: use the following reflection questions. o How can a graph or table be
used to distinguish between or solve proportional and non-proportional situations?
o Why is it necessary todistinguish betweenproportional and non-proportional relationships?
SpringBoard® Mathematics withMeaning Middle School 3: Activity 3.1 Linear and Non-Linear Patterns – Check for Understanding #3 o Students determine whether a
given set of data represents a proportional relationship.
SpringBoard® Mathematics withMeaning Algebra 1: Activity 3.1 Piecewise Linear Functions – Check for Understanding #1 – 6o Given a table of data, students
write an equation for apiecewise function, identify thedomain and range, and sketcha graph of the function.
Teaching Strategies
Think-Aloud:
Students collect data in a table based on a problem scenario and model the problem-solving process. Anticipation Guide:
Students make connections with problem scenarios and graphing linear functions. Draw and Write:
Students draw tables and graphs and write equations that represent a given problem situation.
Anticipation Guide:
Students identify characteristics of proportional and non-proportional relationships. Ex: The graph of aproportional relationship passes through the origin. Draw and Write:
Given a problem scenario, students interpret data tabularly, graphically, and algebraically.
Graphic Organizers: Create a graphic organizer that compares and contrasts proportional and non-proportional relationships using graphical, tabular, algebraic, and verbal representations. Have students share their organizer with a partner.
Think-pair-share: Have students think about the geometric transformation between the graphs of f(x) and –f(x), discuss their thoughts with a partner, and be prepared to share their thoughts with the whole class.
© Houston ISD 2013
Advanced Placement Mathematics – Calculus Vertical Topic Guide
Topic I: Functions, Graphs, and Limits
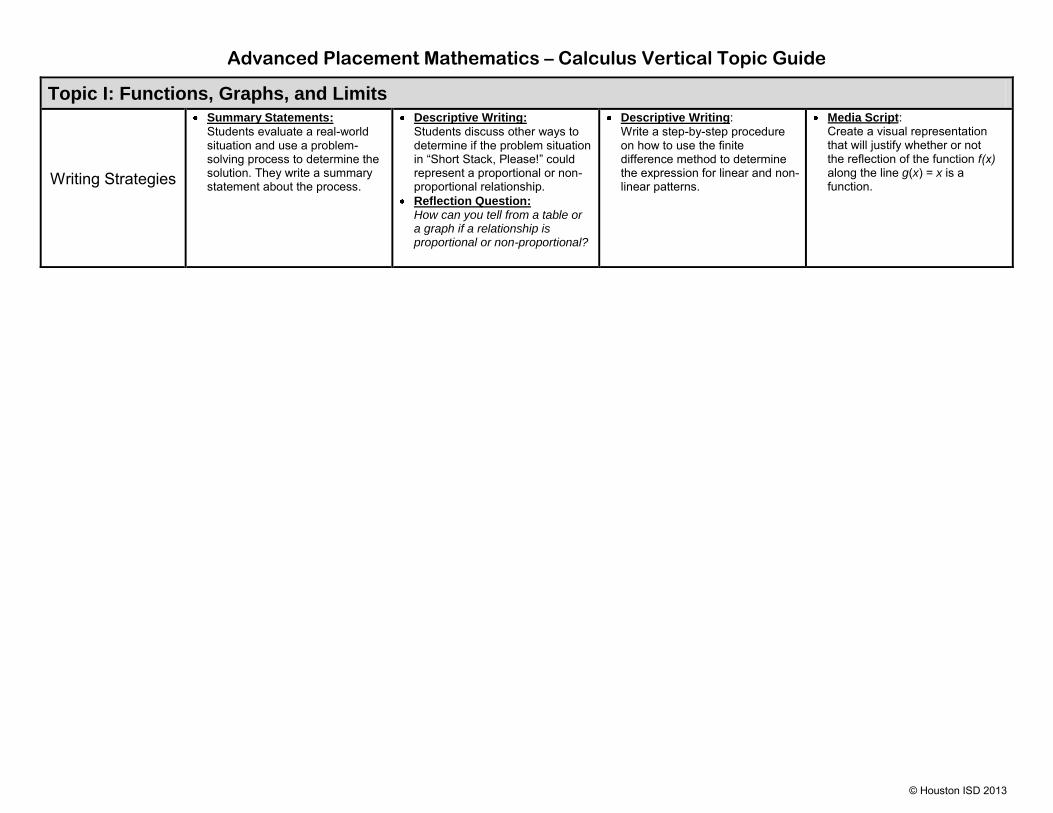
Writing Strategies
Summary Statements:
Students evaluate a real-world situation and use a problem-solving process to determine the solution. They write a summary statement about the process.
Descriptive Writing:
Students discuss other ways to determine if the problem situation in “Short Stack, Please!” could represent a proportional or non-proportional relationship. Reflection Question: How can you tell from a table or a graph if a relationship is proportional or non-proportional?
Descriptive Writing: Write a step-by-step procedure on how to use the finite difference method to determine the expression for linear and non-linear patterns.
Media Script: Create a visual representation that will justify whether or not the reflection of the function f(x) along the line g(x) = x is a function.
© Houston ISD 2013
Advanced Placement Mathematics – Calculus Vertical Topics Guide I
©Houston ISD 2013
Topic I: Functions, Graphs, and Limits
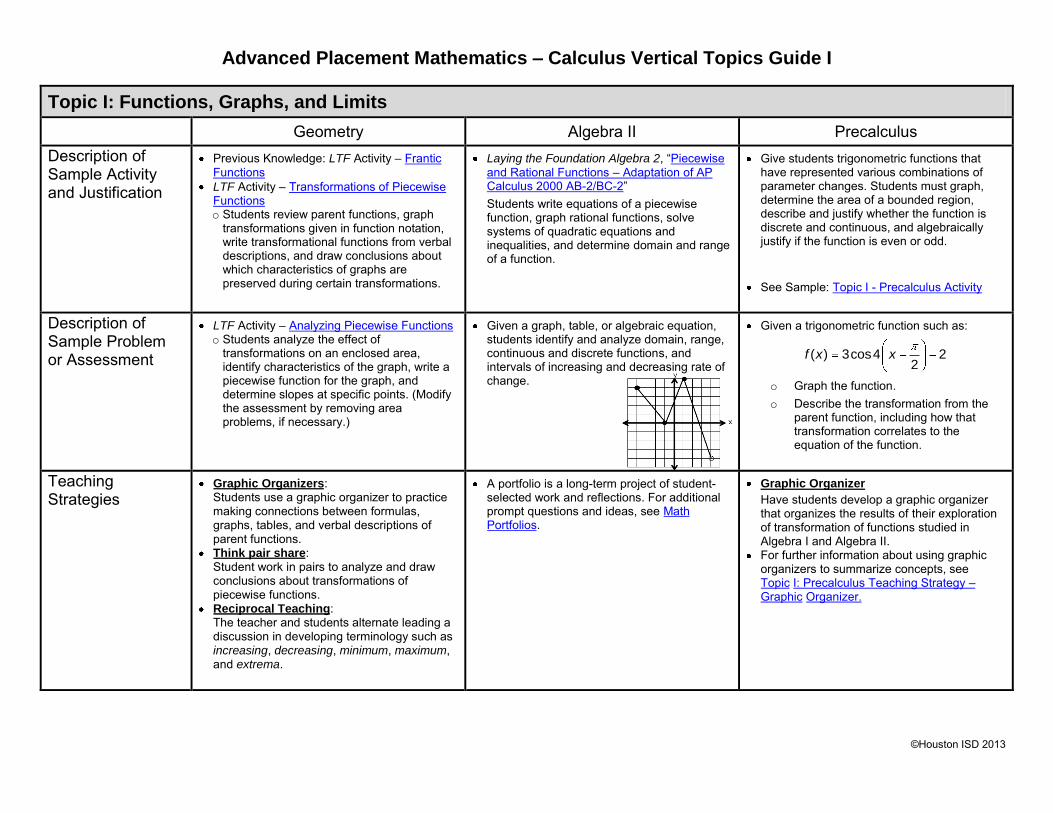
Geometry Algebra II Precalculus Description of Sample Activity and Justification
Previous Knowledge: LTF Activity – Frantic Functions LTF Activity – Transformations of Piecewise Functions o Students review parent functions, graph
transformations given in function notation,write transformational functions from verbaldescriptions, and draw conclusions aboutwhich characteristics of graphs arepreserved during certain transformations.
Laying the Foundation Algebra 2, “Piecewise and Rational Functions – Adaptation of AP Calculus 2000 AB-2/BC-2” Students write equations of a piecewise function, graph rational functions, solve systems of quadratic equations and inequalities, and determine domain and range of a function.
Give students trigonometric functions that have represented various combinations of parameter changes. Students must graph, determine the area of a bounded region, describe and justify whether the function is discrete and continuous, and algebraically justify if the function is even or odd.
See Sample: Topic I - Precalculus Activity
Description of Sample Problem or Assessment
LTF Activity – Analyzing Piecewise Functions o Students analyze the effect of
transformations on an enclosed area, identify characteristics of the graph, write a piecewise function for the graph, and determine slopes at specific points. (Modify the assessment by removing area problems, if necessary.)
Given a graph, table, or algebraic equation, students identify and analyze domain, range, continuous and discrete functions, and intervals of increasing and decreasing rate of change.
Given a trigonometric function such as:
( ) 3cos4 22
f x x
o Graph the function.o Describe the transformation from the
parent function, including how thattransformation correlates to theequation of the function.
Teaching Strategies
Graphic Organizers: Students use a graphic organizer to practice making connections between formulas, graphs, tables, and verbal descriptions of parent functions. Think pair share: Student work in pairs to analyze and draw conclusions about transformations of piecewise functions. Reciprocal Teaching: The teacher and students alternate leading a discussion in developing terminology such as increasing, decreasing, minimum, maximum, and extrema.
A portfolio is a long-term project of student-selected work and reflections. For additional prompt questions and ideas, see Math Portfolios.
Graphic Organizer
Have students develop a graphic organizer that organizes the results of their exploration of transformation of functions studied in Algebra I and Algebra II. For further information about using graphic organizers to summarize concepts, see Topic I: Precalculus Teaching Strategy – Graphic Organizer.
Advanced Placement Mathematics – Calculus Vertical Topics Guide I
©Houston ISD 2013
Topic I: Functions, Graphs, and Limits
Geometry Algebra II Precalculus Writing Strategies Expository Writing:
In their journals, students explain horizontal and vertical shifts, stretches, and/or compressions in complete sentences.
Writing prompt
1. Write a letter to a classmate who could notattend class today so that she/he willunderstand the lesson about functions.
2. Describe the procedure you would use to graph f(x) = 2(x - 3) + 4.
3. Explain the method you would use tograph piecewise defined functions.
Descriptive Writing
Have students write a descriptive paragraph of how to graph a given function.
For an example of a descriptive writing, see Topic I Precalculus Writing Strategy.
Connecting to AP Calculus: Analysis of Functions
In AP Calculus, students use first and second derivatives to determine the intervals on which functions are increasing/decreasing and concave up/concave down, as well as to locate relative extrema, absolute extrema and points of inflection.
Students in Pre-AP mathematics courses can be introduced to some of the vocabulary used to describe the behavior of functions as they learn about the families of functions and how they are affected by various transformations. Students should be exposed to and expected to work with multiple representations of functions (verbal, physical, graphical, algebraic). The chart on the adjacent page offers a suggested sequence for the introduction of the relevant vocabulary.
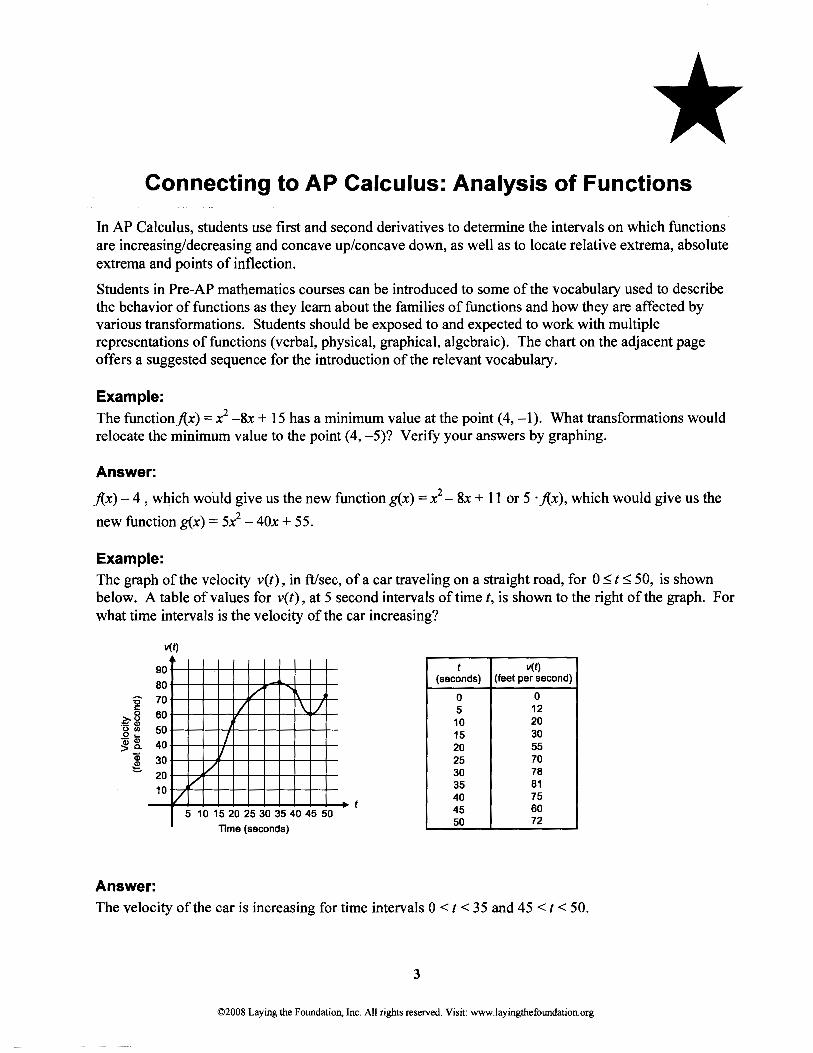
Example: The functionj{x) = x2 -8x + 15 has a minimum value at the point (4, -1). What transformations would relocate the minimum value to the point (4, -5)? Verify your answers by graphing.
Answer:
j{x)- 4 , which would give us the new function g(x) = x2- 8x + 11 or 5 · j{x), which would give us the
new function g(x) = 5x2- 40x +55.
Example: The graph of the velocity v(t), in ft/sec, of a car traveling on a straight road, for 0::;:; t::;:; 50, is shown below. A table of values for v(t), at 5 second intervals of timet, is shown to the right of the graph. For what time intervals is the velocity of the car increasing?
'0 <:: 0
.?;-0 ·- Q) Ofll o ... ~~
Qi ~
Answer:
v(t)
90 80
/ 70 I \ / 60
50 I 40
'/ 30 v 20 v 10 v
5 1 0 15 20 25 30 35 40 45 50 Time (seconds)
t v(t) (seconds) (feet per second)
0 0 5 12 10 20 15 30 20 55 25 70 30 78 35 81 40 75 45 60 50 72
The velocity of the car is increasing for time intervals 0 < t < 35 and 45 < t <50.
3
©2008 Laying the Foundation, Inc. All rights reserved. Visit: www.layingthefoundation.org
--------
Connecting Pre-AP to Advanced Placement Mathematics A Resource and Strategy Guide
Example: Given the functionj{x) = 2x e (2x), what happens as x approaches negative infmity? What happens as x approaches positive infinity? Support your answer with both a graph and a table of values.
Answer: As x approaches negative infinity,j{x) is getting closer and closer to zero. As x approaches positive infinity, the function is increasing without bound. In other words, the values of/are approaching positive infinity.
4
©2008 Laying the Foundation, Inc. All rights reserved. Visit: www.layingthefoundation.org

Topic I: Precalculus Writing Strategy
Topic I - Precalculus
Descriptive writing:
Describe how to graph 1 2 12
( ) sin( )f x x and show the graph of this function.
Writing sample:
To graph this function, you need to know that the sine function has zeros at x n for (integers)n Z
and extreme points at 2
x n for (integers),n Z
as well as the fact that this function is an odd and
periodic function.
1. First, identify the meaning of each parameter. In this problem, a = 1, which tells you that the
amplitude of the function is 1 (which means that you have to go up and down one unit from the
midline to find the maxima and minima). Because d = 1, you should know that the midline is at
y = 1.
2. To find the period (how long it takes for one complete cycle of this function to appear), you will
need to use b = 2 and the formula2
b. So, the period for f(x) is π. The “2” also tells you that in
any interval of 2π units, you will see two complete cycles of this function.
3. The fact that 2c =2
means that there is a phase shift of
4
units to the right.
4. Now, start by marking all the information on the coordinate plane. It is best to use a scale of π or
4
units for the x-axis (because of the phase shift) and a scale of one unit for the y-axis.
5. Move the midline. Next, mark the intercepts along the midline (to do this, move each intercept of
the parent function π units to the right). Plot the extreme points between the intercepts one unit
above the midline and one unit below the midline.
6. Graph one cycle of the function and repeat the process of marking and connecting points in either
direction to have a more complete picture of the function.
7. Finally, you should erase all marks that do not belong on the graph of the function but were
necessary to arrive at this graph.

Topic I – Precalculus Activity
Topic I - Precalculus
Given ( ) sin[ ( )].f x x
3 24
(a) On a separate piece of graph paper, graph this function and describe how each parameter affected the graph of the function.
(b) What value does the function approach as x 0 from the left? What value does
the function approach as x 0 from the right?
(c) Is this function continuous or discontinuous? Justify your answer.
(d) Show algebraically if this function is even, odd, or neither.

© 2
010
Colle
ge B
oard
. All
righ
ts re
serv
ed.
My Notes
92 SpringBoard® Mathematics with MeaningTM Level 2
Linear Equations ACTIVITY 2.1continued The Adventures of Grace and BernoulliThe Adventures of Grace and Bernoulli
17. Suppose you were hired by a local radio station to give a live report of the race of the tortoise and the hare described in Question 16. Your report should include all of the information from Question 16 and any other details that you feel are impor-tant. Write the script for your live radio report on a sheet of paper.
CHECK YOUR UNDERSTANDING
Write your answers on notebook paper. Show your work.
Janice and Patricia each want to buy a new DVD player. Th ey go to Hot Electronics and fi nd a DVD player for $75.00. Hot Electronics off ers diff erent payment plans. Janice is going to pay $15 now, and then $7.50 per month. Patricia is going to pay $12.50 per month.
1. How much will Janice and Patricia pay for each month?
Time in Months 0 1 2
Janice’s PaymentPatricia’s Payment
2. Write expressions for the amounts that Janice and Patricia will have paid on the DVD player at the end of any month, m.
3. What is the meaning of the coeffi cient of m in the expressions that you wrote?
4. What is the signifi cance of any constant term in the expressions that you wrote?
5. Write and solve an equation that shows when Janice and Patricia would have paid off the same amount on their DVD players.
6. Describe in words a situation involving Janice and Patricia that could be represented by the equation
5m + 13.50 = 3m + 18.Marcy was off ered two jobs during the summer. With both jobs, she earns a certain amount plus an hourly rate. Th e graph below gives information about her pay for each job.
x
y
0
15
30
45
60
5 10 15 20 25Hours Worked
Sala
ry ($
)
Job 1
Job 2
7. Which job starts her off with more pay? How do you know?
8. How many hours will she have to work before both jobs pay the same?
9. Which job would you recommend that Marcy take? Explain why.
10. MATHEMATICAL R E F L E C T I O N
You have used tables, equations, and graphs to
study patterns in this activity. When would you use each representation? Explain why.
SUGGESTED LEARNING STRATEGIES: RAFT
087-092_SB_MS2_2-1_SE.indd 92087-092_SB_MS2_2-1_SE.indd 92 12/23/09 5:06:27 PM12/23/09 5:06:27 PM

© 2
010
Col
lege
Boa
rd. A
ll rig
hts
rese
rved
.
92 SpringBoard® Mathematics with Meaning™ Level 2
ACTIVITY 2.1 Continued
g RAFT Students use the infor-mation from Question 16 to write a clear narrative of the race.
Suggested Assignment
CHECK YOUR UNDERSTANDING p. 92, #7–10
UNIT 2 PRACTICEp. 143, #6–8
1.
2. Janice: 7.5m + 15; Patricia: 12.5m
3. The coeffi cient m represents the amount of the monthly payment.
4. The constant term represents the amount of the down payment.
5. 7.5m + 15 = 12.5m15 = 5m3 = m
6. Answers may vary. Sample answer: Janice rode her bike for 13.5 miles, then started jogging at 5 mi/h. Patricia rode her bike for 18 miles, then started walking at 3 mi/h.
7. Job 2, because the y value is greater for x = 0.
8. 15h
9. Answers may vary. Sample answer: Take Job 1 and work fewer hours because it is summer vacation.
10. Answers may vary. Sample answer: I would use a table when I have a lot of data to analyze. I would use an equation when I want to make some predictions. I would use a graph when I need to visualize how a situ-ation is changing.
Time in Months
0 1 2
Janice’s payment
$15 $22.50 $30
Patricia’s payment
0 $12.50 $25
© 2
010
Colle
ge B
oard
. All
righ
ts re
serv
ed.
My Notes
92 SpringBoard® Mathematics with MeaningTM Level 2
Linear Equations ACTIVITY 2.1continued The Adventures of Grace and BernoulliThe Adventures of Grace and Bernoulli
17. Suppose you were hired by a local radio station to give a live report of the race of the tortoise and the hare described in Question 16. Your report should include all of the information from Question 16 and any other details that you feel are impor-tant. Write the script for your live radio report on a sheet of paper.
CHECK YOUR UNDERSTANDING
Write your answers on notebook paper. Show your work.
Janice and Patricia each want to buy a new DVD player. Th ey go to Hot Electronics and fi nd a DVD player for $75.00. Hot Electronics off ers diff erent payment plans. Janice is going to pay $15 now, and then $7.50 per month. Patricia is going to pay $12.50 per month.
1. How much will Janice and Patricia pay for each month?
Time in Months 0 1 2
Janice’s PaymentPatricia’s Payment
2. Write expressions for the amounts that Janice and Patricia will have paid on the DVD player at the end of any month, m.
3. What is the meaning of the coeffi cient of m in the expressions that you wrote?
4. What is the signifi cance of any constant term in the expressions that you wrote?
5. Write and solve an equation that shows when Janice and Patricia would have paid off the same amount on their DVD players.
6. Describe in words a situation involving Janice and Patricia that could be represented by the equation
5m + 13.50 = 3m + 18.Marcy was off ered two jobs during the summer. With both jobs, she earns a certain amount plus an hourly rate. Th e graph below gives information about her pay for each job.
x
y
0
15
30
45
60
5 10 15 20 25Hours Worked
Sala
ry ($
)
Job 1
Job 2
7. Which job starts her off with more pay? How do you know?
8. How many hours will she have to work before both jobs pay the same?
9. Which job would you recommend that Marcy take? Explain why.
10. MATHEMATICAL R E F L E C T I O N
You have used tables, equations, and graphs to
study patterns in this activity. When would you use each representation? Explain why.
SUGGESTED LEARNING STRATEGIES: RAFT
Answers may vary.
087-092_SB_MS2_2-1_SE.indd 92 12/23/09 5:40:36 PM
087-092_SB_MS2_2-1_TE.indd 92087-092_SB_MS2_2-1_TE.indd 92 2/9/10 6:32:05 PM2/9/10 6:32:05 PM

Topic I – Grade 6
STAAR-Released Grade 6 Sample Item #5
Coach Perez prepared the table below to show how the income earned by a soccer league
changes depending on the number of teams in the league.
Soccer League Income
Number of
Teams
League
Income
(dollars)
2 1,430
6 4,290
9 6,435
10 7,150
s l
Which expression could be used to find l, the income the soccer league would earn if it had s
teams?
A 715s
B s + 2,145
C 1,430s
D s + 2,860

Sample Grade 8 Activity Topic I – Functions
Topic I – Grade 8
Table A Table B Table C
x y Independent
Variable Dependent
Variable Input Output
1 2 0 0 0 0
2 5 1 1 2 4
3 8 2 4 4 8
4 11 3 9 6 12
a) Using the first quadrant of a coordinate plane, graphically represent the data
given in each table above (assume the data is continuous).
b) Determine the expression that could be used to find the 50th term for each table.
c) Determine and explain which of the tables above represent a proportional
relationship.
d) Which tables above represent a non-linear relationship? Justify your answer.

Topic I: Precalculus Teaching Strategies – Graphic Organizer
Topic I - Precalculus
Graphic Organizer
To help students make the connection to prior knowledge of functional transformations, review vertical
shifts, horizontal shifts, reflections, stretches, and compressions before introducing transformations of
trigonometric functions. Have students work in small groups (two to four students) to write verbal
descriptions and sketch graphs of different parent functions and the transformation of the parent
functions. For instance, one group works with linear functions, a second group works with quadratic
functions, a third group works with polynomial functions other than quadratic functions, a fourth group
works with exponential and logarithmic functions, and a fifth group works with absolute value functions.
Each group presents their function and its transformations to the rest of the class. After all groups have
presented, lead a discussion that compares and contrasts the transformations of the functions. Have
each group use a Venn diagram or a two-column organizer to record their findings. Students should have
a general understanding of the role of each parameter in the function’s transformations. Extend this
knowledge to trigonometric functions by working concrete examples with and without the calculator. Use
patty paper to help students better understands transformations of functions.
y = f(x) + C C > 0 moves it up
C < 0 moves it down
y = f(x + C) C > 0 moves it left
C < 0 moves it right
y = C·f(x) C > 1 stretches it in
the y-direction
0 < C < 1 compresses
it
y = f(Cx) C > 1 compresses it in
the x-direction
0 < C < 1 stretches it
y = -f(x) Reflects the graph
about x-axis
y = f(-x) Reflects the graph
about y-axis

Connecting Geometry to Advanced Placement* Mathematics A Resource and Strategy Guide
Frantic Functions New: 08/15/08
Objective: Students will practice making connections between formulas, graphs, tables, and verbal descriptions of parent functions.
Connections to Previous Learning: Students should be familiar with transformations on a variety of parent functions.
Connections to AP*: AP Calculus Topics: Analysis of Functions
Materials: Student Activity pages are formatted so they can be printed on perforated business card stock (2″ × 3.5″). They can also be printed on cardstock or regular paper and cut into cards. The “Frantic Function” page is intended to be copied on the backs of the cards. Calculators are not allowed.
Teacher Notes: This matching card game provides students practice in multiple representations for parent functions and their transformations. Four cards form a “set” that consists of the graph, a table of select values, a verbal description of the transformation, and an equation. The cards are marked with a letter or number in the lower right hand corner. A student answer page is available for students to record their matches in an organized fashion for ease in grading. The game can be effectively played by groups of three or four students The table cards may be difficult to match for some of the functions. Remind students to look for trends in the table values. In some tables, a key point has been omitted in order not to give away the answers easily. If students are not familiar with some of the types of functions, those cards can be omitted from the game and their rows marked off the answer page. As students are introduced to the new types of functions, their corresponding cards can be returned to the game set.
*Advanced Placement and AP are registered trademarks of the College Entrance Examination Board. 1 The College Board was not involved in the production of this product. Copyright © 2008 Laying the Foundation®, Inc. Dallas, TX. All rights reserved. Visit: www.layingthefoundation.org

Student Activity
Copyright © 2008 Laying the Foundation®, Inc. Dallas, TX. All rights reserved. Visit: www.layingthefoundation.org 2
Frantic
Functions
Frantic
Functions
Frantic
Functions
Frantic
Functions
Frantic
Functions
Frantic
Functions
Frantic
Functions
Frantic
Functions
Frantic
Functions
Frantic
Functions

Student Activity
( ) 2 1f x x= + −1
m
( ) 2f x x= − −
f
( ) 2 1f x x= − +
p
( ) ( )2 21
f xx−
= ++
d
( ) 3 2f x x= +
( ) 21 12
f x x= − −
n c
( ) 2f x x= − ( ) ( )21 1 12
f x x= − − +
a i
( ) 3 2f x x= −
( ) 2f x x= −
s t
Copyright © 2008 Laying the Foundation®, Inc. Dallas, TX. All rights reserved. Visit: www.layingthefoundation.org 3

Student Activity
( ) [ ]2 2f x x= − +
e
( ) 2f x x= −
r
Copyright © 2008 Laying the Foundation®, Inc. Dallas, TX. All rights reserved. Visit: www.layingthefoundation.org 4
( ) 12
f xx
=−
b
( ) ( )32f x x= − −
g
( ) [ ]2f x x= −
k
( ) 2 2f x x= −
l
( ) ( )22 1f x x= − + −
( ) 2( 3) 1f x x= − +
j h
1( ) ( 1) 22
f x x= − + −
o
1( ) 24
f x x= − +
q

Student Activity
Absolute value; horizontal translation 1 unit left; vertical stretch of 2; vertical translation 1 unit down B
Square root; reflection across the x-axis; vertical translation 2 units down Q
Square root; reflection across the y-axis; vertical stretch of 2; vertical translation 1 unit up F
Rational; horizontal translation 1 unit left; vertical stretch of 2; reflection across the x-axis; vertical translation 2 units up A
Quadratic; vertical shrink of 12
;
reflection across the x-axis; vertical translation 1 unit down H
Linear; vertical stretch of 3; vertical translation 2 units up
S
Quadratic; horizontal translation 1 unit right; vertical shrink of 1
2;
reflection across the x-axis; vertical translation 1 unit up L
Linear; vertical translation 2 units down J
Square root; horizontal translation 2 units right
M
Cubic; vertical translation 2 units down I
Copyright © 2008 Laying the Foundation®, Inc. Dallas, TX. All rights reserved. Visit: www.layingthefoundation.org 5

Student Activity
Greatest Integer; vertical stretch of 2; reflection across the x-axis; vertical translation 2 units up G
Absolute value; horizontal translation 2 units right K
Rational; horizontal translation 2 units right
C
Cubic; horizontal translation 2 units right; reflection across the x-axis R
Greatest Integer; horizontal translation 2 units right O
Quadratic; vertical translation 2 units down T
Quadratic; horizontal translation 2 units left; reflection across the x-axis; vertical translation 1 unit down E
Linear; horizontal translation 3 units right; vertical stretch of 2; vertical translation 1 unit up D
Linear; horizontal translation 1 unit left; vertical shrink of 1
2;
reflection across the x-axis; vertical translation 2 units down N
Absolute value; horizontal translation 2 units left; vertical shrink of 1
4; reflection across
the x-axis P
Copyright © 2008 Laying the Foundation®, Inc. Dallas, TX. All rights reserved. Visit: www.layingthefoundation.org 6

Student Activity
2
10
4
7
8
3
15
9
11
20
Copyright © 2008 Laying the Foundation®, Inc. Dallas, TX. All rights reserved. Visit: www.layingthefoundation.org 7

Student Activity
19
13
1
16
5
6
14
18
12
17
Copyright © 2008 Laying the Foundation®, Inc. Dallas, TX. All rights reserved. Visit: www.layingthefoundation.org 8

Student Activity
VII
Copyright © 2008 Laying the Foundation®, Inc. Dallas, TX. All rights reserved. Visit: www.layingthefoundation.org 9
I
VI
IV
XIII
XI
XV
XX
V
IX

Student Activity
X
Copyright © 2008 Laying the Foundation®, Inc. Dallas, TX. All rights reserved. Visit: www.layingthefoundation.org 10
II
XIV
XIX
VIII
XVIII
XVI
III
XII
XVII

Student Activity
After you have matched the cards, complete the following table with the letters or numbers in the right hand corner of the cards.
Formula Description Table Graph
a
b
c
d
e
f
g
h
i
j
k
l
m
n
o
p
q
r
s
t
Copyright © 2008 Laying the Foundation®, Inc. Dallas, TX. All rights reserved. Visit: www.layingthefoundation.org 11

Connecting Geometry to Advanced Placement* Mathematics A Resource and Strategy Guide
Frantic Functions Answers: Each card is marked with a letter or number in the lower right corner. The following table matches the correct cards.
Formula Description Table Graph
a L 15 XV
b C 13 XIV
c S 3 XI
d A 7 IV
e G 19 X
f Q 10 I
g R 16 XIX
h D 18 III
i J 5 or 9 XX
j E 14 XVI
k O 5 or 9 VIII
l T 6 XVIII
m B 2 VII
n H 8 XIII
o N 12 XII
p F 4 VI
q P 17 XVII
r K 1 II
s M 11 V
t I 20 IX
Copyright © 2008 Laying the Foundation®, Inc. Dallas, TX. All rights reserved. Visit: www.layingthefoundation.org 12

© 2
010
Colle
ge B
oard
. All
righ
ts re
serv
ed.
My Notes
Unit 2 • Equations, Inequalities, and Linear Relationships 91
ACTIVITY 2.1continued
Linear Equations The Adventures of Grace and BernoulliThe Adventures of Grace and Bernoulli
16. Th is graph gives information about part of that race. Use the graph to answer each question.
x
y
1
0
23456789
10
1 2 3 4 5 6 7 8 9 10 11 12Minutes Since Tortoise Started
Yard
s Fr
om th
e St
art
Hare
Tortoise
a. Who got a head start? How many minutes was it?
b. How far did the racer with the head start go before the second racer started?
c. What is the speed of the tortoise? Of the hare?
d. How far ahead of the tortoise was the hare eight minutes aft er the tortoise started the race?
e. Give a possible explanation for the change in the hare’s line, eight minutes aft er the tortoise started the race.
f. If the patterns in the graph of the race continue to be the same aft er 12 minutes as they are for 8 to 12 minutes, and the tortoise fi nishes the race in 16 minutes, who wins the race? Explain how you determined your answer.
SUGGESTED LEARNING STRATEGIES: Look for a Pattern
Remember to include units in your answers.
087-092_SB_MS2_2-1_SE.indd 91087-092_SB_MS2_2-1_SE.indd 91 12/23/09 5:06:24 PM12/23/09 5:06:24 PM

© 2
010
Col
lege
Boa
rd. A
ll rig
hts
rese
rved
.
Unit 2 • Equations, Inequalities, and Linear Relationships 91
ACTIVITY 2.1 Continued
f Look for a Pattern Students may be familiar with this story from Aesop’s Fables. They are asked to interpret the graph to answer Parts a–f. You may fi nd that some students want to write algebraic expressions to aid in answering the question while others will answer using visual strategies. Encourage students to share their techniques for answering the questions with the class.
© 2
010
Colle
ge B
oard
. All
righ
ts re
serv
ed.
My Notes
Unit 2 • Equations, Inequalities, and Linear Relationships 91
ACTIVITY 2.1continued
Linear Equations The Adventures of Grace and BernoulliThe Adventures of Grace and Bernoulli
16. Th is graph gives information about part of that race. Use the graph to answer each question.
x
y
1
0
23456789
10
1 2 3 4 5 6 7 8 9 10 11 12Minutes Since Tortoise Started
Yard
s Fr
om th
e St
art
Hare
Tortoise
a. Who got a head start? How many minutes was it?
b. How far did the racer with the head start go before the second racer started?
c. What is the speed of the tortoise? Of the hare?
d. How far ahead of the tortoise was the hare eight minutes aft er the tortoise started the race?
e. Give a possible explanation for the change in the hare’s line, eight minutes aft er the tortoise started the race.
f. If the patterns in the graph of the race continue to be the same aft er 12 minutes as they are for 8 to 12 minutes, and the tortoise fi nishes the race in 16 minutes, who wins the race? Explain how you determined your answer.
SUGGESTED LEARNING STRATEGIES: Look for a Pattern
Remember to include units in your answers.
The tortoise got a 5-minute head start.
2 yards
Tortoise: 2 yards in 5 minutes, so 2 __ 5 yd/min; hare: 2 yards in
1 minute, so 2 yd/min
3 yards
Answers may vary. Sample answer: The hare took a nap.
Explanations may vary. Sample answer: The tortoise wins the race. If the hare continues not to move and the tortoise continues to move at 2 __
5 yd per minute, the tortoise will have
run 6.4 yards upon fi nishing the race. Since the hare only ran 6 yards, the tortoise will have won.
087-092_SB_MS2_2-1_SE.indd 91 12/23/09 5:40:33 PM
© 2
010
Colle
ge B
oard
. All
righ
ts re
serv
ed.
The Adventures of Grace and Bernoulli
087-092_SB_MS2_2-1_SE.indd 90 12/23/09 5:40:30 PM
087-092_SB_MS2_2-1_TE.indd 91087-092_SB_MS2_2-1_TE.indd 91 2/9/10 6:32:04 PM2/9/10 6:32:04 PM

Connecting Middle Grades to Advanced Placement* Mathematics A Resource and Strategy Guide
Linear Functions Objective: Students will write an equation for a given problem situation and investigate the relationships for these situations using tables and graphs.
Connections to Previous Learning: Students should be able to write an equation, understand input and output, and graph on a coordinate plane.
Connection to AP*: AP Calculus Topic: Analysis of Functions
Materials: Student Activity pages, scientific or graphing calculators (optional)
Teacher Notes: Introduce the problem situation to the whole group. Ask some questions about the three choices of companies. For example, when would you want to order from Folders R Us? (when you are ordering just a few folders). When would Folders ’N More be the company of choice? (when you are ordering large quantities of folders). After completing the table that shows the printing price, you may want the students to use graphing calculators to verify their answers. Divide the class into two groups. Have half of them use the statistics capabilities by entering the number of folders into a list (List 1), enter the equation for Folders R Us into a second list (List 2), enter the equation for Folders Etc. into a third list (List 3), and enter the equation for Folders ’N More into a fourth list (List 4). Have them check their answers with the calculator-generated values. Have the other half of the class use the table building capabilities by entering each equation into Y=. Have them change table setup to ask for the independent variable. This will allow them to enter the same numbers that were on the worksheet. By doing this, they will be able to easily compare their answers with the calculator-generated values.
*Advanced Placement and AP are registered trademarks of the College Entrance Examination Board. The College Board was not involved in the production of this product. Copyright © 2009 Laying the Foundation®, Inc. Dallas, TX. All rights reserved. Visit: www.layingthefoundation.org 1

Student Activity
Linear Functions
The band booster club at your middle school is trying to raise money to help pay for a band trip to Fiesta Texas. They have decided to have several fund raising projects throughout the school year. The first fund raiser is selling folders that have the school name and mascot on them. Several companies have sent them pricing information for producing these folders. One company, Folders R Us, said that they would charge forty cents for each folder produced. Another company, Folders Etc. said that they would twenty cents for each folder, but a $20 set-up fee. A third company, Folders ’N More, said that they would charge only fifteen cents a folder with a $50 set-up fee.
1. Complete the following table showing the printing price for each company. Include the process that you used to find this amount.
Number of Folders Printed
Folders R Us Folders Etc. Folders ’N More
50 75 100 150 200 250 300 350 400 500 600 750 1000
n
2. Write a sentence and equation for the cost of the folders from Folders R Us.
Copyright © 2009 Laying the Foundation®, Inc. Dallas, TX. All rights reserved. Visit: www.layingthefoundation.org 2

Student Activity
3. Write a sentence and equation for the cost of the folders from Folders Etc.
4. Write a sentence and equation for the cost of the folders from Folders ’N More.
5. As the number of folders increase, what happens to the cost? What would a graph representing the costs for each company look like?
6. If the band boosters club only has $80 to spend, how many folders could they purchase from each company?
a) Which company offers the best deal?
b) What is the equation for this company?
c) How many folders or what does n equal for this amount?
7. If the band boosters club only has $30 to spend, how many folders could they purchase from each company?
a) Which company offers the best deal?
b) What is the equation for this company?
c) How many folders or what does n equal for this amount?
Copyright © 2009 Laying the Foundation®, Inc. Dallas, TX. All rights reserved. Visit: www.layingthefoundation.org 3

Student Activity
8. Folders Etc. has some financial problems and goes out of business. The band booster club has to decide between Folders R Us and Folders ’N More.
a) Write a sentence that tells when Folders R Us offers the better deal for the purchase of these folders.
b) Write a sentence that tells when Folders ’N More offers the better deal for the purchase of these folders.
9. a) Is there a point where the two companies, Folders R Us and Folders ’N More, charge the same amount for the same number of folders?
b) If so, what is that charge?
c) Write an equation that represents the point where these two companies charge the same
amount for the same number of folders.
d) Sketch a graph for both of these companies. Choose an appropriate scale for both axes. Remember to label your axes.
Copyright © 2009 Laying the Foundation®, Inc. Dallas, TX. All rights reserved. Visit: www.layingthefoundation.org 4

Student Activity
10. Folders R Us really wants the band boosters to buy folders from them. They make a counter offer to try to get the contract. If the band boosters will buy one thousand folders from them, they will decrease their original offer by fifty percent.
a) What would this new equation be?
b) How much would 1000 folders cost now?
c) How does this cost compare to Folders ’N More?
11. Since there are seven hundred fifty students at your school, the band boosters club decides to order only 500 folders. They would like to make a profit of $200 on the sale of these folders. Write a paragraph telling which company, Folders R Us or Folders ’N More, they should buy from and why. (Since they are only buying 500 folders, Folders R Us will charge their original price.) Explain what their cost will be for each folder based on the company you choose. Determine a reasonable price for them to charge for these folders to insure a profit of $200. Justify your answer.
Copyright © 2009 Laying the Foundation®, Inc. Dallas, TX. All rights reserved. Visit: www.layingthefoundation.org 5

Connecting Middle Grades to Advanced Placement* Mathematics A Resource and Strategy Guide
Key to Linear Functions Answers: 1. As shown in following table:
Number of Folders Printed Folders R Us Folders Etc. Folders ’N More
50 .40 (50) = 20 20.+ .20 (50) = 30 50 + .15(50) = 57.50
75 .40 (75)= 30 20.+ .20 (75) = 35 50 + .15(75) = 61.25
100 .40 (100) = 40 20.+ .20 (100) = 40 50 + .15(100) = 65
150 .40 (150) = 60 20.+ .20 (150) = 50 50 + .15(150) = 72.50
200 .40 (200) = 80 20.+ .20 (200) = 60 50 + .15(200) = 80
250 .40 (250) = 100 20.+ .20 (250) = 70 50 + .15(250) = 87.50
300 .40 (300) = 120 20.+ .20 (300) = 80 50 + .15(300) = 95
350 .40 (350) = 140 20.+ .20 (350) = 90 50 + .15(350) = 102.50
400 .40 (400) = 160 20.+ .20 (400) = 100 50 + .15(400) = 110
500 .40 (500) = 200 20.+ .20 (500) = 120 50 + .15(500) = 125
600 .40 (600) = 240 20.+ .20 (600) = 140 50 + .15(600) = 140
750 .40 (750) = 300 20.+ .20 (750) = 170 50 + .15(750) = 162.50
1000 .40 (1000) = 400 20.+ .20 (1000) = 220 50 + .15(1000) = 200
n .40n 20 + .20n 50 + .15n
2. The cost of the printing of the folders from Folders R Us is forty cents for each folder. C = .40n
3. The cost of the printing of the folders from Folders Etc. is $20 plus 20 cents for each folder. C = 20 + .20n
4. The cost of the printing of the folders from Folders ’N More is $50 plus 15 cents for each folder. C = 50 + .15n
5. As the number of folders increases, the cost increases. All three graphs would go up but at different rates. The graphs are straight lines. The graph for Folders R Us would go up faster than the other two graphs.
Copyright © 2009 Laying the Foundation®, Inc. Dallas, TX. All rights reserved. Visit: www.layingthefoundation.org 6

Answers
6. Folders R Us—200 folders; Folders Etc.—300 folders; Folders ’N More—200 folders
a) Folders Etc.
b) 80 = 20 + .20n Students should write the equations then look for the answer in the table. They do not need to solve the equation.
c) n = 300
7. Folders R Us—75 folders; Folders Etc.—50 folders; Folders ’N More—none since set up fee alone is $50.
a) Folders R Us
b) 30 = .40n
c) n = 75 Again, students should write the equation then look for the answer in the table. They do not need to solve the equation. It is important that students see equations in a real world context and understand how to solve them using a table.
8. Answers are:
a) Folders R Us offers the better deal for n < 200. There is no difference for n = 200.
b) Folders ’N More offers the better deal for n > 200.
9. Answers are:
a) Yes
b) When n = 200, the cost is $80 for either company.
c) 40n = 50 + .15n
d) See graph next page.
Copyright © 2009 Laying the Foundation®, Inc. Dallas, TX. All rights reserved. Visit: www.layingthefoundation.org 7

Answers
e)
Folders R Us
Folders ’N More
10. Answers are:
a) C = .20x
b) C = .20(1000) = 200
c) The cost for either company is the same ($200).
11. Answers will vary. Here is a sample response:
If the band boosters are going to order 500 folders, they should buy them from Folders ’N More. For 500 folders, the cost is $125 from Folders ’N More and $200 from Folders R Us. The cost for each folder from Folders ’N More is twenty-five cents. This cost is found by dividing $125 by 500 folders. So to make a profit of $200 they need to sell the folders for at least 65 cents each. At 65 cents each, they would collect $325. They have to pay Folders ’N More $125 so they would have $200 left. It is reasonable to charge 65 cents for a folder with a school’s name and mascot on it.
Copyright © 2009 Laying the Foundation®, Inc. Dallas, TX. All rights reserved. Visit: www.layingthefoundation.org 8

Connecting Algebra 2 to Advanced Placement* Mathematics A Resource and Strategy Guide
*Advanced Placement and AP are registered trademarks of the College Entrance Examination Board. The College Board was not involved in the production of this product.
Copyright © 2009 Laying the Foundation®, Inc. Dallas, TX. All rights reserved. Visit: www.layingthefoundation.org 1
Piecewise and Rational Functions Adaptation of AP Calculus 2000 AB-2/BC-2
Objective: The students will utilize an AP* Calculus exam question, in free response style, to review previously
learned material while introducing new material, such as limits as the independent variable
approaches infinity.
Connections to Previous Learning: The students should be familiar with equations of a piecewise function, graphing rational functions,
solving systems of quadratic equations and inequalities, transformations of functions, finding the
domain (algebraically) of a function, finding area under a curve using triangles, rectangles, and
trapezoids.
Connections to AP*: AP Calculus Topics: Analysis of Functions; Accumulation
Materials: Student Activity pages, graphing calculators
Teacher Notes: These problems use the graph from a past AP Calculus test and ask some questions straight from the
exam. Not only do students get experience with more complex problems, but they see the problems
are not too difficult when broken down into parts.
Students often use a graph incorrectly to just “read” off a particular value. In this activity, students
learn they have to write the equation of the piecewise function in order to interpret information
analytically. Many students will miss the answer to #1 concerning Runner A because they will
estimate the velocity by using the graph. Let them fumble with this for a few minutes before you ask
them “who got 20/3?”. Ask them to explain how they arrived at their answer. Let them come up
with the reason they must have the equation to get the one exact value at t = 2.
When using trapezoids to estimate the area under a curve, the students may have difficulty
remembering the bases on a trapezoid are the parallel sides. In addition, they will have to recognize
that in finding the length of the bases, they are actually finding the height of the function. The
computations for this area becomes nasty. However, if the students convert the fractions to decimals
and round before the final answer, they will get the wrong estimate.

Student Activity
Copyright © 2009 Laying the Foundation®, Inc. Dallas, TX. All rights reserved. Visit: www.layingthefoundation.org 2
1 2 3 4 5 6 7 8 9 10
2
4
6
8
10
12
14
Time (sec)
Velo
cit
y o
f ru
nner
(mps)
(3,10)
Piecewise and Rational Functions Adaptation of AP Calculus 2000 AB-2/BC-2
Two runners, A and B, run on a straight racetrack for 0 t 10 seconds. The graph above, which
consists of two line segments, shows the velocity, in meters per second, of Runner A. The velocity,
in meters per second, of Runner B is given by the function v which is defined by
v(t ) 24t
2t 3.
1. Find the velocity of Runner A and the velocity of Runner B at time t = 2 seconds. Indicate
units of measure.
2. State the piecewise function for Runner A.
3. You are the race commentator for Runner A. Describe his/her race to the fans.
4. Suppose Runner A gets hung up in the starting blocks and does not move at all until 1.2
seconds have passed, then he runs his regular race. Draw the new graph for this distraught
runner.

Student Activity
Copyright © 2009 Laying the Foundation®, Inc. Dallas, TX. All rights reserved. Visit: www.layingthefoundation.org 3
5. a) For 1 < t < 3 seconds, algebraically find the point of intersection of the velocity functions.
b) On the interval [3, 10] seconds, algebraically find the point of intersection of the velocity
functions.
c) Graph the velocity for Runner B over [0,10] seconds as a broken line on the original graph
for Runner A.
d) At the times calculated in parts 5a and 5b, what would a race commentator have to say
about the race?
6. Using the answers found in question 5, find when the velocity of Runner B is greater than the
velocity of Runner A. Justify your answer.
7. a) If Runner B were to continue running according to the same velocity function, what is the
value of the velocity function after 10 seconds? 20 seconds?
b) Enter the velocity function for Runner B in y2 of a graphing calculator and set the window
so that 0 30x and 0 14y . If Runner B were to continue running forever as
according to the same velocity function, what value does the velocity appear to approach?
Hint: Set TblStart to 10 and Table to 1 then examine the velocity values as the value of
time gets large.
c) If the time for the race were extended for a long period of time would either of the velocity
functions remain reasonable? Explain why or why not.
8. a) Find the area between the velocity curve for Runner A and the x-axis over the time
interval [0, 3].
b) Find the area between the velocity curve for Runner A and the x-axis over the time
interval [3, 10].
c) In the area calculations in 8a and 8b, the height of the figure represents the velocity of the
runner in meters/second and the width of the figure measures time in seconds. What are
the units of the area of the region bounded by the velocity function and the x-axis?
Explain what this means in the context of the problem?
d) Sum the answers from 8a and 8b. What does this answer tell you in the context of the
problem?

Student Activity
Copyright © 2009 Laying the Foundation®, Inc. Dallas, TX. All rights reserved. Visit: www.layingthefoundation.org 4
9. Using a graphing calculator enter the velocity function for Runner A into y1.
10
1 0 and 3 10 3 and 103
y x x x x x
. Set the calculator window so that
0 10x and 0 14y . Using the calculator, find the points of intersection of the two
velocity functions. Do these answers confirm the algebraic calculations for questions 5 and 6?
10. a) Examining both graphs, guess which runner do you think is leading the race at
10 seconds? What information do you need to say for sure who is ahead?
b) One technique for approximating the area under a curve is to use trapezoids. The velocity
of Runner B is drawn on the set of axes provided below.
Sketch straight line segments to connect (0, v(0)) and (2, v(2)), (2, v(2)) and (4, v(4)),
(4, v(4)) and (6, v(6)), (6, v(6)) and (8, v(8)), (8, v(8)) and (10, v(10)).
Draw in the vertical lines x = 2, x = 4, x = 6, x = 8, and x = 10 and the x-axis.
You now have one triangle and 4 trapezoids. The height of each figure is 2 seconds.
(Notice that the bases of the trapezoids are the vertical line segments.) By calculating the
areas of these new figures, approximate the distance traveled by Runner B in the first 10
seconds of the race.
c) Do you think that your answer in question 10b over estimates or under estimates the
distance traveled by Runner B. Justify your answer.
d) Based on your answers to question 8d and 10b, who is leading the race at 10 seconds?
How would a race commentator describe the race at 10 seconds?

Student Activity
Copyright © 2009 Laying the Foundation®, Inc. Dallas, TX. All rights reserved. Visit: www.layingthefoundation.org 5
11. a) How much time is required for Runner A to compete the 100 meters? Show your work.
b) How much time is required for Runner B to compete the 100 meters? (Use the procedure
provided below to answer the question.)
Finding the exact area under a curve requires calculus; however, many graphing
calculators have a function that will give a very close approximation of the area between a
positive curve and the x-axis. To use this function delete the graph of Runner A, extend
the time to about 15 seconds, and graph the velocity of Runner B.
Press 2nd
Trace (Calc)
Choose 7 ( ( )f x dx )
Set the lower limit to 0
Set the upper limit to a number greater than 10
The calculator will shade the area between the velocity curve and the x-axis giving you
the distance traveled. (To clear the shading, press 2nd
Prgm (Draw) and choose ClrDraw.
The calculator will redraw the original function.) If the distance is less than 100 meters,
then increase the upper limit, and if it is more than 100 meters, then decrease the upper
limit. Continue until the distance is 100 meters correct to 3 decimal places. What is the
time for Runner B correct to three decimal places?
c) What is the time difference between Runner A and Runner B?

Connecting Algebra 2 to Advanced Placement Mathematics A Resource and Strategy Guide
Copyright © 2009 Laying the Foundation®, Inc. Dallas, TX. All rights reserved. Visit: www.layingthefoundation.org 6
Piecewise and Rational Functions Adaptation of AP Calculus 2000 AB-2/BC-2
Answers:
1.
vA (2) 20 meters
3 second and
vB (2) 48 meters
7 second
2.
3. Runner A takes runs out of the blocks beginning at time = 0 and runs with a velocity that is
increasing at a constant rate of 10
3meters per second per second for 0 to 3 seconds. He is
running at 10 m/sec for the remainder of the race.
4.
5. a) b)
(2.1) 7 meters/secondv v(7.5) = 10 meters/second
The intersection point is (2.1, 7) The intersection point is (7.5, 10)
10 for 0 3
( ) 3
10 for 3 10A
t tv t
t
1 2 3 4 5 6 7 8 9 10
2
4
6
8
10
12
Time (sec)
Ve
loci
ty o
f ru
nn
er
(mp
s)
(4.2,10)
(1.2, 0)
10 24
3 2 3
0 seconds or 2.1 seconds
t t
t
t t
2410
2 3
7.5 seconds
t
t
t

Answers
Copyright © 2009 Laying the Foundation®, Inc. Dallas, TX. All rights reserved. Visit: www.layingthefoundation.org 7
1 2 3 4 5 6 7 8 9 10
2
4
6
8
10
12
Time (sec)
Velo
city o
f ru
nner
(mps
)(3,10)
c)
d) At 2.1 seconds, both runners’ speeds are 7 m/sec. At 7.5 seconds, both runners’ speeds are
10 m/sec.
6. By testing a point in each of the intervals (0, 2.1), (2.1, 3), and (3, 7.5), (7.5, 10) Runner B is
running faster than Runner A if 0 2.1t and again if 7.5 < t < 10.
7. a) The velocity of Runner B at 10 seconds is 10.435 m/sec. At 20 seconds the velocity is
11.163 m/sec.
b) The velocity of Runner B appears to be approaching a limit of 12 meters/second.
c) Neither velocity function seems reasonable over a long time interval. The human body
cannot run for a long time without tiring.
8. a) The geometric figure formed between the velocity function for Runner A and the x-axis in
the interval [0, 3] is a triangle with a base of 3 and a height of 10. Its area is 15 square
units.
b) The geometric figure formed between the velocity function for Runner A and the x-axis in
the interval [3, 10] is a rectangle with a base of 7 and a height of 10. Its area is 70 square
units.
c) The units for the area are meters/seconds multiplied by seconds which will equal meters.
The area represents the distance run.
d) The sum is 85 meters. This area represents the distance that Runner A runs during the 10
seconds.

Answers
Copyright © 2009 Laying the Foundation®, Inc. Dallas, TX. All rights reserved. Visit: www.layingthefoundation.org 8
9. The points of intersection between the two velocities are the same and the graph for Runner B
is above that of Runner A over the time intervals (0, 2.1) and (7.5, 10) seconds.
10. a) This is a guess so either answer is fine. To say for sure who is ahead at 10 seconds,
requires the distance that each runner has traveled.
b) 1
(2sec)(48/ 7 m / s) 6.85714 meters2
1
(2) 6.85714 8.72727 15.5844 meters2
1
(2) 8.72727 9.6000 18.32727 meters2
1
(2) 9.6000 10.10526 19.70526 meters2
1
(2) 10.10526 10.43478 20.54004 meters2
The approximate distance is 81.014 meters.
c) Since the trapezoids and the triangle lie under the curve the answer is an underestimate.
Some area has not been included.
d) It appears that at 10 seconds Runner A is still leading Runner B. Our estimate was an
underestimate.
11. a) Runner A will run the 100 meters in 11.5 seconds.
1
3 10 10 3 100 meters2
3 8.5 seconds
total 3 8.5 11.5 seconds
t
t
t
b) Runner B will run the 100 meters in 11.582 seconds.
c) Runner A wins by 0.082 seconds.

© 2
010
Colle
ge B
oard
. All
righ
ts re
serv
ed.
124 SpringBoard® Mathematics with MeaningTM Level 3
ACTIVITY 3.1continued
Linear and Non-Linear Patterns Fill It UpFill It Up
Write your answers on notebook paper. Show your work.
CHECK YOUR UNDERSTANDING
Write your answers on notebook paper. Show your work.
1. Find the rate of change for the table.
2. Find the rate of change for the table.
3. Determine which of the following tables displays linear data. Explain your reasoning.a. b.
4. Which equation matches the data in the table?a. y = x + 5b. x = y - 5c. y = 7x - 1d. y = 2x + 4
5. Graph the following points and determine if the data is linear.
{(5, -3), (7, -1), (9, 0), (11, 2)} 6. Determine which of the following
expressions displays a linear relationship. Use multiple representations to explain your reasoning.a. 2xb. -2x + 2c. x(4x) d. 4 - 3x
7. MATHEMATICAL R E F L E C T I O N
In this activity, you explored three ways to
represent linear data: in a table, graphically, and with an expression. Which representation of linear data do you understand most easily and why?
x y0 51 92 133 174 215 256 297 33
x y0 45
10 4020 3530 3040 3550 4060 4570 50
x y-5 -2.5-3 -5.5-1 -8.5
1 -11.53 14.55 17.57 20.59 23.5
x y1 62 83 104 12
x y-2 6-1 4 0 2 1 0 2 -2 3 -4 4 -6 5 -8
117-124_SB_MS3_3-1_SE.indd 124117-124_SB_MS3_3-1_SE.indd 124 12/30/09 11:35:28 AM12/30/09 11:35:28 AM

© 2
010
Col
lege
Boa
rd. A
ll rig
hts
rese
rved
.
124 SpringBoard® Mathematics with Meaning™ Level 3
ACTIVITY 3.1 Continued
1. 4
2. -2
3. a is not linear; b is not linear
a. The data constantly decreases at fi rst, and then constantly increases.
b. The data show two separate linear parts. But, together, that is not con-sidered linear data since the same rule does not apply to all the data.
4. d
5.
21
3
–1–2–3
2 4 6 8 10
not linear
6. a, b, and d are linear. Explanations will vary, but should include multiple representations.
7. Answers will vary. © 2
010
Colle
ge B
oard
. All
righ
ts re
serv
ed.
124 SpringBoard® Mathematics with MeaningTM Level 3
ACTIVITY 3.1continued
Linear and Non-Linear Patterns Fill It UpFill It Up
Write your answers on notebook paper. Show your work.
CHECK YOUR UNDERSTANDING
Write your answers on notebook paper. Show your work.
1. Find the rate of change for the table.
2. Find the rate of change for the table.
3. Determine which of the following tables displays linear data. Explain your reasoning.a. b.
4. Which equation matches the data in the table?a. y = x + 5b. x = y - 5c. y = 7x - 1d. y = 2x + 4
5. Graph the following points and determine if the data is linear.
{(5, -3), (7, -1), (9, 0), (11, 2)} 6. Determine which of the following
expressions displays a linear relationship. Use multiple representations to explain your reasoning.a. 2xb. -2x + 2c. x(4x) d. 4 - 3x
7. MATHEMATICAL R E F L E C T I O N
In this activity, you explored three ways to
represent linear data: in a table, graphically, and with an expression. Which representation of linear data do you understand most easily and why?
x y0 51 92 133 174 215 256 297 33
x y0 45
10 4020 3530 3040 3550 4060 4570 50
x y-5 -2.5-3 -5.5-1 -8.5
1 -11.53 14.55 17.57 20.59 23.5
x y1 62 83 104 12
x y-2 6-1 4 0 2 1 0 2 -2 3 -4 4 -6 5 -8
117-124_SB_MS3_3-1_SE.indd 124 12/28/09 3:46:14 PM
117-124_SB_MS3_3-1_TE.indd 124117-124_SB_MS3_3-1_TE.indd 124 2/9/10 6:42:19 PM2/9/10 6:42:19 PM

TE
AC
HE
R
Mathematics
Copyright © 2012 Laying the Foundation®, Inc., Dallas, TX. All rights reserved. Visit us online at www.ltftraining.org. i
Transformations of Piecewise Functions
About this Lesson
This lesson connects a variety of key geometric concepts: calculating the slope and the length of
a line segment on a coordinate grid, graphing translations and reflections given in function
notation, and writing transformational functions from given information. Students are led to draw
conclusions about which characteristics of graphs are preserved and which are changed when
functions are translated or reflected.
Prior to the lesson, students should have experience with slope, distance, and simple
transformations of functions.
This lesson is included in Module 11 – Analysis of Functions: Transformations.
Objectives
Students will
calculate slopes and lengths of line segments.
graph translations and reflections given in function notation.
write transformational functions from verbal descriptions.
draw conclusions about which characteristics of graphs are preserved during translations
and reflections.
Level
Geometry
Common Core State Standards for Mathematical Content
This lesson addresses the following Common Core State Standards for Mathematical Content.
The lesson requires that students recall and apply each of these standards rather than providing
the initial introduction to the specific skill. The star symbol (★) at the end of a specific standard
indicates that the high school standard is connected to modeling.
Explicitly addressed in this lesson
Code Standard Level of
Thinking
Depth of
Knowledge
G-CO.2 Represent transformations in the plane using,
e.g., transparencies and geometry software;
describe transformations as functions that take
points in the plane as inputs and give other
points as outputs. Compare transformations
that preserve distance and angle to those that
do not (e.g., translation versus horizontal
stretch).
Apply II

TE
AC
HE
R
Teacher Overview – Transformations of Piecewise Functions
Copyright © 2012 Laying the Foundation®, Inc., Dallas, TX. All rights reserved. Visit us online at www.ltftraining.org. ii
Code Standard Level of
Thinking
Depth of
Knowledge
F-BF.3 Identify the effect on the graph of
replacing f(x) by f(x) + k, k f(x), f(kx), and
f(x + k) for specific values of k (both
positive and negative); find the value of k
given the graphs. Experiment with cases
and illustrate an explanation of the effects
on the graph using technology. Include
recognizing even and odd functions from
their graphs and algebraic expressions for
them.
Apply II
G-CO.5 Given a geometric figure and a rotation,
reflection, or translation, draw the
transformed figure using, e.g., graph paper,
tracing paper, or geometry software.
Specify a sequence of transformations that
will carry a given figure onto another.
Apply II
F-IF.4 For a function that models a relationship
between two quantities, interpret key
features of graphs and tables in terms of
the quantities, and sketch graphs showing
key features given a verbal description of
the relationship. Key features include:
intercepts; intervals where the function is
increasing, decreasing, positive, or
negative; relative maximums and
minimums; symmetries; end behavior; and
periodicity.★
Apply II
G-CO.4 Develop definitions of rotations,
reflections, and translations in terms of
angles, circles, perpendicular lines, parallel
lines, and line segments.
Apply II
A-CED.2
(LTF extends to
equations of
transformations)
Create equations in two or more variables
to represent relationships between
quantities; graph equations on coordinate
axes with labels and scales.★
Apply II
F-IF.6 Calculate and interpret the average rate of
change of a function (presented
symbolically or as a table) over a specified
interval. Estimate the rate of change from a
graph.★
Apply II
F-IF.7a
(LTF extends to
piecewise
functions)
Graph functions expressed symbolically
and show key features of the graph, by
hand in simple cases and using technology
for more complicated cases. Graph linear
and quadratic functions and show
intercepts, maxima, and minima.★
Apply II

TE
AC
HE
R
Teacher Overview – Transformations of Piecewise Functions
Copyright © 2012 Laying the Foundation®, Inc., Dallas, TX. All rights reserved. Visit us online at www.ltftraining.org. iii
Common Core State Standards for Mathematical Practice
These standards describe a variety of instructional practices based on processes and proficiencies
that are critical for mathematics instruction. LTF incorporates these important processes and
proficiencies to help students develop knowledge and understanding and to assist them in
making important connections across grade levels. This lesson allows teachers to address the
following
Implicitly addressed in this lesson
Code Standard
1 Make sense of problems and persevere in solving them.
2 Reason abstractly and quantitatively.
3 Construct viable arguments and critique the reasoning of others.
4 Model with mathematics.
7 Look for and make use of structure.
8 Look for and express regularity in repeated reasoning.
LTF Content Progression Chart
In the spirit of LTF’s goal to connect mathematics across grade levels, the Content Progression
Chart demonstrates how specific skills build and develop from sixth grade through pre-calculus.
Each column, under a grade level or course heading, lists the concepts and skills that students in
that grade or course should master. Each row illustrates how a specific skill is developed as
students advance through their mathematics courses. 6th Grade
Skills/Objectives
7th Grade
Skills/Objectives
Algebra 1
Skills/Objectives
Geometry
Skills/Objectives
Algebra 2
Skills/Objectives
Pre-Calculus
Skills/Objectives
Apply
transformations to
tessellations as well
as to points,
segments, and
figures on the
coordinate plane.
(200_06.AF_K.02)
Apply
transformations to
tessellations as well
as to points,
segments, and
figures on the
coordinate plane.
(200_07.AF_K.02)
Apply
transformations
including
( )a f x c d
to linear, quadratic,
exponential,
piecewise, and
generic functions.
(200_A1.AF_K.02)
Apply
transformations to
circles and apply
transformations
including
( )a f x c d
to linear, quadratic,
exponential,
piecewise, and
generic functions.
(200_GE.AF_K.02)
Apply
transformations to
conic sections and
apply
transformations
including
( )a f x c d
and compositions
with absolute value
including f (|x|) and
| f (x)| to parent,
piecewise, and
generic functions.
(200_A2.AF_K.02)
Apply
transformations to
conic sections and
apply
transformations
including
( )a f x c d
and compositions
with absolute value
including f (|x|) and
| f (x)| to linear,
polynomial,
exponential,
logarithmic,
trigonometric,
piecewise, and
generic functions.
(200_PC.AF_K.02)
Connection to AP*
AP Calculus Topic: Analysis of Functions: Transformations *Advanced Placement and AP are registered trademarks of the College Entrance Examination Board.
The College Board was not involved in the production of this product.
Materials and Resources
Student Activity pages

TE
AC
HE
R
Teacher Overview – Transformations of Piecewise Functions
Copyright © 2012 Laying the Foundation®, Inc., Dallas, TX. All rights reserved. Visit us online at www.ltftraining.org. iv
Assessments
The following types of formative assessments are embedded in this lesson:
Students engage in independent practice.
Students summarize a process or procedure.
The following additional assessments are located on the LTF website:
Analysis of Functions: Transformations – Geometry Free Response Questions
Analysis of Functions: Transformations – Geometry Multiple Choice Questions
Teaching Suggestions
This lesson provides students with practice in graphing function transformations, given an
analytic description of the transformation such as ( ) ( 2)p x f x . No equations for the
piecewise function, ( )f x , are given or required. Therefore, when students are asked to graph a
new function that is defined as a transformation of f, they are expected to draw the new graph by
applying the concept of the transformation. For instance, ( ) ( 2)p x f x should be interpreted
to mean that ( )p x can be graphed by translating the graph of ( )f x two units to the right.
Additionally, this lesson asks students to analyze the effects of translations and reflections on
slopes and segment lengths in the piecewise linear function. After several specific calculations,
students should be able to generalize their findings.
Note: In order to maintain the conceptual power of this lesson, teachers should insist that
students work from the graph given in the question stem – not by writing linear equations to
define f and its related functions before drawing the graphs. Additionally, the lesson should be
completed without the use of graphing calculators.
Modality
LTF emphasizes using multiple representations to connect various approaches to a situation in
order to increase student understanding. The lesson provides multiple strategies and models for
using these representations to introduce, explore, and reinforce mathematical concepts and to
enhance conceptual understanding.
P – Physical
V – Verbal
A – Analytical
N – Numerical
G – Graphical

TE
AC
HE
R
Teacher Overview – Transformations of Piecewise Functions
Copyright © 2012 Laying the Foundation®, Inc., Dallas, TX. All rights reserved. Visit us online at www.ltftraining.org. v
Answers
1. 2
2. 20 or 2 5
3.
4. 2; Either recalculate the slope using (0,1) and (2,5) or note that the slope has not changed
since the y-values of both endpoints have been increased by 1 which means that the change in
y has not changed.
5. The slopes and the lengths of the pairs of segments are the same.
6. ( ) ( ) 2g x f x
7. The slopes and lengths will be the same under any vertical translation.
8.
9 ( ) ( 3)n x f x
10. ( ) ( 2)q x f x
11. The slopes are not affected by a horizontal or vertical translation.

TE
AC
HE
R
Teacher Overview – Transformations of Piecewise Functions
Copyright © 2012 Laying the Foundation®, Inc., Dallas, TX. All rights reserved. Visit us online at www.ltftraining.org. vi
12. ( ) ( )w x f x
13.
The signs on the x-values have all been changed to the opposite sign, but the y-values have
remained the same.
14. The lengths are the same, but the slopes have changed signs.
15. 4 5 3 2
16. The distance is the same since length remains constant when a graph is translated.
17. The distances remain the same in all cases. The slopes are the same for translations and have
the opposite sign for reflections. Reflection across a horizontal or vertical line will change
the sign of the slope.

Mathematics
Copyright © 2012 Laying the Foundation®, Inc., Dallas, TX. All rights reserved. Visit us online at www.ltftraining.org. 1
Transformations of Piecewise Functions
1. What is the slope of ( )f x for 0 2x ?
2. What is the length of the segment OA ?
3. Graph ( ) ( ) 1h x f x . Label the points on the new graph as , , , ,O A B C D .

Student Activity – Transformations of Piecewise Functions
Copyright © 2012 Laying the Foundation®, Inc., Dallas, TX. All rights reserved. Visit us online at www.ltftraining.org. 2
4. What is the slope of ( )h x for 0 2x ? Explain your reasoning.
5. Compare the slopes and lengths of the following pairs of segments:
and , and , and , as well as andOA O A AB A B BC B C CD C D .
6. The graph of h represents a translation of the graph of f up one unit. Write the equation of a
new function g whose graph is a translation of the graph of f two units down.
7. How will the lengths and slopes of the segments on the graph of g compare to those of
function f ? Generalize your statement for any function ( ) ( )z x f x k .
8. Draw the graph of a new function p that will translate the graph of f two units to the right.
The equation, in terms of f, for this new function is ( ) ( 2)p x f x .
9. Write an equation for a new function n in terms of f that will translate the graph of f three
units to the right.

Student Activity – Transformations of Piecewise Functions
Copyright © 2012 Laying the Foundation®, Inc., Dallas, TX. All rights reserved. Visit us online at www.ltftraining.org. 3
10. The function q is graphed. Write the equation of q in terms of f.
11. Use your results from the previous questions to make a conjecture about the slopes of
segments that are translated horizontally or vertically.
12. Draw a new function w that shows f reflected across the x-axis. Write an equation in terms
of f for w.

Student Activity – Transformations of Piecewise Functions
Copyright © 2012 Laying the Foundation®, Inc., Dallas, TX. All rights reserved. Visit us online at www.ltftraining.org. 4
13. Draw the graph of a new function r that will reflect f across the y-axis.
The equation, in terms of f, for this new function is ( ) ( )r x f x . Explain why –x has
replaced x in the equation.
14. Write a conjecture about the slopes and the lengths of corresponding segments that have been
reflected across an axis.
15. If a bug crawls along the graph of f beginning at point O and stopping at point D, how far
does the bug travel?
16. If the same bug crawls along the graph of any one of h(x), g(x), z(x), p(x), n(x), q(x), w(x), or
r(x), what statement can be made about the total distance that the bug will travel?
17. Summarize the behavior of slopes and lengths under any horizontal or vertical translation or
reflection.

TE
AC
HE
R
Mathematics
Copyright © 2012 Laying the Foundation®, Inc., Dallas, TX. All rights reserved. Visit us online at www.ltftraining.org. i
Analyzing Piecewise Functions
About this Lesson
This lesson encourages students to connect their previously-learned knowledge of piecewise
functions, area, and transformations. Working from a graph consisting of semi-circular and linear
pieces, with an accompanying table of values, students consider lines of symmetry, analyze the
effect of transformations on enclosed area, identify characteristics of the graph, write a piecewise
function for the graph, and determine slopes at specific points.
Prior to the lesson, students should be familiar with the vocabulary of domain, range, slope,
increasing/decreasing intervals, and absolute minimum/maximum. They should be able to
determine function values, interpret function transformations, use interval notation, and write
linear, absolute value, and circle equations.
This lesson is included in Module 1 – Analysis of Functions: Piecewise Graphs.
Objectives
Students will
analyze attributes of a piecewise function.
identify lines of symmetry.
determine the area of a region bounded by a piecewise function and the x-axis.
apply transformations to graphs of piecewise functions.
write the equation for a piecewise function.
apply the understanding that a tangent line is perpendicular to the radius of a circle at the
point of tangency to calculating the slope of a line at a point on a circle.
Level
Geometry
Common Core State Standards for Mathematical Content
This lesson addresses the following Common Core State Standards for Mathematical Content.
The lesson requires that students recall and apply each of these standards rather than providing
the initial introduction to the specific skill. The star symbol (★) at the end of a specific standard
indicates that the high school standard is connected to modeling.
Explicitly addressed in this lesson
Code Standard Level of
Thinking
Depth of
Knowledge
G-GPE.7 Use coordinates to compute perimeters of
polygons and areas of triangles and
rectangles, e.g., using the distance formula.★
Analyze III

TE
AC
HE
R
Teacher Overview – Analyzing Piecewise Functions
Copyright © 2012 Laying the Foundation®, Inc., Dallas, TX. All rights reserved. Visit us online at www.ltftraining.org. ii
Code Standard Level of
Thinking
Depth of
Knowledge
F-BF.3 Identify the effect on the graph of replacing
f(x) by f(x) + k, k f(x), f(kx), and f(x + k) for
specific values of k (both positive and
negative); find the value of k given the
graphs. Experiment with cases and illustrate
an explanation of the effects on the graph
using technology. Include recognizing even
and odd functions from their graphs and
algebraic expressions for them.
Analyze III
F-LE.2
(LTF extends
to piecewise
functions)
Construct linear and exponential functions,
including arithmetic and geometric sequences,
given a graph, a description of a relationship,
or two input-output pairs (include reading
these from a table).★
Analyze III
F-IF.4 For a function that models a relationship
between two quantities, interpret key features
of graphs and tables in terms of the quantities,
and sketch graphs showing key features given
a verbal description of the relationship. Key
features include: intercepts; intervals where
the function is increasing, decreasing,
positive, or negative; relative maximums and
minimums; symmetries; end behavior; and
periodicity.★
Apply II
A-CED.1 Create equations and inequalities in one
variable and use them to solve problems.
Include equations arising from linear and
quadratic functions, and simple rational and
exponential functions.★
Analyze III
A-CED.2 Create equations in two or more variables to
represent relationships between quantities;
graph equations on coordinate axes with
labels and scales.★
Analyze III
G-C.2 Identify and describe relationships among
inscribed angles, radii, and chords. Include
the relationship between central, inscribed,
and circumscribed angles; inscribed angles
on a diameter are right angles; the radius of a
circle is perpendicular to the tangent where
the radius intersects the circle.
Analyze III

TE
AC
HE
R
Teacher Overview – Analyzing Piecewise Functions
Copyright © 2012 Laying the Foundation®, Inc., Dallas, TX. All rights reserved. Visit us online at www.ltftraining.org. iii
Code Standard Level of
Thinking
Depth of
Knowledge
A-REI.11 Explain why the x-coordinates of the points
where the graphs of the equations y = f(x) and
y = g(x) intersect are the solutions of the
equation f(x) = g(x); find the solutions
approximately, e.g., using technology to
graph the functions, make tables of values, or
find successive approximations. Include cases
where f(x) and/or g(x) are linear, polynomial,
rational, absolute value, exponential, and
logarithmic functions.★
Apply II
G-CO.2 Represent transformations in the plane using,
e.g., transparencies and geometry software;
describe transformations as functions that take
points in the plane as inputs and give other
points as outputs. Compare transformations
that preserve distance and angle to those that
do not (e.g., translation versus horizontal
stretch).
Understand II
Common Core State Standards for Mathematical Practice
These standards describe a variety of instructional practices based on processes and proficiencies
that are critical for mathematics instruction. LTF incorporates these important processes and
proficiencies to help students develop knowledge and understanding and to assist them in
making important connections across grade levels. This lesson allows teachers to address the
following Common Core State Standards for Mathematical Practice.
Implicitly addressed in this lesson
Code Standard
1 Make sense of problems and persevere in solving them.
2 Reason abstractly and quantitatively.
4 Model with mathematics.
6 Attend to precision.
7 Look for and make use of structure.
8 Look for and express regularity in repeated reasoning.

TE
AC
HE
R
Teacher Overview – Analyzing Piecewise Functions
Copyright © 2012 Laying the Foundation®, Inc., Dallas, TX. All rights reserved. Visit us online at www.ltftraining.org. iv
LTF Content Progression Chart In the spirit of LTF’s goal to connect mathematics across grade levels, the Content Progression
Chart demonstrates how specific skills build and develop from sixth grade through pre-calculus.
Each column, under a grade level or course heading, lists the concepts and skills that students in
that grade or course should master. Each row illustrates how a specific skill is developed as
students advance through their mathematics courses. 6th Grade
Skills/Objectives
7th Grade
Skills/Objectives
Algebra 1
Skills/Objectives
Geometry
Skills/Objectives
Algebra 2
Skills/Objectives
Pre-Calculus
Skills/Objectives
Using a piecewise
graph involving a
real-world
application
(including rate
graphs), identify and
interpret the
meaning of x-
and/or y-
coordinates, domain
and/or range,
maximum and/or
minimums, and
intervals where the
graph is increasing
and/or decreasing.
(200_06.AF_A.01)
Using a piecewise
graph involving a
real-world
application
(including rate
graphs), identify and
interpret the
meaning of x-
and/or y-
coordinates, domain
and/or range,
maximum and/or
minimums, and
intervals where the
graph is increasing
and/or decreasing.
(200_07.AF_A.01)
Using a piecewise
graph involving a
real-world
application
(including rate
graphs), identify and
interpret the
meaning of x-
and/or y-
coordinates, domain
and/or range,
maximum and/or
minimums, and
intervals where the
graph is increasing
and/or decreasing.
(200_A1.AF_A.01)
For a continuous
piecewise function,
determine the x-
value given a
specific y-value or
the y-value given a
specific x-value, the
domain and/or range,
the maximums
and/or minimums,
and the intervals
where the graph is
increasing and/or
decreasing.
(200_GE.AF_A.01)
For a continuous or
discontinuous
piecewise function,
determine the x-
value given a
specific y-value or
the y-value given a
specific x-value, the
domain and/or range,
the maximums
and/or minimums,
and the intervals
where the graph is
increasing and/or
decreasing.
(200_A2.AF_A.01)
For a continuous or
discontinuous
piecewise function,
determine the x-
value given a
specific y-value or
the y-value given a
specific x-value, the
domain and/or range,
the maximums
and/or minimums,
and the intervals
where the graph is
increasing and/or
decreasing.
(200_PC.AF_A.01)
Write a piecewise
linear function
based on a graph.
(200_A1.AF_A.03)
Write a piecewise
function based on a
graph (may include
portions of a circle
and linear pieces).
(200_GE.AF_A.03)
Write a piecewise
function based on a
graph (may include
portions of a circle
and/or linear and
parabolic pieces).
(200_A2.AF_A.03)
Write a piecewise
function based on a
graph (may include
portions of conic
sections and/or
linear, rational, or
trigonometric
pieces).
(200_PC.AF_A.03)
Convert between
absolute value
functions and
piecewise linear
functions.
(200_A1.AF_A.04)
Convert between
absolute value
functions and
piecewise linear
functions.
(200_GE.AF_A.04)
Convert between
absolute value
functions and
piecewise linear
functions.
(200_A2.AF_A.04)
Convert between
absolute value
functions and
piecewise linear
function.
(200_PC.AF_A.04)
Examine the effects
of the transformation
af(x-c)+d on a
continuous piecewise
function including
effects on area.
(200_GE.AF_A.05)
Examine the effects
of the transformation
af(x-c)+d on a
continuous or
discontinuous
piecewise function.
(200_A2.AF_A.05)
Examine the effects
of the transformation
af(b(x-c))+d and
f(|x|) on a continuous
or discontinuous
piecewise function.
(200_PC.AF_A.05)
Determine the slope
at points on a
piecewise function
(may include
portions of a circle
and linear pieces).
(200_GE.AF_A.06)
Determine the slope
at points on a
piecewise function
(may include
portions of a circle
and linear pieces).
(200_A2.AF_A.06)
Determine the slope
at points on a
piecewise function
(may include
portions of a circle
and linear pieces).
(200_PC.AF_A.06)

TE
AC
HE
R
Teacher Overview – Analyzing Piecewise Functions
Copyright © 2012 Laying the Foundation®, Inc., Dallas, TX. All rights reserved. Visit us online at www.ltftraining.org. v
Connection to AP*
AP Calculus Topic: Analysis of Functions: Piecewise Graphs
*Advanced Placement and AP are registered trademarks of the College Entrance Examination Board.
The College Board was not involved in the production of this product.
Materials and Resources
Student Activity pages
Patty paper (optional)
Applet for exploring parameters in piecewise functions:
http://www.mathdemos.org/mathdemos/piecewise/Examples/Java_continuity.html
LTF video clips on creating piecewise functions on the TI-84 and TI-Nspire
Assessments
The following formative assessment is embedded in this lesson:
Students engage in independent practice.
The following additional assessments are located on the LTF website:
Analysis of Functions: Piecewise Graphs – Geometry Free Response Questions
Analysis of Functions: Piecewise Graphs – Geometry Multiple Choice Questions.
Teaching Suggestions
This lesson provides teachers with an excellent way to have students apply previously learned
knowledge and skills to a new situation. The use of a piecewise function allows for review of
various function types within a single activity. Teachers may choose to separate the activity into
sections, as appropriate. Questions 1 – 5, 6 – 13, 14 – 18, and 19 – 21 are closely related and
form coherent sections.
When students are asked to determine the maximum or the minimum value of the function,
explain that the question asks for the largest or the smallest y-value of the function and not for
the coordinates of a point. The x-coordinate indicates where or when the maximum/minimum
value occurs, while the y-coordinate identifies the maximum or minimum value of the function.
The same maximum or minimum y-value may occur at more than one point. All area calculations
can be determined using formulas for typical geometric shapes.
Teachers may want to use patty paper or make two transparency copies of the graphs so that the
reflections can be seen easily. Students should NOT use calculators in this lesson and, therefore,
should leave area answers in terms of .

TE
AC
HE
R
Teacher Overview – Analyzing Piecewise Functions
Copyright © 2012 Laying the Foundation®, Inc., Dallas, TX. All rights reserved. Visit us online at www.ltftraining.org. vi
Modality
LTF emphasizes using multiple representations to connect various approaches to a situation in
order to increase student understanding. The lesson provides multiple strategies and models for
using these representations to introduce, explore, and reinforce mathematical concepts and to
enhance conceptual understanding.
P – Physical
V – Verbal
A – Analytical
N – Numerical
G – Graphical

TE
AC
HE
R
Teacher Overview – Analyzing Piecewise Functions
Copyright © 2012 Laying the Foundation®, Inc., Dallas, TX. All rights reserved. Visit us online at www.ltftraining.org. vii
Answers
1. semicircle; isosceles triangle; trapezoid
2. 21 1 1 9 13(3) (2)(4) (1)(4 1) square units
2 2 2 2 2A
3. on [–3, 3], x = 0; on [3, 5], x = 4; on [5, 9] and on [–3, 9], no line of symmetry
4. divides the area in half
5. semicircle
6. 9 13
square units2 2
7. circle, rhombus, irregular hexagon
8. 9 13
2 = 9 13 square units2 2
9. 9 13
2 = 9 13 square units2 2
10. 9 13
4 = 18 26 square units2 2
11. The area between p(x) and the x-axis is the area between the graph of f(x) and the x-axis
multiplied by a.
12. 9 13 9 37
+(12)(1)= square units2 2 2 2
13. 9 13 9 37
+(12)(1)= square units2 2 2 2
14. [0, 3] [4, 5] [7, 9]
15. [–3, 0] [3, 4] [5, 6]
16. 4
17. –3; 3; 5; 9
18. 8

TE
AC
HE
R
Teacher Overview – Analyzing Piecewise Functions
Copyright © 2012 Laying the Foundation®, Inc., Dallas, TX. All rights reserved. Visit us online at www.ltftraining.org. viii
19.
29 , 3 3
4 | 4 | 4, 3 5
( ) 5, 5 6
1, 6 7
1( 9), 7 9
2
x x
x x
f x x x
x
x x
20. 2
35x ;
8
74 ;
13
8 ;
2
15 ; 8
21. (3.5, 2); slope = 4 (4.5, 2); slope = − 4
(6.213, 1); slope = 0 4 3
7 ,5 5
; slope = 1
2
(–3, 0); slope does not exist (0, 3); slope = 0

Mathematics
Copyright © 2012 Laying the Foundation®, Inc., Dallas, TX. All rights reserved. Visit us online at www.ltftraining.org. 1
x
y
-4 -2 2 4 6 8 10
-4
-2
2
4
0
Analyzing Piecewise Functions
Use the graph of ( )y f x and the table of values to answer the questions.
1. Classify each of the geometric figures formed between the graph of ( )f x and the x-axis.
2. What is the total area enclosed by the graph of ( )f x and the x-axis?
3. Give the equation for each line of symmetry, if one exists, on the following intervals of the
graph of ( )f x .
[ 3, 3] _________ [3, 5] __________ [5, 9]__________ [ 3, 9] _________
4. For each of the intervals in question 3, how do the lines of symmetry divide the area between
the graph of ( )f x and the x-axis?
5. A vertical line x k divides the area enclosed between the graph of ( )f x and the x-axis into
two equal parts. Which geometric figure does this line intersect?
x ( )f x
-3 0
0 3
3 0
4 4
5 0
6 1
7 1
9 0

Student Activity – Analyzing Piecewise Functions
Copyright © 2012 Laying the Foundation®, Inc., Dallas, TX. All rights reserved. Visit us online at www.ltftraining.org. 2
6. If ( ) ( )g x f x , determine the total area between the graph of ( )g x and the x-axis.
7. Classify each of the geometric figures formed between the graphs of ( )f x and ( )g x .
8. What is the area enclosed by the graphs of ( )f x and ( )g x ?
9. If ( ) 2 ( )h x f x , what is the total area between the graph of ( )h x and the x-axis?
(Hint: The figure between 3x and 3x is now half of an ellipse with a semi-major axis
of 6a and a semi-minor axis 3b . The area of an ellipse is calculated by the formula
A ab , where a and b are the semi-major and semi-minor axes lengths.)
10. If ( ) 4 ( )r x f x , what is the total area between the graph of ( )r x and the x-axis?
11. Compare the area between the graph of ( )f x and the x-axis to the area between the graph of
( )p x and the x-axis, where ( ) ( )p x a f x , 0a .
12. What is the total area bounded by the graph of ( )f x , and the lines 1y , 3x , and
9x ?
13. If ( ) ( ) 1q x f x , what is the total area bounded by ( )q x , the x-axis, 3x , and 9x ?

Student Activity – Analyzing Piecewise Functions
Copyright © 2012 Laying the Foundation®, Inc., Dallas, TX. All rights reserved. Visit us online at www.ltftraining.org. 3
14. On what intervals is ( )f x decreasing?
15. On what intervals is ( )f x increasing?
16. What is the absolute maximum value of ( )f x ?
17. What is the x-coordinate(s) where the absolute minimum value of ( )f x occurs?
18. If ( ) 2 ( )g x f x , what is the absolute maximum value?
19. Write the equation for ( )f x using five equations.
(Hint: Write an equation involving absolute value for the portion of the function between
3x and 5x .)
_________________________,____________________
________________________,____________________
________________________,____________________
________________________,____________________
________________________,____________________
)(xf
20. What is x when1
( )2
f x ?

Student Activity – Analyzing Piecewise Functions
Copyright © 2012 Laying the Foundation®, Inc., Dallas, TX. All rights reserved. Visit us online at www.ltftraining.org. 4
21. Determine the slope at each of the following points on the graph of f(x). If the point is on the
semicircle, the slope will be the same as the slope of the tangent line to the semicircle at that
point.
(3.5, _____); slope = _________ (4.5, _____); slope = _________
(6.213, _____); slope = ________ 4
7 , _____5
; slope = ________
(–3, ______); slope = ________ (0, ______); slope = _________

Sample Algebra I Activity Topic I - Functions
Topic I – Algebra 1
a) Write a scenario that matches the given piecewise function (f).
b) Determine the domain, range, and the equation for each interval of the function f.
Write your domain and range in both inequality and interval notations (see
attached activity sheet).
c) Based on the graph of f, which of the following can be represented by the range
of f? Justify your answer.
i. Distance from home
ii. Time lapsed
iii. Speed
iv. Displacement
v. Velocity
d) Use colored pencils to graph the function |f| on the same Cartesian plane.
(x)
f(x)

Sample Algebra I Activity Topic I - Functions
Topic I – Algebra 1
Linear Functions, Part B
Line Segment
Slope
y
x
Equations Domain (D) and Range (R)
(Interval notation)
Point-slope form y – y1 = m(x – x1)
Slope-intercept form y = mx + b
D R
1
2
3
4
5
6
7
8
9
Computation Area: Use the point-slope equation to produce the slope-intercept equation. Show your work.
Plot the piecewise graph of f on your calculator for the given domains.

Topic I –Algebra II
Mathematics Portfolios
A portfolio is a long-term project of student-selected work and reflections. Students justify each piece of
work. They include a letter to the reader establishing the writer’s mathematical background, a “banner
statement,” and organize the selections into a meaningful whole. Teaching writing is not in this
assignment; rather, it is an assessment tool. Questions to guide students’ writing include:
1. “Describe the overall pattern of...”
2. “Explain why… justify your statements.”
3. “Investigate each of the variables in this problem and comment on anything that is unusual.”
4. “What can improve this model?”
Listed are additional resources for developing portfolios:
Math Portfolios, TeacherVision, http://www.teachervision.fen.com/math/teaching-methods/6380.html
Using Writing and Mathematics Portfolios to Improve Student Learning, Vermont Department of Education
http://education.vermont.gov/new/pdfdoc/pgm_curriculum/using_portfolios_math_writing.pdf
Planning for Portfolio Development, Maricopa County Community College District Teacher Education
Programs
Portfolio for Student Growth, Gallaudet University,
http://www.gallaudet.edu/clerc_center/information_and_resources/info_to_go/transition_to_adulthood/port folios_for_student_growth.html
Student Portfolios, University of Michigan, (See PowerPoint at end of page for guidelines)
http://www-personal.umich.edu/~espring/ePort/stuPfolios.html
Web-based portfolios are very popular, but developing them may take time and instruction. Many online
templates for portfolios are free. Consider allowing students the option to develop an online portfolio that
meets the same criteria as the paper portfolios of other students.

Notes to the Teacher
Materials One copy of Blackline Master
B30a per group Transparency of Blackline Master
B30b Pattern Blocks (yellow hexagons) Ruler with customary scale Markers Graph paper (1” squares)
These terms should be familiar; however, a short review might be appropriate at this time to remind students of the concept of dependent vs. independent variables. Real-world examples such as “The amount of money I get paid for babysitting is dependent upon the number of hours I work” are helpful for reinforcing the concepts. Here, “the number of hours I work” is the independent variable and the “amount of money I get paid” is the dependent variable.
A30 Short Stack, Please! Activity One
Divide the class into small groups and give each group a set of pattern blocks (or just yellow hexagons), a ruler with a customary scale (inches), markers, and graph paper.
Explain to the students that they will be using the following procedure for collecting data using the handout (B30a): • Stack one group of 4 hexagon-shaped pattern blocks (one on
top of the other)• Record the height of the stack (to the nearest half-inch) in the
data table of the handout.• Stack a second group of 4 pattern blocks on top of the first group• Record the height of the entire stack (to the nearest half-inch).• Continue the same process to fill the data table.• Graph the resulting ordered pairs on a sheet of graph paper.• Display your group’s graph on the classroom wall.• Conduct a gallery walk: students observe the posted graphs,
and write down how the graphs are alike and different.• Answer the questions at the bottom of the handout.
Display a transparency of the Blackline Master (B30b) on the overhead and record the student’s data. Debrief the whole class by discussing the questions on the student handout and other questions such as: • Which are the dependent and independent variables in the data?• Do we want to use the number of groups of hexagons to
determine the height of the stack?• Do we want to use the height of the stack to determine the
number of groups of hexagons?(since we are controlling the number of groups of hexagons that are used and then observing what the result is for the height, we are using the number of groups (independent variable) to determine the height (dependent variable.)
• What are some other examples of dependent and independentexpressions that we can generate?
Answers to B30a: # of
Groups of Hexagons
Process (height of stack in inches)
Height of Stack
(inches)
1 1.5(1) 1.52 1.5(2) 3.03 1.5(3) 4.54 1.5(4) 6.05 1.5(5) 7.56 1.5(6) 9.07 1.5(7) 10.510 1.5(10) 15.020 1.5(20) 30.025 1.5(25) 37.5g 1.5(g) h
a. These ratios are all equivalent to 1.5 inches per group of hexagons.b. The graph of a proportional relationship is a straight line through the origin.c. h = 1.5gd. Find the height of any number of groups of four hexagons in a
stack by multiplying the number of groups in the stack by the constant of proportionality, 1.5.

Notes to the Teacher Answers to B30a (continued): e, f, and g. Students must use the proportional relationship of the number of
groups of hexagons to the height of the stack to determine the height of one block without measuring. Have the students share their procedures for doing this, for there may be several strategies. For example, students may reason that if there are 8 hexagons in 3 inches, each hexagon must be 3
8 inches
high; or students may express the relationship in a ratio 1.5 inches4 hexagons or
3 inches8 hexagons and then use division to express that ratio in an equivalent form
of 0.375 inches/hexagon. Students may reason that 1.5 inches per 4 hexagons = 0.75 inches per 2 hexagons = 0.375 inches per 1 hexagon; or students may use their graphic representation to
determine that when g is 14 group (or 1 hexagon), then h is 3
8 = 0.375 inch. In each of these strategies, the result is that h = 0.375n, where h is the height of the stack, n is the number of hexagons, and 0.375 is a new constant of proportionality describing the relationship of each hexagon to the height of the stack.
In the equations, h = 1.5g and h = 0.375n, 1.5 and 0.375 are called the constants of proportionality. Writing an equation helps to symbolically represent a proportional relationship. We can say that the height of the stack is proportional to the number of hexagons in the stack.
By using the equation h = 0.375n, we can find that 50 hexagons are 18.75” high and 100 should be double that or 37.5” high.
Answers to B30b:
Number of hexagons
Hei
ght i
n in
ches
1
2
3
45
6
78
9
10
1 2 3 4 5 6 7 8 9 10
••
••
a. This graph represents a proportional relationship because the points lie on astraight line that passes through the origin.
b. A stack whose height is 9” tall contains 24 hexagons.c. I would estimate about 54” tall for the height of 150 hexagons using the
information from the previous problem. If 24 hexagons measure 9” in height and there are approximately 6 groups of 24 hexagons in 150, then I can multiply 9” by 6 to get about 54”. By multiplying 150 by the actual height of 0.375”, I get 56.25”. Ask if anyone solved this using a different strategy.
d. Again, I could use the knowledge of a above: 24 hexagons are 9” tall. Thereare about 3 groups of 9” in 26 1
2 “. Therefore, 3 times 24 hexagons is 72 hexagons. This number will be slightly higher than the actual number. Next, I could multiply 0.375 times 71 to get 26.625 and then multiply 0.375 times 70 to get 26.25. Or, I could use the table feature of a graphing calculator

Notes to the Teacher Answers to B30a (continued):
and scroll to determine this. Since I only have 26 12 to accommodate a
stack of hexagons, the stack can contain at most 70 hexagons. Ask if anyone used different reasoning to determine this solution.
e. h is also doubled. A stack of 23 hexagons will be 8.625 inches in height.f. The stack will have a height equal to a whole number of inches for 8, 16,
24, 32, 40, … or multiples of 8 because 0.375 = 38 and 3
8 times anymultiple of 8 will give a whole number.
g. Yes, it is possible for a stack of 28 hexagons to have a height of exactly10.5”, but it is not possible to have a height of exactly 5”. Using the tableon a graphing calculator, one can scroll to find that 13 hexagons has aheight of 4.875” and 14 hexagons has a height of 5.25”.
Source: Middle School TEXTEAMS: Proportionality Across the TEKS
Materials Copies of Blackline Master B31a,
one per group Transparency of Blackline Master
B31b Styrofoam cups of one size Rulers with metric scales Graph paper (1" squares)
Allow time for the students to discuss the differences between the previous activity’s proportional relationship and the non-proportional relationship observed in this activity.
Answers to B31b: a. The graph of this line does
not pass through the origin. b. This graph represents a non-
proportional relationship since it is the graph of an equation that is not of the form y = kx.
c. Answers will vary accordingto the size of the Styrofoam cup used.
d. Answers will vary.
A31 Short Stack, Please! Activity Two
Give each group of students a set of styrofoam cups, a ruler with a metric scale (cm), markers, graph paper, and a copy of the handout, Short Stack, Please! Activity 2 (B31a).
Demonstrate to students the process of stacking the cup with the rim down on a flat surface and measuring the height, recording each measurement on the table in the handout (B31a).
When all the data has been collected, the students should graph their results and post them as in the previous activity.
In a debriefing session, use the questions on Transparency 2 (B31b) to discuss the graphic representation of the data. Ask students to discuss other ways one could determine if this situation of nested cups represents a proportional or non-proportional relationship.
Answers to B31a: a and b. Answers will vary according to the size of the cups. c. The equation will be of the form h = an + b.d. Have students cut out a cross section of a cup that is stacked on
top of another cup.
(8.5 oz. Styrofoam cups)
Ask them to explain the “a” and “b” in their equation as represented in their model.
For example, in the model above, the equation is y = 1.5x + 7.5.
1.5 cm represents the space between the top of the bottom cup and the cup stacked on top. It is also the distance between the table and rim of the cup on top. The constant 7.5 is the distance between the rim of the cup on top and the top of the cup on bottom as illustrated. This distance stays the same no matter how many cups are stacked.
Source: Middle School TEXTEAMS: Proportionality Across the TEKS

B30a Short Stack, Please!
Put your yellow hexagon-shaped Pattern Blocks in groups of four and stack them, one group at a time, recording the height to the nearest half-inch in the table below.
Number of Groups of Hexagons
Process (height of stack in inches)
Height of Stack (in inches)
1
2
3
4
5
6
7
10
20
25
g
a. How can you use your table to determine if this situation is a proportionalrelationship?
b. How can you use the graph to determine if this situation is a proportionalrelationship?
c. Write an equation for finding the height of any number of stacks, g.d. How can you use the equation to recognize a proportional relationship? Explain.e. Determine the height of 1 Pattern Block without measuring. Explain how you did this.f. Write an equation for finding the height of any number, n, of Pattern Blocks without
measuring. g. What is the height of 50 blocks? 100 blocks? What equation did you use? Why?

B30b Short Stack, Please! Transparency
Number of hexagons
Hei
ght i
n in
ches
1
2
3
45
6
78
9
10
1 2 3 4 5 6 7 8 9 10
a. Does this graph represent a proportional relationship? Explain.b. Use your graph to determine the number of blocks in a stack whose height is 9” tall.c. Suppose this graph were to continue. What do you predict the height of 150
hexagons will be? How could you determine this?
d. How many hexagons in a single stack would fit in a space 26 12 inches high? Explain
how you would determine this.e. What happens to h if you double n in the equation h = 0.375n? Graph the equation h
= 0.375n or y = 0.375x on a graphing calculator. Use the trace feature to determine the height of a stack of 23 hexagons.
f. Next, use the table feature on your calculator to determine numbers for which thestack of hexagons will have a height equal to a whole number in inches.
g. Is it possible for a stack of hexagons to have a height of exactly 10.5 inches? 5 inches? Use a diagram to explain. What other strategies could you use to answer these questions? Explain.

B31a Short Stack, Please!
Place one Styrofoam cup with open end down on a flat surface and measure the height of the cup in cm. Place a second cup on top so that the cups are nested and measure the height of the stack. Continue stacking cups one at a time taking measurements to the nearest cm after each cup is added to the stack. Use the table below to record your results.
Number of Cups Process (height in cm)
Height in cm
1
2
3
4
5
6
10
37
n h
a. What do you predict the height of 50 cups to be in cm? Explain your reasoning.
b. How could you determine the height of 100 cups? n cups?
c. Write an equation for finding the height of n cups.
d. Explain the connection between the cups stacked and your equation.

B31b Short Stack, Please! Transparency
Use the data collected from the previous activity to make a graph and answer the
questions below.
Number of cups
Hei
ght i
n cm
a. How does this graph differ from the graph from Activity 1?
b. Does this graph represent a proportional or non-proportional relationship? Explain.
c. Enter the equation for this relationship in a graphing calculator and use tbl set to set
the initial value for x at 0 and ∆ tbl at 1. Leave the other settings on auto.
d. Next, key in 2nd table to view a table of values for this function. Use the arrow keys to
scroll the table to answer the following questions: What would be the height of 150
cups? Is this twice the height of 75 cups? Explain. If you know the height of 30 cups,
can you predict the height of 120 cups? Why or why not?

© 2
010
Colle
ge B
oard
. All
righ
ts re
serv
ed.
150 SpringBoard® Mathematics with Meaning™ Algebra 1
My Notes
Piecewise Linear Functions ACTIVITY 3.1continued Breakfast for BowserBreakfast for Bowser
SUGGESTED LEARNING STRATEGIES: Predict and Confirm, Group Presentation
22. Th e vet has a German Shepard named Max, and Miriam knows that the vet feeds Max 63 ounces of food each day. Miriam also knows that the vet feeds her cocker spaniel named Min 32 ounces of food each day. If the two dogs are being correctly fed, what is each dog’s weight? Show your work and explain your reasoning.
Write your answers on notebook paper. Show your work.
CHECK YOUR UNDERSTANDING
Write your answers on notebook paper or grid paper. Show your work.
Th ese tables represent the parts of a piecewise defi ned function.
x y x y0 0 6 91 0.5 7 102 1 8 113 1.5 9 124 2 10 135 2.5 11 14
1. What is the function that represents the data in the fi rst interval? What is the domain?
2. What is the function that represents the data in the second interval? What is the domain?
Use this piecewise defi ned function for Items 3–5.
f (x) = { x2 - 1, if x < 1 x + 2, if x ≥ 1
3. What is the domain for the fi rst part of the function?
4. What is the domain for the second part of the function?
5. Sketch a graph of the function. Do the two pieces connect at x = 1? Why or why not?
6. MATHEMATICAL R E F L E C T I O N
How do piecewise defi ned functions diff er
from functions you have previously learned? What questions do you still have about piecewise defi ned functions?
143-150_SB_A1_3-1_SE.indd 150143-150_SB_A1_3-1_SE.indd 150 1/7/10 12:20:28 PM1/7/10 12:20:28 PM

150 SpringBoard® Mathematics with Meaning™ Algebra 1
© 2
010
Col
lege
Boa
rd. A
ll rig
hts
rese
rved
.
ACTIVITY 3.1 Continued
l Debriefi ng, Predict and Confi rm, Group PresentationThe solution can be found in a number of different ways. Encouraging students to share their methods will help you develop a more student-centered classroom, and sharing multiple representations will allow students to see different methods and increase the number of tools they have available to solve problems.
Suggested Assignment
CHECK YOUR UNDERSTANDING p. 150, #5–6
UNIT 3 PRACTICEp. 195, #5–7
1. y = 0.5x; 0 ≤ x ≤ 5
2. y = x + 3; 6 ≤ x ≤ 11
3. All real numbers such that x is less than 1.
4. All real numbers such that x is greater than or equal to 1.
5.
No, there is a gap; explanations will vary. (This is a connection to the concept of continuity in AP Calculus.)
6. Answers may vary based on student understanding and concerns.
8
6
4
2
–8 –6 –4 –2 2 4 6 8–2
–4
–6
–8
y
x
© 2
010
Colle
ge B
oard
. All
righ
ts re
serv
ed.
150 SpringBoard® Mathematics with Meaning™ Algebra 1
My Notes
Piecewise Linear Functions ACTIVITY 3.1continued Breakfast for BowserBreakfast for Bowser
SUGGESTED LEARNING STRATEGIES: Predict and Confirm, Group Presentation
22. Th e vet has a German Shepard named Max, and Miriam knows that the vet feeds Max 63 ounces of food each day. Miriam also knows that the vet feeds her cocker spaniel named Min 32 ounces of food each day. If the two dogs are being correctly fed, what is each dog’s weight? Show your work and explain your reasoning.
Write your answers on notebook paper. Show your work.
CHECK YOUR UNDERSTANDING
Write your answers on notebook paper or grid paper. Show your work.
Th ese tables represent the parts of a piecewise defi ned function.
x y x y0 0 6 91 0.5 7 102 1 8 113 1.5 9 124 2 10 135 2.5 11 14
1. What is the function that represents the data in the fi rst interval? What is the domain?
2. What is the function that represents the data in the second interval? What is the domain?
Use this piecewise defi ned function for Items 3–5.
f (x) = { x2 - 1, if x < 1 x + 2, if x ≥ 1
3. What is the domain for the fi rst part of the function?
4. What is the domain for the second part of the function?
5. Sketch a graph of the function. Do the two pieces connect at x = 1? Why or why not?
6. MATHEMATICAL R E F L E C T I O N
How do piecewise defi ned functions diff er
from functions you have previously learned? What questions do you still have about piecewise defi ned functions?
Since Max receives 63 ounces of dog food, Max must be a large dog; solving the equation 63 = 0.1w + 50 for w, w = 130 pounds. Since Min receives 32 ounces of food, Min must be a mid-size dog; solving the equation 0.5w + 10 = 32 for w, w = 44 pounds.
143-150_SB_A1_3-1_SE.indd 150 1/6/10 12:37:21 PM
143-150_SB_A1_3-1_TE.indd 150143-150_SB_A1_3-1_TE.indd 150 2/9/10 6:52:34 PM2/9/10 6:52:34 PM