Advanced Monitoring System for Health Assessment of ... · PDF fileHealth Assessment of...
47
1 Advanced Monitoring System for Advanced Monitoring System for Health Assessment of Overhead Health Assessment of Overhead Transmission Lines Transmission Lines Prof. Rahmat A. Shoureshi Power Systems Engineering Research Center (PSERC) Colorado School of Mines [email protected] © 2002 Colorado School of Mines
Transcript of Advanced Monitoring System for Health Assessment of ... · PDF fileHealth Assessment of...

1
Advanced Monitoring System for Advanced Monitoring System for Health Assessment of Overhead Health Assessment of Overhead
Transmission LinesTransmission Lines
Prof. Rahmat A. ShoureshiPower Systems Engineering Research
Center (PSERC)Colorado School of Mines
[email protected]© 2002 Colorado School of Mines

2
AcknowledgementAcknowledgementThis project has been supported by:This project has been supported by:
• Electric Power Research Institute- Ray Lings
• Electric de France- Michele Gaudry
• Nebraska Public Power District- David Wolff
• Tri-State Generation & Transmission- Art Mander
• Western Area Power Administration- Paulette Kaptain

“SENSORS”“SENSORS”
Essential Elements For Enhancing System Intelligence
3

PSERC Research PSERC Research Thrusts at CSMThrusts at CSM
Intelligent Control Advanced Sensing
Diagnostics PredictiveMaintenance
Large Scale System Analysis
4

Initial Problem: Integrity of Ground RisersInitial Problem: Integrity of Ground Risers
IntelligentData
Analysis
Sensory Inputs
Information
5

PowerEquipment
PowerPowerEquipmentEquipment
RiserConnection
RiserRiserConnectionConnection
GroundMat GridGroundGround
Mat GridMat Grid
EMAT’sEMAT’sEMAT’sInitialPulse
Defect
Riser
ReflectionPulse from
Defect
Portion ofPulse which
Passes Defect
ReflectionPulse from
Thermoweld
EMAT Transducer ConceptEMAT Transducer Concept
6

7
Torsional Mode in CylindersTorsional Mode in Cylinders
NSNSNS
FB
I

8
Torsional Modes
First Order Second Order
twonodes
singlenode
Zero OrderNodes are zero crossings in a Bessel function
9
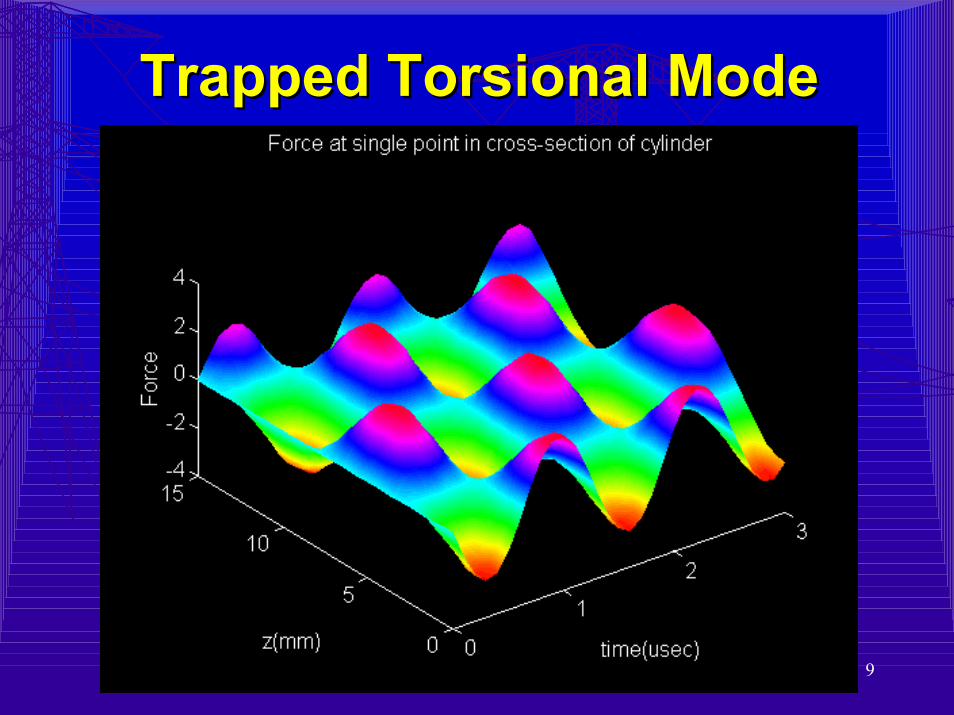
Trapped Torsional ModeTrapped Torsional Mode

10
Experimental SetupExperimental Setup
EMAT Pulser/Receiver
Oscilloscope Signal Generator
ReceiverFilter
Activation Pulse
DrivingCycles
Driving Signal
ReceivedSignal
Signature

11
Clean Sample
-0.3
-0.2
-0.1
0
0.1
0.2
0.3
-0.0005 -0.0004 -0.0003 -0.0002 -0.0001 0 0.0001
time (sec)
Volts
TX RX
1
1
2 3 4 5 6
2 TX RX
3 TX RX
4 TX RX
5 TX RX
TX RX6
R. A. SHOURESHI 9-27-99

12
Early Experimental ResultsEarly Experimental ResultsSignal from Damaged Conductor
-0.25-0.2
-0.15-0.1
-0.050
0.050.1
0.150.2
0.25
3.00E-04 4.00E-04 5.00E-04
Time (us)
Am
plitu
de (V
)
Transducersapplied Here
Signal moves down conductorand reflects off of damage

13
Perpendicular Cut
Clean Sample
-0.3
-0.2
-0.1
0
0.1
0.2
0.3
-0.0005 -0.0004 -0.0003 -0.0002 -0.0001 0 0.0001
time (sec)
Vol
ts
10% Cut Perpendicular to Riser Axis
-0.3
-0.2
-0.1
0
0.1
0.2
0.3
-0.0005 -0.0004 -0.0003 -0.0002 -0.0001 0 0.0001
Time (sec)
Vol
ts
25% Cut Perpendicular to Riser Axis
-0.3
-0.2
-0.1
0
0.1
0.2
0.3
-0.0005 -0.0004 -0.0003 -0.0002 -0.0001 0 0.0001
Time (sec)
Vol
ts
50% Cut Perpendicular to Riser Axis
-0.3
-0.2
-0.1
0
0.1
0.2
0.3
-0.0005 -0.0004 -0.0003 -0.0002 -0.0001 0 0.0001
Time (sec)
Volts
R. A. SHOURESHI 9-27-99

14

15
Broken Strands in ACSRBroken Strands in ACSR

16
RESEARCH OBJECTIVE:
The main objective of this study is to develop a robust,
portable, intelligent monitoring and diagnostic system
for the health assessment of ACSR strands
in energized transmission lines.

17
A Monitoring System Should Be:A Monitoring System Should Be:• Robust to operating and environmental
conditions• Intelligent to analyze data and provide
useful information • Stable enough as to not set false alarms• Easy to use (user friendly)

18
A Monitoring System Should Be:A Monitoring System Should Be:(continued)(continued)
• Portable• Easily attachable and detachable• Capable of providing adequate bandwidth• Inexpensive

19
Causes of DamageCauses of Damage
• Aeolian Vibration• Galloping• Turbulent Winds• Ice Loading• Other

20

21

22

23
Present available tools and techniques suffer from
-Accuracy
-Reliability
-Complexity
-Cost
-Required Training

24
Technical ApproachTechnical Approach
• Mathematical Analysis• System Design• Laboratory Experimental Design and
Construction• Field Tests

Mathematical Modeling and Mathematical Modeling and Analysis Analysis
22

26
Analytical Modeling Analytical Modeling ––Equations of MotionEquations of Motion
• Consider a straight section of wire rope loaded simultaneously in both tension and torsion:
• where f is the external force and q is the external moment (both per unit of stressed rope lengths)
C
T + T
C + C
f
q
Tz
uS
S

27
Orthotropic Sheet Orthotropic Sheet (Layers of Wires) Model(Layers of Wires) Model
1’
2’
1
Cable Axis
α
Strand Axis
Normal AxisWire Strands 2
Orthotropic Sheet parallelwith the Strand axis

28
Interwire/Interlayer Interwire/Interlayer Contact ForcesContact Forces
BB
B
B B
B
A
A
A
A
A
A
Line Contact within Layer
A
A
BA
Cross Section Diagramof Wire Rope
Trellis Contact between Layers

29
θ : Angle Disp.P : Axial Force
δ : Axial Disp.
αi : i th Strand Lay Angle
Ri : Herical Radius
T : Torsional Moment
Fs,i : i th Strand Force Component
Fs : Total Force induced by Strandsa i : Net Area of i th StrandE i : Young’ Modulus of i th Strandε s,i : Strain of i th Strand
∑ ∑= =
==n
i
n
iisiiiss EaFF
1 1,, ε
+
=
λλθααδαε iiiiis R cossincos 2
,

30
Axial Force, AAxial Force, A11 and Aand A22
∑
∑
∑
=
=
=
=
=
+
==
n
iiiiii
n
iiii
n
iiis
REaA
EaA
AAFP
1
22
1
31
121,
sincos
cos
cos
αα
α
θδαλλ

31
Torsional Moment, ATorsional Moment, A33 and Aand A44
+
=
+=∑
= λλλθδθα 43
1, sin AAGJFRT
n
iiiiisi
( )∑
∑
=
=
+=
=
n
iiiiiiii
n
iiiiii
GJREaA
REaA
1
224
1
23
sincos
sincos
αα
αα
Ji : Polar Moment of InertiaGi : Shear Modulus

32
Formulas for Formulas for Constitutive ConstantConstitutive Constant
∑
∑
∑
∑
=
=
=
=
=
=
=
+
=
n
iiii
n
iiiii
n
iiiii
corecore
n
iii
kRaA
lkRaA
lkRaA
EakaA
1,66
24
1,163
1,612
1,111
4
4
4
4
π
π
π
π
)11(:::
::
::
,66
,16
,61
,11
ordirectionlayWireldirectionShearinStiffnessk
StiffnessCoupledkdirectionShear
AxialinStiffnessCoupledkdirectionAxialinStiffnessk
RadiusHelicalRAreaNetWireEacha
i
i
i
i
i
i
i
−

Experimental Analysis of ACSRExperimental Analysis of ACSR
33

34
Experimental SystemExperimental System

35
Armor rod
3 cuts & 2 semi-cuts
6 cuts &4 semi-cuts
Abnormal conductor
Normal conductor
1 foot
Transmitter
Receiver
Shoe Aluminum conductor
Experimental Experimental Setup in the LabSetup in the Lab

36

370 2 4 6 8 10 12 14 16 18 20
x 10-4
-0.3
-0.2
-0.1
0
0.1
0.2
0.3
Signal of Bare Conductor
Time (sec)
Amplitude

380 2 4 6 8 10 12 14 16 18 20
x 10-4
-0.3
-0.2
-0.1
0
0.1
0.2
0.3
Signal of Bare Conductor with Small Cut
Time (sec)
Amplitude
390 2 4 6 8 10 12 14 16 18 20
x 10-4
-0.3
-0.2
-0.1
0
0.1
0.2
0.3
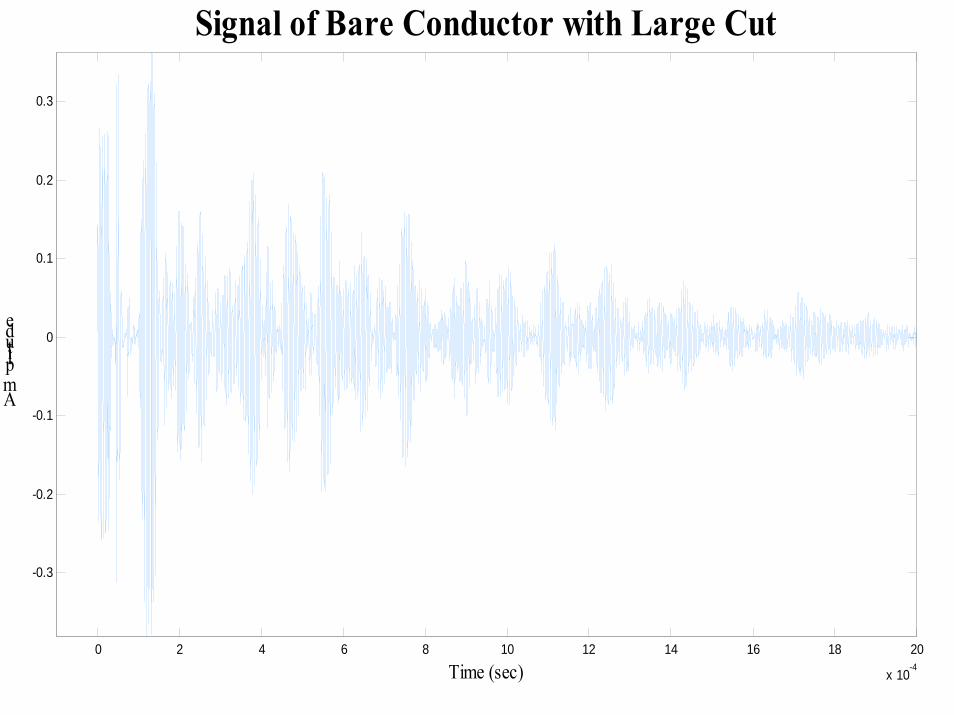
Signal of Bare Conductor with Large Cut
Time (sec)
Amplitude

400 2 4 6 8 10 12 14 16 18 20
x 10-4
-0.3
-0.2
-0.1
0
0.1
0.2
0.3
Bare Conductor Signal Comparison
Time (sec)
Amplitude
Conductor with Small CutBare Conductor

410 2 4 6 8 10 12 14 16 18 20
x 10-4
-0.3
-0.2
-0.1
0
0.1
0.2
0.3
Comparison with Larger Cut
Time (sec)
Amplitude
Conductor with Large CutConductor with Small CutBare Conductor

42
Field TestsField Tests
• Tri- State Transmission Lines in Nebraska• EPRI High Voltage/High Current and
Environmental Chamber in Lenox, MA• EPRI High Current, High Temperature
facilities in Haslet, TX
43
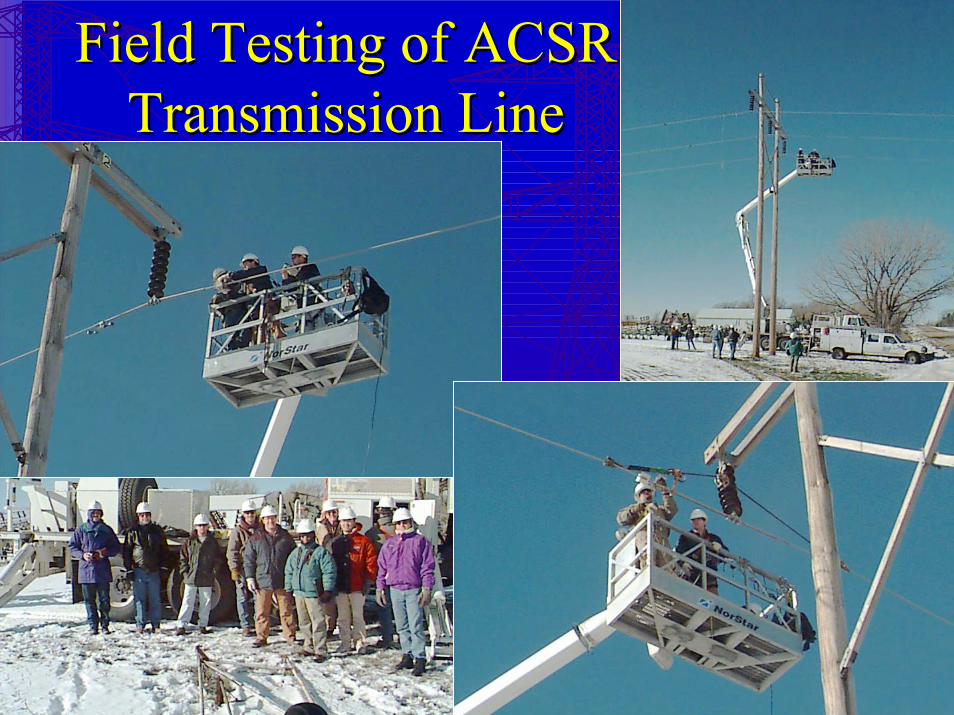
Field Testing of ACSR Field Testing of ACSR Transmission LineTransmission Line

44

45
ConclusionsConclusions
• A portable, non-invasive, and intelligent sensor system for integrity assessment of transmission lines and other conductors has been developed.
• This system can be used on energized lines.• This monitoring system has passed high
voltage, high current, and temperature performance tests at EPRI facilities.
• Prototypes are being made for beta testing at utility facilities.

46
Thank YouThank You

47
Questions?Questions?